Cytonn Monthly - October 2017
By Cytonn Research Team, Nov 5, 2017
Executive Summary
Fixed Income
During the month of October yields on T-bills remained relatively flat, with yield on the 91-day paper declining to 8.0% from 8.1% at the end of September, yield on the 182-day paper increasing to 10.4% from 10.3%, and that of the 364-day paper remaining unchanged at 11.0%. Kenya’s inflation rate for the month of October dropped to a 17-month low of 5.7% from 7.1% in September, primarily driven by drop in food prices on account of improved weather conditions;
Equities
During the month of October, the equities market was on a downward trend with NASI, NSE 20 and NSE 25 losing 0.1%, 0.6% and 1.6%, respectively, taking their YTD performance as at the end of October to 21.5%, 19.0% and 17.1% for NASI, NSE 25 and NSE 20, respectively. This week, Equity Group released Q3’2017 results, recording a 2.7% decline in core earnings per share to Kshs 3.87 from Kshs 3.98 in Q3’2016 while Safaricom Limited released H1’2018 results, recording a normalized EBITDA growth of 14.4% to Kshs 54.3 bn from Kshs 47.5 bn in H1’2017, after adjusting for a one-off item in 2016 of Kshs 3.4 bn;
Private Equity
During the month of October, we witnessed Private Equity activity through acquisitions, exits and fundraising in major sectors including manufacturing, real estate and technology, with the highlight transaction being the acquisition of an undisclosed significant stake in Kenya’s quantity surveying firm YMR by Mace, a UK-based global construction and consultancy firm;
Real Estate
During the month of October, Knight Frank released their H1’2017 Kenyan Market Update while Hass consult released their Q3’2017 report on land and house prices in the market. The reports painted reduced activity in the sector, whose performance has been mainly constrained by the extended electioneering period.
- Our Real Estate Affiliate, Cytonn Real Estate hosted an open day for The Alma, a comprehensive residential development in Ruaka. The open day included a site visit for our clients, in order to showcase the project’s progress and give our clients and prospects an opportunity to see the show-houses for each of the unit typologies. See the event note here
- Our Investment Manager, Maurice Oduor discussed the impact of election on the economic environment. Watch Maurice Oduor on Citizen TV here
- Our Investment Analyst, Caleb Mugendi discussed Kenya’s post-election business environment and the expected effect of the repeat presidential elections on the economy. Watch Caleb Mugendi on Ebru TV here
- Our Investment Analyst, John Ndua discussed the performance of Safaricom Limited after they released their H1’2018 financial results. Watch John Ndua on CNBC here
- We continue to showcase our real estate developments through weekly site visits. Watch progress videos and pictures of The Alma, Amara, The Ridge and Taraji Heights. The site visits target both investors looking to invest in real estate directly and those interested in high yield investment products to familiarize themselves with how we support our high yields. Key to note is that our cost of capital is priced off the loan markets where all-in pricing ranges from 16.0% to 21.0% and our yield on real estate developments ranges from 23.0% to 25.0%, hence our top-line gross spread is about 6%. If interested in attending the site visits, kindly register here
- We continue to see very strong interest in our Private Wealth Management training (largely covering financial planning), which is at no cost, and is held bi-weekly, but is open only to pre-screened participants. We also continue to see institutions and investment groups interested in the trainings for their teams. The Wealth Management Trainings are run by the Cytonn Foundation under its financial literacy pillar, and if interested in the training for your employees or investment group please get in touch with us through clientservices@cytonn.com or book through this link Wealth Management Training. To view the wealth management training topics click here
- For recent news about the company, see our news section here
- We have 10 investment-ready projects, offering attractive development and buyer targeted returns of around 23.0% to 25.0% p.a. See further details here: Summary of investment-ready projects
- To invest in any of our current or upcoming real estate projects, please visit Cytonn Real Estate
- Cytonn Towers, where we are only selling residential units in the first phase of residential apartments, is currently about 20.0% sold. See Cytonn Towers
- The Alma, which is 55.0% sold. See The Alma
- Amara Ridge is currently 100.0% sold. See Amara Ridge
- Situ Village is currently 22.0% sold. See Situ Village
- The Ridge (Phase 1) is currently 31.0% sold. See The Ridge
- Taraji Heights is currently 14.0% sold. See Taraji Heights
- RiverRun Estates (Phase 1) is currently 11.0% sold. See RiverRun Estates
- With over 10 investment ready projects with over Kshs 82.0 billon of project value, we shall be very selective on new real estate projects going forward, only focusing on Joint Ventures and opportunities with deep value. We are increasingly focused on private equity deals. Should you have any deals in banking, insurance, education, hospitality and technology sectors, kindly email a teaser to PE@cytonn.com
- We continue to beef up the team with ongoing hires: Careers at Cytonn . This week we commence a key search for a Financial Controller, see here
T-bills auctions recorded an undersubscription during the month of October, with the average subscription level coming in at 48.0%, compared to 105.7% recorded in September, due to tight liquidity in the market. The subscription rates for the 91, 182 and 364-day papers came in at 68.1%, 35.6% and 52.3% from 84.5%, 125.7% and 169.0% the previous month, respectively. The yield on the 91-day paper declined to 8.0% from 8.1% at the end of September, whereas the yield on the 182-day paper increased to 10.4% from 10.3%, and the yield on the 364-day paper remained unchanged at 11.0%. The T-bills acceptance rate came in at 93.5% during the month, compared to 92.1% in September, with the government accepting Kshs 53.8 bn of the Kshs 57.6 bn worth of bids received, indicating that bids were largely within ranges the CBK deemed acceptable. The government is still behind its domestic borrowing target for the current fiscal year, having borrowed Kshs 61.0 bn, against a target of Kshs 142.0 bn (assuming a pro-rated borrowing target throughout the financial year of Kshs 410.2 bn budgeted for the full financial year as per the Cabinet-approved 2017 Budget Review and Outlook Paper (“BROP”)).
For this week, T-bills were undersubscribed with the overall subscription coming in at 69.7%, compared to 34.2% recorded the previous week. Subscription rate for the 91, 182, and 364-day papers came in at 109.4%, 42.1%, and 81.4% from 12.7%, 13.7%, and 63.3%, the previous week, respectively. The drastic increase in the 91-day paper subscription rate can be attributed to the uncertainty in the market with the investors opting to keep short. Yields on the 91, 182 and 364-day T-bills remained unchanged during the week at 8.0%, 10.4%, and 11.0%, respectively.
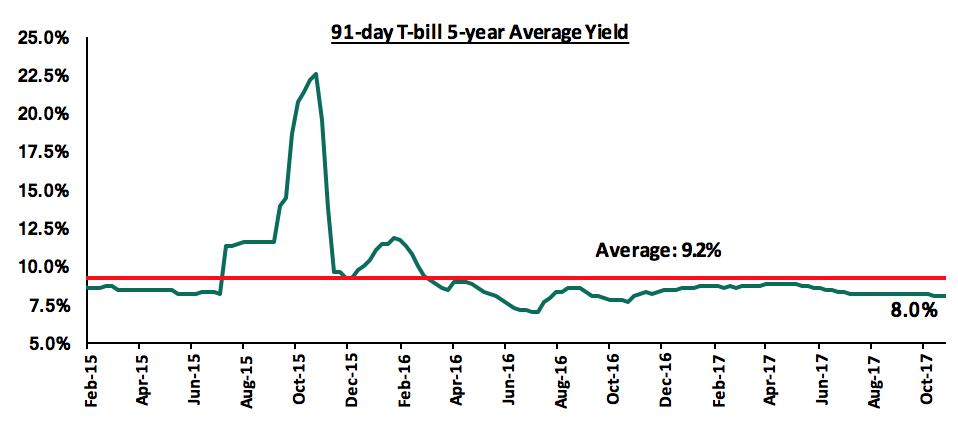
The 91-day T-bill is currently trading below its 5-year average of 9.2%. The lower yield on the 91-day paper is mainly attributable to the low interest rates environment we have been experiencing since the beginning of the year. We expect this to continue in the short-term, given the discipline of the Central Bank of Kenya (CBK) in stabilizing interest rates in the auction market by rejecting aggressive bids that are priced above market, both on T-bills and T-bonds.
During the month, the Kenyan Government issued a new 5-year bond (FXD 2/2017/5), in a bid to raise Kshs 30.0 bn for budgetary support. The bond was undersubscribed, with the overall subscription rate at 66.9%, with Kshs 20.1 bn worth of bids received compared to the Kshs 30.0 bn on offer. The average market bid rates came in at 12.6% while the average yields of the accepted bids came in at 12.5%. The acceptance rate for the bids received came in at 67.3%, which was higher than the average acceptance rate of 59.5%, from previous auctions during the year. The government accepted Kshs 13.5 bn out of the Kshs 20.1 bn worth of bids received. The government consequently issued a tap sale on the bond at the accepted weighted average yield of 12.5% to raise Kshs 16.5 bn, but received only Kshs 7.3 bn, a 44.2% subscription rate. Going forward, pressure could mount on the government, given (i) the tight liquidity levels currently being experienced in the market, (ii) the government being behind its domestic borrowing target, and (iii) the expected low revenue collections by the Kenya Revenue Authority (KRA).
During the month, the average interbank rate closed at 6.9%, compared to 8.2% at the end of September, despite tight liquidity in the market, with a net liquidity withdrawal of Kshs 16.4 bn compared to a net liquidity injection of Kshs 13.0 in September. A significant amount of the liquidity withdrawal came from Reverse Repo Maturities and Transfer of Taxes from Banks of Kshs 94.5 bn and Kshs 81.7 bn, respectively, which offset liquidity injection from Government Payments and Reverse Repo Purchases of Kshs 88.2 bn and Kshs 78.7 bn, respectively, as the CBK looked to counter the tight liquidity.
Below is a summary of the money market activity during the month:
|
all values in Kshs bn, unless stated otherwise |
|||
|
October Monthly Liquidity Position – Kenya |
|||
|
Liquidity Injection |
|
Liquidity Reduction |
|
|
Government Payments |
88.2 |
T-bonds sales |
13.5 |
|
T-bonds Redemptions |
31.3 |
Transfer from Banks - Taxes |
81.7 |
|
T-bills Redemptions |
28.7 |
T-bills (Primary issues) |
46.6 |
|
T-bonds Interest |
4.8 |
Reverse Repo Maturities |
94.5 |
|
Reverse Repo Purchases |
78.7 |
OMO Tap Sales |
11.8 |
|
Total Liquidity Injection |
231.7 |
Total Liquidity Withdrawal |
248.1 |
|
Net Liquidity Injection |
|
|
(16.4) |
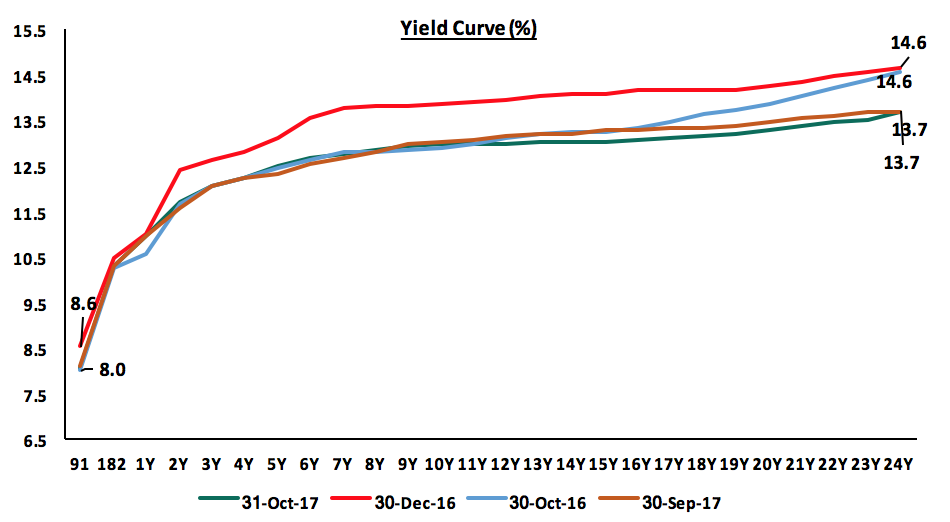
The yields on government securities in the secondary market have declined since the beginning of the year, as highlighted in the yield curve below. According to the FTSE NSE Bond Index, Treasury bonds listed at the Nairobi Securities Exchange (NSE) gained 0.9% during the month bringing the YTD performance to 12.6%.
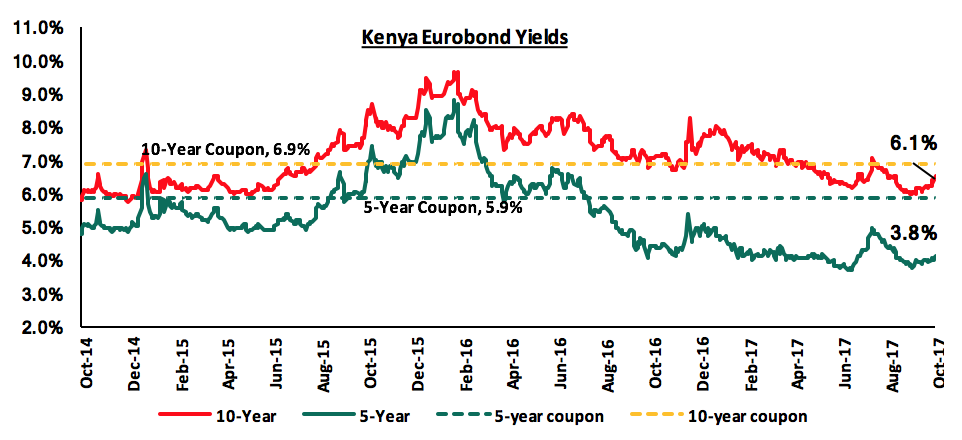
According to Bloomberg, yields on the 5-year and 10-year Eurobonds, with 1.6-years and 6.6-years to maturity, declined by 30 bps during the month, to close at 3.8% and 6.1% from 4.1% and 6.4%, respectively, at the end of September, despite the uncertainty surrounding the repeat presidential elections conducted during the month. Since the mid-January 2016 peak, yields on the Kenya Eurobonds have declined by 5.0% points and 3.6% points for the 5-year and 10-year Eurobonds, respectively, due to stable macroeconomic conditions in the country. The declining Eurobond yields and stable rating by Standard & Poor (S&P), in spite of the political uncertainty around the presidential poll re-run, are indications that Kenya’s macro-economic environment remains stable and hence an attractive investment destination. However, concerns from Moody’s around Kenya’s rising debt to GDP levels may see Kenya receive a downgraded sovereign credit rating.
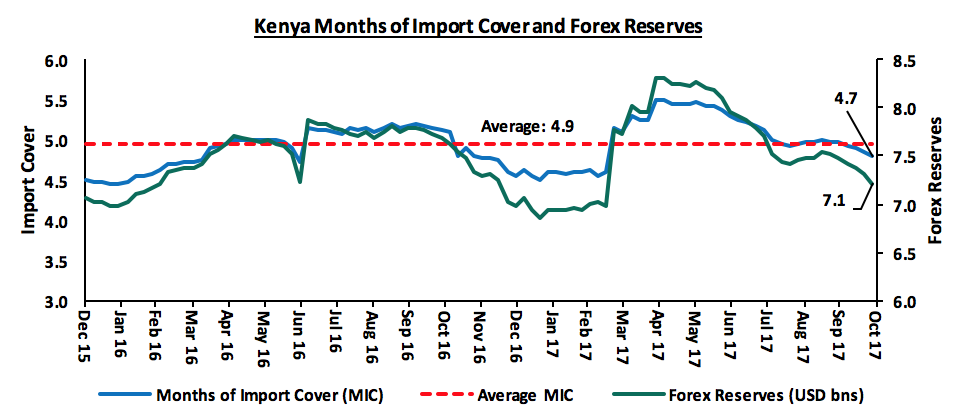
The Kenya Shilling depreciated by 0.5% against the USD during the month of October to close at Kshs 103.8, from Kshs 103.2 in September. This was primarily due to importers accumulating dollar holdings due to increased political uncertainty surrounding the presidential election held during the month. On a year to date basis, the shilling has depreciated against the dollar by 1.2%. In our view, the shilling should remain relatively stable against the dollar in the short term, supported by (i) the weakening of the USD in the global markets, and (ii) the CBK’s activity, as they have sufficient forex reserves, currently at USD 7.1 bn (equivalent to 4.7 months of import cover), as indicated in the graph below. The key factor to watch is the current account deficit that worsened to 6.2% of GDP in Q2’2017, as compared to 5.3% of GDP in a similar period last year.
The inflation rate for the month of October declined by 1.4% points to a 17-month low of 5.7%, from 7.1% in September. The decline was primarily driven by a drop in food prices, which dropped by 1.9% m/m, due to improved weather conditions in most parts of the country. This was despite, (i) a rise of 0.5% m/m in housing, water, electricity, gas and other fuels, brought about by increased cost of electricity and house rents, and (ii) an increase of 0.9% in the cost of fuel, following increased pump prices of petrol and diesel. Below is a summary of key changes on the Consumer Price Index (CPI) in October;
|
Key Changes on the Consumer Price Index (CPI) during the month of October |
||||
|
Broad Commodity Group |
Price change m/m |
Price change y/y (Oct 2015/ Oct 2016) |
Price change y/y (Oct 2016/Oct 2017) |
Reason |
|
Food & Non-Alcoholic Beverages |
(1.9%) |
11.0% |
8.5% |
This was due to fall in the cost of some food items, which was mainly attributed to favorable weather conditions |
|
Transport Cost |
0.9% |
0.4% |
3.8% |
This was on account of an increase in pump prices of petrol and diesel |
|
Housing, Water, Electricity, Gas and other Fuels |
0.5% |
(0.04%) |
3.6% |
This was mainly due to notable increases in the |
|
Overall Inflation |
(0.6%) |
6.5% |
5.7% |
The decline was mainly driven by the decrease in food & non-alcoholic beverages, which has a CPI weight of 36.0% |
On a year-to-date basis, inflation has averaged 8.7%. Going forward, we expect inflationary pressures to remain subdued given food prices are expected to stabilize on account of the ongoing rains. We expect inflationary pressure to ease in the last two months of 2017, but average 8.2% over the course of the year, which is above the upper bound of the government target range of 2.5% - 7.5%.
Following the Supreme Court’s decision that annulled the August 8th 2017 Kenyan Presidential poll, the Independent Electoral and Boundaries Commission (IEBC) organized a fresh presidential election as per the Kenyan Constitution. With all eight presidential candidates on the ballot, elections were held on 26th October. This move was met with mixed reactions across the country as voters turned up in polling stations in some parts of the country, while in other areas, protests prevailed as the opposition party held up its announcement to boycott the repeat presidential poll, citing non-implementation of reforms that were proposed to the IEBC that would ensure a free, fair and credible election. Consequently, political uncertainty continues to prevail resulting in subdued activity in the market. Uhuru Kenyatta emerged the winner of the repeat presidential election and is awaiting swearing in, should the opposition or any other party fail to challenge the election at the Supreme Court within seven days from the date of the results announcement. We maintain the view that the market should normalize after the election, as post-election fears and uncertainty dissipates, the president elect is sworn in, and the government takes charge, with the Kenya growth fundamentals remaining strong and intact.
During the month, the World Bank released the 2018 Ease of Doing Business Report, which highlighted that Kenya improved on the Ease of Doing Business Ranking, rising 12 places to position 80 from position 92 in 2017, out of 190 countries, indicating a positive impact of reforms in business regulations put in place over the last one year. Kenya ranked third in Africa, behind Mauritius and Morocco, which came in at position 25 and position 69, respectively. A summary of the ease of doing business indicators and Kenya’s ranking is as shown below;
|
Ease of Doing Business in Kenya |
||||
|
Indicators |
2008 Rank |
2017 Rank |
2018 Rank |
Direction |
|
Starting a Business |
112 |
116 |
117 |
Neutral |
|
Dealing with Construction Permits |
9 |
152 |
124 |
Positive |
|
Getting Electricity |
- |
106 |
71 |
Positive |
|
Registering Property |
114 |
121 |
125 |
Neutral |
|
Getting Credit |
13 |
32 |
29 |
Neutral |
|
Protecting Minority Investors |
83 |
87 |
62 |
Positive |
|
Paying Taxes |
154 |
125 |
92 |
Positive |
|
Trading Across Borders |
148 |
105 |
106 |
Neutral |
|
Enforcing Contracts |
107 |
87 |
90 |
Neutral |
|
Resolving Insolvency |
76 |
92 |
95 |
Neutral |
|
Overall |
72 |
92 |
80 |
|
|
*Neutral if the rise or drop in position is not more than 5 places, else positive or negative, respectively |
||||
As seen from the table above, Kenya has improved its overall ranking from last year; however, the country still has a lot to do in order to reclaim its 2008 position. Four areas stand out as needing significant improvement: starting a business, construction permitting, property registration and cross boarder trading. Improvement in these areas will require a clear plan, especially around real estate, which seems to have significant bureaucratic inefficiencies.
Given the change in the operating environment that we have witnessed so far in 2017, we carried out an analysis on the seven indicators of interest rates that we track in order to re-evaluate our view. The table below highlights the different economic drivers, and their effects on interest rates:
|
Macro-Economic Indicators |
Expectations at the Start of the Year |
2017 YTD Experience |
Going Forward |
Effect on Interest Rates (June 2017) |
Effect on Interest Rates (October 2017) |
|
Government Borrowing |
The government will have to borrow Kshs 126.9 bn locally on a monthly basis to meet both its domestic borrowing target of Kshs 410.2 bn and maturity obligations worth Kshs 688.3 bn |
Government has been behind its target on its domestic borrowing schedule since the fiscal year 2017/18 begun, currently having borrowed Kshs 61.0 bn against a pro-rated target of Kshs 140 bn |
Following the enactment of the Banking (Amendment) Act, 2016, we expect that banks will have a preference lending to the government hence we do not expect pressure on domestic borrowing going forward. However, the government having borrowed only 6.8% of their foreign borrowing target remains a concern |
Neutral |
Neutral |
|
Revenue Collection |
KRA would miss their revenue collection target for 2016/2017 FY |
The KRA missed their collection target for the 2016/2017 FY having collected Kshs 1.4 tn against a target of Kshs 1.5 tn. The 2017/2018 FY target was set at Kshs 1.7 tn |
We expect the government to miss their revenue collections target due to (i) expected depressed corporate earnings due to the interest rate cap eating into banking sector earnings, and (ii) economic slowdown amid extended political uncertainty |
Negative |
Negative |
|
Monetary Policy |
Upward pressure on interest rates in 2017 |
(i) CBR has been maintained at 10.0% throughout 2017 (ii) The 91 Day T-Bill hit 8.0% from 8.8% recorded at the end of January 2017 |
We expect the Monetary Policy Committee to maintain the CBR while monitoring keenly inflation and currency movements |
Neutral |
Neutral |
|
Inflation |
Expected to average above the 2.5% - 7.5% government target |
Inflation declined to 5.7% in October from 7.1% in September, on account of improved weather conditions. The inflation rate hit a high of 11.7 % in May, driven by an increase in basic food prices, and was at 7.0% in January. The YTD average inflation rate is 8.7%, compared to 6.3% in the same period last year |
We expect the inflation rate to stabilize going forward due to falling food prices, but average above the 7.5% upper bound government target in 2017 since YTD average is at 8.7%; driven by expected increases in international oil prices affecting the local cost of transport |
Neutral |
Neutral |
|
Exchange Rates |
Shilling to depreciate against major currencies |
The shilling has depreciated by 1.2% against the dollar YTD, having remained relatively stable for the better part of the year, with volatility only witnessed during the election period following the August 8th election and the repeat presidential poll on 26th October. Volatility was mainly driven by speculation in the forex market and demand from oil importers |
We expect the currency to remain relatively stable against the dollar due to a weaker USD in the global markets and It is also important to note that the CBK has sufficient reserves (USD 7.1 bn - equivalent to 4.7 months of import cover) to support the shilling in the short term. However, a worsening current account deficit, which worsened to 6.2% of GDP in Q2’2017, as compared to 5.3% of GDP in a similar period last year, may have a negative effect. |
Negative |
Neutral |
|
Investor Sentiments |
Foreign investors to demand higher premiums due to political risks posed by elections and economic risk due to the planned rate hikes by the US Fed |
Investor sentiment has been high, with foreign investors entering the market in search of attractive valuations, amid a relatively peaceful election period. However, Foreign investors were net sellers in Q3’2017 with net outflow of USD 106.3 mn compared to net inflows of USD 57.5mn recorded in Q3’2016. |
Political and economic risks on frontier markets still remains a risk and foreign investors are still adopting a “wait-and-see” approach due to this. However, we expect long term investors to enter the market seeking to take advantage of the attractive valuations |
Neutral |
Neutral |
|
Politics and Security |
Expect the government to put initiatives in place to ensure improved security. However, the 2017 election remains a challenge |
In January, the U.S. Department of State issued a travel warning regarding threats by Al-Shabaab on the Somalia border, coastal and northeastern counties. In March, the U.K government issued a warning due to security concerns in parts of Laikipia County. As the election date approached, security was beefed up across the country |
Security has been tight during and after the election period, despite reports of protests that turned violent in some parts of the country following the repeat presidential poll on October 26th, with the government expected to keep this in check. Security is still expected to be tight as political uncertainty continues to prevail. |
Neutral |
Neutral |
Fixed Income Conclusion:
Of the 7 indicators of direction of interest rates, 1 has improved (Exchange Rate has changed from negative to neutral) since our last review in June, while the other 6 have remained unchanged. 6 of the 7 indicators are neutral pointing towards a stable outlook, hence our view that investors should be biased towards short-to medium term fixed income instruments to reduce duration risk. Rates in the fixed income market have remained stable, and we expect this to continue in the short-term. However, a budget deficit that is likely to result from depressed revenue collection creates uncertainty in the interest rates environment as any additional borrowing in the domestic market to plug the deficit could lead to upward pressures on interest rates.
During the month of October, the equities market was on a downward trend with NASI, NSE 20 and NSE 25 losing 0.1%, 0.6% and 1.6%, respectively, taking their YTD performance as at the end of October to 21.5%, 19.0% and 17.1% for NASI, NSE 25 and NSE 20, respectively. The equities market performance during the month was attributable to losses in large caps, led by KCB Group, Coop Bank and DTBK, which lost 7.3%, 6.5% and 3.2%, respectively. For this week, the equities market was on an upward trend with NSE 20, NSE 25 and NASI gaining 4.2%, 3.8% and 2.9%, respectively, taking their YTD performance to 23.4%, 21.9% and 19.3% for NASI, NSE 25 and NSE 20, respectively. The performance during the week was driven by gains in large caps such as Equity Group, Barclays Bank and KCB Group, which gained 11.0%, 10.9% and 7.8%, respectively. Since the February 2015 peak, the market has lost 7.5% and 30.9% for NASI and NSE 20, respectively.
Equities turnover declined by 36.0% during the month to USD 90.7 mn from USD 141.7 mn in September 2017, taking the YTD turnover to USD 1,399.2 mn. Foreign investors turned net buyers for this month with net inflows of USD 7.2 mn, compared to net outflows of USD 50.9 mn witnessed in September 2017. Year to date, foreign investors are net sellers with net outflows of USD 104.1 mn. We expect the market to record subdued activity over the coming few weeks as market players remain cautious of the political uncertainty in the country. Despite this, we expect the market to remain supported by improved investor sentiment once fear and uncertainty dissipates, as investors take advantage of the attractive stock valuations.
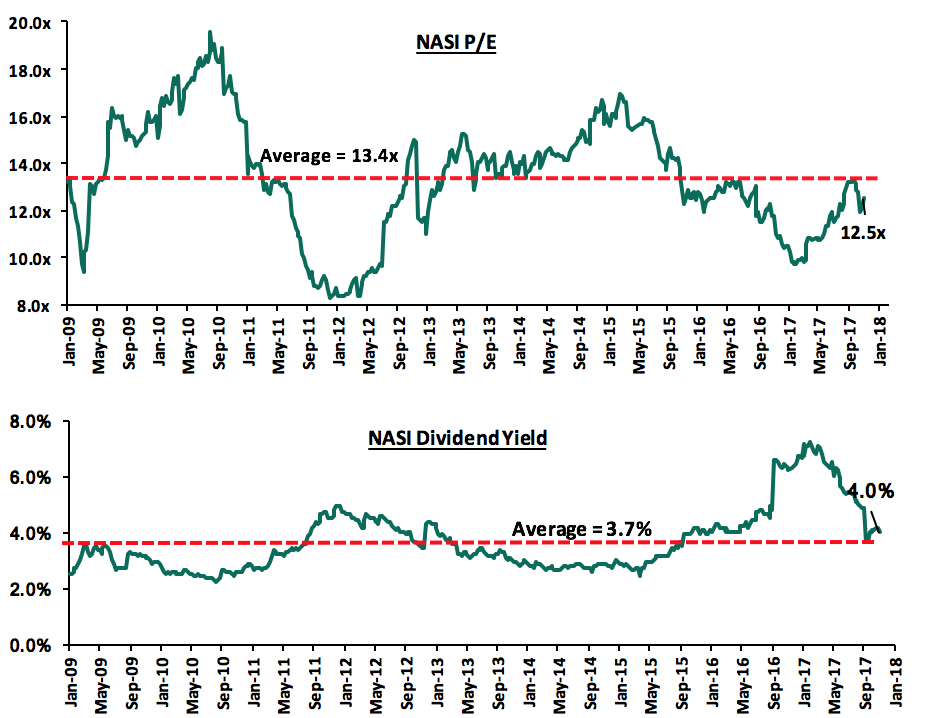
The market is currently trading at a price to earnings ratio (P/E) of 12.5x, versus a historical average of 13.4x, and a dividend yield of 4.0%, compared to a historical average of 3.7%. Despite the valuations nearing the historical average, we believe there still exist pockets of value in the market, with the current P/E valuation being 26.3% below the most recent peak in February 2015. The current P/E valuation of 12.5x is 28.7% above the most recent trough valuation of 9.7x experienced in the first week of February 2017, and 50.2% above the previous trough valuation of 8.3x experienced in December 2011. The charts below indicate the historical P/E and dividend yields of the market.
During the month, Moody’s, a global ratings agency placed KCB Bank, Equity Bank and Co-op Bank under review for a possible downgrade of their ‘B1’ global scale long-term local currency deposit ratings and ‘b1’ baseline credit assessment (BCA). This rating action was driven by the agency’s view of a potential weakening of the Kenyan Government’s credit profile as captured by its decision to place Kenya’s ‘B1’ Government ratings on review for downgrade. Ratings as highlighted in our Cytonn Weekly #40/2017 are essential for a well-functioning market as they facilitate best pricing and timing of public offerings, as companies with good ratings get public recognition thus can easily attract investors.
The Attorney General published the Companies (General) (Amendment) Regulations, 2017. The regulations which are effective from August 28, 2017 are set to increase transparency among listed firms in a move towards further improving corporate governance. Below is a summary of the regulations:
- Quoted companies shall be required to prepare directors’ remuneration report, which shall be included in the annual financial statement for the relevant financial year summarizing the major decisions on directors’ remuneration,
- In addition, companies will be required to explain any significant changes to shares or long-term investment schemes awarded to directors, as well as offer detailed accounts as to why directors have been granted remuneration options that are not tied to performance,
- The rules further require directors to publish in the financial report the justification for their remuneration, detailing the salaries and fees earned during the year as well as other benefits such as bonuses, pension and gratuity,
- The new rules require companies to disclose the number of shares accruing to each director, when they were awarded, as well as those exercised and those that have since expired before being exercised, and
- In addition, they will also have to prepare a detailed account of how directors have performed in order to qualify for share options or other long-term investment schemes.
Under these new rules, shareholders will have the power to approve directors’ pay, a move that may see boards of loss-making companies take a pay cut to match the dwindling earnings of the firms they lead. As highlighted in our Cytonn Weekly #30/2017, this move is beneficial to investors since it will ensure information symmetry amongst shareholders, and is expected to result in greater disclosure, which is key to investors for decision-making thus boosting investor confidence.
During the week, we had a number of earnings releases. Below is the detailed analysis of the earnings’ releases:
Equity Group released Q3’2017 results
Equity Group released Q3’2017 results, recording a 2.7% decline in core earnings per share to Kshs 3.87 from Kshs 3.98 in Q3’2016, driven by a 0.3% decline in total operating revenue, and a 2.2% increase in operating expenses. Key highlights for the performance from Q3’2016 to Q3’2017 include:
- Total operating revenue dipped slightly by 0.3% to Kshs 48.7 bn from Kshs 48.9 bn in Q3'2016. The stable performance was supported by a 28.3% growth in Non-Funded income to Kshs 21.3 bn from Kshs 16.6 bn in Q3'2016, despite a 15.0% decline in Net Interest Income(NII),
- Interest Income declined by 12.4% to Kshs 35.4 bn from Kshs 39.8 bn in Q3’2016 attributed to a 26.4% decline in income from loans and advances to Kshs 25.0 bn from Kshs 34.0 bn. Interest expense increased by 5.9% to Kshs 7.9 bn from Kshs 7.5 bn in Q3’2016, leading to a 15.0% drop in the Net Interest Income to Kshs 27.5 bn from Kshs 32.3 bn. The Net Interest Margin thus declined to 9.4% from 11.0% in Q3'2016,
- Non-Funded Income (NFI) recorded a growth of 28.3% to Kshs 21.3 bn from Kshs 16.6 bn in Q3'2016. The growth in NFI was driven by an increase in total fees and commissions on loans that rose by 47.8% to Kshs 4.3 bn from Kshs 2.9 bn in Q3’2016, a 16.7% increase in other fees and commissions to Kshs 9.6 bn from Kshs 8.3 bn in Q3’2016, and a 5.3% increase in foreign exchange trading income to Kshs 2.6 bn from Kshs 2.4 bn. The current revenue mix stands at 56:44 funded to non-funded income from 66:34 in Q3’2016,
- The 47.8% increase in total fees and commissions on loans, despite a 2.2% contraction in the value of total loans issued, is attributed to increase in fees charged on loans by banks following the operationalization of Banking (Amendment) Act, 2016, which resulted into compressed Net Interest Margins. This increase in fees charged on loans, does not entirely cushion the bank from the effect of interest rate caps. Assuming the increased amount in fees charged on loans was to be added to the bank’s Net Interest Income, the Net Interest Margin would only improve slightly to 9.5% from the current 9.4%,
- The 16.7% increase in other fees and commissions was driven by a growth in commissions from alternative banking channels including digital platforms and agency banking. The value of transactions made through these alternative channels increased by 50.0% to Kshs 934.0 bn from Kshs 622.6 bn in Q3’2016,
- Total operating expenses increased by 2.2% to Kshs 28.0 bn from Kshs 27.4 bn, driven by other expenses, which increased by 16.3% to Kshs 11.9 bn from Kshs 10.3 bn in Q3'2016. This was despite a decline in staff costs, which declined by 10.7% to Kshs 7.8 bn from Kshs 8.7 bn in Q3'2016 attributed to a shift in channels of delivery, to automated options. Loan Loss Provisions (LLP), also declined by 13.2% to Kshs 2.8 bn from Kshs 3.3 bn,
- The Cost to Income ratio deteriorated to 57.5% from 56.0% in Q3'2016 following a 2.2% increase in total operating expenses coupled with a 0.3% decline total operating income. Without LLP, the Cost to Income ratio worsened to 51.6% from 49.2% in Q3'2016
- Profit before tax decreased by 3.6% to Kshs 20.7 bn from Kshs 21.5 bn, while profit after tax decreased by 2.7% to Kshs 14.6 bn from Kshs 15.0 bn in Q3’2016.
- The balance sheet recorded an expansion in Q3’2017, with total assets increasing by 10.7% to Kshs 518.3 bn from Kshs 468.0 bn in Q3'2016. This growth was driven by a 37.2% increase in investment in government and other securities to Kshs 127.5 bn from Kshs 93.1 bn in Q3'2016. Loan book, which is 51.2% of the total assets book, contracted by 2.2% to Kshs 265.4 bn from Kshs 271.4 bn in Q3’2016 leading to the 10.7% growth despite the significant growth in investment in government securities. The value of property and equipment declined by 7.2%, attributed to the closure of 8 of its 13 branches in South Sudan,
- Total liabilities rose by 10.9% to Kshs 428.1 bn from Kshs 386.4 bn in Q3'2016, driven by an 11.3% increase in deposits to Kshs 368.8 bn from Kshs 331.3 bn in Q3'2016. Shareholders’ funds increased by 10.5% to Kshs 90.1 bn from Kshs 81.6 bn in Q3’2016,
- The increase in deposits coupled with a decline in the loan book led to a decline in the loan to deposit ratio to 72.8% from 81.9% in Q3'2016, indicating shift in funds allocation from loans to other less risky assets like government securities following the enactment of the law on loan pricing framework,
Going forward, Equity Group Holdings is leveraging on its heavy investment in technology to boost its growth and increase its profitability by reducing its operating costs. By Q3'2017, 91.1% of the bank's transactions were handled through alternative channels such as mobile, internet, merchant and agency banking with the remaining 8.9% being ATMs and Branch transactions. In our view, the investment on digital platforms made by the bank over the last 5 years should enable the bank achieve the much needed efficiency in this era of compressed NIMs and hence supporting the profitability going forward.
For a more comprehensive analysis, see our Equity Group Q3’2017 Earnings Note.
Safaricom Limited released H1’2018 results
Safaricom Limited released H1’2018 results, recording a normalized EBITDA growth of 14.4% to Kshs 54.3 bn from Kshs 47.5 bn in H1’2017, after adjusting for a one-off item in 2016 of Kshs 3.4 bn. Core earnings per share grew by 9.0% to Kshs 0.65 from Kshs 0.6 in H1’2017. Adjusting for the one off item in 2016, core earnings per share grew by 21.4% to Kshs 0.65 from Kshs 0.54 in H1’2017. The earnings growth was supported by a 12.0% growth in service revenue (M-PESA, messaging, mobile data, fixed service) to Kshs 109.7 bn from Kshs 98.0 bn in H1’2017 due to growth in active users and increased usage of non-voice services. Key highlights for the half year performance include:
- Voice revenue grew by 3.6% to Kshs 47.4 bn from Kshs 45.7 bn in H1’2017, while messaging revenue grew by 3.4% y/y to Kshs 8.9 bn from Kshs 8.6 bn. This growth was supported by a 10.8% y/y growth in the number of total customers to 29.5 mn from 26.6 mn in H1’2017. However, the voice monthly average revenue per user (ARPU), declined by 7.8% to Kshs 271.2 per user from Kshs 294.0 per user, indicating that the traditional revenue streams are not benefitting as much from the increasing customer base. Voice revenue now accounts for 43.2% of service revenue, down from 46.6% in H1’2017;
- M-Pesa revenue rose 16.2% to Kshs 30.1 bn from Kshs 25.9 bn in H1’2017. This was supported by the 12.1% growth in registered M- Pesa customers to 27.8 mn, and an increase in activity as measured by users who were active in the last 30 days by 9.5% to 19.3 mn from 17.6 mn. M-Pesa currently accounts for 27.4% of total revenue, a slight improvement from 26.4% in H1’2017. The cashless platform, Lipa na M-Pesa, continues to be adopted by firms and currently has over 70,000 merchants on a 30-day active basis;
- Mobile data revenue grew by 31.0% y/y to Kshs 17.6 bn from Kshs 13.4 bn, driven by a 13.5% increase in 30-day active mobile data customers to 17.0 mn from 14.9 mn in H1’2017 and increased smartphone penetration. Currently there are over 90,000 homes and 1,670 commercial buildings with FTTH network, further driving the growth in data usage;
- Fixed service revenue grew by 34.7% to Kshs 3.2 bn from Kshs 2.4 bn driven by a 24.9% growth in 30-day active fixed service customers to 14.1 mn from 11.3 mn;
- Return on Average Assets improved to 26.0% in H1’2018 from 24.2% in H1’2017 while Return on Average Equity increased to 57.1% in H1’2018 from 51.2% in H1’2017;
- The Board of Directors did not recommend payment of an interim dividend.
Safaricom’s strategy going forward will be driven by:
- Investing in their network to enhance capacity, coverage and quality, including the rolling out of 4G network to additional sites in 40 out of 47 counties
- Improving customer experience by investing in additional call centres. Safaricom has started the creation of additional 300 customer care jobs and opening a new centre in Eldoret
- Increased localization as the company subdivides the business into regions each with its own head to provide tailor- made regional promotions and offers with the strategy being driven forward by the new Regional Operations division
For a more comprehensive analysis, see our Safaricom Limited H1’2018 Earnings Note.
Below is our Equities Universe of Coverage:
|
all prices in Kshs unless stated otherwise |
|||||||||||||
|
No. |
Company |
Price as at 29/09/17 |
Price as at 31/10/17 |
m/m Change |
YTD Change |
Target Price* |
Dividend Yield |
Upside/ (Downside)** |
|||||
|
1. |
NIC*** |
38.5 |
37.5 |
(2.6%) |
44.2% |
58.2 |
3.4% |
58.6% |
|||||
|
2. |
KCB Group*** |
41.0 |
38.0 |
(7.3%) |
32.2% |
57.1 |
5.5% |
55.7% |
|||||
|
3. |
Barclays |
10.1 |
10.0 |
(1.5%) |
17.3% |
12.5 |
11.1% |
36.7% |
|||||
|
4. |
Liberty |
13.0 |
12.2 |
(6.5%) |
(8.0%) |
16.4 |
0.0% |
35.0% |
|||||
|
5. |
DTBK |
185.0 |
179.0 |
(3.2%) |
51.7% |
234.1 |
1.4% |
32.2% |
|||||
|
6. |
Jubilee Insurance |
475.0 |
445.0 |
(6.3%) |
(9.2%) |
575.4 |
1.8% |
31.1% |
|||||
|
7. |
HF Group*** |
10.5 |
11.4 |
8.6% |
(18.9%) |
14.2 |
2.1% |
27.2% |
|||||
|
8. |
Kenya Re |
20.0 |
20.0 |
0.0% |
(11.1%) |
24.4 |
3.8% |
25.8% |
|||||
|
9. |
I&M Holdings |
130.0 |
124.0 |
(4.6%) |
37.8% |
149.6 |
2.4% |
23.1% |
|||||
|
10. |
Sanlam Kenya |
28.0 |
27.0 |
(3.6%) |
(1.8%) |
31.4 |
1.1% |
17.3% |
|||||
|
11. |
Co-op Bank |
17.1 |
16.0 |
(6.5%) |
20.8% |
17.5 |
5.7% |
15.5% |
|||||
|
12. |
Equity Group |
38.8 |
38.0 |
(1.9%) |
26.7% |
40.5 |
5.5% |
12.1% |
|||||
|
13. |
CIC Group |
5.4 |
5.9 |
10.3% |
55.3% |
6.2 |
2.0% |
7.1% |
|||||
|
14. |
Britam |
15.0 |
14.5 |
(3.3%) |
45.0% |
15.2 |
1.7% |
6.5% |
|||||
|
15. |
Stanbic Holdings |
79.0 |
79.5 |
0.6% |
12.8% |
79.1 |
5.2% |
4.7% |
|||||
|
16. |
Standard Chartered |
231.0 |
220.0 |
(4.8%) |
16.4% |
199.8 |
4.8% |
(4.4%) |
|||||
|
17. |
NBK |
9.9 |
9.8 |
(0.5%) |
36.1% |
5.2 |
0.0% |
(47.1%) |
|||||
|
*Target Price as per Cytonn Analyst estimates |
|||||||||||||
|
**Upside / (Downside) is adjusted for Dividend Yield |
|||||||||||||
|
***Banks in which Cytonn and/or its affiliates holds a stake |
|||||||||||||
|
We have placed Safaricom Limited under review as we update the valuation following release of its H1’2018 results |
|||||||||||||
|
For full disclosure, Cytonn and/or its affiliates holds a significant stake in KCB Group and NIC Bank, ranking as the 5th largest local institutional investor and the 9th largest shareholder, respectively |
|||||||||||||
Equities Asset Class Review
The table below summarizes the various equities market indicators, the outlook for the remaining part of 2017, and our expectations going forward:
|
Equities Market Indicators |
Outlook |
Current View |
|
Macro-economic Environment |
|
Neutral |
|
Corporate Earnings Growth and Valuations |
|
Neutral with a bias to Positive |
|
Investor Sentiment and Security |
|
Neutral |
We therefore maintain a “NEUTRAL” recommendation on equities for investors with short-term investment horizon since, despite the lower earnings growth prospects for this year, the market has rallied and brought the market P/E closer to its’ historical average. Pockets of value exist, with a number of undervalued sectors like Financial Services, which provide an attractive entry point for long term investors and thus we are positive for investors with a long term investment horizon.
On Acquisitions
Mace, a UK-based global construction and consultancy firm, acquired an undisclosed significant stake in Kenya’s quantity surveying firm YMR. YMR which has worked on projects such as Two Rivers, Garden City and the Hub Karen, is headquartered in Kenya and has operations in Uganda, Tanzania, Rwanda, Burundi, Sudan, Ethiopia, Mauritius, Djibouti and Seychelles. The acquisition will see the business operate under the brand name MaceYMR. The acquisition is beneficial to both firms as (i) it will see Mace improve its regional presence, which is part of its strategic plan, having acquired a stake in MMQS, a South African quantity surveying firm, in 2016, creating MMQSMace, and (ii) YMR will leverage on Mace’s global network, sector knowledge and experience, to improve on its service offerings and presence in the region. For more information see our Cytonn Weekly #43/2017
The continued acquisitions highlight foreign investor interest in Africa driven by strong economic growth fundamentals in Sub Saharan Africa.
On Exits
Quantum Global, the Africa-focused private equity and infrastructure investment manager, exited its investment in Saruji, the majority shareholder in Savannah Cement after the sale of its stake in the company to an undisclosed shareholder. Saruji owns 60.0% of Savannah Cement while the remaining 40.0% stake is owned by Savannah Heights. Quantum, through its USD 1.1 bn Infrastructure Fund, invested in Saruji in 2015 through the acquisition of a 49.0% stake in the firm, which still owned 60.0% of Savannah Cement then. The investment by Quantum global supported the development of Savannah Cement’s USD 0.1 bn clinker plant and the firm’s investment into green technology. For more information see our Cytonn Weekly #43/2017
The successful exit affirms our view of positive performance of private equity as an asset class in the region, indicated by the increasing number of exits. In 2016 only, Africa recorded 48 exits, a 9.1% increase from the 44 exits achieved in 2015
On the Fundraising Front
New York based technology firm, Andela, raised USD 39.7 mn (Kshs 4.1 bn) from DBL Partners, Amplo, Salesforce Ventures, Africa-focused TLcom Capital and existing investors (Google Ventures and Spark Capital) to fund technology firms in Kenya, Nigeria and Uganda. This brings the Andela Africa-based start-up’s funding to over USD 78.4 mn (Kshs 8.1 bn). Just this year, several tech backed businesses have received funding from both local and international investors, including: (i) Bamba Group, a company providing SMS based solutions and data collection software for companies, raised USD 1.1 mn, (ii) BitPesa, a Kenyan digital currency payment platform closed a USD 2.5 mn funding round, (iii) Mobile credit firm, Tala, raised more than USD 30.0 mn, (iv) Kenya’s Twiga Foods Ltd, a mobile based food supply platform raised USD 12.78 mn (Kshs 1.3 bn), and (v) Shortlist, a Kenyan-based employment tech start-up, received Kshs 103.0 mn seed funding in both equity and debt. We remain positive about investment in technology and tech-backed businesses, as the Sub-Saharan African region continues to witness increased integration of technology in businesses as well as increased automation of business processes by SMEs. For more information see our Cytonn Weekly #41/2017
M-KOPA Solar, an off-grid solar provider with operations in Kenya, Uganda and Tanzania, has received USD 80.0 mn (Kshs 8.3 bn) funding in form of debt. The funding was contributed by 7 lenders including, (i) Stanbic Bank who committed USD 9.0 mn, (ii) CDC Group, the UK’s Development Finance Institution, who earlier this year backed the firm with USD 12.0 mn of equity, will also contribute USD 20.0 mn, (ii) FMO, the Dutch Development Bank and Norfund, Norway’s Development Finance Institution, who have committed USD 13.0 mn each, and an additional USD 25.0 mn from responsAbility, Symbiotics and Triodos Investment Management. The firm, which makes solar home systems affordable to low-income households on a pay-as-you-go installment plan, will utilize the funding to support ongoing expansion plans for the firm, targeting to install 1 million pay-as-you-go solar systems over the next three years. For more information see our Cytonn Weekly #42/2017
The successful fundraising activity by Private Equity firms indicates a positive outlook by investors in the Sub-Saharan Africa private equity space, motivated by the continued growth in the sector.
Private equity investments in Africa remains robust as evidenced by the increased deal flow in a number of sectors that support growth in the Continent. The increasing investor interest is attributed to (i) rapid urbanization, a resilient and adapting middle class and increased consumerism, (ii) the attractive valuations in Sub Saharan Africa’s private markets compared to its public markets, (iii) the attractive valuations in Sub Saharan Africa’s markets compared to global markets, and (iv) better economic projections in Sub Sahara Africa compared to global markets. We remain bullish on PE as an asset class in Sub-Sahara Africa. Going forward, the increasing investor interest and stable macro-economic environment will continue to boost deal flow into African markets.
As has been the case since Q2’2017, the real estate sector’s performance has been constrained by the extended electioneering period among other factors with several reports indicating softening in performance.
Knight Frank released their H1’2017 reports whose key highlights were;
- In H1’2017 the residential sector recorded a 2.75% reduction in rental rates, compared to a 4.36% decrease in the same period H1’2016 with prime residential prices growth rates softening by 0.9% in H1’2017, compared to 1.3% increase in growth rates in the same period last year. The decline is attributed to an oversupply in some market segments giving tenants and buyers a negotiating leverage over their landlords
- In the retail sector, there was stagnation in rental rates, which averaged at USD 55 per SQM per month with an average service charge of Kshs 430-600 per SQM per month. The stagnation in rents is as a result of increased supply of retail space in the market. As per our research, retail space in Nairobi increased by 41.6% to 5.6 mn SQFT from 3.9 mn SQFT in 2016;
- In the commercial office sector, prime rents stabilized at USD 1.4 per SQM per month in H1’ 2017. Nonetheless, downward pressure on rentals is expected in future as a result of downsizing of multinationals that take up Grade A office space and an oversupply of space in some nodes such as Upperhill; and
- The hospitality sector is expected to experience continued growth following increased investment in the sector with Funds such as French based Proparco that injected USD 20.0 mn debt in TPS Serena to facilitate the hotel group’s expansion with an upgrade worth Kshs 2.2 bn expected to be complete by April 2018.
In our view, the reduced transaction volumes are as a result of the electioneering period and the oversupply in some market segments with other factors such as credit constraints straining the market. However, we expect the market to pick up following the conclusion of the repeat presidential election
The Kenya National Bureau of Statistics released their Leading Economic Indicators Report, for the period up to August 2017, which had the following key highlights were:
- Between January and July, the value of building approvals in Nairobi declined by 18.4% to Kshs 149.5 bn from Kshs 183.2 bn in the same period in 2016;
- The value of commercial approvals declined by 15.1% to Kshs 61.0 bn in 2017 from Kshs 76.1 bn in 2016
- The value of residential approvals declined by 17.4% to Kshs 88.5 bn in 2017 from Kshs 107.2bn in 2016.
In our view the decline was as a result of (i) The enactment of the Banking Amendment Act 2015 that led to the reduction of credit advancement to the private sector; credit growth stood at 25.8% in June 2014, declined to 5.4% in August 2016, and then to 1.6% in August 2017, and (ii) the wait and see attitude developed by investors due to the electioneering period.
During the month, the performance and activities of the various themes is as below:
Residential
During the month, the government, through the State Department of Housing and Urban Development unveiled the Building Research Centre. This was in a bid to address the current housing shortage, which as per the World Bank Report, Kenya Economic Update 2017, stands at 2.0 mn housing units with 61.0% of urban dwellers living in slums. The research centre will bring together both private practitioners and housing sector stakeholders in joint efforts to address the shortage. In our view, the centre is an important step towards addressing the housing shortage and will enhance consultations among the stakeholders, enabling innovation and solution-oriented policies against factors that have been hindering the success of provision of low cost housing in the region such as alternative building technology to hasten development, cost effective building materials and training of construction technical capacity.
In tandem with this, the State Department of Housing and Urban Development also reached out to private contractors to partner in the construction of 8,000 houses on a pilot scheme on 55-acres of land in Mavoko, Machakos County. With an estimated cost of Kshs 21.0 bn. The partnership involves contractor designing, procuring, construction, commissioning and handing the houses over to the buyers with the government providing land. In our view, this is a positive step towards reducing the housing deficit that grows by 200,000 p.a.
Bucking the trend being witnessed among real estate developers, Mortgage Finance provider, Housing Finance launched Phase 2 of their Komarock Heights Estate, which is set to cost Kshs 3.3 bn. The estate will consist of 480 1, 2 and 3-bedroom units selling at Kshs 3.0 mn, Kshs 4.9 mn and Kshs 5.9 mn, respectively. Komarock had returns to investors of 8.0% and 12.7% for detached and apartment units, respectively, against a market average of 9.4% for detached units and 9.5% for apartments as per the Cytonn Residential Report 2017.
We expect consistent growth in the residential sector as well as a transitioning operational landscape as developers strive to address the housing deficit on the back of an improved macroeconomic environment.
Commercial
The commercial office theme reported minimal activity as a result of the extended electioneering period. The key activity witnessed in the sector in October was the launch of 25-storey FCB Mihrab building by Mihrab Development Limited, The Arabic architecture building is located in Kilimani and is currently 50% sold out with First Community Bank as the anchor tenant. Kilimani is an attractive investment opportunity with attractive returns with rental yields of 9.3%, with average market occupancy rates at 90.5% against market averages of 9.2% and 88.9%, respectively.
We expect slowed performance of the commercial office sector due to the tough economic environment that have curtailed expansion of businesses as well as the extended electioneering period.
Retail
The retail sector recorded heightened activity with more foreign retailers announcing plans to enter the Kenyan market. South African Retail giant ShopRite Holding announced plans of making a debut in the Kenyan market. ShopRite will join other international brands operating within the country such as the French based Carrefour, South Africa based Game and Botswana based Choppies all having entered the market in the last two years. These international retailers are attracted to the Kenyan market due to;
- A robust macroeconomic growth with GDP at an average of 5.2% p.a over the past 5-years and is expected to grow at between 4.7% - 5.2% in 2017, thus increased per capita wealth;
- A rising middle class with higher purchasing power;
- A high formal retail penetration rate ranging between 25% and 30% making Kenya the largest retail economy after South Africa which has a 60% penetration according to the Nielsen Q’2 2017 Consumer Confidence and Spending Intentions Survey.
Other key highlights in the retail sector include:
- Naivas announced plans to start an outlet at Bank House located within Nairobi’s Central Business District. This is in addition to its plans to open other branches in Utawala, Mountain View along Waiyaki Way, Kitengela, Kericho and Mombasa. The retailer continues to remain bullish on market performance evidenced by its expansion strategy the despite the tough operating environment characterized by increased competition and low bank credit accessibility,
- Next Gen Mall, located along Mombasa Road, announced that a new anchor tenant - Souk Bazaar- will take the 60,000 SQFT space vacated by Nakumatt. The new anchor tenant, currently on a 20-year lease is set to open its doors to shoppers in the month. The retail outlet is owned by the developer of Nextgen Mall, and
- At a planned cost of Kshs 2.99 bn, Choppies is set to open 40 new stores across Africa by venturing into Namibia and building on its current portfolio in Kenya, Tanzania, South Africa and Zambia. The Botswanan retailer currently has 10 stores in Kenya and is set to be the anchor tenant in the soon to be opened Kiambu malls and Southfield located in Kiambu Town and Embakasi, respectively.
In our view, the retail sector is set for a paradigm shift following the recent crisis faced by anchor tenants such as Nakumatt. We expect malls to shift focus from supermarkets as the anchor tenants to other retail outlets such as fast food stores that also attract high foot fall.
Hospitality
In the hospitality sector, the following were the main activities witnessed in the month of October:
- South Africa’s hospitality group, City Lodge, announced plans to open a 171-room hotel in Two Rivers Mall in November 2017. The move by the hotel chain is in line with its local and regional expansion plans, where hoteliers target to venture into Eastern and Southern Africa markets. According to the PWC’s African Insights Hotels Outlook: 2017-2021, hotel revenue growth in Kenya is projected to increase by 6.2% and 8.9% in, 2018 and 2019, respectively. With the drivers to the hotel industry being: (i) Travel tourism: due to the presence of wildlife, beaches as well as scenic natural features that creates demand for hotel accommodation (ii) Improved infrastructure: that has enabled ease of access to information, online booking and payment and cashless payment systems for tourists
- The Kenyan hotel industry has depicted an upward trend according to the Leading Economic Indicators (LEI) by KNBS, August 2017 release. Visitors arriving through Jomo Kenyatta International Airport (JKIA) and Moi International Airport (MIA) increased by 12.6% to 543,154 between January and July 2017 from 482,470 during the same period in 2016. Overall, the number of visitors has increased by 32.1% between January and July 2017. In Nairobi alone, the sector’s improvement is depicted by high hotel occupancy during the same period, increasing by 17.3% points to 56.5% in July 2017 from 39.2% occupancy in January 2017, according to STR Global Hospitality Group. However, from August as a result of the cancellation of the presidential election result, the number of arrivals declined with hotels recording cancellations and thus lower occupancy rates. For instance, The Albtaros a luxury ship scheduled to voyage to Mombasa was canceled.
In our view, the hospitality sector is expected to pick up after the election period boosted by increased marketing by the Kenya Tourism Board and improved infrastructure which has facilitated online booking and cashless payment systems for tourists.
Industrial
In the industrial sector, China Wu Yi is set to complete the construction of its Industrial Research, Development, Production and Construction Material Supermarket in Athi River in March 2018 with a total space of 75,970 SQM. The development will comprise of an exhibition area, office block, service block, building material supermarket and a hotel. Tatu City, a controlled master planned development in Ruiru, Kiambu County is set to release an additional 435 acres of land for sale in its industrial park in the course of next year after selling its industrial plots at an annualized compounded growth rate of 37.5% from 2016 to date. This has seen companies such as Bidco, Chandaria industries and Unilever, among others, take up serviced plots in Tatu City industrial park for light industrial assembly, warehouse and logistic buildings. In our view, the sector is set to witness increased developmental activity with better quality warehouses being built leading to higher rents and thus high rental yields
The high uptake rates of the industrial precinct can be attributed to the lower land costs and ease of access given their prime location in Ruiru easily accessible by both the Northern and Easter Bypasses as well as Thika Road.
Land
The Hass consult Q’3 2017 report on land and house prices in the market highlighted the softening of property prices and rental rate by 1.8% and 0.3% respectively q/q this was a decline in performance as compared 2016 where there was a rise in both asking prices and rental rates by 1.2% and 0.7% q/q respectively. The decline this year was attributed to reduced credit levels and a decline in investment activities due to political uncertainty following the annulment of the August 2017 presidential elections.
|
Hass Consult Land Price Index summary 2016-2017 |
|||||||||
|
|
Q1 16 |
Q2 16 |
Q3 16 |
Q4 16 |
Annual 2016 |
Q1 17 |
Q2 17 |
Q3 17 |
Annual 2017 |
|
Nairobi Suburbs |
(0.2%) |
2.5% |
1.4% |
0.8% |
5.1% |
1.3% |
0.7% |
0.4% |
3.2% |
|
Nairobi Satellite Towns |
1.1% |
8.1% |
7.0% |
2.3% |
21.8% |
3.4% |
1.0% |
(1.7%) |
5.0% |
|
Average |
0.5% |
5.3% |
4.2% |
1.6% |
13.5% |
2.4% |
0.9% |
1.1% |
4.1% |
|
|||||||||
Source: Hass Consult
Statutory actions
Under statutory actions, the National Construction Authority (NCA), has made it mandatory for foreign contractors to work with local contractors by ceding at least 30% of the contract sum. This is in a bid to cushion local contractors from their foreign counterparts. The NCA Project Registration Guidelines stipulate that foreign contractors willing to register with the NCA must pay Kshs. 100,000 in registration fees and only undertake tenders they win. Temporary registered foreign contractors are expected to commit to sub-contracting at least 30.0% of contract value to their local counterparts. The effect of the NCA guidelines has been seen in the Kshs. 2.8 bn Karen Water Front project where Kenyans firm are expected to bag around 25.0% of the total contract costs and Runda Paradise, the Kshs 1.3bn project by Nachang Foreign Engineering Firms, where Kenyan firms generated Kshs 307mn that accounts for 23.6% of the contract costs. This, as the authority seeks to amend the Construction Act to give NCA the powers to arrest and prosecute developers who put up buildings that do not meet the regulator’s standards and reduce its reliance on other entities in administration of its duties. In our view, even if this move is granted, it will barely solve the issues of sub-substandard buildings cases since such incidences arise due to the use of unqualified personnel, poor workmanship, substandard building material and poor loading in buildings, which should be dealt with at initial stages during building plan approvals and with all the professionals involved.
Listed Real Estate
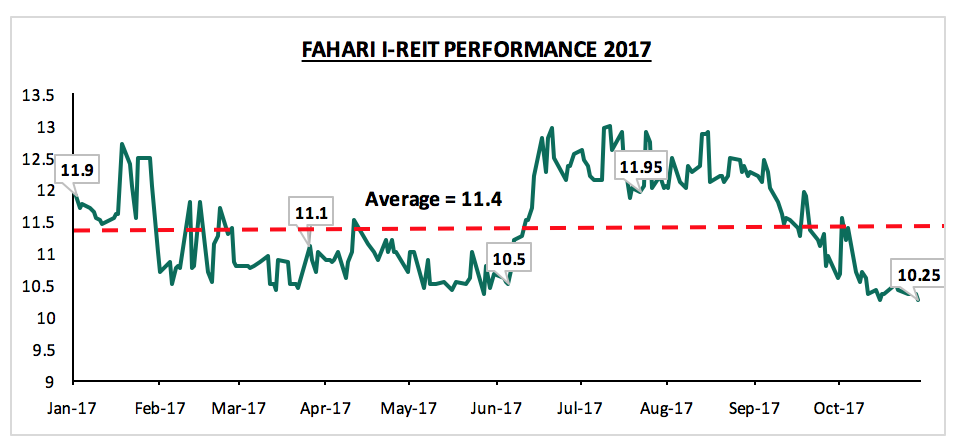
In the listed real estate sub-sector, the Fahari I-REIT’s share price declined by 6.4% during the month closing at Kshs. 10.25. Since its inception, the instrument has shed 50.6% of its value, from Kshs 20.75 the price at which it was floated at, in November 2015.
Generally, the price of the instrument has been on a steady decline attributable to (i) relatively lower dividend yield of 5.9% compared to brick and mortar real estate returns which offer average rental yields of 9.6% in the retail sector, (ii) the negative sentiment following the poor performance of Fusion D-REIT, which was undersubscribed in 2016 and (iii) information asymmetry in the market regarding REITs
We expect the slowdown in the real estate industry activities to persist till the end of Q4’ 2017. However, the sector should pick up in 2018 after the end of the electioneering period.

- Talk to us
- Kenya
- P.O Box 20695 - 00200, Nairobi, Kenya
- Cell +254709101200
- Tel +254709101200
- WhatsApp +254741676635
- United States
- +254709101200
- DOWNLOAD OUR APP
-


- Kenya
- 8th Floor, Pinetree Plaza, Kaburu Drive, Ngong Road, Nairobi, Kenya
- USA
- Suite 1150, 1775 Eye Street NW, USA, Washington DC 20006, USA
- Investments
- High Yield
- Private Equity
- Real Estate
- Real Estate
- RiverRun Estates
- Cytonn Towers
- The Ridge
- Taraji Heights
- The Alma