Fintech Impact on Kenya’s Financial Services Industry, & Cytonn Weekly #07/2019
By Cytonn Research Team, Feb 17, 2019
Executive Summary
Fixed Income
T-bills remained over-subscribed during the week, with the overall subscription rate coming in at 140.3%, a decline from 198.3% recorded the previous week. The continued over-subscription of T-bills in the primary auctions in 2019 has been attributed to favorable liquidity in the market, driven by debt maturities as well as government payments. There was mixed performance, with the 91-day paper recording an increase in its subscription level to 121.5%, from 83.4% recorded the previous week, while the 182-day and 364-day papers recorded declines in subscription rates to 117.1% and 170.9%, from 149.3% and 293.2%, recorded the previous week, respectively. During the week, the National Treasury released the Draft Kenya Sovereign Wealth Fund Bill, 2019, aimed at providing institutional arrangements for effective administration and efficient management of minerals and petroleum revenues. The Bill is set to establish a clear framework to guide the usage of proceeds from natural resources on the backdrop of the discovery of mineral and petroleum deposits considering that natural resources are exhaustible;
Equities
During the week, the equities market was on a downward trend with NASI, NSE 25, and NSE 20 declining by 2.0%, 1.6%, and 0.5%, respectively, taking their YTD performance to 11.9%, 12.7% and 7.5%, for NASI, NSE 25, and NSE 20, respectively. The International Finance Corporation (IFC) has entered into a technical advisory agreement with Equity Bank to offer technical advisory services with the aim of helping the lender to better its customer base of small and meduim-sized (SME) customers;
Private Equity
The Competition Authority of Kenya (CAK) released their 2018 Annual Report, which highlighted the number of mergers that the Authority handled in the period. The Authority handled 150 merger notifications in the period, a 15.4% increase from 130 merger notifications handled in 2017. The Authority reviewed and subjected the Merger Threshold Rules to stakeholders' comments, in a bid to align the Merger Threshold Rules and Guidelines to address the amendments to the Competition Act No. 12 of 2010. The new rules will greatly facilitate investments by SMEs and as such promote competition and economic growth in the country;
Real Estate
During the week, Vaal Real Estate, a local realtor, released a report highlighting the performance of the Nairobi real estate sector in 2018. Kenya National Bureau of Statistics (KNBS) released the Gross County Product 2019 Report, which among other insights, highlighted the contribution of Kenya’s 47 Counties to construction and real estate activities, with Nairobi, Nakuru and Kiambu taking the lead with 33.9%, 9.3% and 7.0%, respectively. In the retail sector, Dubai-based food chain Grill Shack opened its first restaurant at the Westgate Shopping Mall in Westlands, Nairobi;
Focus of the Week
The Kenyan financial services industry has witnessed waves of disruption in recent years. Mobile money, mobile banking, online banking, and most recently digital lending, are among the innovations that have reshaped the sector, causing financial institutions to re-evaluate their business models. Financial services being one of our primary industries of focus, this week we aim to analyze the technological factors that will define its trajectory in the long term.
T-Bills & T-Bonds Primary Auction:
T-bills remained over-subscribed during the week, with the overall subscription rate coming in at 140.3%, a decline from 198.3% recorded the previous week. The continued over-subscription in the primary auctions in 2019 has been attributed to improved liquidity in the market, driven by debt maturities as well as government payments. There was mixed performance, with the 91-day paper recording an increase in its subscription rates to 121.5%, from 83.4% recorded the previous week, while the 182-day and 364-day papers recorded declines in subscription to 117.1% and 170.9%, from 149.3% and 293.2%, recorded the previous week, respectively.
The yields on the 91-day, 182-day, and 364-day papers declined by 2.4 bps, 8.4 bps and 9.3 bps to 7.0%, 8.5% and 9.6%, respectively. The acceptance rate improved to 90.9% from 60.8%, recorded the previous week, with the government accepting Kshs 30.6 bn of the Kshs 33.7 bn worth of bids received.
Liquidity:
The average interbank rate declined to 1.4%, from 2.7% the previous week, while the average volumes traded in the interbank market rose by 246.4% to Kshs 17.8 bn, from Kshs 5.1 bn the previous week. Commercial banks’ excess reserves stood at Kshs 20.8 bn in relation to the 5.25% cash reserves requirement (CRR). The lower interbank rate points to improved liquidity conditions, with the rate declining to an 8-year low of 1.2% as at 14th February 2019 partly attributed to government payments and net redemption of government securities.
Kenya Eurobonds:
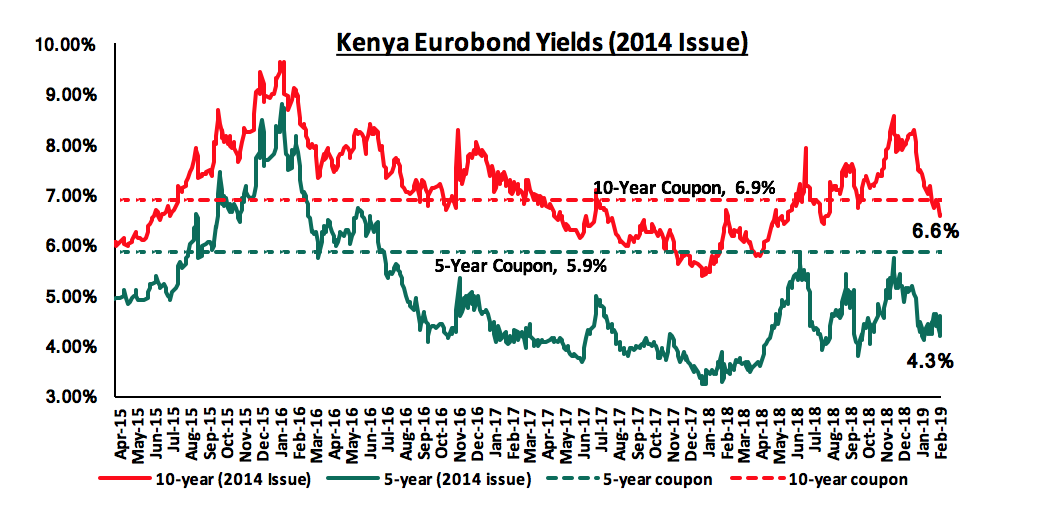
According to Bloomberg, the yields on the 5-year and 10-Year Eurobonds issued in 2014 declined by 0.3% points to 4.3% and 6.6% from 4.6% and 6.9%, the previous week. The continued decline in yields signals improving country risk perception by investors, which is partly attributed to bullish expectations of improved economic growth in 2019 as well as increased Eurobond demand in emerging markets with a similar trend observed in other Sub-Saharan African Eurobonds, driving the prices up and effectively the yields down. Key to note is that these bonds have 0.3-years and 5.3-years to maturity for the 5-year and 10-year, respectively.
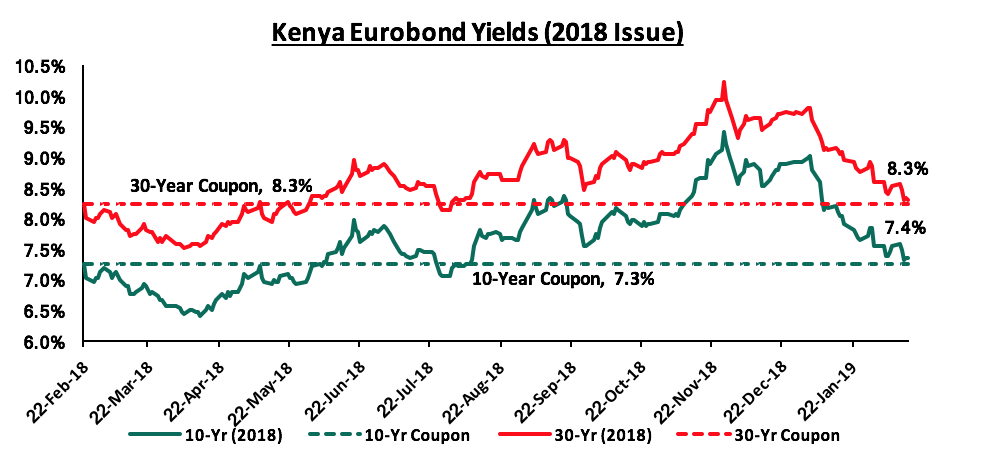
For the February 2018 Eurobond issue, during the week, the yields on both the 10-year and 30-year Eurobonds declined by 0.2% points to 7.4% and 8.3% from 7.6% and 8.5%, respectively. Since the issue date, the yields on the 10-year Eurobond has increased by 0.1% points while the 30-year Eurobonds has remained unchanged at 8.3%.
Kenya Shilling:
During the week, the Kenya Shilling remained stable depreciating marginally by 0.1% to close at Kshs 100.2, from Kshs 100.1 recorded the previous week, supported by inflows from horticulture exports and Diaspora remittances, which offset the dollar demand from manufacturers and oil importers. The Kenya Shilling has appreciated against the US Dollar by 1.6% year to date, in addition to the 1.4% appreciation in 2018, and in our view the shilling should remain relatively stable to the dollar in the short term, supported by:
- The narrowing of the current account deficit to 5.1% in the 12-months to November 2018, from 6.5% in November 2017, attributed to improved agriculture exports, increased diaspora remittances, strong receipts from tourism and slower growth in imports due to lower food and SGR–related equipment imports and the decline in international oil prices,
- Improving diaspora remittances, which increased by 38.6% in 2018 to USD 2.7 bn from USD 1.9 bn recorded in 2017. The rise is due to; (a) increased uptake of financial products by the diaspora due to financial services firms, particularly banks, targeting the diaspora, and (b) new partnerships between international money remittance providers and local commercial banks making the process more convenient,
- CBK’s activities in the money market, such as repurchase agreements and selling of dollars, and,
- High levels of forex reserves, currently at USD 8.1 bn, equivalent to 5.3-months of import cover, compared to the one-year average of 5.1-months and above the EAC Region’s convergence criteria of 4.5-months of imports cover.
Weekly Highlights:
During the week, the Kenya National Bureau of Statistics (KNBS) released the Gross County Product (GCP), which includes a geographic breakdown of Kenya’s Gross Domestic Product (GDP), giving an estimate of the size and structure of county economies. According to the report, the average contribution per county to gross value added over the period 2013-2017 was approximately 2.1%, with Nairobi having the highest contribution at 21.7%, followed by Nakuru and Kiambu at 6.1% and 5.5%, respectively. Isiolo had the lowest contribution coming in at 0.2%, for the same period under review. Key to note however, is that counties with a low contribution to GDP recorded higher growth mainly attributable to a lower base with Elgeiyo Marakwet, which had a 1.7% contribution to GDP being the only county that recorded a double-digit growth at 10.0%, above the 5.6% average, with 28 counties recording growth below the average. The report also noted that more than a half of the national county economic activity is driven by the services sector, which accounts for 54.6%, followed by the agriculture sector at 24.0%, and the industry sector at 21.4%. Nairobi Metropolitan Area, made up of Nairobi, Kajiado, Kiambu, Machakos, and Murang’a counties, has a total contribution of 34.2% to the country’s GDP. The report is expected to help shape the contentious revenue sharing debate as well as aid in promoting evidence-based economic planning and policymaking in the county levels in order to reduce the economic disparity among the different counties.
During the week, the National Treasury released the Draft Kenya Sovereign Wealth Fund Bill, 2019 aimed at providing institutional arrangements for effective administration and efficient management of minerals and petroleum revenues. The Bill is set to establish a clear framework to guide the usage of proceeds from natural resources on the backdrop of the discovery of mineral and petroleum deposits considering that natural resources are exhaustible.
The bill proposes the establishment of a Fund, which shall comprise of three distinct components namely:
- The Stabilization Component whose main objectives will be:
- To insulate expenditures under the budget estimates of the national government from fluctuations in resource revenues; and
- Management of shocks, which may affect macroeconomic stability
- The Infrastructure Development Component whose main objective will be to provide funding for public sector infrastructure development priorities that are aligned to the national or county development plan to foster a stronger and more inclusive growth and development, and
- The Urithi Component whose main objective is to build a savings base for future generations by:
- Providing a facility to support development for future generations, when the revenues from minerals and petroleum are depleted
- Generating an alternative stream of income to support expenditure on capital projects as a result of revenue downturn caused by depletion of minerals and petroleum; and
- Distributing wealth across generations.
The proceeds will be held in an account known as the holding account, which shall be maintained by the Central Bank of Kenya (CBK). Deposits into the account are set to be transferred into the three components of the fund in the following proportions:
- At least 15.0% to the stabilization component,
- At least 60.0% percent to the infrastructure development component and
- At least 10.0% to the Urithi component.
In the event of depletion of petroleum and mineral resources, all the funds will be collapsed into a single account where withdrawals will be limited to earnings from assets and dividends for infrastructure development. The sovereign wealth fund has been established in a number of resource rich countries such as the Norway Sovereign Fund, which has about USD 1.0 tn investments globally. In Africa, Angola, Nigeria, Botswana, Senegal, Libya, Algeria, and Ghana are some of the countries that have also established similar funds. We believe that the introduction of the bill is a well-guided move, which would enable the effective management of revenues generated from extraction of resources and aid the country in rational utilization of the funds.
The Treasury released the draft 2019 Budget Policy Statement, which outlines the current performance of the Kenyan economy, as well as give the medium term outlook. The Budget Policy Statement (BPS) is a Government policy document that sets out the broad strategic priorities, policy goals, together with a summary of the Government’s spending plans, as a basis of preparing the FY 2019/20 budget.
Below is a summary of the major changes as per the BPS 2019 from the revised FY’2018/2019 budget
|
Comparison of 2018/19 and 2017/18 Fiscal Year Budgets as per The 2018 Budget Policy Statement |
||||
|
|
FY'2017/2018 Budget Outturn |
FY'2018/2019 Revised Budget |
FY'2019/2020 BPS |
% change 2018/19 to 2019/20 |
|
Total revenue |
1,487.2 |
1,852.6 |
2,080.9 |
12.3% |
|
External grants |
26.3 |
48.5 |
51.6 |
6.4% |
|
Total revenue & external grants |
1,513.5 |
1,901.1 |
2,132.5 |
12.2% |
|
Recurrent expenditure |
1,319.6 |
1,541.0 |
1657.3 |
7.5% |
|
Development expenditure & Net Lending |
485.7 |
595.7 |
670.9 |
12.6% |
|
County governments + contingencies |
306.2 |
372.4 |
376.5 |
1.1% |
|
Total expenditure |
2,111.5 |
2,509.1 |
2704.7 |
7.8% |
|
Fiscal deficit excluding grants |
(597.9) |
(608.0) |
(572.2) |
(5.9%) |
|
Deficit as % of GDP |
6.8% |
6.1% |
5.0% |
|
|
Net foreign borrowing |
331.6 |
287.0 |
306.5 |
6.8% |
|
Net domestic borrowing |
273.7 |
317.1 |
271.4 |
(14.4%) |
|
Other domestic financing |
2.6 |
3.9 |
-5.7 |
|
|
Total borrowing |
608.0 |
608.0 |
572.2 |
(5.9%) |
|
GDP Estimate |
8,845.9 |
9,990.0 |
11,346.5 |
13.6% |
Key take-outs from the table include:
- The 2019 BPS points to a 7.8% increase of the budget, to Kshs 2.7 tn from Kshs 2.5 tn in the FY’ 2018/19 revised budget,
- Recurrent expenditure is set to increase at a slower rate than development expenditure; with recurrent increasing by 7.5% to Kshs 1.7 tn from Kshs 1.5 tn as per the revised budget, while development expenditure is projected to increase by 12.6% to Kshs 670.9 bn from Kshs 595.7 as per the revised FY’2018/2019 budget,
- The budget deficit is projected to decline to Kshs 572.2 bn (5.0% of GDP) from the projected Kshs 608.0 bn (6.1% of GDP) in the FY 2018/19; in line with the International Monetary Fund’s (IMF’s) recommendation, in a bid to reduce Kenya’s public debt requirements,
- Revenue is projected to increase by 12.3% to Kshs 2.1 tn from the projected Kshs 1.8 tn in the revised FY 2018/19 budget, with measures already in place to work towards increasing the amount of revenue collected in the next fiscal year.
- The total borrowing requirement is expected to decline by 5.9% to Kshs 572.2 bn from Kshs 608.0 bn, in a bid to reduce Kenya’s public debt burden which is estimated at 57.0% of GDP as at the end of the FY’2017/2018 above the East African Community (EAC) Monetary Union Protocol, the World Bank Country Policy and Institutional Assessment Index, and the IMF threshold of 50.0%, and,
- Debt financing of the 2018/19 budget is estimated to consist of 53% foreign debt and 47% domestic debt, unlike 47% foreign and 53% domestic as projected in the revised FY’ 2018/19 budget which presents a risk of increased exposure to external shocks.
For more analysis on this, see our Draft 2019 Budget Policy Statement Note,
The Energy Regulatory Commission (ERC) released their monthly statement on the Maximum Retail Prices in Kenya for the period 15th February 2019 to 14th March 2019. Below are the key take-outs from the statement:
- Petrol prices have declined by 4.0% to Kshs 100.1 from Kshs 104.2 per litre previously, while diesel and kerosene prices have declined by 6.1% and 5.1% to Kshs 96.0 and 96.5 per litre, respectively, from Kshs 102.2 and 101.7 per litre, previously
- The changes in prices has been attributed to the decline in average landing cost of imported super petrol by 7.2% to USD 548.2 per ton in January, from USD 590.9 per ton in December. Landing costs for diesel and kerosene declined by 11.3% and 3.9% to USD 546.4 per ton and USD 595.8 per ton in January, respectively, from USD 661.0 per ton and USD 620.1 per ton in December
We expect a decline in the transport index, which carries a weighting of 8.7% in the total consumer price index (CPI), due to the decline in petrol and diesel prices. We will release our inflation projection for the month of February 2019 in next week’s report.
Rates in the fixed income market have remained stable as the government rejects expensive bids, as it is currently 1.4% ahead of its domestic borrowing target for the current financial year, having borrowed Kshs 198.7 bn against a pro-rated target of Kshs 196.0 bn. However, a budget deficit is likely to result from depressed revenue collection creating uncertainty in the interest rate environment as additional borrowing from the domestic market goes to plug the deficit. Despite this, we do not expect upward pressure on interest rates due to increased demand on government securities, driven by improved liquidity in the market owing to the relatively high debt maturities. Our view is that investors should be biased towards medium-term fixed income instruments to reduce duration risk associated with long-term debt, coupled with the relatively flat yield curve on the long-end due to saturation of long-term bonds.
Market Performance
During the week, the equities market was on a downward trend with NASI, NSE 25, and NSE 20 declining by 2.0%, 1.6%, and 0.5%, respectively, taking their YTD performance to 11.9%, 12.7% and 7.5%, for NASI, NSE 25, and NSE 20, respectively. The decline in NASI was mainly driven by declines in large cap banking stocks such as Barclays Bank, Cooperative Bank, and Standard Chartered Bank, which declined by 3.7%, 2.8%, and 1.1%, respectively.
Equities turnover declined by 50.3% during the week to USD 29.7 mn, from USD 59.7 mn the previous week, taking the YTD turnover to USD 246.5 mn. Foreign investors turned net buyers for the week, with a net buying position of USD 1.1 mn, from last week’s net selling position of USD 3.6 mn.
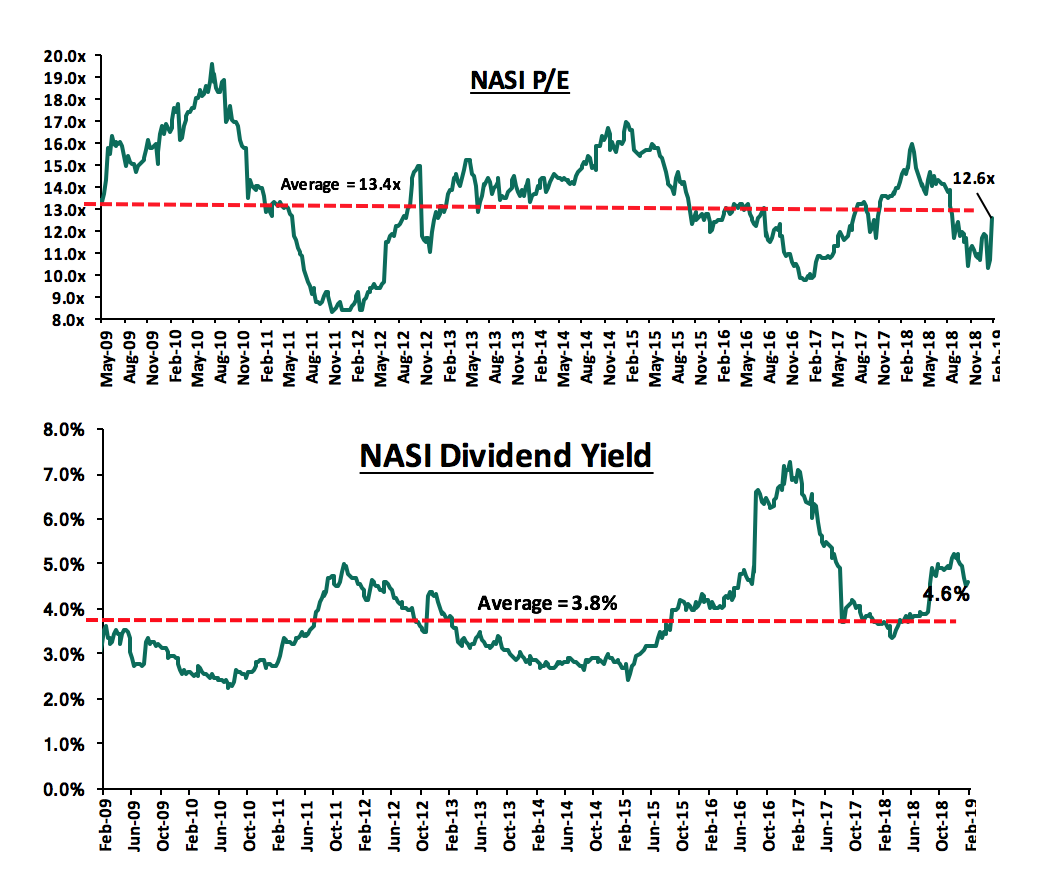
The market is currently trading at a price to earnings ratio (P/E) of 12.6x, 6.3% below the historical average of 13.4x, and a dividend yield of 4.6%, above the historical average of 3.8%. With the market trading at valuations below the historical average, we believe there is value in the market. The current P/E valuation of 12.6x is 29.7% above the most recent trough valuation of 9.7x experienced in the first week of February 2017, and 51.4% above the previous trough valuation of 8.3x experienced in December 2011. The charts below indicate the historical P/E and dividend yields of the market.
Weekly Highlights
The International Finance Corporation (IFC) has entered into a technical advisory agreement with Equity Bank to offer technical advisory services with the aim of helping the lender to better its customer base of small and meduim-sized (SME) customers. The project will see the development of new products and services tailored mainly for the SMEs. It will assist the Equity Group design and deliver an efficient SME business model, improve SME credit related processes, and train staff to effectively serve the targeted SME segments. Equity Bank is already the country’s leading SME bank with the segment comprising close to 60% of the bank’s loan portfolio with the lender having 10.0 mn customers in Kenya. The bank is well placed to deliver additional products and services to its SME customers given its country-wide coverage through a network of 177 branches and over 32,000 agents, and its innovative digital channels. Equity bank becomes the latest local bank to benefit from IFC’s technical advisory services, after Co-op Bank which is also getting IFC’s input in a Kshs 243.6 mn deal to help the lender expand its digital banking services. We note that various lenders in the local banking space such as KCB, Co-operative bank and I&M bank have been increasing focus on the SME banking segment, which was adversely affected by the implementation of the Banking (Amendment) Act 2015, as access to credit became difficult, with banks citing inability to price them within the margins set under the law. Banks have been obtaining finance from international institutions mainly for onward lending to the private sector mainly comprise of SMEs, so as to plug a funding deficit occassioned by a mismatch in their assets and liabilities by tenor, as deposits tend to be relatively short term while loans are relatively long term. The funds issues so far have been summarised in the table below:
|
Loans to Banks by International Organizations |
|||||
|
Issuer |
Bank |
Issue Period |
Amount of Loan(Kshs bn) |
Term of Credit |
|
|
1 |
IFC |
Cooperative Bank |
Feb-18 |
15.2 |
7-years |
|
2 |
Africa Development Bank |
Kenya Commercial Bank |
Oct-17 |
10.4 |
Not specified |
|
3 |
14 financial Institutions (syndicated) |
Stanbic Bank |
May-18 |
10.0 |
2,3 years |
|
4 |
Africa Development Bank |
Diamond Trust bank |
Mar-18 |
7.5 |
7-years |
|
5 |
FMO |
I&M Holdings |
Oct-18 |
4.0 |
Not specified |
|
6 |
IFC |
I&M Holdings |
Jan-18 |
1.0 |
Not specified |
|
7 |
SwedFund |
Victoria Commercial Bank |
Apr-18 |
0.5 |
Not specified |
|
8 |
East African Development Bank |
Sidian Bank |
Nov-18 |
0.2 |
8-years |
|
|
Total |
48.9 |
|||
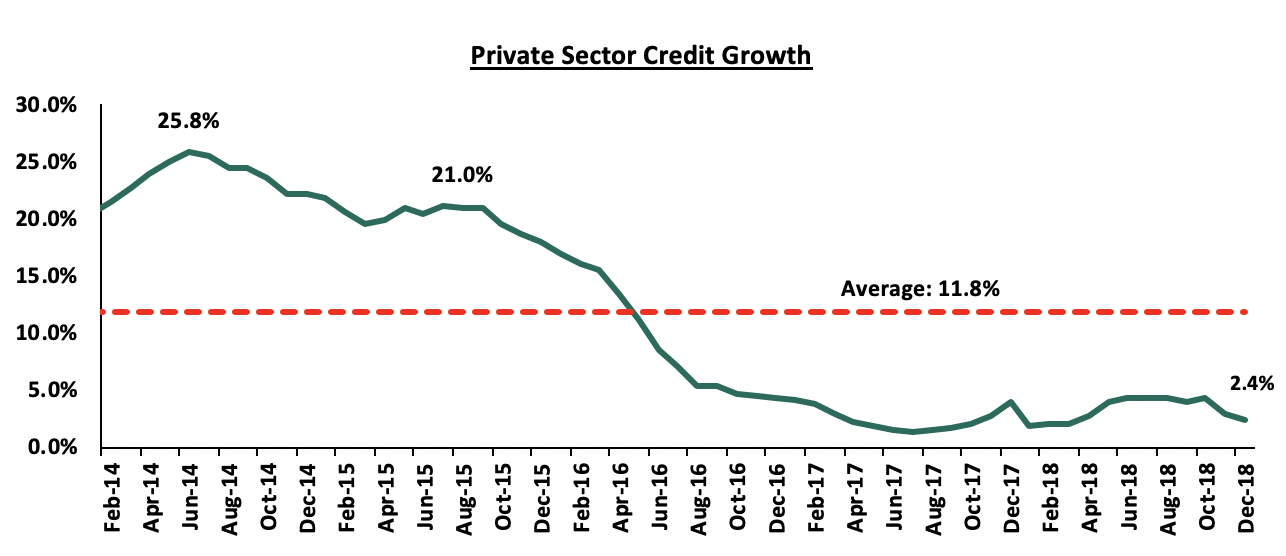
With SMEs forming 80.0% of the private sector, reduced credit extension saw the private sector credit growth remain below 5.0%, averaging 3.3% in 2018, below the 5-year average of 11.8%. With increased focus in the segment by larger banks such as Equity Group, Co-operative Bank and KCB, this would likely increase credit extension to the private sector, in addition to increasing the respective banks’ interest and fee income.
Athi River Mining Plc (ARM) will remain suspended from trading at the NSE for a further 6-months. The Capital Markets Authority (CMA) opted to extend the suspension in view of the turnaround efforts led by administrators from PriceWaterhouseCoopers (PwC). The extension comes on the back of expiry of the 75 days suspension issued in October 2018. This is the fourth extension of ARM’s suspension since the stock was first blocked from trading for 7 working days on August 20th 2018, after its lenders, led by UBA Bank raised concerns of insolvency hence putting it under administration. Firms interested in buying out troubled ARM Cement have until the end of this month to make final offers to the company’s administrators PricewaterhouseCoopers (PwC). With the administrators currently engaged in the asset sales of the various subsidiaries, this would provide the company with a capital base to boost and streamline the core operations. We also note that the proposed move to look for a strategic investor may also provide reprieve, with several major companies such as Dangote Cement and Oman Based Raylat Limited expressing interest in acquiring the troubled company.
Universe of Coverage
Below is our banking universe of coverage table:
|
Universe of Coverage |
||||||||
|
Banks |
Price as at 08/02/2019 |
Price as at 15/02/2019 |
w/w change |
YTD Change |
Target Price |
Dividend Yield |
Upside/Downside |
P/TBv Multiple |
|
GCB Bank*** |
4.2 |
4.2 |
0.0% |
(9.1%) |
7.7 |
9.3% |
94.0% |
1.0x |
|
Diamond Trust Bank |
151.0 |
150.0 |
(0.7%) |
(4.2%) |
283.7 |
1.8% |
90.9% |
0.8x |
|
CRDB |
135.0 |
135.0 |
0.0% |
(10.0%) |
207.7 |
0.0% |
53.9% |
0.5x |
|
CAL Bank |
0.9 |
0.9 |
2.2% |
(7.1%) |
1.4 |
0.0% |
53.8% |
0.8x |
|
Access Bank |
6.7 |
6.6 |
(0.8%) |
(2.9%) |
9.5 |
6.7% |
50.6% |
0.4x |
|
I&M Holdings |
95.0 |
95.5 |
0.5% |
12.4% |
138.6 |
3.7% |
48.8% |
1.0x |
|
KCB Group*** |
43.6 |
43.5 |
(0.3%) |
16.0% |
61.3 |
7.3% |
48.4% |
1.3x |
|
Zenith Bank*** |
24.4 |
24.8 |
1.4% |
7.4% |
33.3 |
11.8% |
46.4% |
1.0x |
|
UBA Bank |
7.7 |
8.0 |
4.6% |
3.9% |
10.7 |
11.9% |
45.6% |
0.5x |
|
Ecobank |
7.5 |
7.5 |
0.0% |
(0.1%) |
10.7 |
0.0% |
43.3% |
1.6x |
|
Equity Group |
42.3 |
42.5 |
0.5% |
22.0% |
56.2 |
4.9% |
37.1% |
2.0x |
|
Co-operative Bank |
16.0 |
15.6 |
(2.8%) |
8.7% |
19.9 |
5.1% |
33.1% |
1.4x |
|
Stanbic Bank Uganda |
29.0 |
29.0 |
(0.1%) |
(6.5%) |
36.3 |
3.9% |
29.1% |
2.1x |
|
NIC Group |
38.3 |
39.5 |
3.3% |
42.1% |
48.8 |
2.9% |
26.4% |
0.9x |
|
Union Bank Plc |
6.3 |
6.9 |
10.4% |
23.2% |
8.2 |
0.0% |
18.1% |
0.7x |
|
Barclays Bank |
12.3 |
11.8 |
(3.7%) |
7.8% |
12.5 |
8.7% |
14.7% |
1.6x |
|
SBM Holdings |
5.9 |
6.0 |
1.0% |
0.7% |
6.6 |
5.0% |
14.3% |
0.9x |
|
Bank of Kigali |
278.0 |
276.0 |
(0.7%) |
(8.0%) |
299.9 |
5.0% |
13.7% |
1.5x |
|
HF Group |
7.0 |
6.5 |
(6.3%) |
17.7% |
6.6 |
5.3% |
6.5% |
0.3x |
|
Guaranty Trust Bank |
38.7 |
38.0 |
(1.8%) |
10.2% |
37.1 |
7.1% |
4.9% |
2.1x |
|
Standard Chartered |
206.5 |
204.3 |
(1.1%) |
5.0% |
196.3 |
6.4% |
2.5% |
1.6x |
|
Stanbic Holdings |
90.8 |
94.3 |
3.9% |
3.9% |
92.6 |
2.5% |
0.7% |
0.9x |
|
Bank of Baroda |
134.2 |
134.0 |
(0.1%) |
(4.3%) |
130.6 |
1.9% |
(0.7%) |
1.2x |
|
Standard Chartered |
21.0 |
21.0 |
0.0% |
0.0% |
19.5 |
0.0% |
(7.3%) |
2.6x |
|
National Bank |
6.0 |
5.7 |
(5.0%) |
6.8% |
4.9 |
0.0% |
(13.7%) |
0.4x |
|
FBN Holdings |
8.0 |
8.5 |
5.6% |
6.3% |
6.6 |
3.4% |
(18.1%) |
0.4x |
|
Stanbic IBTC Holdings |
47.0 |
48.5 |
3.2% |
1.1% |
37.0 |
1.3% |
(22.4%) |
2.3x |
|
Ecobank Transnational |
13.7 |
14.4 |
5.1% |
(15.3%) |
9.3 |
0.0% |
(35.6%) |
0.5x |
|
* Target Price as per Cytonn Analyst estimates ** Upside/ (Downside) is adjusted for Dividend Yield ***Banks in which Cytonn and/or its affiliates are invested in ****Stock prices indicated in respective country currencies |
||||||||
We are “Positive” on equities for investors as the sustained price declines has seen the market P/E decline to below its historical average. We expect increased market activity, and possibly increased inflows from foreign investors, as they take advantage of the attractive valuations, to support the positive performance.
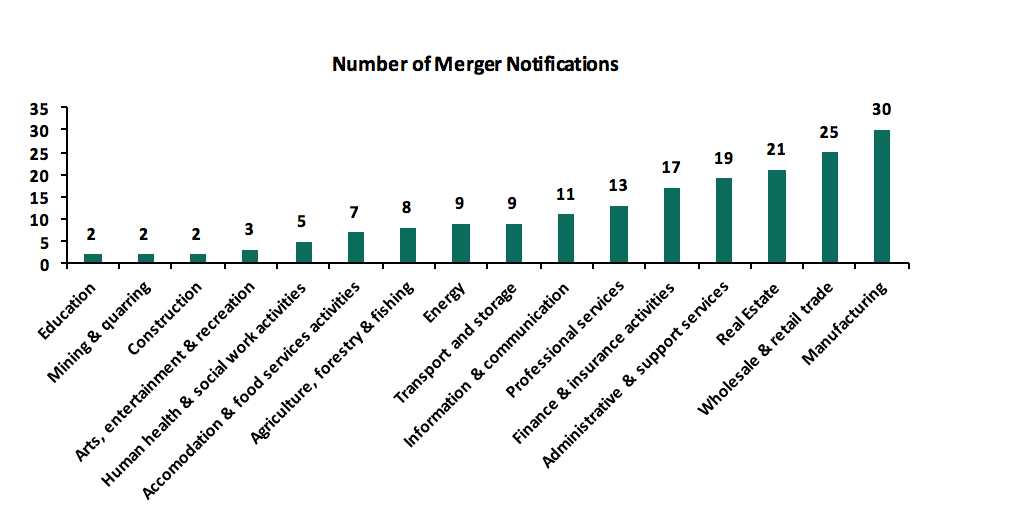
The Competition Authority of Kenya (CAK) released their 2018 Annual Report, which highlighted the number of mergers that the Authority handled. The Authority handled 150 merger notifications in 2018, a 15.4% increase from 130 merger notifications handled in 2017. The merger notifications were mainly from the following sectors; manufacturing, real estate, distribution, investment, services, advertising and agriculture, which accounted for 51.2% of all the mergers that were notified to the Authority while other sectors accounted for the balance of 48.8%. See below the number of merger notifications per sector:
Source: Competition Authority of Kenya Annual Report 2017/18
Merger transactions involving international companies, mainly private equity funds, were 83 in 2018, accounting for 55.3% of the 150 merger notifications. This was an 11.7% reduction from the 94 transactions recorded in 2017, attributed to the spill over effect from the prolonged electioneering period towards the end of 2017, which dampened investor sentiments. Merger transactions involving local companies were 67 in 2018, accounting for 44.7% of the 150 merger notifications. This was an 87.1% increase from the 36 transactions recorded in 2017. The value of the mergers and acquisitions considered in 2018, contributed a total of Kshs 66.1 bn to the Kenyan economy.
During the year under review, the Authority reviewed and subjected the Merger Threshold Rules to stakeholders' comments, in a bid to align the Merger Threshold Rules and Guidelines to address the amendments to the Competition Act No. 12 of 2010. The draft rules provide for block exclusions for transactions where the combined turnover or assets of the parties is below Kshs 500.0 mn. This will facilitate mergers across all sectors and hence promote investment especially involving Small and Medium Enterprises (SMEs). In addition, the new thresholds will save businesses the cost and time associated with sending merger notice to the CAK, as they will eliminate the need for double notification of mergers with COMESA companies and investors. Further, transactions where the parties have a combined turnover of less than Kshs 500.0 mn will not be required to notify the Authority.
The amended rules are expected to increase transparency, predictability and accountability among the business community regarding the Authority's merger enforcement process. Specifically, the reviewed rules are aimed at:
- Easing the cost of doing business and deepening of the investment climate,
- Providing clarity on the transactions that are required to issue a notice at the national and regional levels,
- Identifying notifiable, those which qualify for exclusions and non-notifiable transactions,
- Enhancing clarity in the calculation of the relevant turnover or assets, and,
- Ensuring consistency in the computation of relevant merger filing fees.
We are of the view that the new rules will greatly facilitate investments by SMEs and as such promote competition and economic growth in the country. The new rules will also help in promoting merger and acquisitions in the Eastern and Southern African region as the process will be more efficient and cost effective.
We maintain a positive outlook on private equity investments in Africa as evidenced by the increasing investor interest, which is attributed to; (i) economic growth, which is projected to improve in Africa’s most developed PE markets, (ii) attractive valuations in Sub Saharan Africa’s private markets compared to its public markets, and (iii) attractive valuations in Sub Saharan Africa’s markets compared to global markets. Going forward, the increasing investor interest, stable macro-economic and political environment will continue to boost deal flow into African markets.
- Industry Reports
During the week, Vaal Real Estate, a local realtor, released a report titled ‘Investing in Nairobi, Real Estate Opportunities Report’ highlighting the performance of the Nairobi real estate sector in 2018. Some of the major highlights include:
- The Retail Sector recorded rental yields of 9.0% - 10.0%, with a 6.0% points increase in occupancy to 84.0% in 2018 from 78.0% in 2017 attributed to attractive lease terms offered by landlords and increased demand for retail space from local and international retailers. Increment in retail supply declined by 79.7% to 24,000 SQM in 2018, from 118,000 SQM in 2017, attributable to the high cost of financing and slowdown of activities following the electioneering period. The retail outlook for 2019 is generally positive with consumer spending and online retailing expected to grow,
- The Commercial Office Sector recorded yields of 7.0% to 8.0% in 2018, with average prices of Kshs 13,000 per SQFT to Kshs 15,000 per SQFT and average rental rates of Kshs 149.2 per SQFT (Kshs 185.6 per SQFT and Kshs 113.0 per SQFT for ground floor and upper floor rent, respectively). Westlands, Kilimani and Upperhill recorded the highest occupancy rates at 83.0%, 79.0% and 71.0%, respectively. The outlook in the sector remains positive with investment opportunities in smaller working spaces of less than 250 SQM, serviced shared spaces and long-term leases for larger spaces,
- The Residential Sector recorded yields ranging from 4.0% to 6.0% with Westlands, Parklands and Kilimani recording the highest occupancy rates at 92.0%, 89.0% and 84.0%, respectively. 3-bed and 2-bed units were the most popular typologies with a market share of 42.0% and 27.0%, respectively. The outlook for the sector is positive as investors increasingly embrace the off-plan sales model in order to buy at discounted prices and realise capital gains upon completion. There’s an investment opportunity in i) studio units preferred by young first-time buyers due to their affordability, ii) penthouses preferred by investors due to their extraordinary views and being spacious, and iii) Mixed-use Developments as they provide a ‘play, work and stay’ environment, though regarded as a new concept but interesting to the target market,
- In the Hospitality Sector, serviced apartments recorded a 5-year CAGR of 15.0% in supply to 4,582 units in 2018 from 2,320 units in 2013 driven by the increase in tourists looking for extended stay facilities. The sector recorded yields of between 6.0% and 9.0% at an average occupancy rate of 74.0% in 2018, with the highest demand for the units coming from corporate and private residents recording 62.0% and 30.0%, respectively. Serviced apartments had 20.0% higher occupancy rates than hotels recording three-year occupancy rates of 72.0% compared to 52.0% for hotels. The outlook for the year is positive with the investment opportunity in lower grade serviced apartments that provide basic facilities at an affordable cost.
Overall, the report demonstrated a positive outlook for the real estate market with unique opportunities for each sector. We retain a neutral outlook for the real estate market in 2019, as the slowdown in demand for property persists amid increasing supply particularly in the commercial office, retail and upper-income residential sectors. Nevertheless, the market still holds opportunities in the land sector, undersupplied segments such as lower middle to low-income housing, suburban malls in counties such as Mombasa and the Mt. Kenya Region and differentiated themes such as Mixed-use Developments (MUDs) and serviced offices. For more information, see our Cytonn 2019 Markets Outlook.
Kenya National Bureau of Statistics (KNBS) released the Gross County Product 2019 highlighting the economic performance of Kenya’s 47 Counties between 2013 and 2017, detailing the net value of goods and services produced and the size and structure for each County’s economy. In 2017, the construction and real estate activity sectors accounted for 16.0% of the Kshs 3.9 tn total Gross County Product recording Kshs 252.0 bn and Kshs 385.0 bn value of production, respectively. Nairobi, Kiambu and Mombasa Counties were the main contributors to real estate and construction sectors recording 33.9%, 9.3% and 7.0% contribution, respectively. In our view, this is mainly due to the positioning of Nairobi as the country’s capital city and the main commercial hub locally and in the region thus attracting investors and residents, whereas Kiambu County hosts several fast-growing dormitory towns such as Kikuyu, Ruiru, Ruaka and Thika, where several people working in Nairobi live. Mombasa, on the other hand, is the 2nd largest city in Kenya, and benefits from economic growth mainly through tourism and the maritime business activities.
Below is a graph showing the Top 10 Counties with the highest contribution to construction and real estate activities:
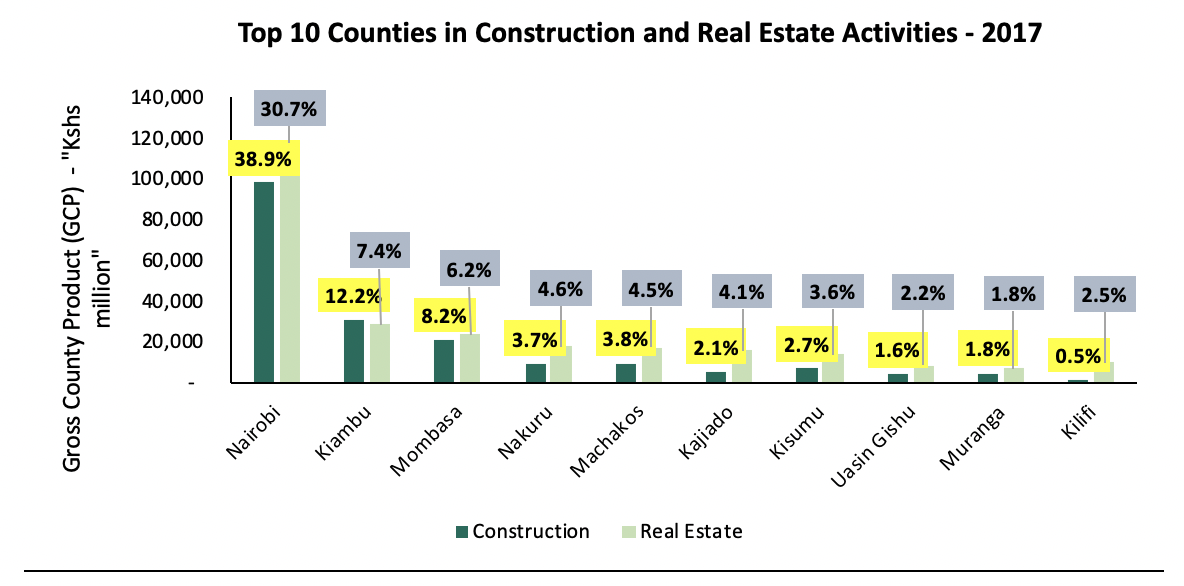
Source: KNBS GCP 2019
*Values at 2009 prices (base year)
We expect devolution to continue playing a key role in offering opportunities for growth in the real estate sector by creating demand for residential units, commercial office and Mixed-use Developments. The government increased its budget allocation to County Governments to support infrastructural development as well as the growth of other sectors including housing. In 2018, the government increased county budget allocation by 8.9% from Kshs 345.7 bn in 2017/18, to Kshs 376.4 bn in 2018/19.
II. Retail Sector
During the week, Grill Shack, a Dubai-based food chain, opened a restaurant at the Westgate Shopping Mall in Westlands, Nairobi. The Kshs 70 mn outlet is the chain’s first store in the country. The Westlands retail sector continues to attract international vendors driven by its positioning as an affluent neighbourhood hosting middle to high-income earners with relatively high purchasing power, the supply of high-quality retail spaces and growing demand for international brands from the expanding middle and wealthy classes. As a result, Westlands continues to be the best performing retail market in the Nairobi Metropolitan Area recording an average rental yield of 12.2%, 3.2% points higher than the 2018 market average of 9.0%. We, however, note that rental rates in the area, as in other markets, declined by 6.6% attributed to developers decreasing rents to attract retailers and boost occupancy, given the increasing supply of retail space in the market. The continued expansion of both local and international retailers, however, indicates confidence in the retail consumer market, and thus we anticipate that this will cushion the retail real estate market going forward.
|
Summary of Nairobi’s Retail Market Performance 2017-2018 |
|||||||||
|
Location |
Rent Kshs/SQFT 2018 |
Occupancy Rate 2018 |
Rental Yield 2018 |
Rent Kshs/SQFT 2017 |
Occupancy Rate 2017 |
Rental Yield 2017 |
∆ Y/Y in Rental Charges |
∆ Y/Y in Occupancy Rates (%points) |
∆ Y/Y in Rental Yields (% points) |
|
Westlands |
219.2 |
88.2% |
12.2% |
234.7 |
91.0% |
13.5% |
(6.6%) |
(2.8%) |
(1.3%) |
|
Karen |
224.9 |
88.8% |
11.0% |
206.2 |
96.3% |
11.2% |
9.1% |
(7.6%) |
(0.3%) |
|
Kilimani |
167.1 |
97.0% |
10.7% |
181.0 |
87.0% |
10.3% |
(7.7%) |
10.0% |
0.4% |
|
Ngong Road |
175.4 |
88.8% |
9.7% |
170.7 |
81.8% |
8.7% |
2.7% |
7.0% |
1.0% |
|
Thika road |
177.3 |
75.5% |
8.3% |
199.2 |
75.3% |
8.7% |
(11.0%) |
0.3% |
(0.4%) |
|
Kiambu Road |
182.8 |
69.5% |
8.1% |
216.1 |
78.2% |
10.6% |
(15.4%) |
(8.7%) |
(2.4%) |
|
Mombasa road |
161.5 |
72.4% |
7.9% |
180.4 |
68.8% |
8.3% |
(10.4%) |
3.7% |
(0.5%) |
|
Eastland’s |
153.3 |
64.8% |
6.8% |
148.9 |
61.8% |
6.1% |
3.0% |
3.1% |
0.7% |
|
Satellite Towns |
142.1 |
73.7% |
6.7% |
130.1 |
82.5% |
7.7% |
9.2% |
(8.8%) |
(0.9%) |
|
Average |
178.2 |
79.8% |
9.0% |
185.3 |
80.3% |
9.6% |
(3.8%) |
(0.4%) |
(0.6%) |
- Hospitality Sector
During the week, the Central Bank of Kenya (CBK) released the Market Perceptions Survey of January 2019 Report, which among other insights, highlighted optimism in the tourism and hospitality sectors. The report showed an increase in the median of monthly forward hotel bookings by 5.2% points to an average of 46.9% for January to April 2019, compared to 41.7% during the same period in 2018. According to the report, the increased demand for accommodation is attributable mainly to improved business environment, and enhanced security. Other factors expected to fuel performance of the sector include; i) valentine’s season’s booking, ii) resumption of corporate bookings, and iii) reduction of cost of travel boosted by affordability of budget airlines and the Standard Gauge Railway (SGR).
Below is a graph showing hotel booking projection in 2018 and 2019:
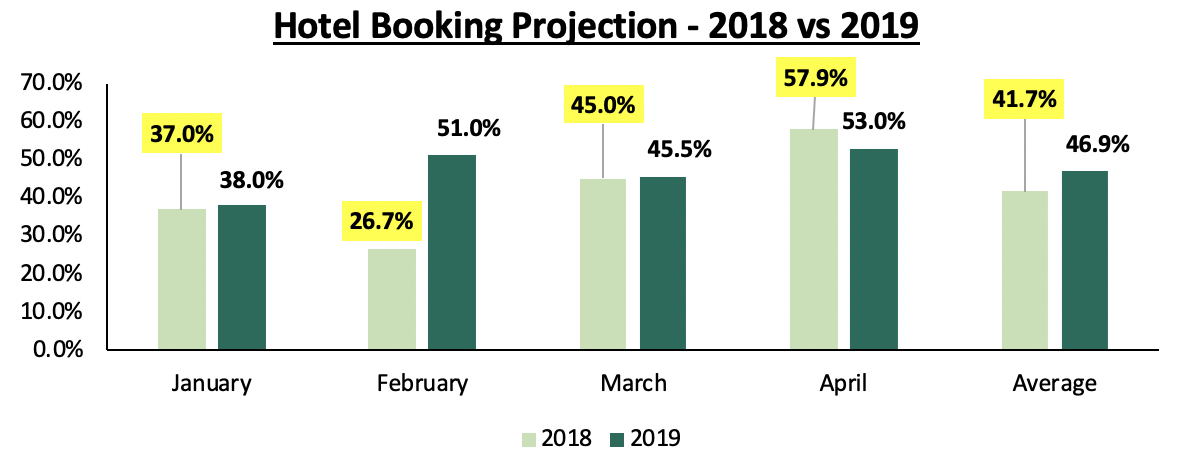
Source: Central Bank of Kenya (CBK)
The report is in tandem with the Cytonn Annual Outlook 2019, which forecasted increased demand for accommodation services in 2019, with a projected increase of 23.1% in tourist arrivals to 2.6mn from 2.0 mn recorded in 2018. According to the report, some of the key factors likely to boost the sector include; country’s political stability, the continued marketing of Kenya as an experience destination and the improved air transport with several airlines that increased their flight frequencies in and out of the country. We, however, note that the recent terrorist attack at the DusitD2 Hotel could negatively affect the sector in the short-term given the recent issuances of travel warnings by the United States (US) and United Kingdom (UK) governments for their citizens. We, therefore, expect hoteliers to leverage on the growth of domestic tourism, with domestic bed-nights growing by 9.03% in 2018 to 3.97 mn from 3.65 mn in 2017, and Meetings, Incentives, Conference and Events (MICE) tourism to support the sector.
We maintain a neutral outlook for the real estate sector in Kenya as the sector is mainly constrained by high financing cost for both developers and buyers. However, the sector has pockets of value driven by positive demographics characterized by a high population growth rate of 2.5% p.a., urbanization rate of 4.3%, and increasing purchasing power with GDP per Capita growing at a rate of 7.9% p.a. over the last 5-years, from Kshs. 113,539 in 2013 to Kshs. 166,314 in 2017.
Technological disruptions have greatly affected the Kenyan financial services industry in recent years. Mobile money is by far the most significant, as underlined by data from the Central Bank of Kenya (CBK), which indicates that the value of mobile transactions has grown at a CAGR of 66.3% since inception in 2007, from Kshs 14.8 bn of transaction volume, to Kshs 4.0 tn of transaction volume in 2017. Online banking has also gained traction and majority of banks are now aligning their business models to towards online channels as opposed to the traditional brick and mortar. The most recent innovation to shake up the industry is digital lending, which has been, to some part, a response to the slow growth in private sector credit following the capping of interest rates on loans offered by banks. Globally, decentralization of currency has been a topic of interest, pegging the question on whether these emerging digital currencies have a place in the industry.
Financial services being one of our primary industries of focus, in this week’s focus note we aim to analyze the technological innovations that will define its trajectory in the long term. As such, we shall look at the following:
- History and Evolution of the Financial Services Industry
- Recent Significant Technological Adoptions in the Kenyan Financial Services Industry
- Emerging Technological Trends in the Industry and Their Expected Impact
- Outlook on the Extent to Which Technology Will Shape the Future of the Industry
Section I: History and Evolution of the Financial Services Industry
- The Banking Industry
The concept of banking has existed for centuries and has continuously evolved with changing human needs. Banking, in the modern sense and the practice of issuing banknotes emerged in the 17th century. Wealthy merchants would store their gold with goldsmiths of London in secure vaults, and at a fee. The goldsmiths would issue a receipt for each deposit based on quality and quantity of the gold. If a customer wanted to spend the gold, they could use the piece of paper to draw it from the vault. In time, they were able to simply use the paper as payment in shops. Paper receipts were soon seen as being as good as metal, and paper money was born. Over time, commodity backed currency was replaced by fiat currency which was no longer pegged to gold. In the 1960s, the first Automated Teller Machines (ATM) were developed and first machines started to appear by the end of the decade. Banks started to become heavy investors in computer technology to automate much of the manual processing, which began a shift by banks from large clerical staffs to new automated systems. By the 1970s the first payment systems started to develop, that would lead to electronic payment systems for both international and domestic payments. The international SWIFT payment network was established in 1973 and domestic payment systems were developed around the world by banks working together with governments. In today’s digital age, we have seen a major transformation in the financial services industry. What was for many decades a largely unchanging industry is now constantly evolving, with many banks battling to keep up.
- The Insurance Industry
The insurance industry as we see it today is modern and in an advanced stage, which has been attained in a phased manner over a long period. Like banking, the roots of insurance can be traced back to ancient period. Insurance as we now know it on the institutional level started in the late 1800s. In the early twentieth century, industry-collectives arose, coming together to pool resources and share risks. Unlike banking, the traditional insurance model has been mostly immune to drastic changes. Apart from support aspect like database management, payment channels and process streamlining, the fundamentals of insurance practices are yet to be fully disrupted. The distribution aspect still mainly relies on agents, although new innovations like bancassurance have begun to emerge. Investigation and processing of claims is also reliant on manpower. Efforts have been made to automate the process of actuarial modelling but with little success, since no computer can provide the judgement and inventiveness that actuaries do.
Section II: Recent Significant Technological Adoptions in the Kenyan Financial Services Industry
In Kenya, the financial services sector has undergone the following major technologically driven transformations:
Mobile Money:
Mobile money is an electronic wallet service that allows users to store, send, and receive money using their mobile phone. In Kenya, mobile money was introduced in 2007 through Safaricom’s M-pesa platform. Since then, the service has managed countrywide adoption. According to September 2018 data from the Communications Authority of Kenya, Kenya’s mobile penetration rate (total number of active sim cards to total population) stood at 100.1% with the number of active mobile money subscribers being 64.5% of the population. By transaction value, the Central Bank of Kenya (CBK) reported a total of Kshs 4.0 tn exchanged through mobile money in the year 2018, equivalent to 45.3% of the country’s GDP.
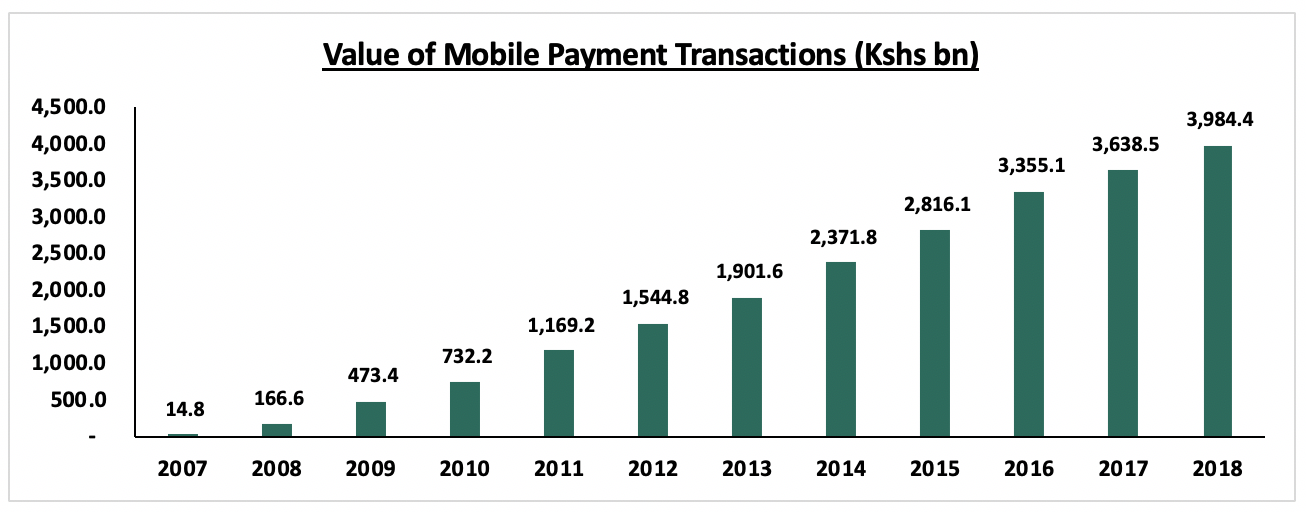 Source: CBK
Online Banking:
Online / internet banking is an electronic payment system that enables customers of a bank or other financial institution to conduct a range of financial transactions through the institution's website or smartphone application. In Kenya, the online banking revolution has caused a restructuring of the traditional banking model, as highlighted below:
|
Top 3 Kenyan Banks’ Transaction Volume by Channel |
|||||
|
Bank |
KCB |
Equity Bank |
Cooperative Bank |
Average |
Combined |
|
CBK Market Share Index* |
14.1% |
9.9% |
9.9% |
|
33.9% |
|
Mobile and internet |
55.0% |
79.0% |
28.1% |
54.0% |
|
|
Agency |
20.0% |
12.0% |
32.2% |
21.4% |
|
|
ATM |
13.0% |
4.0% |
28.7% |
15.2% |
|
|
Branch |
12.0% |
3.0% |
10.6% |
8.5% |
|
|
Others |
|
2.0% |
0.4% |
1.2% |
|
Source: Individual Banks’ Q3’2018 Investor Briefing / CBK
*Market Share weighted by total assets, total deposits, shareholders’ funds, number of deposit accounts, and number of loan accounts
Among the Top 3 banks by market share, on average, mobile and internet banking is the most active transaction channel at 54.0% of the total number of transactions. This has resulted to low branch activity, which averages 8.5% of the total number of transactions. Banks view technological innovation as means of improving efficiency and reducing costs. The downside of this however has been the negative impact on employment, following branch closures and mass retrenchments. According to the CBK, the banking sector’s efficiency, measured by the number of deposit accounts per employee, has increased by 100.5% from 770 in 2014 to 1,544 in 2017, driven by a decline in the number of staff in the banking sector by 16.3 % from 36,923 in 2014 to 30,903 in 2017, against an increase of 67.8% in deposit accounts. The charts below highlight the trends in the efficiency score and the number of staff in the banking sector.
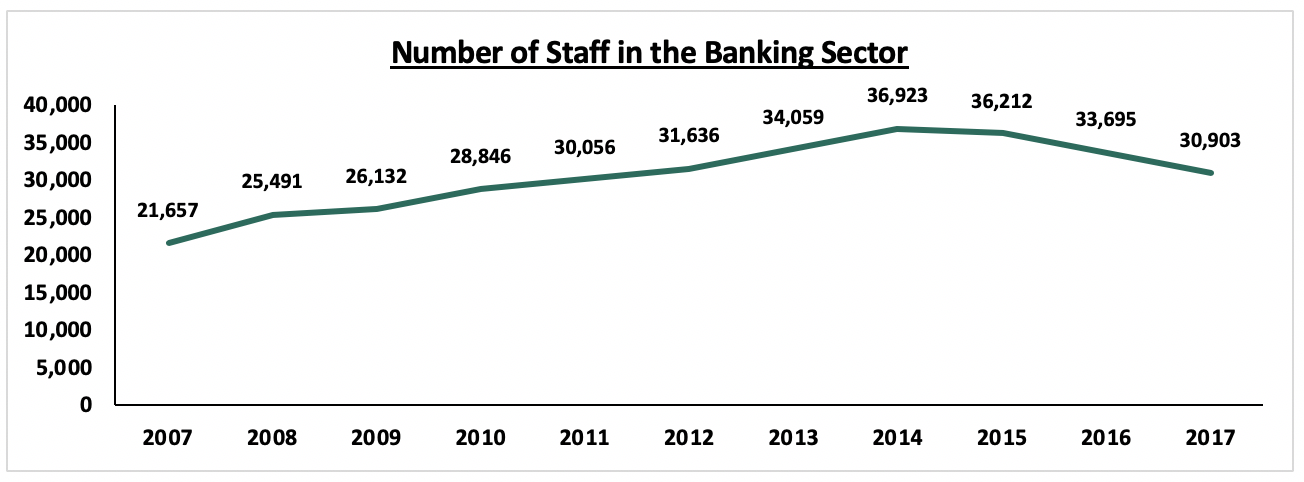
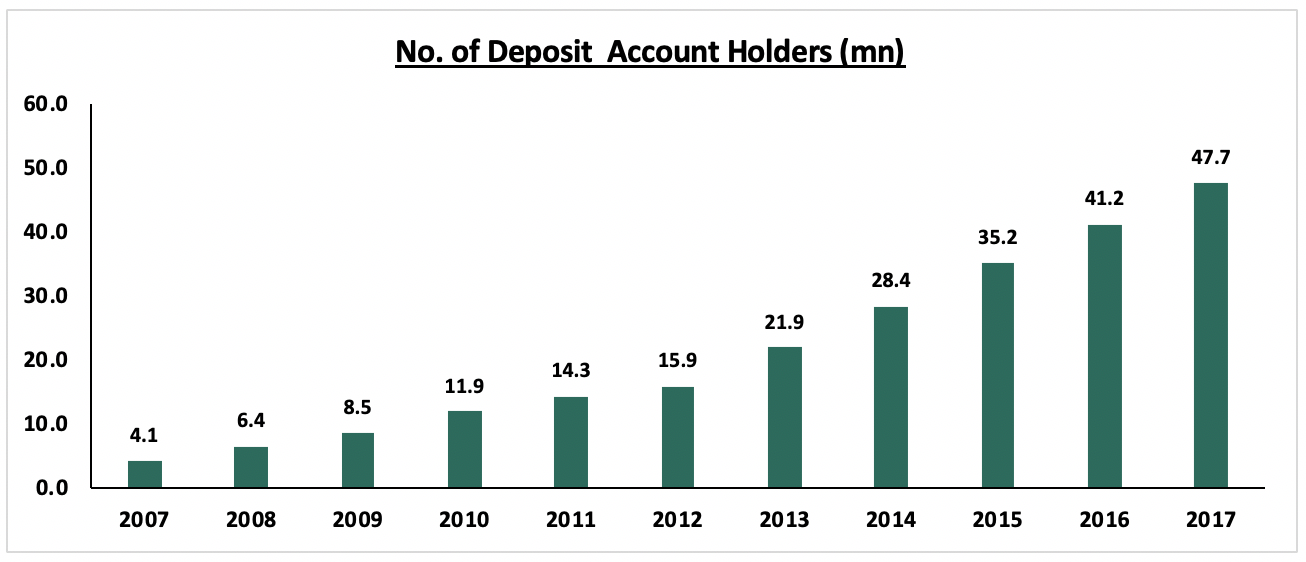
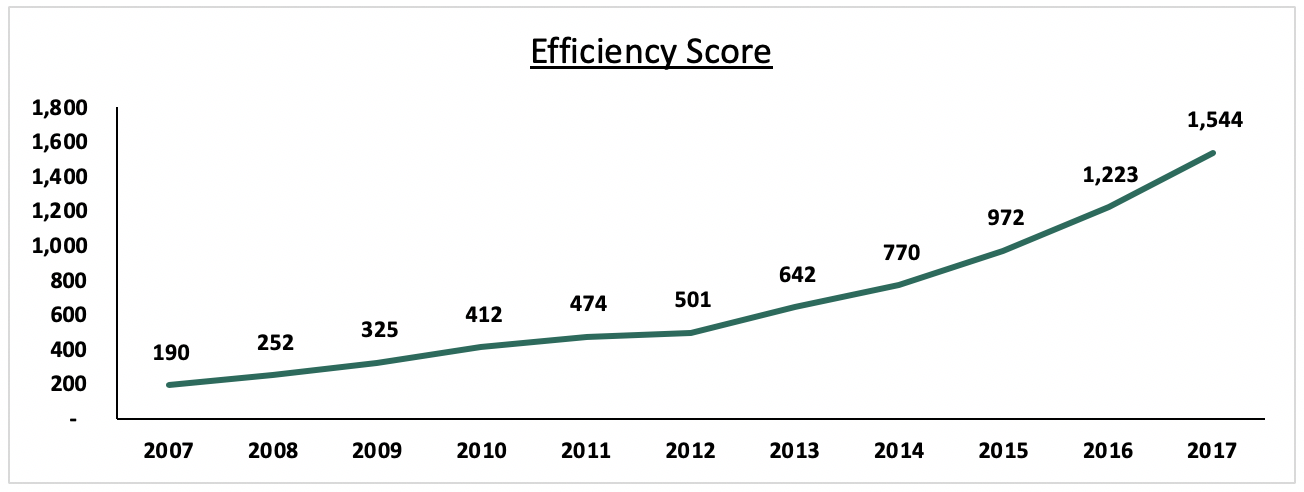
*Number of Deposit Accounts per Employee
Source: CBK annual report 2017
Digital Lending:
The digital lending space has grown at an accelerating pace in recent years. Since the launch of the M-Shwari platform in 2012, a vast number of platforms offering these services have emerged. Most recently, Safaricom launched Fuliza, an overdraft facility that enables M-Pesa customers to send or complete mobile payment transactions even if their M-Pesa balance is below the required amount. In the first week of its launch, more than one million customers signed up and borrowed Kshs 1.0 bn, and after one month of operation had borrowed Kshs 6.2 bn. This growth in digital lending can be in part, attributed to the following;
- Implementation of the Interest Rate Cap: The interest rate cap came into effect on September 14th, 2016, limiting the borrowing rates to 4.0% points above the Central Bank Rate, currently at 9.0%. It was implemented following concerns raised by the public regarding the high cost of credit in Kenya, which was viewed as a hindrance to credit access by a large segment of the population. Implementation of the law, was therefore, expected to lower the cost of credit and increase access to credit. The result however, has been a substantial decline in credit growth, as indicated by a declining private sector credit growth, which has declined to 2.4% in December 2018 compared to a 5-year average of 11.8%, and prior to the rate cap legislation, the 3-year average was 11.8%. Majority of individuals and SME’s have been locked out from accessing credit, as banks have preferred to lend to the government as opposed to the public they perceive as high risk.
- High Mobile Penetration Rate:
According to the Communications Authority report for September 2018, Kenya’s mobile penetration stands at 100.1%. Data from the Jumia Mobile report estimates smartphone penetration to be approximately 45.5% of mobile users.
The above factors result in: (i) a gap in credit supply, and (ii) a channel to deliver the required services to the target market. Digital lending addresses this issue by providing instant unsecured loans through mobile platforms. The entire process beginning from customer registration, loan application, underwriting, disbursements and repayment can be fully automated. As such, various start-ups are now betting on this approach to disrupt traditional models of lending.
Section III: Emerging Technological Trends in the Industry and Their Expected Impact
Having looked at the existing technological trends and their impact on the industry, we will now look at emerging trends and how we expect them to shape the future of the industry.
Blockchain Technology: This is simply a computer technology that enables information to be shared within a group in such a manner that all records are permanent and visible to all stakeholders. Combining shared databases and cryptography, blockchain technology allows multiple parties to have simultaneous access to a constantly updated digital ledger that cannot be altered. Although initially treated with skepticism, banks and other firms have begun to test this technology in various aspects such as:
- Clearing and Settlement: This is where the technology can be used to improve efficiency. An example of this implementation is where The Australian Securities Exchange announced its aim to shift much of its post-trade clearing and settlement on to a blockchain system.
- Customer Identity: Banks have been trying for years to set up a shared digital utility to record customer identities and keep them updated. Blockchain could offer a solution because of its cryptographic protection and its ability to share a constantly updated record with many parties.
- Cryptocurrency: Cryptocurrencies are an implementation of block chain technology to create a digital currency that is not held in any centralized database. In this case, the currency database is held by each individual coin holder. This way, each exchange transaction is recorded and updated on everyone’s ledger and the information cannot be altered afterwards without all parties being in consent. As such, this makes crypto currencies secure. Similar to fiat currency that is purely backed by the government’s assurance, cryptocurrencies don’t have an underlying asset. Their value is derived purely from the law of supply and demand and, having no regulating body, are highly sensitive to public sentiment making them highly volatile.
- Smart contracts: Smart contracts are self-executing contracts with the terms of the agreement between buyer and seller being directly written into lines of code. The code and the agreements contained therein exist across a distributed, decentralized blockchain network. Smart contracts permit trusted transactions and agreements to be carried out among anonymous parties without the need for a central authority, legal system, or external enforcement mechanism. They render transactions traceable, transparent, and irreversible.
Despite its misguided sole association to cryptocurrencies, block chain has much more to offer and will play a key role in transforming the financial services sector.
Open Banking: Open banking, also known as open bank data, is a system that provides a user with a network of financial institutions’ data through the use of application programming interfaces (APIs). The Open Banking Standard defines how financial data should be created, shared and accessed. By relying on networks instead of centralization, open banking helps financial services customers to securely share their financial data with other financial institutions. Benefits include more easily transferring funds and comparing product offerings to create a banking experience that best meets each user’s needs in the most cost-effective way. In Kenya, Equity Bank, launched the Jenga Payment Gateway API. The API provides access between telcos, mobile wallets, card associations, governments, credit bureaus, and banks. Between such entities, users can send and receive money, check balances and statements, open accounts and among other functions. Businesses can utilize the API for payments, charges, collections, and more.
Fintech Regulation: Financial regulation is becoming increasingly complex and intrusive, with major financial institutions facing multiple regulatory jurisdictions, and regulators requesting increasing amounts of data from firms. Rapid improvements in technology are enabling financial services’ business models that were simply not possible 15 to 20 years ago. However, these innovations in finance operate within a regulatory system that is struggling to keep pace. In 2018 the government of Kenya announced plans to set up a fintech regulatory sandbox. This will provide a testing environment for new business models that are not protected by current regulation, or supervised by regulatory institutions. These testing grounds are especially relevant in the fintech world, where there is a growing need to develop regulatory frameworks for emerging business models. The purpose of the sandbox is to adopt compliance with strict financial regulations to the growth and pace of the most innovative companies, in a way that does not smother the fintech sector with rules, but also does not diminish consumer protection.
Section IV: Outlook on the Extent to Which Technology Will Shape the Future of the Industry
Given the impact of the highlighted innovations, our outlook on the Kenyan financial services sector going forward in this regard is as follows:
- Increased Leverage on Technology to Increase Operational Efficiency: We expect financial institutions to push their bias towards digital channels with aim of reducing costs. The efficiency score in banking is expected to continue increasing and employment in the sector will consequently be adversely affected. We expect more staff layoffs and branch closures as business continue to streamline their models.
- Automation of Investment and Advisory Services: The investments management industry’s main challenge is lack of public awareness. Those with wealth are unaware of where and how to allocate their investments. To tackle this, investment managers rely on financial advisors to seek out these individuals at a commission. In developed markets, a new tool has been deployed to better tackle this challenge; Robo-advisors are a class of financial advisors that provide financial advice or Investment management online with moderate to minimal human intervention. By bringing services to a broader audience, at a lower cost compared to traditional human advice Robo-advisors are bound to cause a major disruption. As computer literacy becomes more widespread, we also expect the process of investing to be fully automated. Investors of the future will have the ability to invest their funds, monitor the performance of their portfolio, and liquidate their investments in real time using their smart phone or personal computers.
- Small Scale Adoption of Cryptocurrencies: Various cryptocurrencies have already been adopted by isolated groups as an authorised means of exchange. Their fundamental basis however is the fact that no governing body can regulate them, making governments unwilling to adopt them. In its annual report, the CBK reiterated that it does not recognize cryptocurrencies as legal tender and is of the opinion that despite the positive influence of technology, there lies a potential of great risk in the event that the technology fails or is misused. There is thus the need to ensure that robust controls are in place to ensure that the risks and opportunities associated with emerging technologies are balanced. We expect the CBK to maintain its stance on the same and do not expect cryptocurrencies to have any full-scale implementation in the near future. We however expect small groups of individuals and businesses to experiment with various digital currencies.
- Increased Focus on Cyber Security: We expect businesses to be heavily reliant on digital systems. It therefore follows that measures will be taken to protect sensitive information from cyberattacks. We expect a well-defined regulatory guidance to be put in place to ensure that cybersecurity protocols are observed. In Kenya, CBK made a step towards addressing this issue in a guidance note on cybersecurity in 2017. The note set out the regulatory standards to industry participants on assessment and mitigation of cybersecurity threats. Applying to all payment service providers (PSPs) authorized under the National Payment System, the guidelines were aimed at:
- Creating a safer and more secure cyberspace that underpins information system security priorities, to promote stability of the Kenyan payment system sub-sector,
- Establishment of a co-ordinated approach to the prevention and combating of cybercrime,
- Up-scaling the identification and protection of critical information infrastructure (CII);
- Promoting compliance with appropriate technical and operational cybersecurity standards.
In closing, we expect the financial services industry to advance its digital evolution as financial institutions learn and integrate with technology.
Disclaimer: The Cytonn Weekly is a market commentary published by Cytonn Asset Managers Limited, “CAML”, which is regulated by the Capital Markets Authority, CMA and the Retirement Benefits Authority, RBA. However, the views expressed in this publication are those of the writers where particulars are not warranted. This publication is meant for general information only, and is not a warranty, representation, advice or solicitation of any nature. Readers are advised in all circumstances to seek the advice of a registered investment advisor.
- Talk to us
- Kenya
- P.O Box 20695 - 00200, Nairobi, Kenya
- Cell +254(0) 709 101 000
- Tel +254(0) 20 3929 000
- WhatsApp +254(0) 748 070 000
- United States
- +1 (240) 368-6217
- DOWNLOAD OUR APP
-


- Kenya
- Cysuites work spaces, Church Rd, Westlands, Nairobi, Kenya
- USA
- Suite 1150, 1775 Eye Street NW, USA, Washington DC 20006, USA
- Investments
- High Yield
- Private Equity
- Real Estate
- Real Estate
- RiverRun Estates
- Cytonn Towers
- The Ridge
- Taraji Heights
- The Alma