Kenya Listed Banks Q3’2017 Report, & Cytonn Weekly #49/2017
By Cytonn Research Team, Dec 10, 2017
Executive Summary
Fixed Income
During the week, T-bills were undersubscribed, with the overall subscription rate coming in at 79.5%, compared to 75.3% recorded the previous week. Yields on the 91 and 182-day papers remained unchanged at 8.0% and 10.5%, respectively, while the yield on the 364-day paper rose to 11.1% from 11.0%, the previous week. The World Bank has cut its economic growth projections for Kenya for 2017 to 4.9% from 5.5% previously, due to political uncertainty and weak private sector credit growth. We still expect the economy to grow at a rate of between 4.7% - 5.2% for 2017;
Equities
During the week, the equities market recorded mixed trends with NASI gaining 1.3%, while NSE 25 and NSE 20 recorded losses of 0.5% and 1.7%, respectively, taking their YTD performance to 31.4%, 23.9% and 17.7% for NASI, NSE 25 and NSE 20, respectively. Safaricom and Commercial Bank of Africa (CBA) plan to cut the lending rate on M-Shwari loans, a move aimed at defending their market share in the mobile micro loans segment that has recently attracted lenders including Equity Group, KCB Group and Co-operative Bank;
Private Equity
In what is expected to be the last of a series of share sales, Barclays Plc has sold 7.0% of its stake in Barclays Africa to undisclosed existing and new investors, bringing its stake to 14.8% from an initial holding of 62.3%. Vivo Energy Holding B.V. has agreed to enter into a share swap agreement with Engen Holdings Proprietary (Pty) Limited. The transaction will see Vivo Energy Holdings purchase shares in Engen Holdings in exchange for shareholding in Vivo Energy with a possible cash consideration;
Real Estate
In the hospitality sector, PrideInn Hotels of Kenya announced high tourist bookings at the Kenyan Coast, attributing this to (i) improved infrastructure with the development of the Standard Gauge Railway (SGR), and (ii) recovery from the electioneering period that was marked with reduced occupancy. In addition, the retail sector continues to expand as French Retailer Carrefour and local coffee chain Java House open new outlets in Nairobi, at the Junction Mall and Central Business District (CBD), respectively;
Focus of the Week
Following the release of the Q3’2017 results by Kenyan listed banks, we analyse the results of the listed banks over the first three quarters of the year to determine which banks are the most attractive and stable for investment from a franchise value and from a future growth (intrinsic value) perspective. The theme for the quarter is “What Next for the Kenyan Banking Sector?” as we assess what factors will be crucial for the sustainability of the Kenyan banking sector going forward.
- Cytonn Investments Management Plc released Q3’2017 unaudited financials, posting a 127.4% growth in revenue to Kshs 2.0 bn, from Kshs 0.9 bn in September 2016, with Group profit rising by 421.3% to Kshs 537.0 mn, from Kshs 103.0 mn over the same period. Investment in our deal pipeline, worth Kshs 82.0 bn recorded gains of Kshs 922.5 mn over the reporting period, coupled with revenue growth of 111.3%, largely driven by investments in the financial services sector. Commenting on performance, Edwin H. Dande, Managing Partner & CEO, said that. “Our strong performance reflects the infancy and potential of structured products, which remain untapped in this market. It also reflects the success of our diversification strategy from real estate into broader financial services.” For more information and details, see the press release here and the financials here
- On Saturday, 9th December 2017, we held an Open Day for Amara Ridge, one of our contemporary Real Estate projects, to deliver units to the owners following completion of the project. See Event Note here and photos here. To visit either the Amara Ridge or The Alma show houses, please register here
- Our Managing Partner & CEO, Edwin H. Dande, trained Master’s Degree Students at the University of Nairobi - Chiromo Campus, on Entrepreneurship and Innovation. The training sought to enlighten the students on the basic considerations when starting, operating, and growing a business. See Event Note here. To get free financial training for your institution, please email us at clientservices@cytonn.com
- Our Head of Private Equity Real Estate, Shiv Arora, discussed our Q3’2017 Group Financial Results. Watch Shiv Arora on CNBC here
- Our Investment Analyst, Caleb Mugendi, discussed the World Bank’s economic growth cut for Kenya and other market trends. Watch Caleb Mugendi on CNBC here
- In our Legal note this week, we discuss the National Environmental Tribunal, a quasi-judicial tribunal that hears any disputes regarding the exercise of power by the National Environmental Management Authority (NEMA), on how they can balance between economic and environmental rights. See the Legal Note here
- We continue to showcase our real estate developments through weekly site visits. Watch progress videos and pictures of The Alma, Amara Ridge, The Ridge, and Taraji Heights. The site visits target both investors looking to invest in real estate directly and those interested in high yield investment products to familiarize themselves with how we support our high yields. Key to note is that our cost of capital is priced off the loan markets where all-in pricing ranges from 16.0% to 21.0% and our yield on real estate developments ranges from 23.0% to 25.0%, hence our top-line gross spread is about 6.0%. If interested in attending the site visits, kindly register here
- We continue to see very strong interest in our Private Wealth Management training (largely covering financial planning and structured products), which is at no cost, and is held bi-weekly, but is open only to pre-screened participants. We also continue to see institutions and investment groups interested in the trainings for their teams. The Wealth Management Trainings are run by the Cytonn Foundation under its financial literacy pillar, and if interested in the training for your employees or investment group please get in touch with us through clientservices@cytonn.com or book through this link Wealth Management Training. To view the wealth management training topics click here
- For recent news about the company, see our news section here
- We have 10 investment-ready projects, offering attractive development and buyer targeted returns of around 23.0% to 25.0% p.a. See further details here: Summary of investment-ready projects
- To invest in any of our current or upcoming real estate projects, please visit Cytonn Real Estate
- Cytonn Towers, where we are only selling residential units in the first phase of residential apartments, is currently about 20.0% sold. See Cytonn Towers
- The Alma, which is 55.0% sold. See The Alma
- Amara Ridge has currently 100.0% uptake See Amara Ridge
- Situ Village is currently 22.0% sold. See Situ Village
- The Ridge (Phase 1) is currently 31.0% sold. See The Ridge
- Taraji Heights is currently 14.0% sold. See Taraji Heights
- RiverRun Estates (Phase 1) is currently 11.0% sold. See RiverRun Estates
- With over 10 investment ready projects worth over Kshs 82.0 billon of project value, we shall be very selective on new real estate projects going forward, only focusing on Joint Ventures and real estate opportunities with deep value. We are increasingly focused on private equity deals. Should you have any deals in banking, insurance, education, hospitality and technology sectors, kindly email a teaser to PE@cytonn.com
- We continue to beef up the team with ongoing hires for a Senior Manager, Hospitality and Hospitality Business Manager among others. Visit our website Careers at Cytonn to apply.
During the week, T-bills were undersubscribed, with the overall subscription rate rising marginally to 79.5%, from 75.3% recorded the previous week, as liquidity improved supported by government payments amounting to Kshs 47.8 bn. The subscription rates for the 91, 182 and 364-day papers came in at 125.5%, 64.2%, and 76.4% compared to 212.7%, 29.3% and 66.4%, respectively, the previous week. Yields on the 91 and 182-day papers remained unchanged at 8.0% and 10.5%, respectively, while the yield on the 364-day paper rose to 11.1% from 11.0% last week. The overall acceptance rate came in at 94.9%, compared to 84.7% the previous week, with the government accepting a total of Kshs 18.1 bn of the Kshs 19.1 bn worth of bids received, against the Kshs 24.0 bn on offer. The government is still behind its domestic borrowing target for the current fiscal year, having borrowed Kshs 72.1 bn, against a target of Kshs 181.4 bn (assuming a pro-rated borrowing target throughout the financial year of Kshs 410.2 bn budgeted for the full financial year as per the Cabinet-approved 2017 Budget Review and Outlook Paper (BROP)).
Liquidity in the money market improved during the week, with a net liquidity injection of Kshs 29.3 bn, compared to a net liquidity withdrawal of Kshs 11.7 bn the previous week, supported by the government payments of Kshs 47.8 bn. Consequently, the average interbank rate declined to 8.0% from 8.6% recorded the previous week, while the average volumes traded in the interbank market increased by 27.8% to Kshs 27.3 bn from Kshs 21.4 bn the previous week. It is important to note that for this week, banks holding of excess liquidity (Cash Reserve Requirement (CRR)) stood at Kshs 7.0 bn above the 5.25% requirement, from a shortfall of Kshs 1.7 bn the previous week.
Below is a summary of the money market activity during the week:
|
all values in Kshs bn, unless stated otherwise |
|||
|
Weekly Liquidity Position – Kenya (Week 49/2017) |
|||
|
Liquidity Injection |
|
Liquidity Reduction |
|
|
Government Payments |
47.8 |
Transfer from Banks - Taxes |
16.3 |
|
T-bills Redemption |
21.8 |
T-bills (Primary issues) |
17.3 |
|
Reverse Repo Purchases |
21.5 |
Reverse Repo Maturities |
28.2 |
|
Total Liquidity Injection |
91.1 |
Total Liquidity Withdrawal |
61.8 |
|
|
|
Net Liquidity Injection |
29.3 |
For December’s auction, the Kenyan Government has reopened two bonds, a 15-year (FXD 1/2008/15) and a 10-year (FXD 1/2017/10) with effective tenors of 5.3 years and 9.6 years, respectively. The government will be seeking to raise Kshs 30.0 bn for budgetary support and the coupons are at 12.5% and 13.0% for the 15-year and 10-year bonds, respectively. The bonds are currently trading at yields of 12.5% and 12.8% for the 15-year and 10-year bonds in the secondary market, respectively, thus we expect bids at yields of between 12.5% - 13.0% and 12.8%-13.3% for the 15-year and 10-year bonds, respectively.
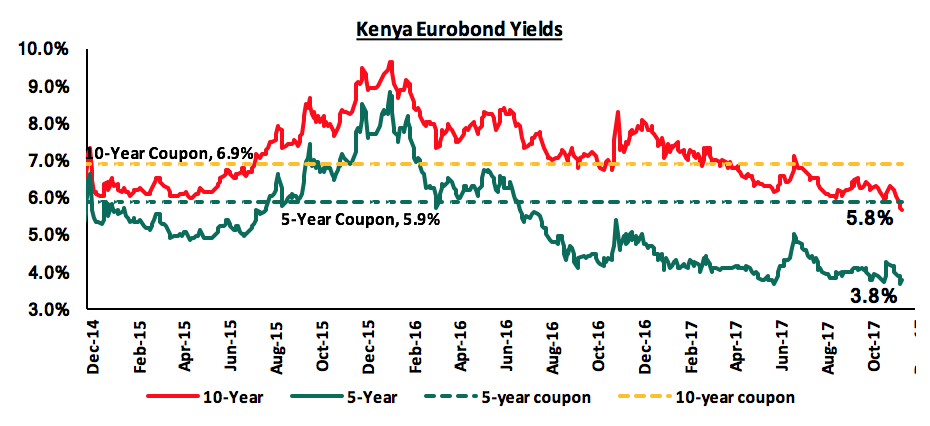
According to Bloomberg, yields on the 5-year and 10-year Eurobonds remained unchanged during the week, to close at 3.8% and 5.8%, respectively. Since the mid-January 2016 peak, yields on the Kenya Eurobonds have declined by 5.0% points and 3.8% points for the 5-year and 10-year Eurobonds, respectively, due to the relatively stable macroeconomic conditions in the country. The declining Eurobond yields and stable rating by Standard & Poor (S&P) are indications that Kenya’s macro-economic environment remains stable and hence an attractive investment destination. However, concerns from Moody’s and the International Monetary Fund (IMF) around Kenya’s rising debt to GDP levels may see Kenya receive a downgraded sovereign credit rating.
The Kenya Shilling remained relatively unchanged against the US Dollar during the week to close at Kshs 103.1 after hitting a high of 102.9 on Wednesday since mid-September. The stability of the shilling during the week was supported by foreign investor inflows into the local debt market, which offset dollar demand from importers. On a year to date basis, the shilling has depreciated against the dollar by 0.6%. In our view, the shilling should remain relatively stable against the dollar in the short term supported by (i) expected calm in the political front following the conclusion of the presidential elections, (ii) the weakening of the USD in the global markets as indicated by the US Dollar Index, which has shed 8.0% year to date, though the dollar could gain if the Federal Reserve hikes rates leading to a depreciation of the shilling, and (iii) the CBK’s intervention activities, as they have sufficient forex reserves, currently at USD 7.1 bn (equivalent to 4.8 months of import cover).
The Kenyan economy appears to be on a path of recovery after a challenging economic environment in the better part of this year, with drought and the elongated election period being the key challenges. According to the Stanbic Bank’s Monthly Purchasing Manager’s Index (PMI), the index rose to 42.8 in the month of November from a low of 34.4 in October, an indication of better economic sentiments. Private sector economic activity is expected to rebound going forward, supported by (i) the favourable weather conditions supporting agricultural activity, (ii) political uncertainty easing after the election period, and (iii) inflation remaining within a range favourable for economic growth. However, the World Bank has cut its economic growth projections for Kenya in 2017 to 4.9% from 5.5% previously, due to (i) lower than historical private sector credit growth at 2.0% in October 2017 compared to a 5-year average of 14.4%, and (ii) political uncertainty that surfaced during the year. The bank has also cut the projections for 2018 and 2019 to 5.5% and 5.8% from 5.8% and 6.1% previously, respectively, highlighting that the country needs to employ austerity measures in regards to government borrowing and focus on private lending instead to spur job creation and economic growth. This comes after the International Monetary Fund (IMF) lowered its projection to 5.0% from 5.3% in October due to political jitters. We still expect the economy to grow at a rate of between 4.7% - 5.2% for 2017, supported by (i) the continuing government expenditure on infrastructure, (ii) the continuing recovery of the tourism sector, and (iii) the continuing growth of the real estate sector, but to rebound in 2018 and remain stable in the medium to long-term.
The United States Federal Open Market Committee (FOMC) is set to meet on 12th and 13th December 2017 to assess the current state of the US economy and shed light on a possible rate hike. During the Fed’s previous meeting held in October, the committee decided to maintain the Fed rate within the band of 1.00% - 1.25%, citing (i) low inflation at 1.7% in September, that remained below the set target of 2.0%, and (ii) instability in the labour market, creating only 18,000 jobs in September due to adverse effects of the hurricane, compared to 156,000 jobs created in August. Previously, the Fed highlighted plans to accelerate its rate-hiking pace, hinting at three rate hikes in 2017 on expectations of improved economic performance this year. We expect the Fed to raise rates for the third time this year to a band of 1.25% - 1.50%, given that, (i) core inflation rose to 1.8% y/y in October, closer to the target of 2.0%, (ii) the labour market has since strengthened amid a challenging economic environment, adding approximately 261,000 new jobs in October, from 18,000 jobs in September, with the unemployment rate currently at 4.1%, which is below the full employment rate of 5.0%, and (iii) relatively strong economic growth, coming in at 3.3% in Q3’2017 compared to 2.8% in Q3’2016.
Rates in the fixed income market have remained stable, and we expect this to continue in the short-term. However, a budget deficit that is likely to result from depressed revenue collection creates uncertainty in the interest rates environment as any additional borrowing in the domestic market to plug the deficit could lead to upward pressures on interest rates. Our view is that investors should be biased towards short-to medium term fixed income instruments to reduce duration risk.
During the week, the equities market recorded mixed trends with NASI gaining 1.3%, while NSE 25 and NSE 20 recorded losses of 0.5% and 1.7%, respectively, taking their YTD performance to 31.4%, 23.9% and 17.7% for NASI, NSE 25 and NSE 20, respectively. This week’s performance was driven by gains of 3.7% and 0.9% by KCB Group and Safaricom, respectively, while Equity Group and Co-operative Bank lost 3.0% and 1.8%, respectively. Since the February 2015 peak, the market has lost 1.3% and 31.8% for NASI and NSE 20, respectively.
Equities turnover increased by 20.6% to USD 32.7 mn from USD 27.1 mn the previous week. Foreign investors remained net buyers with a net inflow of USD 3.3 mn compared to a net inflow of USD 2.1 mn recorded the previous week. We expect the market to remain supported by improved investor sentiment once uncertainty dissipates, as investors take advantage of the attractive stock valuations.
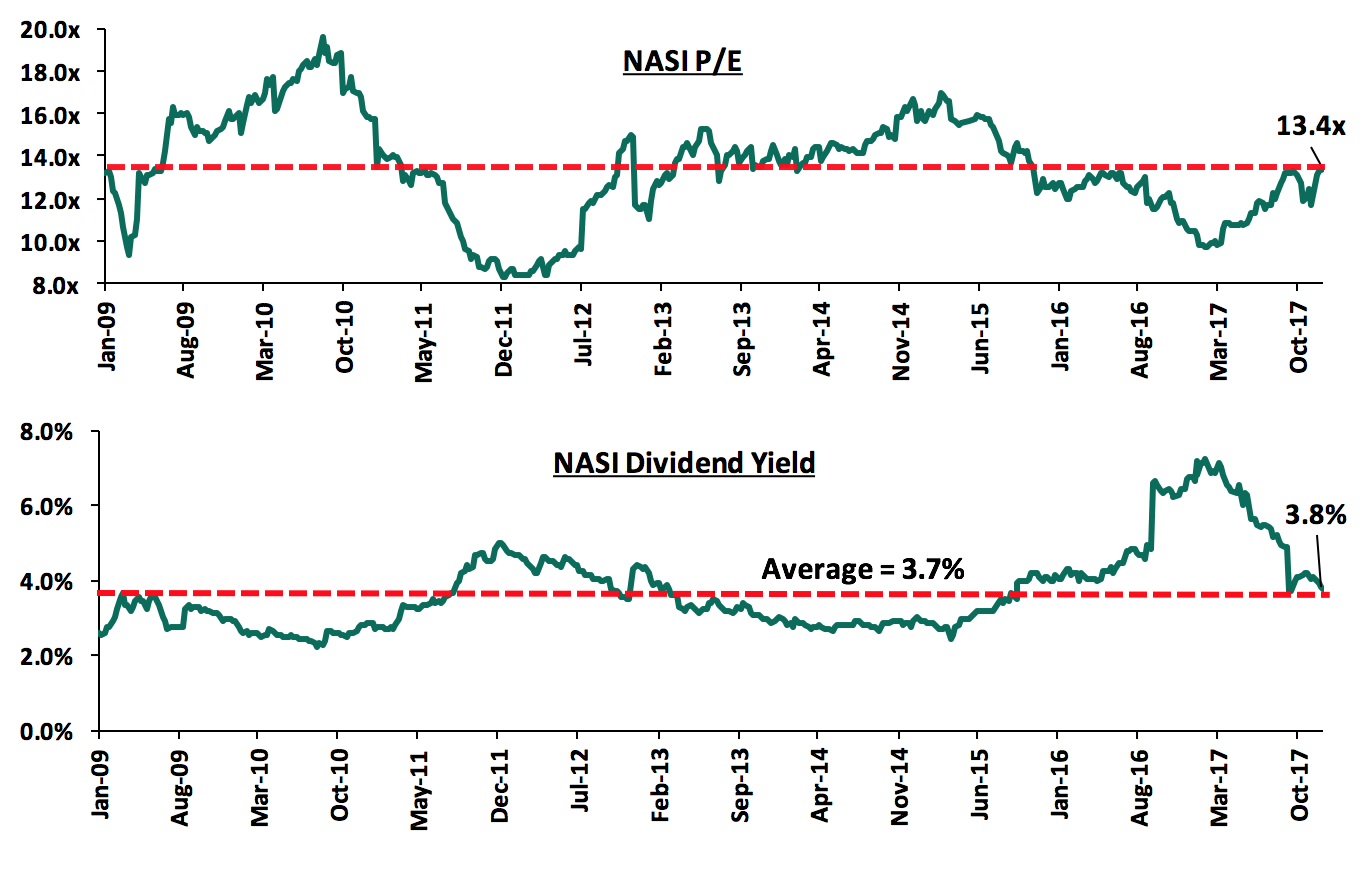
The market is currently trading at a price to earnings ratio (P/E) of 13.4x, similar to the historical average of 13.4x, and a dividend yield of 3.8%, compared to a historical average of 3.7%. In our view, there still exist pockets of value in the market, with the current P/E valuation being 21.0% below the most recent peak of 16.9x in February 2015. The current P/E valuation of 13.4x is 37.8% above the most recent trough valuation of 9.7x experienced in the first week of February 2017, and 60.9% above the previous trough valuation of 8.3x experienced in December 2011. The charts below indicate the historical P/E and dividend yields of the market.
Safaricom and Commercial Bank of Africa (CBA) plan to cut the lending rate on M-Shwari loans, a move aimed at defending their market share in the mobile micro loans segment that has attracted lenders including Equity Group, KCB Group and Co-operative Bank, which offer loans to their clients through their mobile banking apps. Other players in the segment include Tala and Branch, who disburse loans through android apps with the amount one can lend dependent on the borrower’s M-PESA transaction history, and other factors such as size of payroll and frequency of payment. M-Shwari, which was rolled out 5-years ago to serve the section of the borrowers locked out of loans market for lack of collateral and a credit history, charges a one-off facility fee of 7.5% on the loan. As at March 2017, registered customers on M-Shwari stood at 18.3 mn from 14.0 mn in March 2017, while total cumulative loans issued under the platform grew by 17.0% y/y to Kshs 7.4 bn per month as at March 2017 from Kshs 6.3 bn per month in March 2016. Fees charged on the M-Shwari facility has been a key driver of growth in CBA’s Non-Funded Income (NFI), with the bank reporting a 9.7% y/y growth in NFI to Kshs 8.1 bn in Q3’2017 from Kshs 7.4 bn in Q3’2016. Fees and commissions on loans and advances account for 56.3% of the bank’s NFI and recorded a 9.9% growth to Kshs 4.6 bn in Q3’2017 from Kshs 4.2 bn in Q3’2016. CBA’s gross non-performing loans increased slightly by 0.9% y/y to Kshs 12.9 bn in Q3’2017 from Kshs 12.8 bn. However, the increase may not be attributed to M-Shwari loans as the bank reported that the non-performing micro loans are still at acceptable levels. The reduction in fees is likely to result in growth in customer numbers hence driving the uptake of micro loans; especially in the current era of interest rates capping that has made most banks prefer investment in government securities as opposed to lending to relatively riskier borrowers. This announcement comes even as Safaricom faces possible reduction in market share in the mobile operator segment following the recent entry by Jamii Telecom Limited (JTL), which seeks to offer low-cost data bundles and free on-network calls. JTL effectively becomes the fourth mobile operator in the market that has been dominated by Safaricom with a market share of 72.6%, while Airtel, Telkom and Finserve (Equitel) have market shares of 15.3%, 7.2% and 4.6%, respectively, according to the latest data by Communications Authority of Kenya. We however expect this to have minimal impact on Safaricom supported by the lock-in effects of the money transfer service, M-PESA, with Safaricom’s share by value of transactions currently at 74.2%.
In order to ensure that the ranking of companies in the Cytonn Corporate Governance Report (Cytonn CGR) is up to date, we continually update the rankings whenever there are changes on any of the 24 metrics that we track and how they impact on the ranking. Below are board changes for this week:
- Mr. Mohamed Ahmed Mohamed was appointed as the acting Chief Executive Officer (CEO) of Uchumi Supermarkets following the resignation of Dr. Julius Kipng’etich. Mr. Mohamed was previously Uchumi’s Chief Finance Officer (CFO). Uchumi’s score has remained at 60.4% as no metric has been affected by the replacement of the CEO. The rank is therefore maintained at Position 34, and,
- Standard Bank Group has appointed Mr. Charles Mudiwa as CEO of Stanbic Bank Kenya, following reassignment of the former CEO, Mr. Philip Odera, to a new role within the group. Stanbic’s score has maintained at 56.3%, ranking it at Position 41.
Below is our Equities Universe of Coverage:
|
all prices in Kshs unless stated otherwise |
||||||||
|
No. |
Company |
Price as at 01/12/17 |
Price as at 08/12/17 |
w/w Change |
YTD Change |
Target Price* |
Dividend Yield |
Upside/ (Downside)** |
|
1. |
NIC*** |
37.3 |
36.0 |
(3.4%) |
38.5% |
61.4 |
3.5% |
74.0% |
|
2. |
KCB Group*** |
40.8 |
42.3 |
3.7% |
47.0% |
59.7 |
7.1% |
48.4% |
|
3. |
DTBK |
194.0 |
192.0 |
(1.0%) |
62.7% |
281.7 |
1.4% |
48.1% |
|
4. |
Barclays |
9.9 |
9.8 |
(0.5%) |
15.6% |
12.8 |
10.2% |
40.8% |
|
5. |
Liberty |
13.8 |
12.4 |
(10.1%) |
(6.1%) |
16.4 |
0.0% |
32.3% |
|
6. |
I&M Holdings |
123.0 |
122.0 |
(0.8%) |
35.6% |
150.4 |
2.5% |
25.7% |
|
7. |
Jubilee Insurance |
470.0 |
469.0 |
(0.2%) |
(4.3%) |
575.4 |
1.9% |
24.5% |
|
8. |
Kenya Re |
20.3 |
20.3 |
0.0% |
(10.0%) |
24.4 |
3.7% |
24.2% |
|
9. |
Co-op Bank |
16.3 |
16.0 |
(1.8%) |
21.2% |
18.6 |
5.8% |
22.0% |
|
10. |
CIC Group |
6.0 |
5.6 |
(6.7%) |
46.1% |
6.2 |
1.8% |
13.5% |
|
11. |
Equity Group |
42.3 |
41.0 |
(3.0%) |
36.7% |
42.3 |
4.4% |
7.6% |
|
12. |
Sanlam Kenya |
30.0 |
30.0 |
0.0% |
9.1% |
31.4 |
1.0% |
5.5% |
|
13. |
HF Group*** |
11.5 |
11.3 |
(1.7%) |
(19.6%) |
11.7 |
0.8% |
5.0% |
|
14. |
Britam |
15.2 |
14.9 |
(2.0%) |
48.5% |
15.2 |
1.5% |
3.9% |
|
15. |
Stanbic Holdings |
82.0 |
82.0 |
0.0% |
16.3% |
79.0 |
5.1% |
1.4% |
|
16. |
Standard Chartered |
215.0 |
211.0 |
(1.9%) |
11.6% |
201.1 |
4.2% |
(0.5%) |
|
17. |
Safaricom |
27.5 |
27.8 |
0.9% |
44.9% |
23.0 |
4.7% |
(12.4%) |
|
18. |
NBK |
10.1 |
9.8 |
(3.5%) |
35.4% |
5.6 |
0.0% |
(42.9%) |
|
*Target Price as per Cytonn Analyst estimates |
|
|
|
|
|
|||
|
**Upside / (Downside) is adjusted for Dividend Yield |
||||||||
|
***Banks in which Cytonn and/or its affiliates holds a stake |
||||||||
|
For full disclosure, Cytonn and/or its affiliates holds a significant stake in KCB Group and NIC Bank, ranking as the 5th largest local institutional investor and the 9th largest shareholder, respectively |
||||||||
We maintain a “NEUTRAL” view on equities for investors with short-term investment horizon since, despite the lower earnings growth prospects for this year, the market has rallied and brought the market P/E back to its’ historical average. Pockets of value exist, with a number of undervalued sectors like Financial Services, which provide an attractive entry point for long-term investors and thus we are positive for investors with a long-term investment horizon.
Barclays Plc, on 5th December 2017, sold 7.0% of its stake in Barclays Africa, a sale of 59.3 mn shares. At market price, of ZAR 161.5 per share (USD 11.8 per share), the estimated price of the shares is ZAR 9.6 bn (USD 0.7 bn). The sale is expected to be the last in a series of sales aimed at reducing Barclays Plc’s shareholding in Barclays Africa. The share sale began in May 2016, when Barclays Plc had 62.3% shareholding and it first sold 12.2% of its shares to bring down its stake in Barclays Africa to 50.1%. In May 2017, Barclays Plc sold another 26.7% of shares in Barclays Africa, further reducing their shareholding to 23.4%. Barclays Plc further contributed amounts equivalent to 1.5% of its share capital towards a broad-based black economic empowerment scheme by Barclays Africa. The latest share sale of 7.0% will see Barclays Plc’s stake in Barclays Africa stand at 14.8%, from where they will not be looking to divest further shareholding, according to the Chief Executive Officer, Jes Staley. Since the first sale in May 2016, Barclays Africa’s share price has gained by 18.7% to ZAR 156.9 from ZAR 131.6 per share. The table below summarises the series of transactions:
|
Sale Period |
Share Price at Time (ZAR) |
Percentage Shareholding |
No. of Shares Sold |
Value at Market Price (ZAR) |
|
Initial Shareholding |
62.3% |
528,148,673.0 |
||
|
May-16 |
131.6 |
12.2% |
103,425,582.8 |
13,610,806,701.5 |
|
May-17 |
139.0 |
26.8% |
227,197,181.9 |
31,580,408,294.1 |
|
Date Not Disclosed |
- |
1.5% |
12,716,260.2 |
- |
|
5-Dec-17 |
161.5 |
7.0% |
59,342,547.5 |
9,583,821,426.1 |
|
Current Shareholding |
156.9 |
14.8% |
125,467,100.5 |
19,685,788,067.1 |
Direct Pay Online Group (DPO), a Kenyan internet payments firm, has acquired 100.0% stake of Setcom Ltd, a fintech company that operates instant electronic funds transfer (EFT) solutions in South Africa, for an undisclosed amount. The deal follows two other acquisitions by DPO this year, of Virtual Card Services and Pay thru South Africa, both providing online payment services. DPO currently operates in 12 African countries, including Kenya, Tanzania, Uganda and South Africa and has acquired firms in Namibia and Botswana, with further plans to expand into countries such as Nigeria, Ghana, DRC and Mozambique. The deal affirms DPO’s strategy to be the leading online payment solution in Africa, and is supported by investment made into the firm by Apis Partners, a London based private equity firm. In November this year, Apis injected funding of USD 5.0 mn (Kshs 519.0 mn) into DPO, funds that the firm mentioned would be used for expansion of operations and upgrade of its online systems. The continued interest by investors in technology-driven companies in Sub-Sahara Africa is catalysed by the rising need for technology products as more businesses seek to enhance efficiency and reduce costs.
Vivo Energy Holding B.V. has entered into a share swap agreement with Engen Holdings Proprietary (Pty) Limited, a subsidiary of Engen Limited. The transaction will see Vivo Energy Holdings purchase shares in Engen Holdings in exchange of an undisclosed shareholding in Vivo Energy with a possible cash consideration. Consequently, Vivo Energy will include an additional 271 service stations across 9 new countries, and in Kenya, where Vivo Energy already operates. Both entities will maintain their brands. In Kenya, Vivo Energy will acquire 17 of Engen’s service stations bringing their total service stations to 140, 36 stations short of the largest oil distributor, Total Kenya. In Kenya, Vivo has the second largest Kenyan market in both petroleum and lubricant sales, with 16% and 35% share, respectively, after Total, which has 18% and 40% share, respectively. Vivo Energy, which is jointly owned by Vitol and Helios Investments, each owning 60% and 40% stake, respectively, took over Shell stations in Africa earlier this year after Shell pulled out of Africa’s oil retailing business. The transaction is strategic for both parties as (i) Vivo energy will grow its footprint into 9 new countries in Africa, and (ii) Engen will leverage on the partnership to grow its network of 26 countries in Africa.
Private equity investments in Africa have experienced increasing investor interest attributed to (i) rapid urbanization, a resilient and adapting middle class and increased consumerism, (ii) the attractive valuations in Sub Saharan Africa’s private markets compared to its public markets, (iii) the attractive valuations in Sub Saharan Africa’s markets compared to global markets, and (iv) better economic projections in Sub Sahara Africa compared to global markets. We remain bullish on PE as an asset class in Sub-Sahara Africa. Going forward, the increasing investor interest and stable macro-economic environment will continue to boost deal flow into African markets.
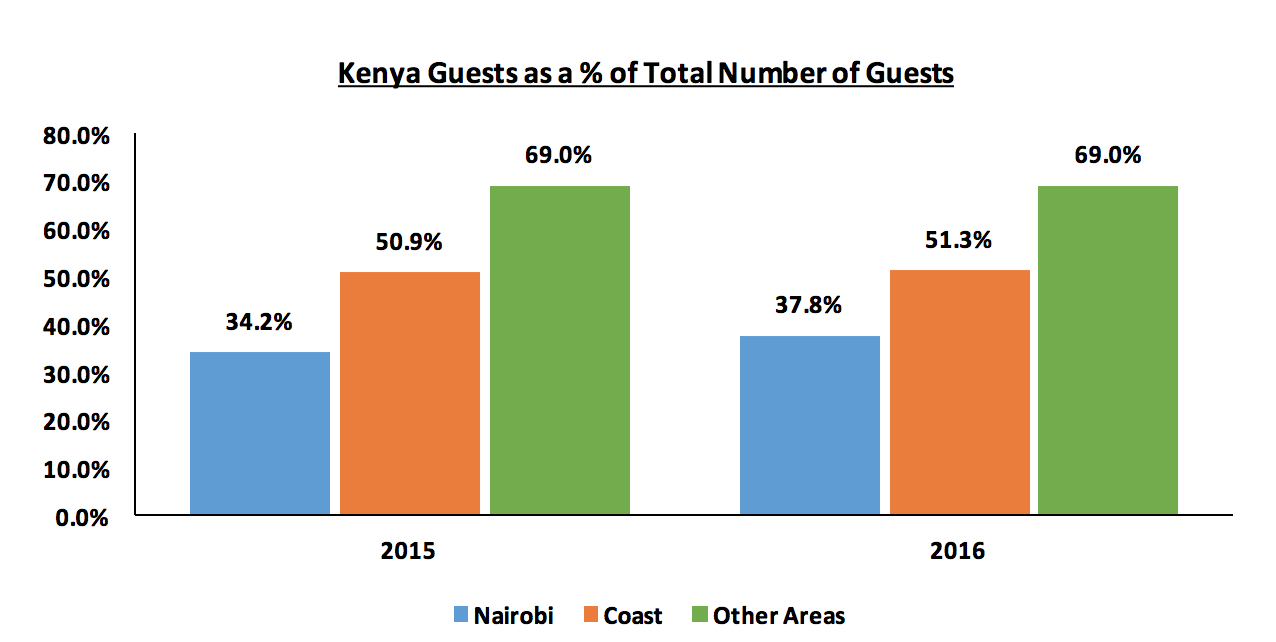
During the week, PrideInn Hotels of Kenya confirmed that the hotel had recorded high tourist bookings at the Kenyan Coast ahead of the festive season; and this they attribute to the improved infrastructure, following the launch of the SGR, and the increased demand following the conclusion of the Kenyan General Elections. According to the Managing Director, Hasnain Noorani, the hotel recorded 80.0% bed occupancy in November, compared to 35.0% in June this year. Other hoteliers at the Coast such as Sarova Whitesands have also recorded increased occupancies attributable to the Safari Rally, which kicked off mid-November attracting both local and international tourists; important to note is that the Safari Rally is a one-off event. The trend highlights not only the recovery of the sector after the electioneering period, but also the increase in domestic tourism. In 2016, according to KNBS, Kenyan guest nights in Nairobi were 37.8% of the total guest nights, an increase from 34.2% in 2015, while those at the Coast grew from 50.9% in 2015 to 51.3% 2016, as shown below:
Source: Kenya National Bureau of Statistics (KNBS)
As per the Cytonn Hospitality Report 2017, the hospitality sector was on an upward trend during H1’2017, with a 12.6% growth in international arrivals and a 0.1% points increase in accommodation and food services to the GDP, from 1.1% in 2016, to 1.2% in 2017. The report indicated that we expect continued recovery in the hospitality sector towards the end of the year, and in 2018, given the (i) improved security, (ii) growth of domestic tourism with Kenyans accounting for 54.2% of total bed nights in 2016 compared to 53.7% in 2015 and 46.9% recorded in 2014, (iii) growth of MICE where the number of conferences held in the country increased by 16.5% in 2016 compared to a 3.0% increase in 2015, (iv) aggressive government marketing by Kenya Tourism Board which has helped restore confidence among key international markets such as Europe, USA, as well as in new emerging markets in Africa and Asia (According to the World Travel and Tourism Council’s (WTTC) 2017 report, the Kenyan Government increased spending towards tourism marketing and capital investment through infrastructural developments by 93.4% from Kshs. 31.9 bn in 2010 to Kshs. 61.7 bn in 2016, thus, affirming its purpose to support growth in the sector), and (v) tourism incentives such as removal of Value Added Tax (VAT) Charges on National Park fees, capping of Kenya Wildlife Services (KWS) Park fees at USD 60.0 down from USD 90.0 and scrapping of visa fees for children under the age of 16-years, all factors that support the performance of the sector. Overall, following the extended electioneering period, we project a 6.2% growth in international arrivals in 2017, slower than 13.5% recorded in 2016, and average bed occupancy of 28.8%, lower than 30.3% in 2016.
In the retail sector, French retail giant Carrefour is set to open a fourth outlet in January 2018 at the Junction Mall space previously occupied by Nakumatt, where it will cover 5,000 SQM of prime retail space. The retailer already has three outlets in the Nairobi Metropolitan Area, which are 5,000 SQM at The Hub in Karen, 5,000 SQM at the Thika Road Mall, and 7,200 SQM at the Two Rivers Mall. Kenya’s retail sector has continued to attract international retailers driven by (i) the rising middle-class with higher purchasing power, (ii) robust macroeconomic growth, with an average GDP growth of above 5.0% over the last 5-years, thus increasing per capita wealth, (iii) a relatively lower formal retail penetration rate at 30.0%, while the informal retail is at approximately 70.0%, and (iv) poor corporate governance leading to the poor performance of some of the local players such as Uchumi and Nakumatt, hence opening up an opportunity for foreign retailers into the Kenyan market.
This has made Kenya the 2nd largest retail economy in the Sub Saharan Africa after South Africa with an estimated 60.0% penetration, according to Nielsen Research Firm. We are likely to see more competition in the retail sector as international retailers such as Game, Carrefour, and Choppies, just to mention a few, gain foothold of the sector, while local retailers such as Naivas and Tuskys open more branches in Nairobi and other Kenyan Counties.
Other highlights in the sector:
- Local coffee chain Java House opened yet another branch in Nairobi’s CBD, along Monrovia Street opposite Nakumatt Lifestyle Mall, bringing the total number of branches to 8. The Kshs. 50.0 mn outlet is part of the firm’s strategy to expand. The outlet is situated on Monrovia Street opposite Nakumatt Lifestyle Mall and follows opening of an express branch inside United States International University (USIU),
- Starting this week, there will be no manual or paper-based transactions at the Nairobi and Central Land Registries as the Ministry of Lands and Physical Planning launched the online e-Citizen platform, which is meant to ease efficiency and transparency in the land transfer process. Thus, transfer of ownership, official land searches and payment of land rent, rates, consent fees, registration fees and stamp duty will all be done through the e-Citizen platform. This follows the shifting of land rents and official search payments to the e-Citizen portal in January 2016, and the addition of stamp duty to the list of online payments in October the same year. These developments will ease land related businesses in Kenya by enhancing transparency and saving on time and resources previously spent undertaking the manual processes.
We expect the real estate sector to stabilize following the end of the electioneering period supported by positive economic growth, continued infrastructural upgrade including the improvement in land transaction processes, and interest from multinational firms.
Following the release of the Q3’2017 results by Kenyan listed banks, Cytonn Financial Services Research team undertook an analysis on the Kenyan Banking Sector to point out any material changes from our H1’2017 Banking Report. In our Q3’2017 Banking Report, we analyze the results of the listed banks in order to determine which banks are the most attractive and stable for investment from a franchise value and from a future growth opportunity perspective.
The report is themed “What Next for the Kenyan Banking Sector?” as we assess what factors will be crucial for the sustainability of the banking sector, with the sector expected to adopt a more disciplined approach, following rising non-performing loans (NPLs) and the capping of interest rates, which has seen banks adjust their business models in an effort to manage the tough operating environment. As a result, we now ask the question, “What must banks focus their attention on going forward?” as we look forward to a relatively challenging operating environment for the banking sector, with IFRS 9 expected to come into effect as well as the continued presence of the interest rate caps. With the deteriorating asset quality, coupled with the interest rate caps, we expect prudence and efficiency will be the two key factors that will either make or break the individual banks in the sector. Below are the 6 key themes that shaped the banking sector over the first three quarters of 2017:
- Regulation – The effects of the Banking (Amendment) Act 2015 have been felt over the first three quarters of 2017, with banks recording a decline in core EPS by 8.2% compared to the 5-year average of 13.0%, whereas private sector credit growth remains low at 2.0% as at October 2017, compared to 5.4% when the Banking (Amendment) Act 2015 came into play, and way below the set government target of 18.3%. The amendment stipulates a deposit and loan-pricing framework, with (i) a cap on lending rates at 4.0% above the Central Bank Rate (CBR), and (ii) a floor on the deposit rates at 70% of the CBR. The capping of interest rates, however, has seen banks prefer not to lend to consumers but rather invest in risk-free treasuries, which offer better returns on a risk adjusted basis. This can be witnessed through increased allocation by listed banks towards government securities, with allocation growing by 15.2% to Kshs 776.3 bn from Kshs 684.5 bn in Q3’2016;
- Consolidation – Consolidation in the banking sector picked up towards the end of 2016 and in early 2017, but has slowed as the year has progressed. Earlier in the year, Diamond Trust Bank Kenya (DTBK) completed the acquisition of Habib Bank (K) Limited (HBL), with the deal finalized in Q3’2017. We would have expected even a lot more consolidation by now, given the year is now coming to an end, due to the attractive valuations in the banking sector, and we are surprised that some of the smaller banks have managed to stay independent this long, as we would have expected weaker banks (that don’t serve a niche, or don’t have a clear deposit gathering strategy), being forced to merge or be acquired. It is notable that acquisitions are also happening at much cheaper valuations, with earlier bank acquisition announcements, such as Fina Bank, K-Rep and Equatorial Commercial Bank having been at 3.2x, 1.8x and 2.3x P/B, respectively, while recent acquisitions are happening at between 0.8x to 1.7x P/B, and hence it is a great time to be an acquirer. Below is the summary of the transaction metrics of some of the acquisitions that have happened in the banking sector, including DTBK’s acquisition of Habib Bank Kenya.
|
Acquirer |
Bank Acquired |
Book Value at Acquisition (Kshs bn) |
Transaction Stake |
Transaction Value (Kshs bn) |
P/BV Multiple |
Date |
|
Diamond Trust Bank Kenya |
Habib Bank Limited Kenya |
2.38 |
100.0% |
1.82 |
0.8x |
Mar-17 |
|
SBM Holdings |
Fidelity Commercial Bank |
1.75 |
100.0% |
2.75 |
1.6x |
Nov-16 |
|
M Bank |
Oriental Commercial Bank |
1.80 |
51.0% |
1.30 |
1.4x |
Jun-16 |
|
I&M Holdings |
Giro Commercial Bank |
2.95 |
100.0% |
5.00 |
1.7x |
Jun-16 |
|
Mwalimu SACCO |
Equatorial Commercial Bank |
1.15 |
75.0% |
2.60 |
2.3x |
Mar-15 |
|
Centum |
K-Rep Bank |
2.08 |
66.0% |
2.50 |
1.8x |
Jul-14 |
|
GT Bank |
Fina Bank Group |
3.86 |
70.0% |
8.60 |
3.2x |
Nov-13 |
|
Average |
80.3% |
1.8x |
- Asset Quality – The banking sector has witnessed a deterioration in its asset quality over the past year, with the gross non-performing loans in the listed segment rising by 25.5% to Kshs 189.5 bn from Kshs 151.0 bn in Q3’2016, as the gross NPL ratio rose to 12.3% from 11.2% in Q3’2016, and this has led to an increase in provisioning levels to 52.6% from 47.7% in Q3’2016. We are seeing banks becoming more selective, prudent and conservative in terms of loan disbursement, since with the current pricing framework, it is difficult to price riskier clients within the loan limit cap in the cost of loans. This has led banks to reduce their unsecured and micro loans to small businesses, which are deemed risky, and allocating towards perceived less risky government instruments, and we expect loan growth to be subdued in 2018, as banks tighten their risk assessment framework;
- Efficiency – The focus for the banking sector in 2018 will inevitably be on adjusting business models to conform to the Banking (Amendment) Act 2015. To this effect, banks have already taken proactive measures aimed at increasing operational efficiency in response to the challenging operating environment, such as laying off staff, closure of branches, reviewing operating hours for some branches, or outright sales in the case of struggling Tier III banks. Going forward, we are likely to witness banks’ push for efficiency gather pace to balance off the expected reduction in absolute profitability going forward as they shy away from the physical branch model, which is very expensive compared to other alternative channels such as digital platforms;
- Prudence – With the implementation of IFRS 9, from the previous IAS 39, which is expected to take effect from 1st January 2018, banks will be required to provide additionally on loans. IFRS 9 will take on a forward looking or expected impairment approach, meaning that the issuer of the loan is to calculate unrealized default on a facility, depending on the stage of the financial instrument. Some banks have estimated a 25.0% general increase in provisions as a result of the new regulation, though it is expected that most banks, those with adequate capital buffers, will pass the effect on to the balance sheet, affecting retained earnings, with a consequential reduction in Tier I capital. We believe that the new regulation will mean that banks should and will be much more prudent in loan disbursement as the impact of non-performing loans will adversely affect them, through either (i) decreased profitability, brought about by increased provisioning, or (ii) lower capital adequacy buffers, that may see some banks edge under the regulatory minimum requirements, requiring to raise more cash in order to sustain themselves.
- Revenue Diversification – With banks registering compressed net interest margins following the capping of interest rates, much of the attention has shifted, with a focus to diversifying income, through non-funded income, as this section of the bank’s revenue is not affected by the interest rate caps. Non-funded income (NFI) has grown by 10.4% in Q3’2016, taking its contribution to total income to 34.0%, from 27.8% registered in Q3’2016, and we expect this to continue going into 2018, as banks seek alternative sources of income to boost profitability.
Below is a summary of the branches closed and staff laid off over the last one year as the banks seek efficiency.
|
Kenya Banking Sector Restructuring |
|||
|
|
Bank |
Staff Retrenchment |
Branches Closed |
|
1. |
Sidian Bank |
108 |
- |
|
2. |
Equity Group |
400 |
7 |
|
3. |
Ecobank |
- |
9 |
|
4. |
Family Bank |
Unspecified |
- |
|
5. |
First Community Bank |
106 |
- |
|
6. |
Bank of Africa |
- |
12 |
|
7. |
National Bank |
Unspecified |
- |
|
8. |
NIC Bank |
32 |
Unspecified |
|
9. |
Standard Chartered Bank Kenya |
300 |
4 |
|
10. |
KCB Group |
223 |
Unspecified |
|
11. |
Barclays Bank |
301 |
7 |
|
12. |
I&M Holdings |
- |
Unspecified |
|
|
TOTAL |
1,470 |
39 |
Based on the above, we believe the sector is shaping up to prudence in operations, as can be seen through the increased loan loss provisioning levels, as banks adjust their business models under the current regulatory framework.
Below is a summary of the Q3’2017 results for the eleven listed banks and key take-outs from the results:
|
Kenya Listed Banks Q3'2017 Earnings and Growth Metrics |
||||||||||||||
|
Bank |
Core EPS Growth |
Interest Income Growth |
Interest Expense Growth |
Net Interest Income Growth |
Non Funded Income (NFI) Growth |
NFI to Total Operating Income |
Growth in total fees and commissions |
Loan Growth |
Deposits Growth |
Growth in Govt Securities |
||||
|
|
Q3'2017 |
Q3'2016 |
Q3'2017 |
Q3'2017 |
Q3'2017 |
Q3'2017 |
Q3'2017 |
Q3'2017 |
Q3'2017 |
Q3'2016 |
Q3'2017 |
Q3'2016 |
Q3'2017 |
|
|
Stanbic Bank |
19.7% |
(2.1%) |
(7.3%) |
(8.8%) |
(6.5%) |
5.1% |
44.4% |
45.3% |
13.8% |
1.9% |
8.2% |
22.8% |
40.0% |
|
|
KCB Group |
5.0% |
16.1% |
(3.6%) |
(10.9%) |
(1.0%) |
18.4% |
32.9% |
25.5% |
15.1% |
4.9% |
13.6% |
(7.3%) |
2.8% |
|
|
NIC Bank |
(1.3%) |
(6.4%) |
(8.4%) |
2.3% |
(14.5%) |
2.9% |
28.2% |
12.4% |
7.3% |
(0.7%) |
21.3% |
2.4% |
49.7% |
|
|
Equity Group |
(2.7%) |
17.7% |
(11.1%) |
5.9% |
(15.0%) |
28.3% |
43.6% |
24.9% |
(2.2%) |
3.0% |
11.3% |
4.8% |
17.7% |
|
|
DTB |
(3.5%) |
11.4% |
0.8% |
3.7% |
(1.4%) |
4.7% |
21.2% |
8.6% |
8.1% |
5.4% |
16.5% |
29.9% |
18.2% |
|
|
Co-op Bank |
(9.5%) |
22.3% |
(7.7%) |
(8.5%) |
(7.3%) |
2.7% |
32.8% |
5.9% |
14.2% |
6.9% |
12.1% |
1.7% |
0.8% |
|
|
Barclays |
(12.0%) |
(5.4%) |
(4.6%) |
(6.3%) |
(4.2%) |
(14.8%) |
31.0% |
(17.6%) |
5.3% |
14.3% |
10.8% |
13.4% |
28.8% |
|
|
I&M Bank |
(23.2%) |
16.5% |
(4.0%) |
(6.7%) |
(2.2%) |
9.3% |
26.1% |
24.4% |
9.6% |
4.5% |
9.6% |
9.9% |
16.0% |
|
|
StanChart |
(39.1%) |
24.5% |
(1.4%) |
19.1% |
(8.0%) |
(3.2%) |
31.8% |
(4.0%) |
(5.4%) |
14.1% |
19.5% |
19.8% |
19.9% |
|
|
NBK |
(73.5%) |
(76.9%) |
(29.6%) |
(28.0%) |
(30.4%) |
(3.1%) |
28.3% |
(5.0%) |
(6.9%) |
(15.5%) |
1.0% |
6.2% |
32.1% |
|
|
HF Group |
(80.9%) |
7.8% |
(18.5%) |
(8.7%) |
(29.7%) |
(4.0%) |
22.8% |
(21.3%) |
(5.0%) |
4.3% |
(19.2%) |
10.8% |
(86.9%) |
|
|
Weighted Average** |
(8.2%) |
15.1% |
(6.1%) |
(1.0%) |
(7.4%) |
10.4% |
34.0% |
14.6% |
6.3% |
6.0% |
12.9% |
7.5% |
13.2% |
|
|
* *The weighted average is based on Market Cap as at 1st December, 2017 |
||||||||||||||
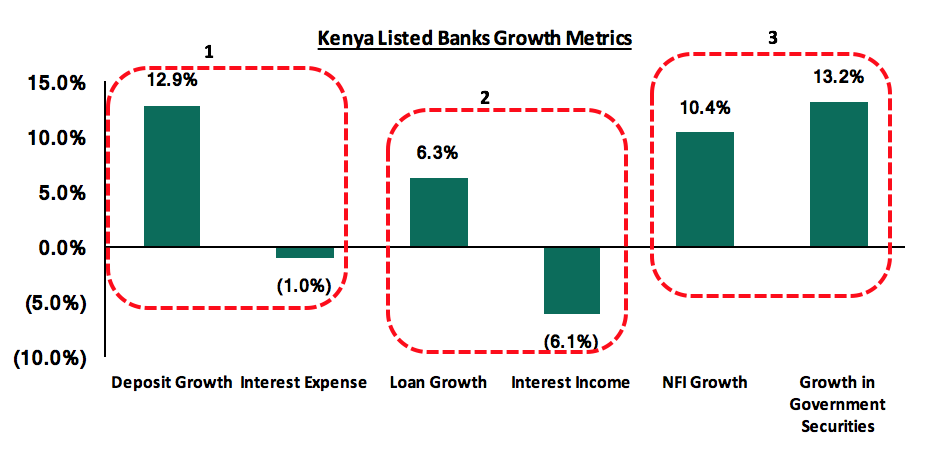
- Deposit growth has remained strong at 12.9%, compared to 12.8% historically, however, the 1.0% decline in interest expense indicates banks are opening less interest earning accounts.
- Interest Income declined by 6.1%, following the capping of interest rates, depressing interest margins, and this saw banks issue fewer loans, as loan growth grew by 6.3%, compared to 14.6% historically, and banks earn income from fee sources and drive NFI growth.
- Consequently, government securities and Non-funded income grew by 13.2% and 10.4%, respectively, as banks are unable to price risk, while also looking to diversify income.
Key takeaways from the table above include:
- Only Stanbic Bank and KCB Group have recorded a growth in core earnings per share, with the average decline in core earnings across the banking sector at 8.2%, compared to an average growth of 15.1% in Q3’2016, owing to the tough operating environment as a result of the interest rate caps and political uncertainty in the country that affected the business environment. Key to note is that the EPS growth by Stanbic Bank and KCB Group was supported largely on account of (i) an improvement in the hyper-inflationary environment in South Sudan, that saw an adjustment in the expensing of the exceptional items for Stanbic Bank, and (ii) the restatement of the Q3’2016 earnings for KCB Group, which can be considered a one-off item,
- Average deposit growth came in at 12.9%. However, despite the average deposits having grown, the interest expense paid on deposits recorded a negative growth of 1.0% on average, indicating that banks are growing deposits but opening less interest earning accounts and possibly transferring some existing interest earning accounts to transaction accounts,
- Average loan growth came in at 6.3%. However, interest income has declined by 6.1%, highlighting the effects of the rate caps, even as private sector credit growth has remained low, currently at 2.0%, which is way below the set government target range of 18.3%,
- The Loan to Deposits ratio declined to 78.0% from 86.3% registered in Q3’2016, as banks disbursed loans less aggressively, while the Cost to Income (CIR) ratio stood at 66.6%, compared to 47.7% in Q3’2016, with the bank’s net interest margins remaining compressed, following the capping of interest rates,
- Investment in government securities has grown by 15.2%, outpacing loan growth of 6.3%, as banks allocated more funds towards the government, with government securities considered risk free, depriving the private sector of credit in the process,
- The increase in the gross non-performing loan (NPL) ratio to 12.3% from 11.2% in Q3’2016 highlights increased risks around asset quality in the sector, with banks having taken a prudent approach with the adoption of IFRS 9,
- Non-funded income has however grown by 10.4%, which included a Fee and Commissions growth of 14.6%. This shows that banks are charging more fee income to improve their total yield on loans above the rate cap maximum, and,
- Listed banks recorded a decline on return on average equity to 13.4% from 15.9% in Q3’2016, as the banks’ profitability was affected by the capping of interest rates, which suppressed the net interest margin (NIM coming in at 7.5% compared to 8.6% in Q3’2016.
Private sector credit growth continues to remain low, coming in at 2.0% in October 2017, way below the government set target of 18.3%, as banks channel funds more actively towards government securities, depriving the private sector of credit.
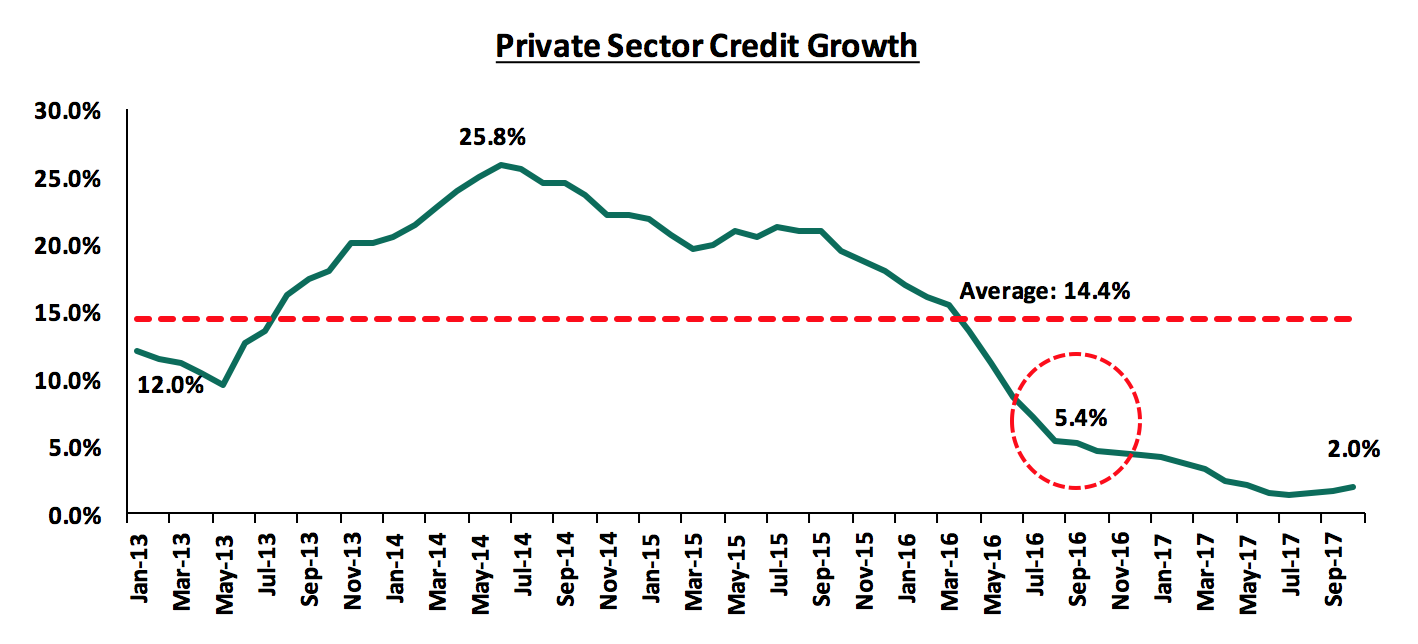
Rate cap came into effect in August 2016 when private sector credit growth was at 5.4% as highlighted above, with the decline before that as a result of a challenging operating environment
Following the challenges that the banking sector has been facing, primarily (i) the deteriorating asset quality brought about by a challenging operating environment, and (ii) the capping of interest rates, which has led to decreased profitability by banks in 2017, as private sector remains subdued, we believe the two key factors banks will consider going into 2018 are prudency and efficiency. Banks will have to be prudent in loan disbursement, as well as in providing for loans, coupled with efficiency, in a bid to protect their profit margins. The challenging operating environment is further underpinned by the coming into effect of IFRS 9 and Basel III, which will require banks to embrace both prudence and efficiency in order to be compliant and enhance profitability, which we believe will lead to a more stable and robust sector.
As per our analysis on the banking sector, from a franchise value and from a future growth opportunity perspective, below is the comprehensive ranking of the listed banks.
The overall ranking was based on a weighted average ranking of Franchise value (accounting for 40%) and Intrinsic value (accounting for 60%). The Intrinsic Valuation is computed through a combination of valuation techniques, with a weighting of 75.0% on Discounted Cash-flow Methods and 25.0% on Relative Valuation, while the Franchise ranking is based on banks operating metrics, meant to assess the efficiency, asset quality, diversification, corporate governance and profitability, among other metrics.
|
CYTONN’S Q3’2017 BANKING REPORT – COMPOSITE RANKINGS |
|||||
|
Bank |
Franchise Value Total Score |
Intrinsic Value Score |
Weighted Score |
Q3‘2017 Rank |
H1‘2017 Rank |
|
KCB Group |
49.0 |
2.0 |
20.8 |
1 |
1 |
|
Co-operative Bank |
53.0 |
6.0 |
24.8 |
2 |
2 |
|
Barclays Bank |
68.0 |
4.0 |
29.6 |
3 |
7 |
|
Equity Group |
64.0 |
7.0 |
29.8 |
4 |
5 |
|
NIC Bank |
77.0 |
1.0 |
31.4 |
5 |
4 |
|
Diamond Trust Bank |
77.0 |
3.0 |
32.6 |
6 |
3 |
|
I&M Holdings |
75.0 |
5.0 |
33.0 |
7 |
6 |
|
Stanbic Holdings |
82.0 |
9.0 |
38.2 |
8 |
8 |
|
SCBK |
87.0 |
10.0 |
40.8 |
9 |
9 |
|
NBK |
110.0 |
11.0 |
50.6 |
10 |
11 |
|
HF Group |
115.0 |
8.0 |
50.8 |
11 |
10 |
Major changes include:
- Barclays Bank climbed up 4 spots to Position 3 from Position 7 in our H1’2017 Banking Sector Report, due to impressive NIM at 9.7%, above industry average of 7.5%, and good asset quality, registering a gross NPL ratio of 6.8%, the second best among the listed banks, and below the industry average of 12.3%,
- Diamond Trust Bank dropped 3 spots to Position 6 from Position 3 in our H1’2017 Banking Sector Report, due to deteriorating asset quality, with the gross NPL ratio coming in at 8.0%, compared to 4.6% in H1’2016, as well as poor diversification, with NFI contributing only 21.2% of the total operating income, compared to an average of 31.0%.
For a comprehensive analysis on the ranking and methodology behind it, see our Cytonn Q3’2017 Banking Sector Report.
- Talk to us
- Kenya
- P.O Box 20695 - 00200, Nairobi, Kenya
- Cell +254(0) 709 101 000
- Tel +254(0) 20 3929 000
- WhatsApp +254(0) 748 070 000
- United States
- +1 (240) 368-6217
- DOWNLOAD OUR APP
-


- Kenya
- Cysuites work spaces, Church Rd, Westlands, Nairobi, Kenya
- USA
- Suite 1150, 1775 Eye Street NW, USA, Washington DC 20006, USA
- Investments
- High Yield
- Private Equity
- Real Estate
- Real Estate
- RiverRun Estates
- Cytonn Towers
- The Ridge
- Taraji Heights
- The Alma