Nairobi Hospitality Report 2017, & Cytonn Monthly – November 2017
By Cytonn Research Team, Dec 3, 2017
Executive Summary
Fixed Income
During the month of November, yields on T-bills remained relatively flat, with the yields on the 91 and 364-day papers remaining unchanged at 8.0% and 11.0%, respectively, while the yield on the 182-day paper increased slightly to 10.5% from 10.4% at the end of October. Kenya’s inflation rate for the month of November declined to 4.7% from 5.7% in October, primarily driven by a drop in food prices on account of improved weather conditions;
Equities
During the month of November, the equities market was on an upward trend with NASI, NSE 25 and NSE 20 gaining 6.7%, 4.8% and 2.0%, respectively, taking their YTD performance as at the end of November to 29.7%, 24.7% and 19.4% for NASI, NSE 25 and NSE 20, respectively. This week, HF Group, National Bank and I&M Bank released Q3’2017 results, recording declines in core earnings per share of 80.9%, 73.5% and 23.2%, respectively;
Private Equity
During the month of November, we witnessed private equity activity in major sectors including financial services and technology, with the highlight transaction being the acquisition of the African operations of the UK-based multinational firm, Aon by CapitalWorks, a Johannesburg-based private equity firm;
Real Estate
The month of November was characterized by heightened political tensions following the repeated election polls and the final legal determination of the same. However, the sector showed signs of resilience evidenced by the heightened activity registered in the residential, hospitality and retail sectors. The Kenyan President, in his inauguration speech, announced an affordable housing programme of 500,000 units by 2020 to house all working families, indicating positive efforts to address the main challenges in the residential sector;
Focus of the Week
This week we focus on Nairobi’s Hospitality Sector for the year 2017, covering both hotels and serviced apartments. This follows our calendar of releases on real estate themes, which include the Nairobi Commercial Office Report, Nairobi Residential Research Report and Kenya Retail Sector Report. In this week’s focus, we will inform on the trends in the hospitality market pertaining to supply, demand, local and international brands, charge rates and performance in terms of occupancy and revenues. According to the report, 2017 recorded a decrease in terms of Average Daily Rates, revenues and occupancy, attributed to political tension and increased room supply. Nevertheless, investors have demonstrated optimism in the sector with more hotels set to be opened in the next 5-years. We have established what the driving factors are, the challenges facing the sector and identified the most viable nodes for hotels and serviced apartments in Nairobi for future investment.
- We shall release our Q3’2017 financial results tomorrow morning at 8.15am. The event will also be streamed live on Facebook, kindly visit our Facebook Account to follow the release
- Cytonn Investments held its End of Year Client Appreciation Dinner at Safari Park Hotel on 30th November 2017. The event is aimed at appreciating our clients for their continued support, and to celebrate milestones achieved in the year. See Event Note here
- Cytonn Investments held its annual strategy retreat meeting and staff end year party at Country Lodge Hotel, Elementaita. The event themed “Moving from Good to Great”, is aimed at reviewing the performance of the firm over the year. See Event Note here
- Cytonn Foundation, an initiative of Cytonn Investments Management Plc, that focuses on giving back to the society through skill development, held a Private Wealth Management (WMT) and Cytonn Young Leaders Program (CYLP) training at the South Eastern Kenya University (SEKU), under the Foundation’s financial literacy pillar. The University staff were taken through a financial planning training session with a focus on 4 key areas; Budgeting, Debt Management, Savings, and Investments. See Event Note here
- Our Managing Partner and CEO, Edwin H. Dande, was a Chief Guest at the Institute of Quantity Surveyors of Kenya (IQSK) Annual Gala Dinner held at the Vila Rosa Kempinski, where he spoke on innovative ways of financing development and investing in the growing real estate sector. See Event Note here
- Our Investment Analyst, Caleb Mugendi, discussed the recently concluded debt and equity restructuring by Kenya Airways. Watch Caleb Mugendi on CNBC here
- Our Investment Manager, Maurice Oduor, discussed President Uhuru Kenyatta's swearing-in speech, which highlighted his plans for the economy over the next 5-years. Watch Maurice on Citizen TV here
- We continue to showcase our real estate developments through weekly site visits. Watch progress videos and pictures of The Alma, Amara, The Ridge and Taraji Heights. The site visits target both investors looking to invest in real estate directly and those interested in high yield investment products to familiarize themselves with how we support our high yields. Key to note is that our cost of capital is priced off the loan markets where all-in pricing ranges from 16.0% to 21.0% and our yield on real estate developments ranges from 23.0% to 25.0%, hence our top-line gross spread is about 6.0%. If interested in attending the site visits, kindly register here
- We continue to see very strong interest in our Private Wealth Management training (largely covering financial planning and structured products), which is at no cost, and is held bi-weekly, but is open only to pre-screened participants. We also continue to see institutions and investment groups interested in the trainings for their teams. The Wealth Management Trainings are run by the Cytonn Foundation under its financial literacy pillar, and if interested in the training for your employees or investment group please get in touch with us through clientservices@cytonn.com or book through this link Wealth Management Training. To view the wealth management training topics click here
- For recent news about the company, see our news section here
- We have 10 investment-ready projects, offering attractive development and buyer targeted returns of around 23.0% to 25.0% p.a. See further details here: Summary of investment-ready projects
- To invest in any of our current or upcoming real estate projects, please visit Cytonn Real Estate
- Cytonn Towers, where we are only selling residential units in the first phase of residential apartments, is currently about 20.0% sold. See Cytonn Towers
- The Alma, which is 55.0% sold. See The Alma
- Amara Ridge has currently 100.0% uptake See Amara Ridge
- Situ Village is currently 22.0% sold. See Situ Village
- The Ridge (Phase 1) is currently 31.0% sold. See The Ridge
- Taraji Heights is currently 14.0% sold. See Taraji Heights
- RiverRun Estates (Phase 1) is currently 11.0% sold. See RiverRun Estates
- With over 10 investment ready projects worth over Kshs 82.0 billon of project value, we shall be very selective on new real estate projects going forward, only focusing on Joint Ventures and real estate opportunities with deep value. We are increasingly focused on private equity deals. Should you have any deals in banking, insurance, education, hospitality and technology sectors, kindly email a teaser to PE@cytonn.com
- We continue to beef up the team with ongoing hires: Careers at Cytonn .
Liquidity in the money market, even with the improvement in November, remained tight with T-bills auctions recording an undersubscription, as the average subscription came in at 75.5%, compared to 48.0% recorded in October. The subscription rates for the 91, 182 and 364-day papers came in at 104.7%, 58.6% and 80.7% from 68.1%, 35.6% and 52.3% the previous month, respectively. The yields on the 91 and 364-day papers remained unchanged at 8.0% and 11.0%, respectively, while the yield on the 182-day paper increased to 10.5% from 10.4%. The T-bills acceptance rate came in at 94.4% during the month, compared to 93.5% in October, with the Kenyan Government accepting Kshs 72.5 bn of the Kshs 76.8 bn worth of bids received, indicating that bids were largely within ranges the Central Bank of Kenya (CBK) deemed acceptable. The government is still behind its domestic borrowing target for the current fiscal year, having borrowed Kshs 84.3 bn, against a target of Kshs 173.5 bn (assuming a pro-rated borrowing target throughout the financial year of Kshs 410.2 bn budgeted for the full financial year as per the Cabinet-approved 2017 Budget Review and Outlook Paper (“BROP”)).
This week, T-bills were undersubscribed, with the overall subscription coming in at 75.3%, compared to 66.0% recorded the previous week. Subscription rates for the 91, 182, and 364-day papers came in at 212.7%, 29.3%, and 66.4% from 108.4%, 48.6%, and 66.5%, the previous week, respectively. Yields on the 91, 182 and 364-day T-bills remained unchanged during the week at 8.0%, 10.5%, and 11.0%, respectively.
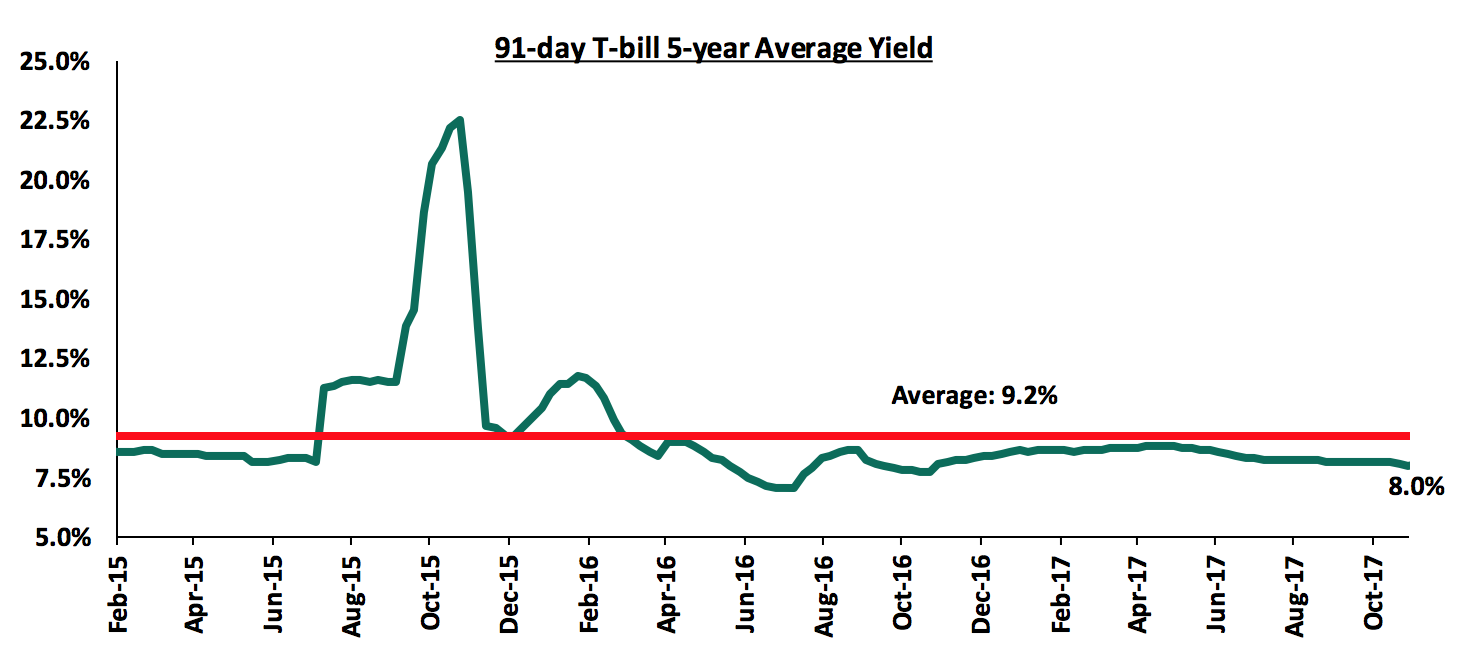
The 91-day T-bill is currently trading below its 5-year average of 9.2%. The lower yield on the 91-day paper is mainly attributable to the low interest rate environment we have been experiencing since the beginning of the year. We expect this to continue in the short-term, given the discipline of the CBK in stabilizing interest rates in the auction market by rejecting aggressive bids that are priced above market, for both T-bills and T-bonds.
During the month, the Kenyan Government issued a new 7-year amortized Infrastructure Bond (IFB 1/2017/7), with an effective tenor of 6.0 years, and a coupon rate of 12.5%, in a bid to raise Kshs 30.0 bn for partial support of infrastructural projects in the roads (Kshs 10.0 bn), energy (Kshs 15.0 bn) and water (Kshs 5.0 bn) sectors. The bond was oversubscribed, with the overall subscription rate coming in at 153.0%, with Kshs 45.9 bn worth of bids received compared to the Kshs 30.0 bn on offer. The average market bid rates came in at 12.3%, while the average yields of the accepted bids came in at 12.2%. The acceptance rate for the bids received came in at 91.5%, with the government accepting Kshs 42.0 bn out of the Kshs 45.9 bn worth of bids received.
During the month, the average interbank rate closed at 8.6%, compared to 6.9% at the end of October, as liquidity remained tight in the money market. There was a net liquidity injection of Kshs 2.9 bn compared to a net liquidity withdrawal of Kshs 16.4 bn in October. A significant amount of the liquidity withdrawal came from Transfer of Taxes from Banks and Primary issues of T-bills worth Kshs 98.6 bn and Kshs 72.5 bn, respectively, which was offset by the liquidity injection from Government Payments and Redemptions of T-Bills worth Kshs 94.7 bn and Kshs 81.3 bn, respectively. The CBK was active in the Repo market, injecting Kshs 39.1 bn of Reverse Repo Purchases in a bid to counter the tight liquidity. There was T-bill rediscounting of Kshs 3.7 bn, which indicates that there are some players that faced significant liquidity challenges during the month, since rediscounting is very punitive and is usually done at the prevailing yields plus 3.0% points, thus making the value of the discounted T-bills much lower than their market value.
Below is a summary of the money market activity during the month:
|
all values in Kshs bn, unless stated otherwise |
|||
|
Monthly Liquidity Position – November |
|||
|
Liquidity Injection |
Liquidity Reduction |
||
|
Government Payments |
94.7 |
T-bonds sales |
42.0 |
|
T-bonds Redemptions |
27.9 |
Transfer from Banks - Taxes |
98.6 |
|
T-bills Redemptions |
81.3 |
T-bills (Primary issues) |
72.5 |
|
T-bonds Interest |
14.8 |
Reverse Repo Maturities |
38.2 |
|
Reverse Repo Purchases |
39.1 |
OMO Tap Sales |
7.3 |
|
Repos Maturities |
9.8 |
Repos |
9.8 |
|
T-bills Re-discounts |
3.7 |
||
|
Total Liquidity Injection |
271.3 |
Total Liquidity Withdrawal |
268.4 |
|
Net Liquidity Injection |
2.9 |
||
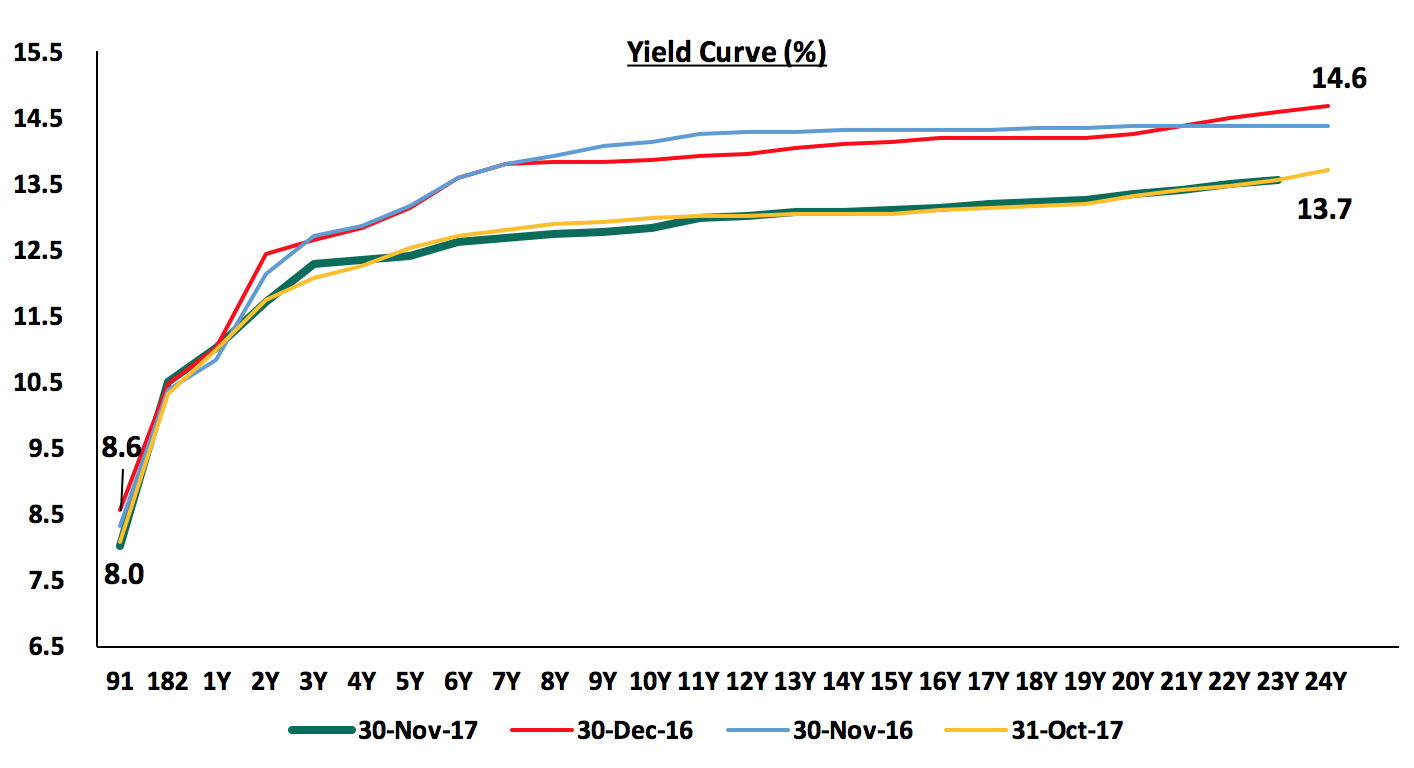
The yields on government securities in the secondary market remained relatively unchanged during the month, only recording slight upward movement for the tenor of 3-5 years. On a year to date basis, the yield curve has experienced a downward pressure leading to decline in yields. According to the FTSE NSE Bond Index, Treasury bonds listed at the Nairobi Securities Exchange (NSE) gained 1.1% during the month, bringing the YTD performance to 13.6%.
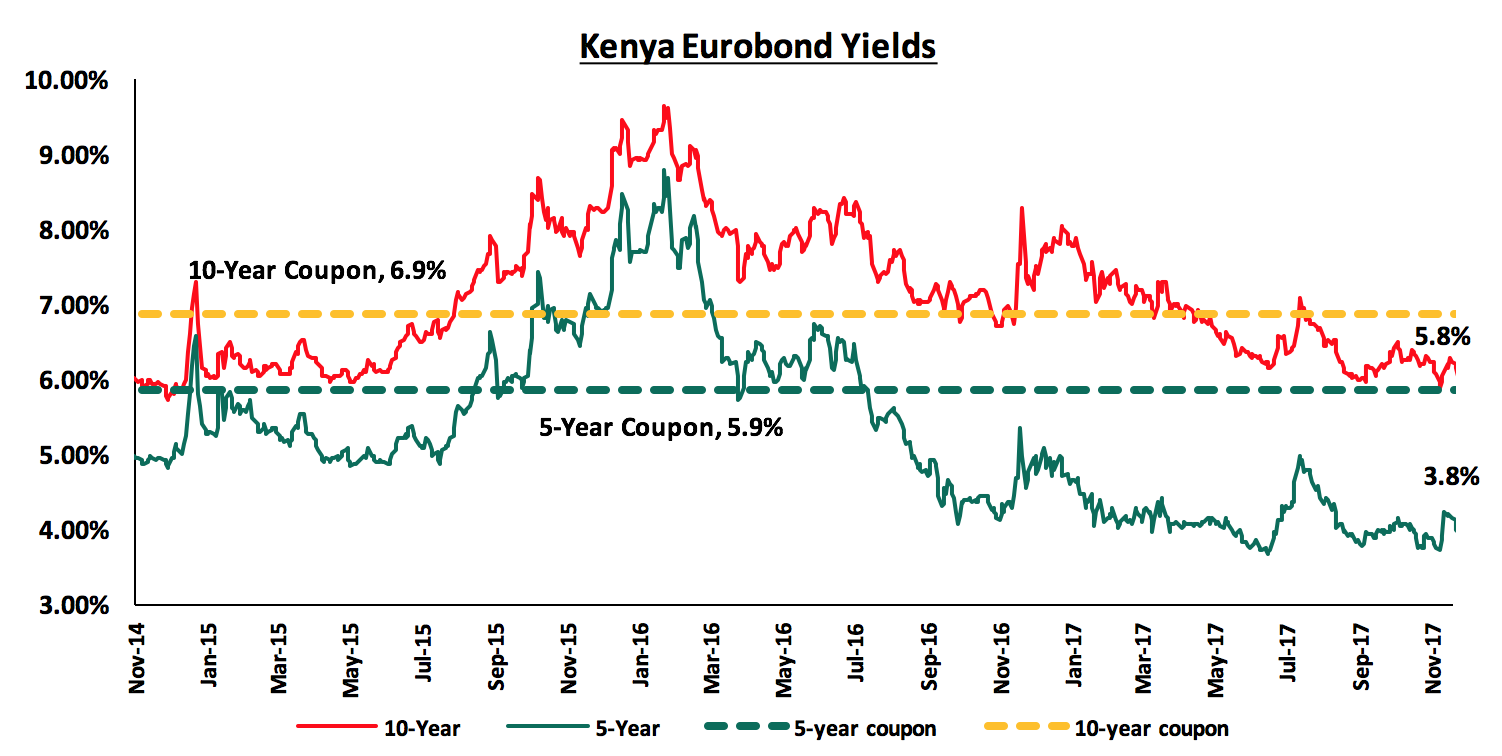
According to Bloomberg, the yield on the 10-year Eurobond declined by 30 bps during the month, to close at 5.8% from 6.1% at the end of October, while the yield on the 5-year Eurobond remained unchanged at 3.8%, despite the uncertainty surrounding the repeat presidential elections. Since the mid-January 2016 peak, yields on the Kenya Eurobonds have declined by 5.0% points and 3.9% points for the 5-year and 10-year Eurobonds, respectively, due to stable macroeconomic conditions in the country. The declining Eurobond yields can be attributed to a relatively peaceful electioneering period and stable rating by Standard & Poor (S&P). There has however been concerns from Moody’s around Kenya’s rising debt to GDP levels and if not resolved may see Kenya receive a downgraded sovereign credit rating.
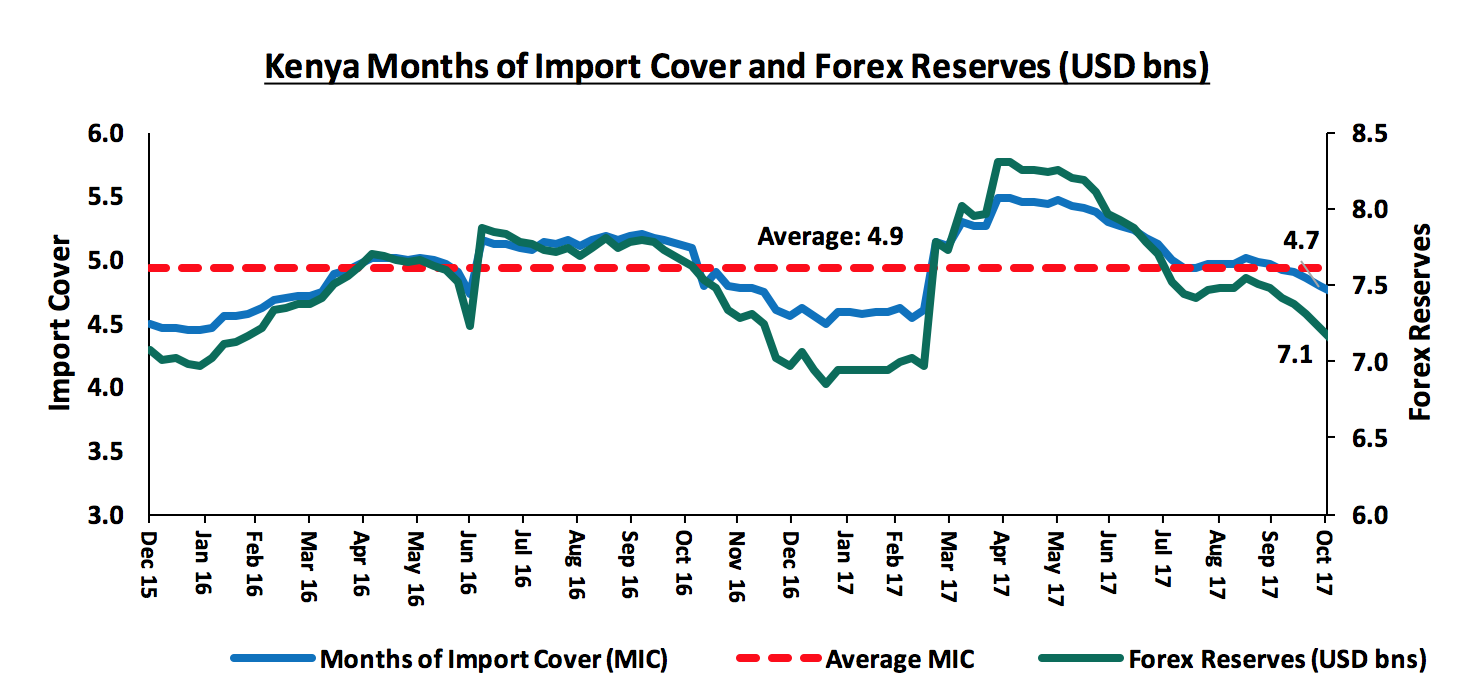
The Kenya Shilling appreciated by 0.6% against the USD during the month of November to close at Kshs 103.1, from Kshs 103.8 in October, primarily due to increased foreign investor inflows into the equities market and primary bond auction, following a relatively peaceful election period. On a year to date basis, the shilling has depreciated against the dollar by 0.6%. In our view, the shilling should remain relatively stable against the dollar in the short term, supported by (i) the expected calm in the political front, following the conclusion of the presidential elections and the swearing in of the President, (ii) the weakening of the USD in the global markets, as indicated by the US Dollar Index, which has shed 8.7% year to date, and (iii) the CBK’s activity, as they have sufficient forex reserves, currently at USD 7.1 bn (equivalent to 4.7 months of import cover).
The inflation rate for the month of November declined by 1.0% points, to a four-year low of 4.7%, from 5.7% in October. The decline was primarily driven by a drop in food prices, which dropped by 1.3% m/m and 5.8% y/y, due to improved weather conditions in most parts of the country. Some of the indices that increased are (i) a rise of 1.7% m/m in housing, water, electricity, gas and other fuels, brought about by increased cost of electricity, house rents and other cooking fuels, and (ii) an increase of 0.6% in the cost of fuel, following increased pump prices of petrol and diesel. Below is a summary of key changes on the Consumer Price Index (CPI) in November;
|
Major Inflation Changes in the Month of November 2017 |
|||
|
Broad Commodity Group |
Price change m/m (Nov 2017/Oct 2017) |
Price change y/y (Nov 2017/Nov 2016) |
Reason |
|
Food & Non-Alcoholic Beverages |
(1.3%) |
5.8% |
This was due to fall in the cost of most food basket items, mainly attributed to favorable weather conditions |
|
Transport Cost |
0.6% |
3.8% |
This was on account of an increase in pump prices of petrol and diesel |
|
Housing, Water, Electricity, Gas and other Fuels |
1.7% |
5.3% |
This was mainly due to notable increases in the cost of house rents, electricity and other cooking fuels |
|
Overall Inflation |
(0.2%) |
4.7% |
The decline was mainly driven by the decrease in food & non-alcoholic beverages, which has a CPI weight of 36.0% |
On a year-to-date basis, inflation has averaged 8.3%. Going forward, we expect inflationary pressures to remain subdued, given food prices are expected to stabilize on account of the improved weather conditions. Despite this, we expect inflation to average 8.0% over the course of the year, which is above the upper bound of the government target range of 2.5% - 7.5%.
The Monetary Policy Committee (MPC) met during the month, to review the prevailing macroeconomic conditions and give direction on the Central Bank Rate (CBR). The MPC maintained the CBR at 10.0%, which was in line with our expectations as per our MPC Note. The Committee indicated that the decision was on the back of a relatively stable macroeconomic environment, given:
i) Inflation declined to 5.7% in October, from 7.1% in September, primarily due to reduced food prices,
ii) The foreign exchange market has remained relatively stable,
iii) The foreign reserves at USD 7.1 bn translating to 4.7 months of import cover, with a standby facility of USD 1.5 bn from the IMF, provides an adequate buffer for short term pressure on the shilling, and,
iv) A resilient banking sector, with the average commercial banks liquidity ratio and capital adequacy ratio at 44.7% and 18.8%, against statutory limits of 20.0% and 14.5%, respectively, as at August 2017, with the gross NPL ratio improving slightly to 10.6% in October, from 10.7% in August.
Key to note is that private sector credit growth improved slightly once again to 2.0% in October, from 1.7% in September; this however remains way below the government set annual target of 18.3%. See the CBK release for full details.
The International Monetary Fund (IMF) expressed concerns about Kenya’s debt levels during the month, stating that, despite the country’s resilience through the 2016/17 drought and the long electioneering period, debt vulnerability should be addressed. According to CBK data, Kenya’s total debt has continued to grow, and has risen by 21.0% y/y to Kshs 4.5 tn in September 2017 from Kshs 3.7 tn in September 2016. Furthermore, according to the National Treasury, the budget deficit to GDP ratio is expected to increase to 7.9% in the fiscal year 2017/18 from 6.2% previously and public debt to GDP ratio is expected to hit 59.0% by December 2017, from 51.8% previously targeted, that being 900 bps above the 50.0% IMF threshold, it raises concerns over Kenya’s debt vulnerability. The Treasury is also contemplating taking on a syndicated loan and floating another Eurobond in a bid to meet its foreign borrowing target of Kshs 277.3 bn, which will further add to Kenya’s debt exposure. This is after data from the treasury revealed that Kenya borrowed Kshs 487.0 bn from China in the year ended September 2017. We are of the same view as the IMF that the debt levels need to be kept sustainable, and be driven towards recommended levels, such as the 50.0% IMF threshold. As mentioned in our topical on Post-Election Areas of Focus, the government should manage the debt levels by (i) enhancing tax collection, (ii) more Public-Private Partnerships (PPPs) to involve the private sector in development funding, and (iii) reduce recurrent expenditure, which as per the BROP is actually expected to increase by 7.1% in FY 2017/18 mainly due to increased expenditure on the presidential re-run.
Fixed Income Conclusion:
Rates in the fixed income market have remained stable, and we expect this to continue in the short-term. However, a budget deficit that is likely to result from depressed revenue collection, creates uncertainty in the interest rates environment, as any additional borrowing in the domestic market to plug the deficit could lead to upward pressures on interest rates. Our view is that investors should be biased towards short-to medium term fixed income instruments to reduce duration risk.
During the month of November, the equities market was on an upward trend with NASI, NSE 25 and NSE 20 gaining 6.7%, 4.8% and 2.0%, respectively, taking their YTD performance as at the end of November to 29.7%, 24.7% and 19.4% for NASI, NSE 25 and NSE 20, respectively. The equities market performance during the month was driven by gains in large caps such as Equity Group, KCB Group, Diamond Trust Bank and Safaricom, which gained 12.5%, 8.6%, 8.4% and 7.8%, respectively. For this week, the equities market recorded mixed trends with NASI and NSE 25 gaining 2.8% and 0.2%, respectively, while NSE 20 lost 0.5%, taking their YTD performance to 29.8%, 24.6% and 19.8% for NASI, NSE 25 and NSE 20, respectively. Since the February 2015 peak, the market has lost 2.5% and 30.6% for NASI and NSE 20, respectively.
Equities turnover rose by 58.5% during the month to USD 143.8 mn from USD 90.7 mn in October 2017, taking the YTD turnover to USD 1.5 bn. Foreign investors remained net buyers for this month with net inflows of USD 16.1 mn, compared to net inflows of USD 7.2 mn witnessed in October 2017. Year to date, foreign investors are net sellers with net outflows of USD 88.0 mn. We expect the market to remain supported by improved investor sentiment once political uncertainty dissipates, as investors take advantage of the attractive stock valuations.
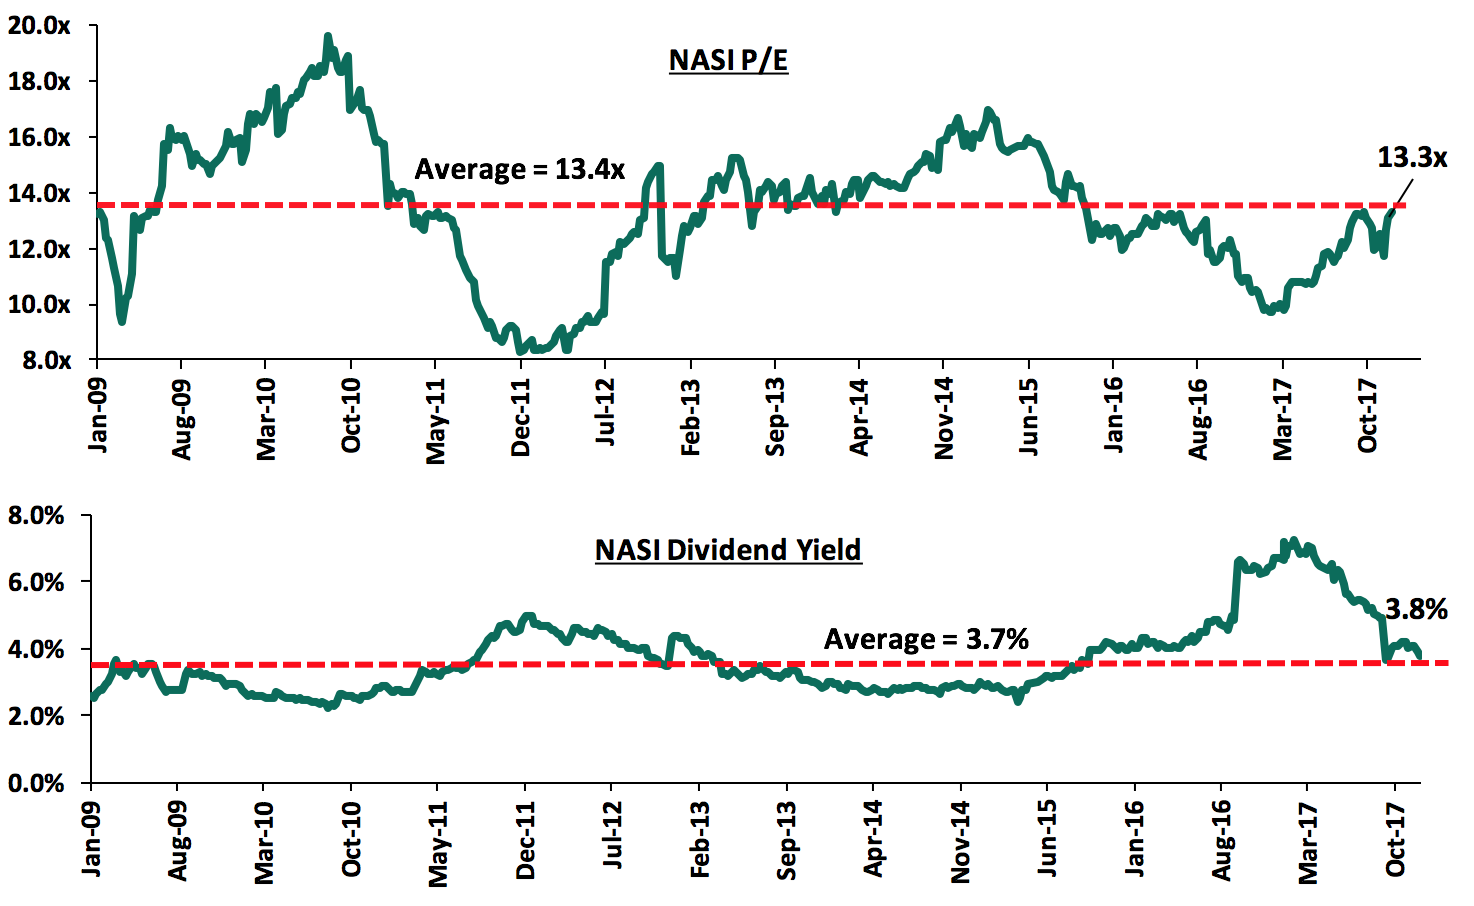
The market is currently trading at a price to earnings ratio (P/E) of 13.3x, versus a historical average of 13.4x, and a dividend yield of 3.8%, compared to a historical average of 3.7%. Despite the valuations nearing the historical average, we believe there still exist pockets of value in the market, with the current P/E valuation being 21.5% below the most recent peak of 16.9x in February 2015. The current P/E valuation of 13.3x is 36.9% above the most recent trough valuation of 9.7x experienced in the first week of February 2017, and 59.8% above the previous trough valuation of 8.3x experienced in December 2011. The charts below indicate the historical P/E and dividend yields of the market.
During the month, Kenya Airways (KQ) completed the restructuring of its debt and equity following the signing of the agreement by main lenders including the Kenyan Government, KLM, and KQ Lenders Company, a special purpose vehicle (SPV) consisting of 10 Kenyan banks. The unsecured lenders converted their debt to equity, which resulted in a 94.8% dilution of the previous shareholders who are not lenders. Following the debt and equity restructuring, the government’s ownership of KQ rose to 48.9% from the previous 29.8%, while the consortium of bank’s vehicle (KQ Lenders) now own 38.1% of the airline, as highlighted in our Cytonn Weekly #46/2017. KQ’s shares are back to trading on the Nairobi Securities Exchange (NSE) following completion of the restructuring process after they were suspended for 2-weeks to allow for the share split, debt conversion and subsequent share consolidation. The shares were trading at Kshs 12.5 per share as at Friday, 1st December 2017, which is a gain of 134.9% from the price of Kshs 5.3 per share as at 15th November 2017 when the trading suspension began. KQ is currently trading at price/sales ratio of 0.2x, which is low compared to other peers such as Comair and El Al Israel Airlines trading at 0.7x and 0.3x, respectively. We view the conversion as a positive move for the airline as (i) it will reduce the overall debt burden, thus stabilizing the company and facilitating long term growth, in line with its turnaround strategy, and (ii) it will result in a significant boost in liquidity through savings on interest and maturity payments of debt, thus improving the airline’s cash flow position. The new shareholders are also introducing changes in governance, which we believe will be beneficial for the firm, to ensure keen oversight on the implementation of its turn-around strategy.
During the month, we had a number of earnings releases by banks reporting their Q3’2017 performance. Below is the detailed analysis of the earnings’ releases for this week:
HF Group released Q3’2017 results
HF Group released Q3’2017 results, recording an 80.9% decline in core earnings per share to Kshs 0.2 from Kshs 0.8 in Q3’2016, attributed to a 25.1% decline in operating revenue coupled with a 0.9% increase in operating expenses. Key highlights of the performance from Q3’2016 to Q3’2017 include:
- Total operating revenue declined by 25.1% y/y to Kshs 2.8 bn from Kshs 3.8 bn, attributed to a 29.7% decline in Net Interest Income (NII) to Kshs 2.2 bn from Kshs 3.1 bn in Q3'2016, and a 4.0% y/y decline in Non-Funded Income (NFI) to Kshs 0.64 bn from Kshs 0.67 bn,
- Interest Income declined by 18.5% to Kshs 5.5 bn from Kshs 6.7 bn in Q3’2016, attributable to a lower yield on interest-earning assets, which came in at 12.4% from 14.9% in Q3’2016. Interest income on government securities declined by 23.9% y/y to Kshs 0.3 bn from Kshs 0.4 bn, while interest income on loans and advances declined by 16.7% y/y to Kshs 5.1 bn from Kshs 6.1 bn, (unlike most banking peers who have increased income on government securities by 7.4%, HF’s declined by 23.9%)
- Interest expense decreased by 8.7% to Kshs 3.3 bn from Kshs 3.6 bn in Q3’2016, following a decline in cost of funding to 7.4% from 8.5% in Q3’2016. Interest expense on customer deposits declined by 22.5% to Kshs 1.8 bn from Kshs 2.3 bn in Q3’2016. Owing to the faster decline in interest income, the Net Interest Income declined by 29.7% to Kshs 2.2 bn from Kshs 3.1 bn in Q3’2016. The Net Interest Margin thus declined to 5.1% from 6.4% in Q3'2016,
- Non-Funded Income (NFI) recorded a drop of 4.0% to Kshs 0.64 bn from Kshs 0.67 bn in Q3'2016. The decline in NFI is attributable to a 21.3% drop in total fees and commissions to Kshs 0.2 bn from Kshs 0.3 bn in Q3’2016, and a 3.0% decrease in other income to Kshs 0.40 bn from Kshs 0.41 bn. Given the slower decline in NFI compared to decline in NII, the proportion of NFI to total revenue increased, with the current revenue mix at 77:23 funded to non-funded income from 82:18 in Q3’2016, (unlike the industry that has recorded an increased in NFI by 10.4%, we note that HF’s declined. HF’s peers in Tier 2 have also recorded an average NFI growth of 3.6%. Other Tier 2 banks include Stanbic, NIC, I&M and National Bank)
- Total operating expenses increased marginally by 0.9% to Kshs 2.59 bn from Kshs 2.57 bn, attributable to an 11.8% increase in other operating expenses to Kshs 1.0 bn from Kshs 0.9 bn in Q3’2016. However, staff costs declined by 4.4% to Kshs 0.8 bn from Kshs 0.84 bn in Q3’2016, while the Loan Loss Provision (LLP) also registered a 3.2% decline to Kshs 0.47 bn from Kshs 0.49 bn in Q3’2016,
- The Cost to Income ratio drastically worsened to 91.8% from 68.1% in Q3'2016, following a 25.1% decline in operating revenue coupled with a 0.9% increase in operating expenses. Without LLP, the Cost to Income ratio worsened to 74.9% from 55.0% in Q3'2016,
- Profit before tax declined by 80.7% to Kshs 0.2 bn from Kshs 1.2 bn, while profit after tax declined by 80.9% to Kshs 0.2 bn from Kshs 0.8 bn in Q3’2016,
- Total assets declined by 3.6% to Kshs 70.8 bn from Kshs 73.5 bn in Q3'2016. This decline is attributed to a 5.0% decline in the loan book to Kshs 51.2 bn from Kshs 53.9 bn in Q3’2016 coupled with an 86.9% decline in investment in government securities to Kshs 0.7 bn from Kshs 5.6 bn in Q3'2016, it is also notable that while most banking peers increased their investment in government securities by an average of 15.2%, HF’s has declined dramatically. Placements due from banks recorded an 80.1% increase to Kshs 4.5 bn from Kshs 2.5 bn in Q3’2016, following a 382.5% y/y increase in placements due from foreign banking institutions to Kshs 1.7 bn from Kshs 0.3 bn,
- Total liabilities declined by 4.4% to Kshs 59.4 bn from Kshs 62.2 bn in Q3'2016, attributed to a 19.2% decline in deposits to Kshs 33.6 bn from Kshs 41.6 bn in Q3'2016. Borrowings increased by 28.2% to Kshs 23.7 bn from Kshs 18.5 bn in Q3’2016, as HF Group mobilized cash to enable the bank pay back its Kshs 7.0 bn corporate bond that fell due in October 2017,
- The faster decline in deposits compared to the loan book led to an increase in the loan to deposit ratio to 152.3% from 129.6% in Q3'2016. However, the banks’ loans to total borrowings plus deposits ratio, which is a more suitable measure given HF Group’s primary business is mortgage provision, remained relatively stable at 88.8% from 88.5% in Q3’2016,
- Shareholders’ funds increased marginally by 0.7% to Kshs 11.3 bn from Kshs 11.2 bn in Q3’2016, due to a 51.7% y/y increase in statutory loan loss reserves to Kshs 0.6 bn from Kshs 0.4 bn in Q3’2016.
We view HF Group’s business model as not ideal in the interest rate cap environment that has hurt mortgage uptake in the market, further worsened by the challenging operating environment due to prolonged electioneering period. For these reasons, we expect the group’s FY’2017 earnings to be more than 25% worse than the FY’2016 earnings. The group is however optimistic of better performance in Q4’2017 when two projects, Komarock Heights and Richland, are completed. Going forward, HF Group is leveraging on its property and investments subsidiary, HFDI, to continue developing real estate products, which form the core part of Non-Funded Income for HF Group. This will be supported by normalization of property conveyance process at the Ministry of Lands Registries, which will ensure release of funds tied in incomplete transactions.
For a more comprehensive analysis, see our HF Group Q3’2017 Earnings Note.
I&M Bank released Q3’2017 results
I&M Bank released Q3’2017 results, recording a 23.2% decline in profit after tax to Kshs 3.9 bn from Kshs 5.1 bn in Q3'2016, attributed to a 27.4% y/y increase in operating expenses that was not offset by the 0.6% marginal increase in operating income. Key highlights for the performance from Q3’2016 to Q3’2017 include:
- Total operating income increased marginally by 0.6% to Kshs 12.6 bn from Kshs 12.5 bn in Q3'2016, driven by a 9.3% increase in Non-Funded income to Kshs 3.3 bn from Kshs 3.0 bn in Q3’2016, despite a 2.2% decline in Net Interest Income (NII) to Kshs 9.3 bn from Kshs 9.5 bn in Q3'2016,
- Interest Income declined by 4.0% to Kshs 15.2 bn from Kshs 15.8 bn in Q3’2016. This is attributable to a 7.7% decline in interest income on loans & advances to Kshs 11.4 bn from Kshs 12.3 bn, despite a 10.7% increase in interest income on government securities to Kshs 3.7 bn from Kshs 3.4 bn in Q3’2016,
- Interest expense declined by 6.7% to Kshs 5.9 bn from Kshs 6.3 bn in Q3’2016, following a 6.9% y/y decline in interest expense on customer deposits to Kshs 5.1 bn from Kshs 5.5 bn. Following a larger decline in interest income compared to interest expense in absolute terms, the Net Interest Income declined by 2.2% y/y to Kshs 9.3 bn from Kshs 9.5 bn,
- Non-Funded Income (NFI) recorded a growth of 9.3% to Kshs 3.3 bn from Kshs 3.0 bn in Q3'2016. The growth in NFI was driven by a 24.8% y/y increase in fees & commissions on loans to Kshs 0.7 bn from Kshs 0.6 bn and a 24.1% y/y increase in other fees and commissions to Kshs 1.3 bn from Kshs 1.1 bn. The current revenue mix came in at 74:26 funded to non-funded income from 76:24 in Q3’2016,
- Total operating expenses increased by 27.4% to Kshs 6.6 bn from Kshs 5.1 bn, attributed to a 103.5% increase in Loan Loss Provisions (LLP) to Kshs 1.9 bn from Kshs 0.9 bn, and an 11.7% growth in staff costs to Kshs 2.2 bn from Kshs 2.0 bn in Q3'2016. Staff costs account for 33.4% of operating expenses while LLPs account for 28.6% of operating expenses,
- The Cost to Income ratio worsened to 52.2% from 41.2% in Q3'2016, following the 27.4% increase in total operating expenses. Without LLP, the Cost to Income ratio worsened to 37.3% from 33.8% in Q3'2016,
- Profit before tax decreased by 18.2% to Kshs 6.0 bn from Kshs 7.3 bn. Profit after tax decreased by 23.2% to Kshs 3.9 bn from Kshs 5.1 bn in Q3’2016 following an increase in effective tax rate to 34.5% from 30.2% in Q3’2016,
- Total assets grew by 9.7% to Kshs 200.9 bn from Kshs 183.2 bn in Q3'2016. This growth was driven by a 16.0% y/y increase in investment securities to Kshs 48.7 bn from Kshs 42.0 bn and a 9.6% growth in the loan book to Kshs 133.2 bn from Kshs 121.5 bn in Q3'2016,
- Total liabilities rose by 10.6% to Kshs 168.5 bn from Kshs 152.3 bn in Q3'2016, driven by a 130.0% y/y increase in other liabilities to Kshs 7.3 bn from Kshs 3.2 bn and a 9.6% increase in deposits to Kshs 141.3 bn from Kshs 129.0 bn in Q3'2016,
- Shareholders’ funds increased by 4.6% to Kshs 31.6 bn from Kshs 30.3 bn in Q3’2016,
- The loan to deposit ratio remained stable at 94.3% following similar increase in loans and deposits,
- I&M Bank is currently sufficiently capitalized with a core capital to risk weighted assets ratio at 16.1%, 5.6% above the statutory requirement, with total capital to total risk weighted assets exceeding statutory requirement by 2.7%.
Going forward, we expect I&M Bank’s growth to be propelled by continued investment in the innovation and digitization of systems, processes and solutions in a bid to enhance efficiency as well as to provide their customers with convenient access to products and solutions.
National Bank released Q3’2017 results
National Bank released Q3’2017 results, recording a 73.5% decline in core earnings per share to Kshs 0.4 from Kshs 1.5 in Q3’2016, attributed to a 24.4% decline in operating revenue, which outpaced a 19.6% decline in operating expenses. Key highlights for the performance from Q3’2016 to Q3’2017 include:
- Total operating revenue declined by 24.4% y/y to Kshs 6.4 bn from Kshs 8.4 bn, attributed to a 30.4% decline in Net Interest Income (NII) to Kshs 4.6 bn from Kshs 6.6 bn in Q3'2016, and a 3.1% y/y decline in Non-Funded Income (NFI) to Kshs 1.8 bn from Kshs 1.9 bn,
- Interest Income declined by 29.6% to Kshs 7.1 bn from Kshs 10.0 bn in Q3’2016, attributable to a decline in the yield on interest-earning assets to 9.8% from 12.9% in Q3’2016. Interest income on loans and advances declined by 50.7% y/y to Kshs 3.8 bn from Kshs 7.6 bn, while interest on government securities increased by 36.7% y/y to Kshs 3.2 bn from Kshs 2.3 bn,
- Interest expense decreased by 28.0% to Kshs 2.5 bn from Kshs 3.5 bn in Q3’2016, following a decline in cost of funds to 3.4% from 5.4% in Q3’2016. Interest expense on placements declined by 65.4% y/y to Kshs 0.2 bn from Kshs 0.7 bn, while interest expense on customer deposits declined by 18.7% y/y to Kshs 2.3 bn from Kshs 2.8 bn in Q3’2016. Owing to the faster decline in interest income, the Net Interest Income declined by 30.4% to Kshs 4.6 bn from Kshs 6.6 bn in Q3’2016. The Net Interest Margin thus declined to 6.3% from 7.5% in Q3'2016,
- Non-Funded Income (NFI) recorded a drop of 3.1% to Kshs 1.8 bn from Kshs 1.9 bn in Q3'2016. The decline in NFI is attributable to a 5.0% drop in total fees and commissions to Kshs 1.1 bn from Kshs 1.2 bn in Q3’2016. Given the slower decline in NFI compared to decline in NII, the proportion of NFI to total revenue increased, with the current revenue mix at 72:28 funded to non-funded income from 78:22 in Q3’2016,
- Total operating expenses decreased by 19.6% to Kshs 6.2 bn from Kshs 7.7 bn, attributable to a 72.9% decrease in loan loss provisions (LLP) to Kshs 0.5 bn from Kshs 1.9 bn in Q3’2016. However, staff costs increased by 7.6% to Kshs 2.9 bn from Kshs 2.7 bn in Q3’2016,
- The Cost to Income ratio worsened to 96.9% from 91.2% in Q3'2016, following a 24.4% decline in operating revenue, which outpaced a 19.6% decrease in operating expenses. Without LLP, the Cost to Income ratio worsened to 88.8% from 68.6% in Q3'2016,
- Profit before tax declined by 73.5% to Kshs 0.2 bn from Kshs 0.7 bn, while profit after tax declined by 73.5% to Kshs 0.1 bn from Kshs 0.5 bn in Q3’2016,
- Total assets increased by 2.4% to Kshs 116.3 bn from Kshs 113.6 bn in Q3'2016. This growth is attributed to a 319.2% growth in placements due from banks to Kshs 2.6 bn from Kshs 0.6 bn in Q3’2016. Loans and advances decreased by 6.9% y/y to Kshs 57.9 bn from Kshs 62.2 bn,
- Total liabilities increased by 2.9% to Kshs 105.1 bn from Kshs 102.1 bn in Q3'2016, attributed to an 86.8% increase in placements due to other banks to Kshs 2.2 bn from Kshs 1.2 bn in Q3'2016. Customer deposits grew marginally by 1.0% y/y to Kshs 97.4 bn from Kshs 96.4 bn,
- The faster decline in loans compared to deposits led to a decrease in the loan to deposit ratio to 59.4% from 64.5% in Q3'2016,
- Shareholders’ funds decreased by 2.4% to Kshs 11.2 bn from Kshs 11.5 bn in Q3’2016, due to a 38.3% y/y decrease retained earnings to Kshs 2.1 bn from Kshs 3.3 bn in Q3’2016.
Key to note from NBK’s results is that the bank continues to reduce its level of provisioning, despite growth in non-performing loans and contrary to the current industry trend of providing more pending adoption of IFRS 9. NBK remains under-capitalized with the total capital to total risk-weighted assets falling below the statutory requirement of 14.5% by 3.2%. Moving forward, NBK’s growth is expected to be supported by:
- Successful revamping of its Small Enterprise banking segment and the Amanah business segment. The bank has also partnered with institutions to offer real-time collections through its Payment Gateway platform for institutions, which is expected to drive their deposits as well as reduce its cost of funding, and,
- Management of expenses, which will enable the bank control its high cost-to-income ratio, currently at 96.9%.
For a more comprehensive analysis, see our National Bank Q3’2017 Earnings Note.
Below is a summary of the Q3’2017 results for the eleven listed banks and key take-outs from the results:
|
Listed Banks Q3'2017 Earnings and Growth Metrics |
||||||||||||||
|
Bank |
Core EPS Growth |
Interest Income Growth |
Interest Expense Growth |
Net Interest Income Growth |
Non Funded Income (NFI) Growth |
NFI to Total Operating Income |
Growth in total fees and commissions |
Loan Growth |
Deposits Growth |
Growth in Govt Securities |
||||
|
Q3'2017 |
Q3'2016 |
Q3'2017 |
Q3'2017 |
Q3'2017 |
Q3'2017 |
Q3'2017 |
Q3'2017 |
Q3'2017 |
Q3'2016 |
Q3'2017 |
Q3'2016 |
Q3'2017 |
||
|
Stanbic Bank |
19.7% |
(2.1%) |
(7.3%) |
(8.8%) |
(6.5%) |
5.1% |
44.4% |
45.3% |
13.8% |
1.9% |
8.2% |
22.8% |
40.0% |
|
|
KCB Group |
5.0% |
16.1% |
(3.6%) |
(10.9%) |
(1.0%) |
18.4% |
32.9% |
25.5% |
15.1% |
4.9% |
13.6% |
(7.3%) |
2.8% |
|
|
NIC Bank |
(1.3%) |
(6.4%) |
(8.4%) |
2.3% |
(14.5%) |
2.9% |
28.2% |
12.4% |
7.3% |
(0.7%) |
21.3% |
2.4% |
49.7% |
|
|
Equity Group |
(2.7%) |
17.7% |
(11.1%) |
5.9% |
(15.0%) |
28.3% |
43.6% |
24.9% |
(2.2%) |
3.0% |
11.3% |
4.8% |
17.7% |
|
|
DTB |
(3.5%) |
11.4% |
0.8% |
3.7% |
(1.4%) |
4.7% |
21.2% |
8.6% |
8.1% |
5.4% |
16.5% |
29.9% |
18.2% |
|
|
Co-op Bank |
(9.5%) |
22.3% |
(7.7%) |
(8.5%) |
(7.3%) |
2.7% |
32.8% |
5.9% |
14.2% |
6.9% |
12.1% |
1.7% |
0.8% |
|
|
Barclays |
(12.0%) |
(5.4%) |
(4.6%) |
(6.3%) |
(4.2%) |
(14.8%) |
31.0% |
(17.6%) |
5.3% |
14.3% |
10.8% |
13.4% |
28.8% |
|
|
I&M Bank |
(23.2%) |
16.5% |
(4.0%) |
(6.7%) |
(2.2%) |
9.3% |
26.1% |
24.4% |
9.6% |
4.5% |
9.6% |
9.9% |
16.0% |
|
|
StanChart |
(39.1%) |
24.5% |
(1.4%) |
19.1% |
(8.0%) |
(3.2%) |
31.8% |
(4.0%) |
(5.4%) |
14.1% |
19.5% |
19.8% |
19.9% |
|
|
NBK |
(73.5%) |
(76.9%) |
(29.6%) |
(28.0%) |
(30.4%) |
(3.1%) |
28.3% |
(5.0%) |
(6.9%) |
(15.5%) |
1.0% |
6.2% |
32.1% |
|
|
HF Group |
(80.9%) |
7.8% |
(18.5%) |
(8.7%) |
(29.7%) |
(4.0%) |
22.8% |
(21.3%) |
(5.0%) |
4.3% |
(19.2%) |
10.8% |
(86.9%) |
|
|
Weighted Average** |
(8.2%) |
14.1% |
(6.1%) |
(1.0%) |
(7.4%) |
10.4% |
34.0% |
14.6% |
6.3% |
6.0% |
12.9% |
7.5% |
15.2% |
|
|
* *The weighted average is based on Market Cap as at 1st December, 2017 |
||||||||||||||
Key takeaways:
- Only Stanbic Bank and KCB Group have recorded a growth in core earnings per share, with the average decline in core earnings across the banking sector at 8.2%, owing to the tough operating environment as a result of the interest rate caps and political uncertainty in the country that affected the business environment,
- Average deposit growth came in at 12.9%. However, despite the average deposits having grown, the interest expense paid on deposits recorded a negative growth of 1.0% on average, indicating that banks are growing deposits but opening less interest earning accounts and possibly transferring some existing interest earning accounts to transaction accounts,
- Average loan growth has been recorded at 6.3%, however interest income has decreased by 6.1%, showing the effects of the rate caps,
- Investment in government securities has grown by 15.2% outpacing loan growth of 6.3%, showing increased lending to the government by banks as they avoid the risky borrowers,
- Non-funded income has however grown by 10.4%, which included a Fee and Commissions growth of 14.6%. This shows that banks are charging more fee income to improve their total yield on loans above the rate cap maximum.
Below is our Equities Universe of Coverage:
We have placed all banks under review this week as we update their valuations following release of the Q3’2017 results, and we shall be releasing the Cytonn Q3’2017 Banking Sector Report in the coming week:
|
all prices in Kshs unless stated otherwise |
||||||||
|
No. |
Company |
Price as at 31/10/17 |
Price as at 30/11/17 |
m/m Change |
YTD Change |
Target Price* |
Dividend Yield |
Upside/ (Downside)** |
|
1. |
Jubilee Insurance |
445.0 |
458.0 |
2.9% |
(6.5%) |
575.4 |
1.9% |
27.5% |
|
2. |
Kenya Re |
20.0 |
20.5 |
2.5% |
(8.9%) |
24.4 |
3.7% |
22.7% |
|
3. |
Liberty |
12.2 |
13.9 |
14.4% |
5.3% |
16.4 |
0.0% |
18.0% |
|
4. |
CIC Group |
5.9 |
5.9 |
0.0% |
55.3% |
6.2 |
1.7% |
6.8% |
|
5. |
Sanlam Kenya |
27.0 |
30.0 |
11.1% |
9.1% |
31.4 |
1.0% |
5.5% |
|
6. |
Britam |
14.5 |
15.1 |
3.8% |
50.5% |
15.2 |
1.5% |
2.5% |
|
*Target Price as per Cytonn Analyst estimates |
||||||||
|
**Upside / (Downside) is adjusted for Dividend Yield |
||||||||
|
For full disclosure, Cytonn and/or its affiliates holds a significant stake in KCB Group and NIC Bank, ranking as the 5th largest local institutional investor and the 9th largest shareholder, respectively |
||||||||
We maintain a “NEUTRAL” view on equities for investors with short-term investment horizon since, despite the lower earnings growth prospects for this year, the market has rallied and brought the market P/E closer to its historical average. Pockets of value exist, with a number of undervalued sectors like some Financial Services, which provide an attractive entry point for long-term investors and thus we are positive for investors with a long-term investment horizon.
On Acquisitions:
Pan-African ICT private equity firm, Convergence Partners, through its second fund, Convergence Partners Communications Infrastructure Fund, has bought a significant minority stake in ESET East Africa, a subsidiary of ESET Global. ESET East Africa is a regional technology company focused on offering cybersecurity solutions. The acquisition gives Convergence Partners an opportunity for growth and expansion in the region. For ESET, the partnership will be advantageous as (i) it will support the firm’s expansion strategy in the East African region, having just opened its first office in Kenya in 2016, and (ii) it gives the firm a chance to ride on Convergence Partners’ distribution network across Africa. For more information, see our Cytonn Weekly #46/2017
Apis Partners, a London based private equity firm that focuses on financial services and growth market investment, has injected funding of USD 5.0 mn (Kshs 519.0 mn) into Direct Pay Online, a Kenyan Internet Payments Firm. This is the second investment into the firm after an initial injection of USD 10.0 mn (Kshs 1.0 bn) into the firm last year. DPO currently operates in 12 African countries, including Kenya, Tanzania, Uganda and South Africa and has acquired firms in Namibia and Botswana, with further plans to expand into countries such as Nigeria, Ghana, DRC and Mozambique. The continued interest by investors in technology-driven companies in Sub-Sahara Africa is catalyzed by the rising need for technology products as more businesses seek to enhance efficiency and reduce costs. For more information, see our Cytonn Weekly #45/2017
Sendy, an on-mobile logistics company has received Kshs 207.6 mn (USD 2.0 mn) in equity investment from Dutch impact fund DOB Equity and CFAO Group, a multinational firm that is a fully owned subsidiary of Toyota Tsusho Corporation, for an undisclosed equity stake. Sendy, which was founded in 2014, offers delivery services through a mobile application. The funding will be used to scale up the operations of the company, which already has presence in Nairobi, Thika, Mombasa and Kisumu, to other locations in the country.
CapitalWorks, a Johannesburg-based private equity firm, acquired the African operations of the UK-based multinational firm, Aon, for an undisclosed amount. The transaction will effectively see Aon Sub-Saharan Africa rebrand to Minet Group. Aon Africa was previously owned by Aon London and Minet Africa. The investment is part of CapitalWorks’ strategy to diversify as they have previously invested largely, but not exclusively, in the construction, mining and manufacturing sectors. For more information, see our Cytonn Weekly #45/2017
On the Fundraising Front:
Phatisa, a private equity firm focused on investments in Sub-Saharan Africa, has received USD 10.0 mn from the African Development Bank (AfDB) for its Phatisa Food Fund II (PFF2), representing 3.3% of the entire fund target. PFF2 targets a close of USD 300.0 mn, 22.0% higher than the previous African Agriculture Fund (AAF), to still be deployed in the Sub-Saharan Africa region. The success of the previous fund was hinged on Phatisa’s agriculture investment philosophy of investing in the entire value chain. Phatisa invests in (i) Primary Agriculture, which involves arable land development and livestock farming, (ii) Secondary Agriculture, which involves processing and packaging, and (iii) Tertiary Agriculture, which involves logistics, storage and input financing, and as well have a real estate fund known as the Pan African Housing Fund (PAHF). For more information, see our Cytonn Weekly #47/2017
Amethis Finance, a Paris-based company focused on investing in debt and equity in the FMCG, financial services, healthcare and oil and gas sectors in Africa, is seeking to raise Kshs 36.0 bn, for its Amethis Fund II. The fund will be invested in mid-market companies in financial institutions, fast-moving consumer goods, healthcare, agribusiness, education, IT and telecommunications sectors in 11 African countries including Kenya. The World Bank’s, International Finance Corporation (IFC), has made a proposition of Kshs 1.8 bn in equity investment to the fund. Amethis, through its first fund, the USD 324.4 mn Amethis Fund I, has invested in 12 equity deals including a USD 10.5 mn investment in Kenya’s Chase Bank in 2013 and an undisclosed amount in Kenafric Industries in February this year. For more information, see our Cytonn Weekly #46/2017.
Private equity investments in Africa remains robust as evidenced by the increased deal flow in a number of sectors that support growth in the Continent. The increasing investor interest is attributed to (i) rapid urbanization, a resilient and adapting middle class and increased consumerism, (ii) the attractive valuations in Sub Saharan Africa’s private markets, (iii) the attractive valuations in Sub Saharan Africa’s markets compared to global markets, and (iv) better economic projections in Sub Sahara Africa compared to global markets. We remain bullish on PE as an asset class in Sub-Sahara Africa. Going forward, the increasing investor interest and stable macro-economic environment will continue to boost deal flow into African markets.
Residential
During the month of November, Kenya Bankers Association (KBA), released their Q3’2017 Housing Price Index (KBA-HPI), which tracks both qualitative and quantitative factors that determine pricing in the housing sector. The key take-outs from the report were:
- House prices increased by 0.4% in Q3’2017 compared to 1.0% increase in Q2’2017. The lower growth can be attributed to: (i) the observed slowdown in credit growth in the private sector at 1.6% over the 12-months to August 2017 from a 4-year average of 14.8% from January 2013, and (ii), a wait-and-see stance adopted by investors during the electioneering period,
- Apartments accounted for 82.7% of the total number of units sold in Q3’2017, with maisonettes and bungalows accounting for 10.7% and 6.6%, respectively, attributed to affordability of apartment units compared to maisonettes and bungalows.
For more details, please see our Cytonn Weekly #45.
Also, in his inauguration speech, the President of Kenya, Uhuru Kenyatta, announced plans to introduce an affordable housing scheme that will see every working family own a decent home. The Kenyatta Administration set a target of approximately 500,000 new homes by 2020. Though a timely move given the housing units deficit of approximately 2 mn as per African Development Bank, the Government will have to address the key factors that have been hindering a successful provision of affordable housing such as i) prohibitive land costs (as per the Cytonn Land Report 2017, land prices increased by 2.5x between 2011 and 2016), (ii) unfavorable policies such as the interests rate capping law that have depressed credit advancement to home buyers, and the private sector in general, iii) costly construction materials, (iv) high financing costs, and v) opacity on issuance of title deeds.
As per the Kenya National Bureau of Statistics’ Economic Survey 2017, Nairobi County recorded only 8,623 private residential completions with 1,062 public, a total of 9,685 completions.
We maintain a positive outlook for the residential sector given the large housing deficit that stands at 200,000 units per annum, as a result of the expanding middle class and rapid urbanization rate of 4.4% p.a against a global average of 2.1%.
Commercial Offices
The United Nations submitted a proposal to the UN General Assembly to upgrade the infrastructure in its offices in Gigiri, Nairobi, to (i) achieve full environmental green building policies, (ii) accommodate more staff, and (iii) enhance ease of accessibility of the Gigiri offices for people with disabilities at a cost of Kshs 7.0 billion over the next 7-years. This is a right move by the institution in embracing green building technology as it sets the pace for construction of environmentally friendly buildings in the region. Green buildings have been proved to reduce operational costs and are a feature of most top-rated office buildings.
Gigiri, as per our Cytonn Office Report, is a good market with the highest Grade A office supply taking 75% of its market share, compared to other office nodes. Also, according to the report, the opportunity for office space is in Grade A office space given the continued entrance of multinational firms in the region who create demand for top notch office space. For more details, please see our Cytonn Weekly #45.
Retail
The sector showed better trends compared to the previous months, during which the real estate theme was characterized with such issues as outlets’ closures due to financial constraints. During the month of November;
- The newly expanded Village Market formally opened its doors, with the local dailies reporting high occupancy rates of 95%. The expanded section adds 230,000 SQFT of lettable space to the mall, adding 100 line shops, over 900 parking bays, a business conference hotel, children’s play area, and a 30,000 SQFT gym, expected to be taken up by Ignite Fitness, a South African gym brand. Other international brands setting up shop at the mall include clothing stores such as Foschini, Celio and Markhams;
- French based retailer Carrefour opened its third local branch at the Thika Road Mall. The TRM space, previously occupied by the troubled Nakumatt, covers over 5,000 SQM of selling space. The location of the mall is apt for retailers given the densely populated areas of Roysambu and Kasarani, as well as the busy Thika Superhighway, all acting as a guarantee for high footfall;
- Quick Mart is set to open two new outlets in Nairobi on Kikuyu Road and along the Eastern Bypass, growing its total number of branches to 8;
- Massmart Holding’s, a subsidiary of Game, announced plans to open a new store at the 200,000 SQFT Waterfront in Karen, set to open in January 2018, replacing Nakumatt, the initial proposed anchor tenant.
Other retailers such as Tuskys and Naivas also increased their portfolios during the month as the sector continues to attract interest from both international and local retailers indicating a probable upward growth of the sector. For more of these details please visit Cytonn Weekly #47.
We project an improved performance of the sector in 2018 on the back of stabilizing macroeconomic and political environment.
Hospitality
During the month, the hospitality sector continued to decline in performance given the political headwinds. According to Jambojet’s Chief Executive, Willem Hondius, the extended electioneering period resulted in a 16% decline in flight bookings for the period June to October, for the airline. However, visitors’ arrivals increased in the period January to July this year by 32.1% to 105,241 in July from 79,690 in January, as per The Kenya National Bureau of Statistics, Leading Economic Indicators July 2017. However, the arrivals dropped to an annual low in the months of October and November, which recorded 66,897 and 64,091 tourist arrivals, respectively, attributable to the political tensions in the said period. We remain positive about the sector’s performance, which we expect will rebound in 2018 given government incentives:
i)The Kenyan President, in his inauguration speech, announced liberal entry for all African visitors into Kenya, meaning that visitors from all African Nations shall be receiving visas at the port of entry, a move that we expect to motivate and thus, increase visitors’ arrival from African nations. As of 2016, African countries accounted for the second largest visitors’ arrival to Kenya after Europe for holiday and business visits as shown below;
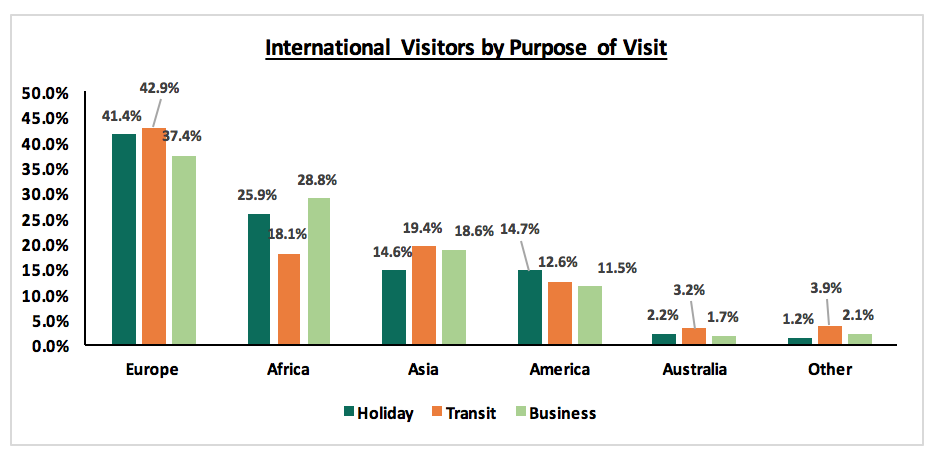
Source: Cytonn Hospitality Report 2017
ii)The African Development Bank (AfDB) approved a Kshs 16.5 bn loan for building a 4.9 km long second runway at the Jomo Kenyatta International Airport to enhance mobility at the airport. The runway will enable support more air traffic and offer extra parking slots for aircrafts, among other perks. Currently, the airport has a capacity of 6 mn passengers annually, which is set to increase to 12.5 mn per annum passengers once the runway is completed, as per reports in the local dailies,
iii)World Travel Market London in association with Euromonitor International named Kenya as one of the leading hotspots for luxury hotel investments in Africa, after South Africa,
iv)Additionally, TravelBird, an online travel and vacation booking firm based in Amsterdam, ranked Nairobi City as the 93rd (out of top 500 global tourist destinations) most welcoming city in the world ahead of major cities such as Budapest (Hungary), Cairo (Egypt) and Bucharest (Romania).
Other highlights in the hospitality sector included:
- Hotel chain Hemingways Collection announced plans to officially open the sale of its new venture, Watamu Residences in Watamu, this week. The development will comprise of 3 one-bedroom units, 16 two-bedroom units and 2 four-bedroom units selling at Kshs 45 mn, Kshs 60-80 mn and Kshs 140 mn, respectively,
- Marriott International, opened 172-roomed Four Points by Sheraton Nairobi Airport hotel at Jomo Kenyatta International Airport (JKIA),
- The National Museum of Kenya (NMK) announced that it is seeking to raise Kshs 1.5 bn to construct Africa’s biggest biomes and cultural artefacts collection museum center on a 5-acre land parcel at Ololua Forest, Nairobi. Kenya National Economic Survey 2017 Report shows that the number of visitors to museums, snake parks and historical sites increased at a 3-year CAGR of 6.2% in 2013/2016 period, reporting a 15.8% increase in the number of visitors from 797,500 in 2015 to 923,100 recorded in 2016,
- Following its regional expansion strategy, Jambojet, the affordable airline subsidiary of Kenya Airways, announced plans to commence flights to Tanzania and Uganda by February 2018, with plans underway to venture into other African countries. Currently the airline operates local flights only,
- Paddock Investments renewed plans to build a 220 bed, 4-star hotel on 8.4 acres in Runda Estate. The firm forwarded a new request to the National Environmental Management Authority (NEMA) to build the Kshs 1.0 bn hotel, having previously faced opposition from the Runda Gated Community Association.
Following the closure of the electioneering chapter, we expect the sector to fully recover characterized by increased tourist arrivals and thus, increased hotel occupancy rates
Other highlights in real estate included:
- KURA announced an earlier-than-planned completion of Ngong Road’s Phase 1 upgrade. The upgrade which was set for completion in April 2018 is expected to be complete by end of December this year. Phase 1 runs from Kenya National Library to Ring Road Kilimani Junction; Phase 2 from Ring Road Junction to Dagoretti Corner, while Phase 3 will run from Dagoretti Corner to Karen Shopping Centre;
- Britam Holdings, an insurance, pensions and asset management company, announced that it will be spending half of its Kshs 9.0 bn equity fund in new real estate projects as part of the firm’s strategic plan for 2016- 2020. One of the project in its pipeline, which is being developed under the insurance company, is the Kshs 3.3 bn serviced apartments in Kileleshwa, projected for completion in 2019; it is not clear how the real estate strategy and investments will be managed between the various businesses – the group, the insurance company and the investment management arm, all of which have separate mandates;
- Kings Pride Properties Limited, a local real estate developer, is reported in the local dailies to have signed a deal with Milost Global Inc., a New York based private equity firm with over USD 25.0 bn in committed capital, to get Kshs 45.0 bn in equity cum debt financing for the expansion of their real estate developments;
- The Transport Ministry announced plans to commence the construction of the Kshs 62 bn LAPSSET project by mid-next year. The first section will cover Lamu-Garissa-Isiolo Highway, which is expected to take 4-years. The LAPSSET, which will be Eastern Africa’s largest infrastructure project, was launched in 2013 with a planned development cost of Kshs 2 tn. We expect the road to open up other areas for investment such as North-Eastern Kenya, and lead to an increase in land prices.
Listed Real Estate
In the listed real estate sub-sector, the Fahari I-REIT’s share price increased by 7.8% m/m closing at Kshs. 11.05 in the month of November from Kshs. 10.25. Since its inception, the instrument has shed 46.8% of its value, from Kshs 20.8 (the price at which it was floated at), in November 2015. We attribute the improvement to the recent measures by Capital Markets Authority to improve listed real estate’s performance by exempting it from value Added Tax, in addition to its exemption from capital gains tax and stamp duty by Kenya Revenue authority (KRA), while also investor demand given the attractive entry points and low valuations given the drop in prices.
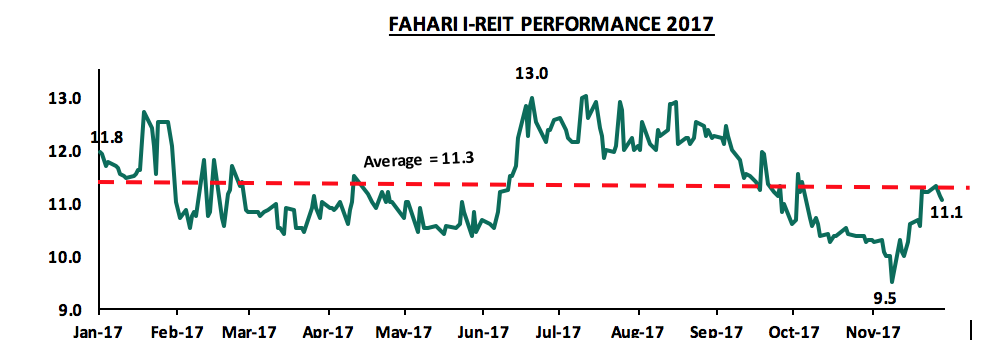
Source: Bloomberg
We anticipate further growth in the real estate sector and a better performance in 2018 than 2017 as a result of (i) improving operating environment, (ii)end of the political uncertainties and (iii) probable revision of unfavorable policies such as the 2015 Bank Amendment Act leading to improved credit advancement to the private sector, which is crucial to the capital intensive real estate sector.
In October 2016, we released Kenya’s-Hospitality-Sector-Report dubbed ‘Sailing Through The Storm’. According to the report, the hospitality sector recorded a downward trend between 2011 and 2015 with international arrivals, occupancies and Total Revenue per Available Room declining by CAGRs of 10.3%, 7.8% and 5.8%, respectively. The decline was attributed to insecurity brought about by terrorist attacks, which in turn led to issuance of negative travel advisories, thus lowering demand for accommodation and other hotel-related services in Kenya. Despite the decline initially, we have seen growth of hotels and serviced apartments in Nairobi with the opening of facilities such as Golden Tulip and Tune Inn (rebranded to Ibis Styles) and serviced apartments such as Executive Residency in 2016, while more hotels including the Lazizi Premiere and Four Points by Sheraton, JKIA, have been opened in 2017, an indication of the appetite for hospitality investment. The average occupancies for 3-star, 4-star and 5-star hotels in the Nairobi market has been at 56% over the last 5-years. In our view, the main driving factors have been improved security, aggressive government marketing and tourism incentives, which have resulted in increased travel and business tourism. In 2017, the following statistics according to KNBS have been recorded;
- International arrivals at the Jomo Kenyatta and Moi International Airports increased by 12.6% between January and July 2017 from 482,470 persons in 2016 to 543,146 persons in 2017. In August, however, arrivals declined by 7.4% due to political noise during the electioneering period period. Given the extended electioneering period, we project overall 6.2% growth in international arrivals in 2017, slower that the 13.5% growth recorded in 2016,
- The contribution of accommodation and food services to GDP increased by 0.1% points from 1.0% in H1’2016 to 1.1% in H1’2017. For the full year, we project a marginal increase in contribution to GDP from 1.1% in 2016 to 1.2% in 2017.
The above show that the sector was on an upward trend during the first half of the year but has been constrained by the effects of the Kenyan Elections. We therefore conducted research to establish trends and performance of top-rated hotels (3-star, 4-star and 5-star hotels) and serviced apartments in Nairobi and obtained information pertaining to supply, occupancy, average daily rates and revenues and thereafter identified the ideal areas to invest in.
From our survey, we found that the Nairobi Central Business District (CBD) and Westlands have the highest higher end room supply with 25.8% and 19.6% market share, respectively. In the next 5-years, however, Westlands will have the largest market share with 5 hotels under construction and set to deliver approximately 1,097 rooms. For serviced apartments, Westlands and Kilimani areas have the largest market share at 40.3% and 25.8%, respectively. Overall, having collected details of on-going and proposed projects, we project completion of at least 2,945 top-rated hotel rooms and 1,260 serviced apartments in Nairobi in the next 5-years.
In terms of performance the following were the findings;
- Hotel Average Daily Rate has declined by 18.0% from Kshs 13,909 in 2016 to Kshs 11,789. This is mainly attributable to reduced demand during the electioneering period
- Average hotel Occupancy has declined by 2.4% points from 53.0% in 2016 to 50.6% due to political noises that resulted in cancellation and postponement of planned visits
- Average hotel RevPAR has declined by 23.1% from Kshs 7,308 to Kshs 5,937 due to the reduced rates and reduced room occupancy
Performance of hotels in Nairobi according to star rating was analysed and the following were the findings;
|
All figures in Kshs unless stated otherwise |
|||||
|
2017 |
Occupancy |
Average Published Rate (Ksh) |
Average Daily Rate (Ksh) |
Charge Discount (ADR/APR) |
Revenue Per Available Room (Ksh) |
|
3-Star |
49.4% |
14,199 |
7,672 |
(46%) |
3,793 |
|
4-Star |
56.5% |
16,395 |
12,164 |
(26%) |
6,872 |
|
5-Star |
46.0% |
24,227 |
15,530 |
(36%) |
7,148 |
|
Average |
50.6% |
18,274 |
11,789 |
(36%) |
5,937 |
|
• 3-Star hotels in Nairobi in 2017 charge Kshs 7,672 for every room sold, which is a 46% discount on their average published rates, 4-Star hotels charge Kshs 12,164 for every room sold, and 5-star hotels charge Kshs 15,530 per night on average • 4-Star hotels are the best performing with an average occupancy of 56.5% compared to 3-Star hotels at 49.4% and 5-star hotels at 46.0% indicating that 4-stars are better able to fill their rooms at the set prices compared to 3-Star and 5-Star hotels • 5-Star hotels are the worst performing with an average occupancy of 46.0% and a RevPAR of Kshs 7,148, indicating they require to charge lower rates to increase occupancy |
|||||
Source: Cytonn Research, STR Global
Serviced Apartments Performance
Serviced apartments are a fast-growing sector as they charge lower rates per night than hotels (while a standard 3-star hotel charges Kshs 14,000 per night on average, a 1-bedroom serviced apartment charges Kshs 11,000 per night), provide larger spaces (while the standard hotel room size is 30-50 SQM the average size of a 1-bedroom serviced apartment is 75 SQM) and have a homely feel. For an investor, they are ideal as they have relatively longer tenancy tenures of more than a month thus providing more stable incomes and are easily convertible to other product offerings such as unserviced apartments or furnished apartments, depending on the needs of the clients. In Nairobi, assuming 40% operational costs, Westlands and Kilimani are the best-performing locations with yields of 7.3% and 7.2%, respectively, while Muthaiga North and Garden Estate along Thika road and Mombasa road are the poorest performing locations with yields of 2.6% and 3.1% as shown below:
|
All figures in Kshs unless stated otherwise |
||||||
|
Node |
Market Share |
Average Monthly Charge per SM |
Average Devt Cost per SM |
Occupancy 2016 |
Occupancy 2017 (YTD) |
Rental Yield (2017) |
|
Westlands/Parklands |
40.4% |
2,519 |
209,092 |
84.6% |
77.8% |
7.3% |
|
Kilimani |
25.9% |
2,592 |
202,662 |
78.0% |
74.0% |
7.2% |
|
Kileleshwa/Lavington |
7.3% |
2,369 |
206,132 |
85.0% |
70.0% |
7.0% |
|
Upperhill |
7.4% |
2,333 |
206,711 |
6.6% |
||
|
Limuru Road |
1.8% |
1,686 |
231,715 |
86.7% |
80.0% |
4.5% |
|
Nairobi CBD |
8.3% |
1,684 |
224,571 |
78.0% |
70.0% |
4.2% |
|
Mombasa Road |
5.8% |
1,367 |
200,757 |
64.0% |
3.1% |
|
|
Muthaiga N/Garden Estate |
3.1% |
910 |
200,757 |
78.5% |
69.0% |
2.6% |
|
Average |
|
1,949 |
210,300 |
81.8% |
72.1% |
5.8% |
|
High |
|
2,654 |
231,715 |
86.7% |
80.0% |
9.2% |
|
Low |
|
910 |
200,757 |
78.0% |
64.0% |
2.6% |
|
• Westlands and Kilimani areas are the best performing as they charge the highest rates per square meter and have retained high occupancy of above 78%. Being prime commercial hubs within the UN blue zone and with social amenities such as schools, shopping centers and hospitals, they are ideal for expatriates who are the main guests • Apartments along Thika Road (Muthaiga North and Garden Estate) and Mombasa Road have the lowest yields attributed to lower rates per square meters and low occupancies of less than 70%. Mombasa Road lacks quality serviced apartments with most service providers being individuals who therefore lack professional management and service provision skills |
||||||
Source: Cytonn Research, STR
Investment Opportunity
To establish the most ideal locations to invest in Nairobi, we used various metrics which in our view would be key considerations for investment;
- Current Supply - This refers to the existing hotel rooms stock. The higher the stock, the lesser the points awarded as it indicates potentially more competition
- Incoming Supply - This refers to hotel rooms under construction. The higher the pipeline, the lesser the points awarded as it indicates potentially more competition
- Presence of a Commercial Hub - This refers to availability of a commercial catchment area who serve as the main clients for hotels and serviced apartments
- Presence in a UN Blue Zone - These are areas marked by the United Nations as suitable for stay as they adhere to UN set standards on security, facilities, amenities, access ways, recreational facilities etc. Areas in the UN Blue zone have higher points
- Transport Network - This is to establish the ease of access within the location. Areas with easy accessibility have higher points
- Yields (serviced apartments) - This is to establish the potential returns in a location. The higher the yields, the higher the points awarded
Based on the above metrics, we allotted points to the areas on a scale of 1 to 5 as shown below with 1 being low and 5 high;
|
Hospitality Market Opportunity |
|||||
|
Supply (% of market share) |
>20% |
15%-19% |
10%-14% |
5%-9% |
<5% |
|
Points |
1 |
2 |
3 |
4 |
5 |
|
Incoming Supply (% of market share) |
>20% |
15%-19% |
10%-14% |
5%-9% |
<5% |
|
Points |
1 |
2 |
3 |
4 |
5 |
|
Commercial Hub |
Low-scale |
Lower-scale |
Mid-scale |
Upper-scale |
High-scale |
|
Points |
1 |
2 |
3 |
4 |
5 |
|
UN Blue Zone |
Area is not in the blue zone |
Partially in the blue zone |
Area is in the blue zone |
||
|
Points |
1 |
3 |
5 |
||
|
Transport Network |
Poor |
Less than Avg |
Average |
Good |
Very Good |
|
Points |
1 |
2 |
3 |
4 |
5 |
|
Yield (serviced apartments) |
<2% |
2%-4% |
5%-7% |
7%-9% |
10% and above |
|
Points |
1 |
2 |
3 |
4 |
5 |
Based on the above criteria, Upperhill emerged as the most suitable for hotel investment as it is a commercial hub with good transport network yet currently only has 8.6% share of the existing hotel room stock.
|
Hotel Investment Opportunity |
|||||||
|
Location |
Supply |
Pipeline |
Commercial Hub |
UN Blue Zone |
Transport Network |
Points |
Rank |
|
Upperhill |
4 |
3 |
5 |
5 |
5 |
4.4 |
1 |
|
Kilimani |
2 |
3 |
4 |
5 |
5 |
3.7 |
2 |
|
Kiambu/Limuru Rd |
5 |
5 |
2 |
5 |
4 |
4.0 |
2 |
|
Westlands |
2 |
1 |
5 |
5 |
5 |
3.6 |
4 |
|
Thika Rd |
5 |
5 |
2 |
3 |
4 |
3.6 |
4 |
|
Nairobi CBD |
1 |
5 |
5 |
1 |
5 |
3.4 |
6 |
|
Karen/Lang'ata |
4 |
3 |
3 |
3 |
5 |
3.4 |
6 |
|
Mombasa Rd |
3 |
3 |
3 |
1 |
5 |
2.8 |
8 |
|
• Upperhill is the most viable for investment as it is a main commercial hub and yet has only 8.6% share of the existing hotel room stock. The main challenge with Upperhill, however, is inadequate social amenities such as shopping centres and thus investors ought to consider mixed use developments that will provide the requisite social amenities; • Mombasa Rd is the least viable area for investment as it is mainly an industrial area and is not within the UN Blue zone |
|||||||
Source: Cytonn Research, STR
For serviced apartments, Upperhill and Kileleshwa/ Lavington ranked as the most ideal as they have relatively high yields of 6.6% and 7.0%, respectively, and have a low market share of serviced apartments at 7.4% and 7.3%, respectively.
|
Serviced Apartments Investment Opportunity |
|||||||
|
Location |
Supply |
Commercial Hub |
UN Blue Zone |
Transport Network |
Yield |
Points |
Ranking |
|
Upperhill |
4 |
5 |
5 |
5 |
3 |
4.3 |
1 |
|
Kileleshwa/Lavington |
4 |
3 |
5 |
5 |
4 |
4.1 |
2 |
|
Westlands |
2 |
5 |
5 |
5 |
4 |
4.0 |
3 |
|
Kilimani |
2 |
4 |
5 |
5 |
4 |
3.8 |
4 |
|
Limuru Rd |
5 |
2 |
5 |
4 |
2 |
3.6 |
5 |
|
Muthaiga North/Garden Estate |
5 |
2 |
4 |
4 |
1 |
3.1 |
6 |
|
Nairobi CBD |
4 |
4 |
1 |
4 |
2 |
2.9 |
7 |
|
Mombasa Rd |
3 |
3 |
1 |
5 |
1 |
2.3 |
8 |
|
• Upperhill and Kileleshwa/Lavington area are the most suitable for investment as they have relatively high rental yields of 6.6% and 7.0% respectively and have a relatively low market share of 7.4% and 7.3%, respectively. Both areas are within the UN Blue Zone and have a commercial catchment area • Mombasa Rd and the CBD are the least viable for investment as they are not within the UN Blue zone and have low yields of 3.1% and 4.2%, respectively |
|||||||
Source: Cytonn Research, STR
The following factors summarize our outlook on the hospitality sector;
|
Measure |
Sentiment |
Outlook |
|
Hotels Market Performance |
Occupancy rates and earnings increased in 2016 by 1.2% and 17.8% indicating recovery of the sector. In 2017 the market has been affected by political tension but only temporarily. We expect the market to recover in 2018 |
Positive |
|
Serviced Apartments Performance |
Serviced apartments had a high average occupancy of 81.8% in 2016 but has recorded declined occupancy in 2017 due to political tension. The sector is likely to recover with the conclusion of the elections |
Positive |
|
Supply |
Hotel room supply has been increasing at a 5-year CAGR of 3.6% while serviced apartments have increased by 23.6% while room occupancy during the period has declined by 4.2%. At least 4,675 hotels rooms and 1,260 serviced apartments are set to be complete in the next 5-years, and thus likely to increase competition |
Negative |
|
Domestic Tourism |
Domestic tourism grew from 46.9% of total bed nights in 2014 to 54.2% of total bed nights in 2016 and is expected to continue due to increased government incentives and marketing efforts by both the government and the industry players |
Positive |
|
International Tourism |
International arrivals grew by 13.4% in 2016 and is expected to increase by 6.2% in 2017 given improved security and the increased marketing efforts by the government |
Positive |
|
MICE Tourism |
Local MICE tourism grew by 17.4% in 2016 faster than international MICE tourism at 4.1% during the same period. Growth in the sector is boosted by devolution and increased demand for conference by corporations and groups |
Positive |
|
Opportunity |
There is an opportunity in 4-star hotels in Nairobi as they are the best performing with occupancy of 56.5% in 2017. On location, Upperhill, Kilimani and Kiambu/Limuru rd are the most viable for hotel investment. For serviced apartments, Upperhill, Lavington and Kileleshwa are the most viable for investment |
Positive |
Conclusion
In conclusion, given improved security, increased government marketing efforts, growth of MICE and domestic tourism, the hospitality sector is only likely to grow further. In 2017, we project a 6.2% increase in international arrivals, a 4.2% growth in tourism earnings, and a slight increase in contribution to GDP to 1.2% from 1.1% in 2016. While the sector was set back during the electioneering period, in our view it was only a temporary phase and the sector will pick up towards the end of the year and in 2018. The opportunity in the sector lies in serviced apartments and 4-star hotels in undersupplied markets such as Upperhill, Kileleshwa and Lavington. In other locations, given the increasing supply, developments will need to be differentiated through product offering and customer service to retain high occupancy. For the comprehensive report, see Cytonn Hospitality Report.
- Talk to us
- Kenya
- P.O Box 20695 - 00200, Nairobi, Kenya
- Cell +254(0) 709 101 000
- Tel +254(0) 20 3929 000
- WhatsApp +254(0) 748 070 000
- United States
- +1 (240) 368-6217
- DOWNLOAD OUR APP
-


- Kenya
- Cysuites work spaces, Church Rd, Westlands, Nairobi, Kenya
- USA
- Suite 1150, 1775 Eye Street NW, USA, Washington DC 20006, USA
- Investments
- High Yield
- Private Equity
- Real Estate
- Real Estate
- RiverRun Estates
- Cytonn Towers
- The Ridge
- Taraji Heights
- The Alma