Sub Saharan Africa Financial Services Report, & Cytonn Weekly #46/2017
By Cytonn Research Team, Nov 19, 2017
Executive Summary
Fixed Income
During the week, T-bills were undersubscribed, with the overall subscription rate coming in at 72.6%, compared to 106.1% recorded the previous week, as liquidity in the market tightened during the week. Yields on the 91, 182 and 364-day papers remained unchanged at 8.0%, 10.5% and 11.0%, respectively. The Monetary Policy Committee (MPC) is set to meet on Thursday, 23rd November 2017, to review the prevailing macroeconomic conditions and give direction on the Central Bank Rate (CBR) and we expect the MPC to maintain the CBR at 10.0% as per our MPC Note since, despite inflation coming down and the need to spur growth through encouraging credit growth to the private sector, there are still some risks like the political uncertainty facing the economy that may affect the currency;
Equities
During the week, the equities market recorded mixed trends with NASI and NSE 25 recording gains of 1.3% and 0.5%, respectively, while NSE 20 lost 0.6%, taking their YTD performance to 20.7%, 19.9% and 17.8% for NASI, NSE 25 and NSE 20, respectively. Kenya Airways (KQ) completed the restructuring of its debt and equity, which has seen the Kenyan government and KQ Lenders Company (a special purpose vehicle (SPV) consisting of 10 Kenyan banks) become major shareholders with holdings of 48.9% and 38.1%, respectively;
Private Equity
Pan-African ICT private equity firm, Convergence Partners, through its second fund, Convergence Partners Communications Infrastructure Fund, has bought a significant minority stake in ESET East Africa, a regional technology company, focused on offering cybersecurity solutions. On Fundraising, Amethis Finance, a Paris-based company focused on investing in debt and equity in the FMCG, financial services, healthcare and oil and gas sectors in Africa, is seeking to raise Kshs 36.0 bn, for its Amethis Fund;
Real Estate
During the week, Kenya was named as one of the next hotspots for luxury hotel investments according to a 2017 report by World Travel Market. In the retail sector, French based retailer Carrefour opened its third branch in Kenya at the Thika Road Mall, following the exit of struggling retail chain Nakumatt from the premises;
Focus of the Week
This week we analyse the Financial Services Sector in Sub-Saharan Africa, the current state and outlook of the sector to determine which listed companies are the most attractive and stable for investments from a franchise value and from a future growth opportunity (intrinsic value) perspective;
- Our Managing Partner & CEO, Edwin Dande, discussed structured products and the real estate market with Aly Khan Satchu. See Edwin here
- Our Investments Manager, Maurice Oduor, discussed the state of the country's economy. Watch Maurice on Citizen TV here
- Our Research Analyst, Nancy Murule, discussed the depressed demand in the real estate sector. Watch Nancy on KBC here
- Our Investments Analyst, John Ndua, talked about the Kenyan equities market, including the NSE's move to suspend trading in KQ shares for two weeks, as well as the performance of Uchumi Supermarkets. Listen to John on CNBC here
- David Kyalo, the Co-founder and Managing Partner at Koncepts & Events Ltd, an events planning company, trained at this week’s Cytonn Entrepreneurs Hub, Cytonn e-Hub Season 2 Finale. The training was on ‘Attracting and Retaining the Best People’. See Event Note. Cytonn eHub focuses on training and mentoring young and upcoming entrepreneurs to enhance their knowledge and capabilities on how to run and grow successful enterprises
- We continue to showcase our real estate developments through weekly site visits. Watch progress videos and pictures of The Alma, Amara, The Ridge and Taraji Heights. The site visits target both investors looking to invest in real estate directly and those interested in high yield investment products to familiarize themselves with how we support our high yields. Key to note is that our cost of capital is priced off the loan markets where all-in pricing ranges from 16.0% to 21.0% and our yield on real estate developments ranges from 23.0% to 25.0%, hence our top-line gross spread is about 6%. If interested in attending the site visits, kindly register here
- We continue to see very strong interest in our Private Wealth Management training (largely covering financial planning and structured products), which is at no cost, and is held bi-weekly, but is open only to pre-screened participants. We also continue to see institutions and investment groups interested in the trainings for their teams. The Wealth Management Trainings are run by the Cytonn Foundation under its financial literacy pillar, and if interested in the training for your employees or investment group please get in touch with us through clientservices@cytonn.com or book through this link Wealth Management Training. To view the wealth management training topics click here
- For recent news about the company, see our news section here
- We have 10 investment-ready projects, offering attractive development and buyer targeted returns of around 23.0% to 25.0% p.a. See further details here: Summary of investment-ready projects
- To invest in any of our current or upcoming real estate projects, please visit Cytonn Real Estate
- Cytonn Towers, where we are only selling residential units in the first phase of residential apartments, is currently about 20.0% sold. See Cytonn Towers
- The Alma, which is 55.0% sold. See The Alma
- Amara Ridge is currently 100.0% sold. See Amara Ridge
- Situ Village is currently 22.0% sold. See Situ Village
- The Ridge (Phase 1) is currently 31.0% sold. See The Ridge
- Taraji Heights is currently 14.0% sold. See Taraji Heights
- RiverRun Estates (Phase 1) is currently 11.0% sold. See RiverRun Estates
- With over 10 investment ready projects and over Kshs 82.0 billon of project value, we shall be very selective on new real estate projects going forward, only focusing on Joint Ventures and real estate opportunities with deep value. We are increasingly focused on private equity deals. Should you have any deals in banking, insurance, education, hospitality and technology sectors, kindly email a teaser to PE@cytonn.com
- We continue to beef up the team with ongoing hires: Careers at Cytonn . We continue the searches for key positions of a Chief Operating Officer and Financial Controller
During the week, T-bills were undersubscribed, with the overall subscription rate coming in at 72.6%, compared to 106.1% recorded the previous week, due to relatively tight liquidity in the money market. The subscription rates for the 91, 182 and 364-day papers came in at 44.2%, 91.1%, and 65.6% compared to 171.3%, 58.2% and 127.9%, respectively, the previous week. Yields on the 91, 182 and 364-day papers remained unchanged at 8.0%, 10.5% and 11.0%, respectively. The overall acceptance rate came in at 99.4%, compared to 93.7% the previous week, with the government accepting a total of Kshs 17.3 bn of the Kshs 17.4 bn worth of bids received, against the Kshs 24.0 bn on offer in this auction. The government is still behind its domestic borrowing target for the current fiscal year, having borrowed Kshs 50.4 bn, against a target of Kshs 157.8 bn (assuming a pro-rated borrowing target throughout the financial year of Kshs 410.2 bn budgeted for the full financial year as per the Cabinet-approved 2017 Budget Review and Outlook Paper (BROP).
Liquidity in the money market tightened during the week, with a net liquidity injection of Kshs 1.8 bn, compared to a net injection of Kshs 9.1 bn the previous week. The CBK was active in the Repo market, injecting Kshs 1.3 bn through Reverse Repo Purchases in a bid to counter the tight liquidity. The average interbank rate declined slightly to 8.6% from 8.8% recorded the previous week, while the average volumes traded in the interbank market decreased by 17.7% to Kshs 25.6 bn from Kshs 31.1 bn the previous week. Of note is that this week, banks’ holding of excess liquidity stood at Kshs 4.4 bn above the 5.25% requirement, from Kshs 2.1 bn the previous week. There was T-bill rediscounting of Kshs 3.7 bn, which indicates that there are some players that faced significant liquidity challenges, since rediscounting is very punitive and is usually done at the prevailing yields plus 3.0% points thus making the value of the discounted T-bills much lower than their market value.
Below is a summary of the money market activity during the week:
|
all values in Kshs bn, unless stated otherwise |
|||||||||||
|
Weekly Liquidity Position – Kenya |
|||||||||||
|
Liquidity Injection |
|
Liquidity Reduction |
|
||||||||
|
Government Payments |
18.9 |
Transfer from Banks - Taxes |
27.4 |
||||||||
|
T-bill Redemption |
27.4 |
T-bill (Primary issues) |
23.9 |
||||||||
|
Reverse Repo Purchases |
1.3 |
Reverse Repo Maturities |
1.3 |
||||||||
|
Repos Maturities |
0.7 |
||||||||||
|
T-bill Re-discounts |
3.7 |
||||||||||
|
T-bonds Interest |
2.4 |
||||||||||
|
Total Liquidity Injection |
54.4 |
Total Liquidity Withdrawal |
52.6 |
||||||||
|
Net Liquidity Injection |
1.8 |
||||||||||
The Kenyan government has issued a 7-year amortized Infrastructure Bond (IFB 1/2017/7), with an effective tenor of 6.0 years, and a coupon of 12.5%, in a bid to raise Kshs 30.0 bn for partial support of infrastructural projects in the roads (Kshs 10.0 bn), energy (Kshs 15.0 bn) and water (Kshs 5.0 bn) sectors. Given that (i) the government is behind its domestic borrowing target for the current fiscal year, having borrowed Kshs 50.4 bn, against a target of Kshs 157.8 bn, and (ii) the Kenya Revenue Authority (KRA) is expected to miss its 2017/18 fiscal year revenue collection target of Kshs 1.7 tn, there is possibility of upward pressure on interest rates and thus we expect investors to demand a premium in this auction. The bond has a weighted tenor of 6.0 years after adjusting for partial redemptions, and a similar taxable bond with the same tenor is currently trading at a yield of 12.6% in the secondary market, and hence we would bid at a yield of between 11.6% and 12.6%.
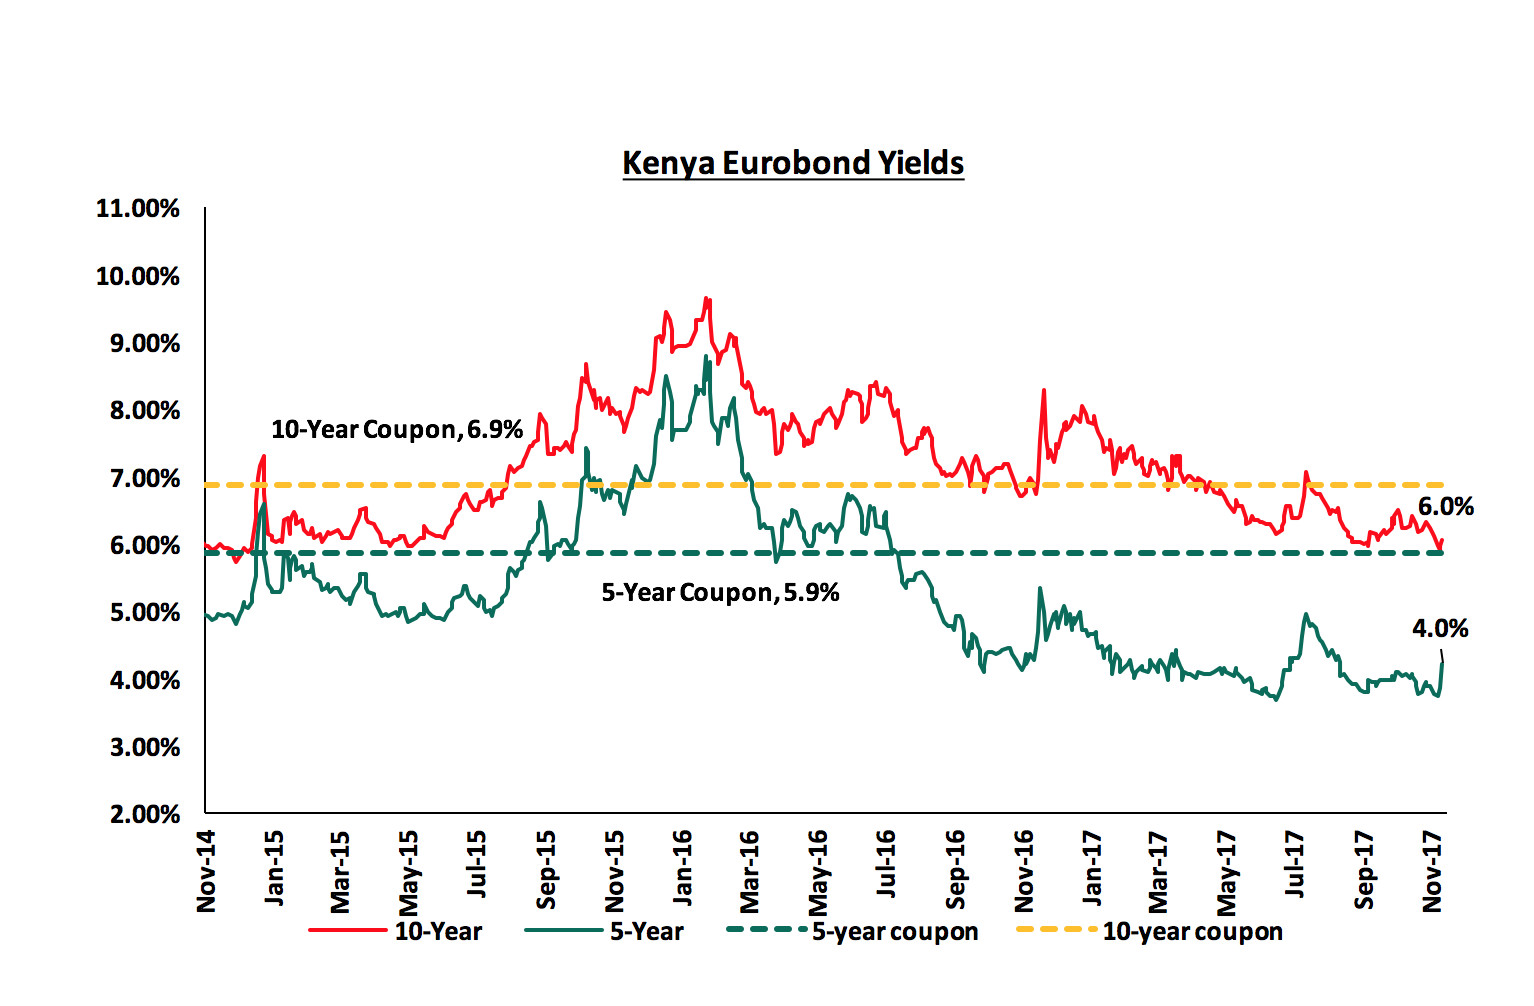
According to Bloomberg, yields on the 5-year and 10-year Eurobonds declined by 20 bps and 30 bps, respectively, during the week, to close at 4.0% and 6.0%, from 4.2% and 6.3% the previous week, respectively. Since the mid-January 2016 peak, yields on the Kenya Eurobonds have declined by 4.8% points and 3.6% points for the 5-year and 10-year Eurobonds, respectively, due to the relatively stable macroeconomic conditions in the country. The declining Eurobond yields and stable rating by Standard & Poor (S&P), in spite of the political uncertainty around the presidential poll re-run, are indications that Kenya’s macro-economic environment remains stable and hence an attractive investment destination. However, concerns from Moody’s around Kenya’s rising debt to GDP levels may see Kenya receive a downgraded sovereign credit rating.
The Kenya Shilling depreciated by 0.3% against the US Dollar during the week to close at Kshs 103.9, from Kshs 103.6 recorded the previous week, due to speculation in the forex market following political uncertainty. On a year to date basis, the shilling has depreciated against the dollar by 1.4%. In our view, the shilling should remain relatively stable against the dollar in the short term supported by (i) the weakening of the USD in the global markets as indicated by the US Dollar Index, which has shed 8.4% year to date, and (ii) the CBK’s activity, as they have sufficient forex reserves, currently at USD 7.1 bn (equivalent to 4.7 months of import cover). The key factor to watch is the current account deficit that worsened to 6.4% of GDP in July, as compared to 6.2% of GDP in May 2017.
The Monetary Policy Committee (MPC) is set to meet on Thursday, 23rd November 2017 to review the prevailing macroeconomic conditions and give direction on the Central Bank Rate (CBR). In their previous meeting held in September 2017, the MPC maintained the CBR at 10.0% on account of; (i) the inflation rate had declined to 8.0% in August from 9.2% in June, due to a decline in food prices brought about by the rains, albeit depressed, (ii) a relatively stable foreign exchange market, with foreign reserves at USD 7.5 bn (equivalent to 5.0 months of import cover), and (iii) a resilient banking sector, with the average commercial banks liquidity ratio and capital adequacy ratio at 45.6% and 19.0%, above the statutory minimum of 20.0% and 14.5%, respectively, as at August 2017. We expect the MPC to maintain rates at the current levels due to a relatively stable macro-economic environment, as evidenced by (i) inflation has eased to 5.7% from 8.0%, due to a drop in food prices, and (ii) the currency has been relatively stable, depreciating by only 0.3% over the same period. For our comprehensive analysis on the same, see our MPC Note.
Rates in the fixed income market have remained stable, and we expect this to continue in the short-term. However, a budget deficit that is likely to result from depressed revenue collection creates uncertainty in the interest rates environment as any additional borrowing in the domestic market to plug the deficit could lead to upward pressures on interest rates. Our view is that investors should be biased towards short-to medium term fixed income instruments to reduce duration risk.
During the week, the equities market recorded mixed trends with NASI and NSE 25 recording gains of 1.3% and 0.5%, respectively, while NSE 20 lost 0.6%, taking their YTD performance to 20.7%, 19.9% and 17.8% for NASI, NSE 25 and NSE 20, respectively. This week’s performance was driven by gains in select large cap stocks such as Safaricom, Equity Group and Bamburi, which gained 4.1%, 1.9% and 1.7%, respectively. This is despite losses of 4.0% and 2.9% by Standard Chartered Bank and EABL, respectively. Since the February 2015 peak, the market has lost 8.1% and 32.2% for NASI and NSE 20, respectively.
Equities turnover increased by 15.7% to USD 33.5 mn from USD 28.9 mn the previous week. Foreign investors were net buyers with a net inflow of USD 1.3 mn compared to a net inflow of USD 2.3 mn recorded the previous week. We expect the market to remain supported by improved investor sentiment once uncertainty dissipates, as investors take advantage of the attractive stock valuations.
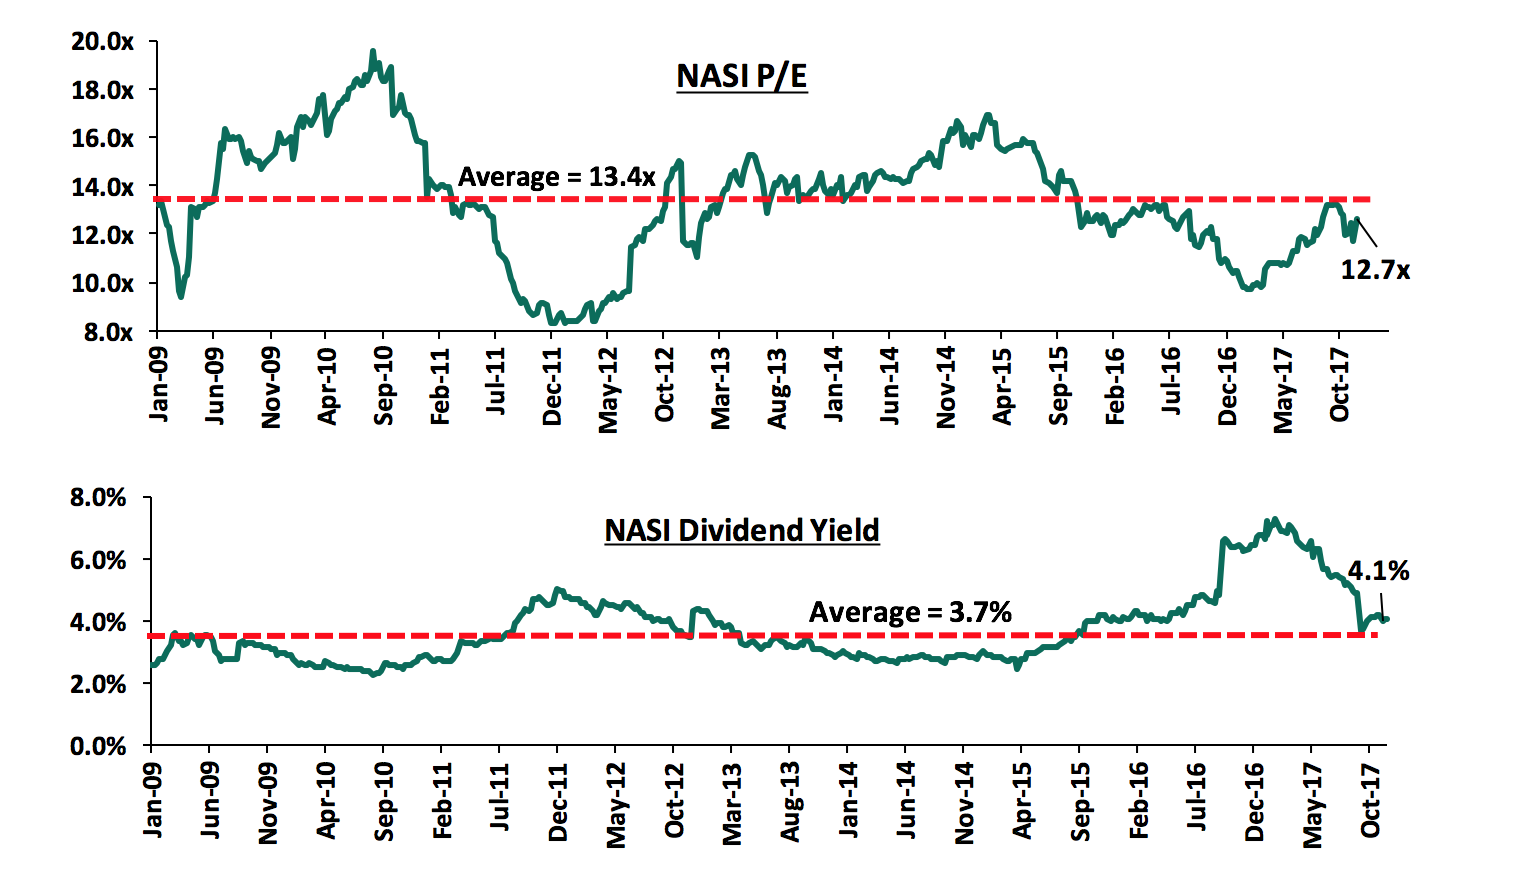
The market is currently trading at a price to earnings ratio (P/E) of 12.7x, versus a historical average of 13.4x, and a dividend yield of 4.1%, compared to a historical average of 3.7%. In our view, there still exist pockets of value in the market, with the current P/E valuation being 25.2% below the most recent peak in February 2015. The current P/E valuation of 12.7x is 30.5% above the most recent trough valuation of 9.7x experienced in the first week of February 2017, and 52.3% above the previous trough valuation of 8.3x experienced in December 2011. The charts below indicate the historical P/E and dividend yields of the market.
Kenya Airways (KQ) has completed the restructuring of its debt and equity following the signing of the agreement by main lenders including the Kenyan government, KLM, and KQ Lenders Company, a special purpose vehicle (SPV) consisting of 10 Kenyan banks. The unsecured lenders have converted their debt to equity, all ranking at the same position and at the same conversion price of Kshs 2.13. This resulted in a 94.8% dilution of the previous shareholders who are not lenders. In addition to the debt conversion, KQ carried out a reverse stock split in which 1 ordinary share of nominal value Kshs 5.0 will be split into 1 Interim share and 19 new deferred shares of Kshs 0.25 each, and finally 4 interim shares will be consolidated into 1 ordinary share of Kshs 1.0 each.
The table below shows the details of the above transaction:
|
Kenya Airways Ownership Summary Following Debt and Equity Restructuring |
|||||||
|
Lender |
Previous Ownership |
Current Shares Held after Reverse Stock Split |
Debt (in USD mn) |
New Shares Issued in Restructuring |
% Ownership from New Shares |
Total Shares After Restructuring |
% Ownership After Restructuring |
|
Government |
29.8% |
111,480,139 |
278.6 |
2,736,364,671 |
47.6% |
2,847,844,810 |
48.9% |
|
KLM |
26.7% |
100,005,007 |
76.5 |
351,656,464 |
6.1% |
451,661,471 |
7.8% |
|
KQ Lenders Co Ltd |
0.0% |
- |
220.7 |
2,219,285,317 |
38.6% |
2,219,285,317 |
38.1% |
|
ESOP |
0.0% |
- |
11.8 |
142,164,558 |
2.5% |
142,164,558 |
2.4% |
|
Other Shareholders |
43.5% |
162,632,113 |
- |
- |
0.0% |
162,632,113 |
2.8% |
|
Total |
100.0% |
374,117,259 |
587.6 |
5,449,471,010 |
94.8% |
5,823,588,269 |
100.0% |
Following the debt restructuring, the Government’s ownership of KQ will rise to 48.9% from the current 29.8%, while the consortium of bank’s vehicle (KQ Lenders) will own 38.1% of the airline. Other shareholders (with exception of Government, KLM and KQ Lenders) will be given an opportunity to increase their investment through an open offer to raise up to Kshs 1.5 bn through an issue of new Ordinary Shares in order to defend their stakes against the significant 94.8% dilution. As highlighted in our Cytonn Weekly #29/2017, we view the conversion as a positive move for the airline as: (i) it will boost the firm’s equity position to a positive of approximately Kshs 12.1 bn following the conversion of Kshs 60.2 bn debt to equity, from the current negative position of Kshs 48.1 bn, (ii) it will reduce the overall debt burden, thus stabilizing the company and facilitating long term growth, in line with its turnaround strategy, and (iii) it will result in a significant boost in liquidity through savings on interest and maturity payments on debt, thus improving the airline’s cash flow position. The new shareholders, namely the lenders consortium, are also likely to cause changes in governance, which we believe will be beneficial for the firm, to ensure keen oversight on the implementation of its turn-around strategy. The board changes have already started with the recent appointment of three new board members namely; Martin Oduor and Carol Musyoka were appointed as non-executive directors to represent the 10 Kenyan banks, and Esther Koimett who shall represent Treasury in the board. The key takeaway from this transaction is that the current troubled and overleveraged retailers such as Uchumi and Nakumatt should follow KQ’s example and pursue a conversion of their debt into equity.
During the week, we had a number of earnings releases. Below is the detailed analysis of the earnings’ releases:
Diamond Trust Bank (DTB) released Q3’2017 results
Diamond Trust Bank released Q3’2017 results, recording a 3.5% decline in core earnings per share to Kshs 18.3 from Kshs 19.0 in Q3’2016, attributed to a 0.2% decline in total operating income, and a 2.5% increase in operating expenses. Key highlights for the performance from Q3’2016 to Q3’2017 include:
- Total operating income declined marginally by 0.2% to Kshs 18.37 bn from Kshs 18.40 bn in Q3'2016. The stable performance was supported by a 4.7% growth in Non-Funded Income to Kshs 3.9 bn from Kshs 3.7 bn in Q3'2016, despite a 1.4% decline in Net Interest Income (NII) to Kshs 14.5 bn from 14.7 bn,
- Interest Income increased slightly by 0.8% to Kshs 25.7 bn from Kshs 25.5 bn in Q3’2016, driven by an 2% increase in investment in government securities to Kshs 109.0 bn from Kshs 92.2 bn in Q3'2016. The interest income on government securities alone grew by 27.8% y/y to Kshs 8.7 bn from Kshs 6.8 bn, while interest income on loans and advances alone declined by 8.8% y/y to Kshs 16.8 bn from Kshs 18.4 bn despite an 8.1% loan book growth. As a result, the yield on interest-earning assets declined to 8.6% from 10.2% in Q3’2016,
- Interest expense increased by 3.7% to Kshs 11.2 bn from Kshs 10.8 bn in Q3’2016, following a 4.0% growth in interest expense on customer deposits to Kshs 10.1 bn from Kshs 9.7 bn. This is despite a 16.5% growth in deposits. The cost of funds therefore declined to 4.0% from 4.6% in Q3’2016,
- Net Interest Income declined by 1.4% to Kshs 14.5 bn from Kshs 14.7 bn, with the Net Interest Margin declining to 6.4% from 7.6% in Q3'2016,
- Non-Funded Income (NFI) recorded a growth of 4.7% to Kshs 3.9 bn from Kshs 3.7 bn in Q3'2016. The growth in NFI was driven by an 8.6% increase in total fees and commissions on loans to Kshs 2.4 bn from Kshs 2.2 bn in Q3’2016 and a 52.6% y/y increase in other income to Kshs 0.3 bn from Kshs 0.2 bn. This is despite a 9.7% decline in foreign exchange trading income to Kshs 1.2 bn from Kshs 1.3 bn in Q3’2016. The current revenue mix remained relatively the same at 79:21 funded to non-funded income from 80:20 in Q3’2016,
- The 8.6% increase in total fees and commissions on loans was driven by an 8.1% expansion in the value of total loans issued and an increase in fees charged on loans by banks,
- Total operating expenses increased by 2.5% to Kshs 10.9 bn from Kshs 10.6 bn, driven by an 8.3% increase in staff costs to Kshs 3.0 bn from Kshs 2.8 bn as DTB had to take on 41 staff members from Habib Bank Kenya as a precondition for the authorization of the acquisition transaction by the Competition Authority of Kenya. This was despite a 19.6% decline in Loan Loss Provisions (LLP) to Kshs 3.0 bn from Kshs 3.6 bn in Q3'2016. Staff costs and LLPs account for 27.4% and 26.7%, respectively of the total operating expenses,
- The Cost to Income ratio increased to 59.1% from 57.6% in Q3'2016 following a 2.5% increase in total operating expenses coupled with a 0.2% decline total operating income. Without LLP, the Cost to Income ratio worsened by a bigger margin to 43.3% from 38.0% in Q3'2016,
- Profit before tax decreased by 3.6% to Kshs 7.5 bn from Kshs 7.8 bn, while profit after tax decreased by 3.5% to Kshs 5.1 bn from Kshs 5.3 bn in Q3’2016,
- The total assets increased by 13.8% to Kshs 357.2 bn from Kshs 313.8 bn in Q3'2016. This growth was driven by an 18.2% increase in investment in government securities to Kshs 109.0 bn from Kshs 92.2 bn in Q3'2016, and an 8.1% increase in the loan book, which accounts for 55.0% of the bank’s total assets, to Kshs 196.3 bn from Kshs 181.6 bn in Q3’2016. The value of property & equipment also increased by 21.8% y/y to Kshs 6.7 bn from Kshs 5.5 bn, attributed to the completion of acquisition of 5 HBLK branches in Kenya,
- Total liabilities rose by 12.6% to Kshs 305.3 bn from Kshs 271.2 bn in Q3'2016, driven by a 16.5% increase in deposits to Kshs 265.0 bn from Kshs 227.4 bn in Q3'2016,
- Shareholders’ funds increased by 23.6% to Kshs 46.7 bn from Kshs 37.8 bn in Q3’2016 driven by an 18.3% increase in retained earnings to Kshs 34.6 bn from Kshs 29.2 bn,
- The faster growth in deposits compared to the loan book led to a decline in the loan to deposit ratio to 74.1% from 79.8% in Q3'2016.
A key takeout from DTBK’s Q3’2017 earnings is the gradual deterioration in asset quality from 1.4% in Q3’2014 to 1.6% in Q3’2015 to 4.1% in Q3’2016 and has now drastically worsened to 8.0% in Q3’2017. Going forward, DTBK will have to be more prudent in its credit risk analysis, to avoid such high NPLs that will only lead to more provisioning and affect its bottom line negatively. In order to drive growth, the bank plans to increase its tech-savvy branch count to increase efficiency in running its physical branch network while still growing its client base and mobilizing more in deposits. We expect the lender to be very prudent in exploring measures towards maintaining efficiency. Another key driver for the bank will be diversification of its revenue streams to grow its Non Funded Income, especially with the declining funded income as a result of the interest rate caps. Compared to its peers, DTBK is the least diversified in terms of revenue streams, with NFI to total operating income at 21.2%, compared to an average of 34.8% for the five Tier 1 banks that have released Q3’2017 earnings.
For a more comprehensive analysis, see our Diamond Trust Bank Q3’2017 Earnings Note.
Standard Chartered Bank released Q3’2017 results
Standard Chartered Bank released Q3’2017 results, recording a 39.1% decline in core earnings per share to Kshs 13.7 from Kshs 22.5 in Q3’2016, attributed to a 27.1% increase in operating expenses and a 6.5% decline in operating revenue. Key highlights for the performance from Q3’2016 to Q3’2017 include:
- Total operating revenue declined by 6.5% y/y to Kshs 20.2 bn from Kshs 21.6 bn, attributed to an 8.0% decline in Net Interest Income (NII) to Kshs 13.8 bn from Kshs 15.0 bn, and a 3.2% decline in Non-Funded Income (NFI) to Kshs 6.4 bn from Kshs 6.6 bn in Q3'2016,
- Interest Income declined slightly by 1.4% to Kshs 19.4 bn from Kshs 19.7 bn in Q3’2016. The interest income on loans and advances alone declined by 12.1% y/y to Kshs 10.1 bn from Kshs 11.5 bn, while interest income on government securities grew by 10.0% y/y to Kshs 8.3 bn from Kshs 7.5 bn. As a result, the yield on interest-earning assets declined to 11.3% from 12.6% in Q3’2016,
- Interest expense grew by 19.1% to Kshs 5.7 bn from Kshs 4.7 bn in Q3’2016, following an 11.2% increase in interest expense on customer deposits to Kshs 4.7 bn from Kshs 4.2 bn. The growth in interest expense was also driven by a 19.5% increase in deposits. The cost of funding declined marginally to 3.3% from 3.4% in Q3’2016,
- Net Interest Income declined by 8.0% to Kshs 13.8 bn from Kshs 15.0 bn in Q3’2016, with the Net Interest Margin declining to 8.1% from 9.6% in Q3'2016,
- Non-Funded Income (NFI) recorded a decline of 3.2% to Kshs 6.4 bn from Kshs 6.6 bn in Q3'2016. The decline in NFI was attributed to a 4.0% decrease in total fees and commissions on loans to Kshs 3.2 bn from Kshs 3.3 bn in Q3’2016, and a 15.4% decrease in forex trading income to Kshs 1.9 bn from Kshs 2.2 bn in Q3’2016. The current revenue mix stands at 68:32 funded to non-funded income from 69:31 in Q3’2016,
- Total operating expenses increased by 27.1% to Kshs 13.2 bn from Kshs 10.5 bn, driven by a 104.5% increase in Loan Loss Provision (LLP) to Kshs 3.7 bn from Kshs 1.8 bn in Q3'2016. Staff costs grew by 10.0% to Kshs 5.2 bn from Kshs 4.7 bn in Q3’2016. The increase in LLP was as a result of increase in Non-Performing Loans during the year with the gross NPL ratio increasing from 12.1% in Q1’2016, to 13.1% in H1’2016 and currently at 13.4%. The bank does not expect a turn-around on these accounts by end of the year, which implies that LLPs are likely to increase further, and with the expected adoption of IFRS 9 in January 2018, this is likely to affect the bank’s profitability even in early 2018,
- The Cost to Income ratio worsened to 66.0% from 48.5% in Q3'2016 following a 27.1% increase in total operating expenses. Without LLP, the Cost to Income ratio worsened to 47.5% from 40.1% in Q3'2016,
- Profit before tax declined by 38.2% to Kshs 6.9 bn from Kshs 11.1 bn. Profit after tax declined by 39.1% to Kshs 4.7 bn from Kshs 7.7 bn in Q3’2016, following an increase in effective tax rate to 32.0% from 31.4% in Q3’2016,
- The total assets increased by 17.5% to Kshs 310.5 bn from Kshs 264.3 bn in Q3'2016. This growth was driven by a 19.9% growth in government securities to Kshs 114.1 bn from Kshs 95.1 bn in Q3’2016. The loan book contracted by 5.4% to Kshs 114.2 bn from Kshs 120.8 bn in Q3'2016,
- Total liabilities rose by 20.6% to Kshs 265.7 bn from Kshs 220.3 bn in Q3'2016, driven by a 19.5% increase in deposits to Kshs 238.5 bn from Kshs 199.6 bn in Q3'2016,
- Shareholders’ funds increased by 2.0% to Kshs 44.8 bn from Kshs 43.9 bn in Q3’2016,
- The growth in deposits coupled with a decline in loans led to a decrease in the loan to deposit ratio to 47.9% from 60.5% in Q3'2016,
Standard Chartered Bank has issued a profit warning for FY'2017 earnings, implying that the FY’2017 earnings will be at least 25.0% lower than FY'2016 earnings. This was attributed to 2 factors:
- The bank's Non-Performing Loans (NPL) have increased during the year, and no turnaround on the accounts is expected before the year-end. Gross NPLs currently stand at Kshs 17.0 bn, a 15.4% growth from Kshs 14.7 bn in Q3'2016, with the gross NPL ratio increasing to 13.4% from 11.6% in Q3’2016,
- The effects of interest rate cap coupled with a slowdown in economic activity in the country.
Going forward, Standard Chartered Bank’s growth will be driven by continued investment in digital infrastructure through its Digital by Design strategy that aims to migrate over 80% of transactions to non-branch channels by 2020, which is expected to promote cost efficiency. Additionally, the rollout of enhanced mobile and online banking products, particularly targeting SME and retail business, is expected to drive growth in deposits and loans.
For a more comprehensive analysis, see our Standard Chartered Bank Q3’2017 Earnings Note.
Below is a summary of the Q3’2017 results for the five listed banks that have released thus far and key take-outs from the results:
|
Listed Banks Q3'2017 Earnings and Growth Metrics |
|||||||||||||
|
Bank |
Core EPS Growth |
Interest Income Growth |
Interest Expense Growth |
Net Interest Income Growth |
Non Funded Income (NFI) Growth |
NFI to Total Operating Income |
Growth in fees & commissions |
Loan Growth |
Deposits Growth |
Growth in Govt Securities 2017 |
|||
|
Q3'2017 |
Q3'2016 |
Q3'2017 |
Q3'2017 |
Q3'2017 |
Q3'2017 |
Q3'2017 |
Q3'2017 |
Q3'2017 |
Q3'2016 |
Q3'2017 |
Q3'2016 |
Q3'2017 |
|
|
KCB |
5.0% |
16.1% |
(3.6%) |
(10.9%) |
(1.0%) |
18.4% |
32.9% |
25.5% |
15.1% |
4.9% |
13.6% |
(7.3%) |
2.8% |
|
Equity |
(2.7%) |
17.7% |
(11.1%) |
5.9% |
(15.0%) |
28.3% |
43.6% |
24.9% |
(2.2%) |
3.0% |
11.3% |
4.8% |
17.7% |
|
DTB |
(3.5%) |
11.4% |
0.8% |
3.7% |
(1.4%) |
4.7% |
21.2% |
8.6% |
8.1% |
5.4% |
16.5% |
29.9% |
18.2% |
|
Co-op |
(9.5%) |
22.3% |
(7.7%) |
(8.5%) |
(7.3%) |
2.7% |
32.8% |
5.9% |
14.2% |
6.9% |
12.1% |
1.7% |
0.8% |
|
StanChart |
(39.1%) |
24.5% |
(1.4%) |
19.1% |
(8.0%) |
(3.2%) |
31.8% |
(4.0%) |
(5.4%) |
14.1% |
19.5% |
19.8% |
19.9% |
|
Weighted Average* |
(7.6%) |
18.6% |
(5.9%) |
0.7% |
(7.6%) |
13.9% |
34.8% |
15.5% |
5.8% |
6.1% |
13.8% |
5.9% |
11.1% |
*The weighted average is based on Market Cap as at 17th November 2017
Key takeaways:
- Of the 5 banks that have released their Q3’2017 results, only KCB Group has recorded a growth in core earnings per share, with the average decline in core earnings across the banking sector at 7.6%, owing to the tough operating environment as a result of the interest rate caps and political uncertainty in the country that affected the business environment,
- Average deposit growth has been 13.8%. However, despite the average deposits having grown, the interest expense paid on deposits grew by only 0.7% on average, indicating that banks are growing deposits but opening less interest earning accounts and possibly transferring some existing interest earning accounts to transaction accounts,
- Average loan growth has been 5.8%, however interest income has decreased by 5.9%, showing the effects of the rate caps,
- Investment in government securities has grown by 11.1% outpacing loan growth of 5.8%, showing increased lending to the government by banks as they avoid the risky borrowers,
- Non-funded income has however grown by 13.9%, which included a Fee and Commissions growth of 15.5%. This shows that banks are charging more fee income to improve their total yield on loans above the rate cap maximum,
- In summary, it appears that banks are coping with the interest rate cap regime by a combination of the following:
- Increased investment in government securities rather than in lending,
- Significant increases in fees and commissions charged on loans, and
- Increasingly directing deposits to non-interest bearing transaction accounts.
In order to ensure that the ranking of companies in the Cytonn Corporate Governance Report (Cytonn CGR) is up to date, we shall continually be updating the rankings whenever there are changes on any of the 24 metrics that we track and how they impact on the ranking. This week Kenya Airways (KQ) appointed three directors to its board following change in its shareholding after debt and equity restructuring; Martin Oduor and Carol Musyoka were appointed as non-executive directors to represent the 10 Kenyan banks, and Esther Koimett who shall represent Treasury in the board. KQ’s score has however remained unchanged at 58.3% as the changes in board composition do not warrant a change in score. Board size increased to an odd number 13 from an even number 10, but the score remained at 0.5 since the number 13 is above the desired maximum size of 11 members. The gender diversity score improved to 30.8% from 20.0%, maintaining the same score of 0.5. KQ’s rank has therefore remained at position 39.
Below is our Equities Universe of Coverage:
|
all prices in Kshs unless stated otherwise |
|||||||||||||
|
No. |
Company |
Price as at 10/11/17 |
Price as at 17/11/17 |
w/w Change |
YTD Change |
Target Price* |
Dividend Yield |
Upside/ (Downside)** |
|||||
|
1. |
NIC*** |
38.0 |
36.3 |
(4.6%) |
39.4% |
58.2 |
3.4% |
64.0% |
|||||
|
2. |
KCB Group*** |
40.5 |
41.0 |
1.2% |
42.6% |
57.1 |
4.9% |
44.1% |
|||||
|
3. |
Barclays |
10.0 |
9.9 |
(1.5%) |
16.2% |
12.5 |
10.1% |
37.0% |
|||||
|
4. |
Liberty |
12.0 |
12.5 |
4.2% |
(5.3%) |
16.4 |
0.0% |
31.2% |
|||||
|
5. |
I&M Holdings |
120.0 |
120.0 |
0.0% |
33.3% |
149.6 |
2.5% |
27.2% |
|||||
|
6. |
DTBK |
189.0 |
187.0 |
(1.1%) |
58.5% |
234.1 |
1.3% |
26.5% |
|||||
|
7. |
Kenya Re |
20.0 |
19.9 |
(0.5%) |
(11.6%) |
24.4 |
3.8% |
26.4% |
|||||
|
8. |
Jubilee Insurance |
494.0 |
494.0 |
0.0% |
0.8% |
575.4 |
1.8% |
18.2% |
|||||
|
9. |
HF Group*** |
12.4 |
12.2 |
(1.6%) |
(12.9%) |
14.2 |
1.8% |
18.2% |
|||||
|
10. |
Sanlam Kenya |
28.8 |
27.0 |
(6.1%) |
(1.8%) |
31.4 |
1.1% |
17.3% |
|||||
|
11. |
Co-op Bank |
16.3 |
16.1 |
(1.2%) |
21.6% |
17.5 |
5.8% |
14.8% |
|||||
|
12. |
CIC Group |
5.6 |
5.6 |
(0.9%) |
46.1% |
6.2 |
1.8% |
13.5% |
|||||
|
13. |
Britam |
14.2 |
14.5 |
2.1% |
45.0% |
15.2 |
1.6% |
6.4% |
|||||
|
14. |
Equity Group |
40.0 |
40.8 |
1.9% |
35.8% |
40.5 |
4.9% |
4.3% |
|||||
|
15. |
Stanbic Holdings |
80.0 |
80.0 |
0.0% |
13.5% |
79.1 |
5.2% |
4.0% |
|||||
|
16. |
Standard Chartered |
227.0 |
218.0 |
(4.0%) |
15.3% |
199.8 |
4.7% |
(3.6%) |
|||||
|
17. |
NBK |
10.9 |
10.1 |
(7.8%) |
39.6% |
5.2 |
0.0% |
(48.5%) |
|||||
|
*Target Price as per Cytonn Analyst estimates |
|||||||||||||
|
**Upside / (Downside) is adjusted for Dividend Yield |
|||||||||||||
|
***Banks in which Cytonn and/or its affiliates holds a stake |
|||||||||||||
|
For full disclosure, Cytonn and/or its affiliates holds a significant stake in KCB Group and NIC Bank, ranking as the 5th largest local institutional investor and the 9th largest shareholder, respectively |
|||||||||||||
We maintain a “NEUTRAL” view on equities for investors with short-term investment horizon since, despite the lower earnings growth prospects for this year, the market has rallied and brought the market P/E closer to its’ historical average. Pockets of value exist, with a number of undervalued sectors like Financial Services, which provide an attractive entry point for long-term investors and thus we are positive for investors with a long-term investment horizon.
Pan-African ICT private equity firm Convergence Partners, through its second fund Convergence Partners Communications Infrastructure Fund, has bought a significant minority stake in ESET East Africa, a subsidiary of ESET Global. ESET East Africa is a regional technology company focused on offering cybersecurity solutions. Convergence has previously invested in other technology firms such as 4 Di capital, a venture capital firm offering seed capital for technology firms, and SeaCom, a submarine and terrestrial fibre bandwidth provider through its USD 85.0 mn first fund and in other 7 technology firms across Africa through its USD 200.0 mn second fund. The acquisition gives Convergence Partners an opportunity for growth and expansion in the region. For ESET, the partnership will be advantageous as (i) it will support the firm’s expansion strategy in the East African region, having just opened its first office in Kenya in 2016, and (ii) it gives the firm a chance to ride on Convergence Partners’ distribution network across Africa. The continued interest by investors in technology-driven companies is catalysed by the rising need for tech-products as more businesses seek to enhance efficiency and reduce costs.
South Africa’s pension fund, Public Investment Corporation (PIC), has raised its stake in electricity generator KenGen to 10.0%, from the 5.0% held after its initial purchase in February 2017 through the purchase of an additional 351 mn shares. At current market price, PIC’s current investment in KenGen is worth Kshs 6.5 bn. PIC’s first investment in KenGen was in February this year, where the fund took up the 351.2 mn shares that were unsubscribed for during KenGen’s June 2016 rights issue, at a unit price of Kshs 6.55 per share, bringing their initial investment to Kshs 2.3 bn. The investment makes PIC the second largest investor in KenGen after The National Treasury who currently owns 70.0% of the company, down from the 73.9% prior to PIC’s initial investment. The aggressive purchase by PIC during the year has lifted KenGen’s stock price to Kshs 8.6 per share, from lows of Kshs 5.5 per share at the beginning of the year, a 56.4% growth in price. PIC’s investment is seen as part of its move to seek growth and geographical diversification outside South Africa, where it holds about 12.5% of Johannesburg Stock Exchange market capitalization through its investment in over 30 listed firms.
On the fundraising front, Amethis Finance, a Paris-based company focused on investing in debt and equity in the FMCG, financial services, healthcare and oil and gas sectors in Africa, is seeking to raise Kshs 36.0 bn, for its Amethis Fund II. The fund will be invested in mid-market companies in financial institutions, fast-moving consumer goods, healthcare, agribusiness, education, IT and telecommunications sectors in 11 African countries including Kenya. The World Bank’s, International Finance Corporation (IFC), has made a proposition of Kshs 1.8 bn in equity investment to the fund. Amethis, through its first fund, the USD 324.4 mn Amethis Fund I, has invested in 12 equity deals including a USD 10.5 mn investment in Kenya’s Chase Bank in 2013 and an undisclosed amount in Kenafric Industries in February this year. The increasing fundraising activity by private equity firms indicates a positive outlook by investors in the Sub-Saharan Africa private equity space, motivated by the continued growth in the sector.
Private equity investments in Africa remains robust as evidenced by the growing number of successful exits. The increasing investor interest is attributed to (i) rapid urbanization, a resilient and adapting middle class and increased consumerism, (ii) the attractive valuations in Sub Saharan Africa’s private markets compared to its public markets, (iii) the attractive valuations in Sub Saharan Africa’s markets compared to global markets, and (iv) better economic projections in Sub Sahara Africa compared to global markets. We remain bullish on PE as an asset class in Sub-Sahara Africa. Going forward, the increasing investor interest and stable macro-economic environment will continue to boost deal flow into African markets.
Kenya has been named as one of the next hotspots for luxury hotel investments according to a report released by World Travel Market 2017. While Kenya was not ranked among the Top 100 Countries, it is poised for growth given the 13.5% growth in international arrivals recorded in 2016 to 1.3 mn from 1.2 mn persons in 2015. In addition, there is an increasing pipeline of hotels in Kenya with 3,453 rooms according to a Lagos based consultancy, W Hospitality Report 2017. In Nairobi alone, we estimate completion of at least 2,737 rooms in the next 5-years with brands such as Movenpick and Ramada set to enter the market. Some of the hotels under development include; the mixed use Cytonn Towers in Kilimani, which is expected to have 180 hotel rooms, the Kshs 2.3 bn Hilton Garden Inn along Mombasa Road that is expected to have 175 rooms, and the Kshs 10.0 bn Avic Towers in Westlands set to have 365 rooms.
In our view, the growth of luxury hotels is supported by;
- Increased number of international tourism arrivals - According to the Kenya National Bureau of Statistics’ Economic Survey 2017, the country experienced an increase of 13.5% in international visitor’s arrival in the year 2015/2016 mainly attributed to improved security in the country and aggressive marketing in the domestic and international markets. According to the KNBS Survey 2017, holiday travellers into the country take up 77.8% of the total number of travellers into the country on a 5-year average basis,
- Aggressive marketing by Kenya Tourism Board - This has helped restore confidence in key international markets such as Europe, USA and the new emerging markets in Africa and Asia, as well as the domestic market. As part of marketing, the industry has also embraced e-commerce, which has translated to increased booking,
- Conference tourism, which entails Meetings, Incentives, Conventions and Events (MICE) - MICE is valued at Kshs 30.0 bn, with hotels accounting for 60.0% of this total value of Kshs 30.0 bn, according to the Kenya Hospitality Report, 2017 by Jumia Travel; and Kenya ranked as the second best destination for conference tourism in sub-Saharan Africa after South Africa by the International Congress and Convention Association (ICCA). Some of the high profile conferences that have been held in the country include; Tokyo International Conference of African Development (TICAD), United Nations Conference on Trade and Development(UNCTAD), and The Africa Academy of Management Biennial Conference,
- Government incentives to boost the tourism industry - This is through measures such as (i) removal of visa fees for children, (ii) elimination of VAT on park fees, (iii) introduction of Airline Charter Incentive Program, (iv) the scrapping of landing fees for a period of two and a half years, and (v) providing a subsidy of USD 30 per seat filled by international passengers who terminate or disembark in Kenya over the same period.
Despite the above factors, the hospitality sector had a set-back in the 2nd half of 2017 mainly due to insecurity concerns during the extended electioneering period. According to KNBS, arrivals declined by 7.4% in August 2017 to 89,782 from 96,958 in August 2016. Furthermore, according to data from STR Global, hotels in Nairobi recorded 35.8% occupancy in August 2017 compared to 50.2% average occupancy between January and July. We expect the market to stabilize once the elections are concluded amidst improved security.
Investors are increasingly diversifying revenues through investing in real estate, mainly driven by the high and stable returns in the sector of above 20.0% in the last 5 years, with 25.8% recorded in 2016. This week, Britam Holdings, an insurance, pensions and asset management company, announced that it will be spending half of its Kshs 9.0 bn equity fund in new real estate projects as part of the firm’s strategic plan 2016- 2020. One of the project in its pipeline is the Kshs 3.3 bn serviced apartments in Kileleshwa, projected for completion in 2019. Many pension funds in Kenya are pursuing investments in real estate, with pension funds that have committed funds to the sector being National Social Security Fund (NSSF), KCB Pension Fund, Safaricom Staff Pension Scheme and KenGen among others. This is a move in the right direction given that in the past, funds have over-relied on traditional investment instruments such as equities and fixed income. While the Retirement Benefits Authority guidelines on asset allocation allows up to 40.0% allocation to alternative investments, the current allocation stands at 19.0% compared to development markets such as USA where the allocation levels are at 27.0%. Increased investment will not only provide funding and/or uptake for real estate, but also play a role in addressing the large housing deficit that stands at 2.0 mn units.
Other highlights in the real estate sector this week include;
- French based retailer Carrefour recently opened its third branch in the Thika Road Mall, following the exit of struggling retail chain Nakumatt from the premises. This is the international retailer’s third branch in the country, with its previous branches in The Hub and Two Rivers Mall, where it covers 6,000 SQM and 7,200 SQM, respectively. The TRM outlet covers over 5,000 square metres of selling area and will cater for a growing population segment residing in Roysambu and Kasarani as well as those travelling along the busy Thika Road. The development will cover two floors of the mall that was completed in 2013. The retailer is also said to be eyeing the Nakumatt space in Garden city following their eviction from the premises.
We expect the real estate industry activities to remain on a slow towards the end of 2017, but will pick in 2018 as the political dust settles. This will be driven by the demand as seen through the high population and urbanization growth at 2.7% and 4.4%, respectively, and real estate’s high returns of on average 25.0% p.a. in the last 5 -years and 25.8% recorded in 2016.
Having established a strong research team and delivery framework in Kenya, we have now launched a Sub Saharan Africa (SSA) research coverage initiative. The initial coverage will be limited to Financial Services, which is one of our strongest research sectors, alongside real estate research.
SSA has long been viewed as the next global growth frontier buoyed by improving macro-economic stability, compelling demographic trends, improved governance and ease of doing business across the continent. However, following a decline in commodity prices and slowing demand from China, the region fell behind the world economy in output, growing at 1.4% in 2016, slower than the aggregate global growth of 3.2%. The slowdown was not evenly distributed amongst countries in SSA, being mainly concentrated in commodity exporters, while more diversified economies sustained robust economic growth, with countries in East Africa including Djibouti, Ethiopia, Kenya, Rwanda and Tanzania, all recording GDP growth rates above 5% in 2016, with Ethiopia leading at 8%. This year, the economic outlook for the Sub-Saharan Africa region is positive with an overall growth forecast set at 2.6% in 2017, rising to 3.4% in 2018, against expected global growth of 3.6% and 3.7%, respectively. A number of factors are supporting this growth, among them; (i) stronger domestic demand following the emergence of a rising middle class, (ii) sound macroeconomic policy management now entrenched in many African countries, (iii) a generally improving and favourable business environment, (iv) a more diversified economic structure, particularly towards the services sector and light manufacturing, and (v) rising commodity prices, which started to rise in the latter part of 2016.
We undertook an analysis on the Sub-Saharan African Financial Services sector to analyse the investments opportunities in the listed financial services firms in order to determine which companies are the most attractive and stable for investment from a franchise value and from a future growth opportunity perspective. In total, we analysed 49 companies operating in 10 Sub Saharan African countries. These countries are (i) Kenya, (ii) Uganda, (iii) Tanzania, (iv) Rwanda, (v) Nigeria, (vi) Ghana, (vii) Mauritius, (viii) Zambia, (ix) Namibia, and (x) Botswana.
For country selection in SSA, we used both Macro and Micro metrics to determine which countries and companies to select in our coverage universe – the goal was to analyse investable countries and companies. The macro ranking involved macro-economic metrics such as GDP growth, interest rates, inflation, exchange rate, corporate earnings, foreign investor sentiment and security & political environment; ranking them as Positive - if we expect improvement supported by good fundamentals, Neutral - if the indicators point to a maintenance of previous levels, and Negative - if we expect a deterioration in conditions. A description of the metrics is highlighted below:
- GDP growth: For the GDP growth metric, we checked what has been the country’s 10-year average GDP growth and compare with the expected growth rate for the current year, with higher expected growth being Positive, declining growth as Negative, and growth within a 1% range from the average being Neutral,
- Interest Rates: The criteria for interest rates checks whether a country is more likely to tighten or loosen financial conditions - with looser monetary policy associated with spurring growth thus Positive, while tighter financial conditions with slowing a heating up an economy- thus Negative and expectations of similar conditions as Neutral,
- Inflation: For the inflation metric, we compare the current and expected inflation rates against policy targets for sustainable growth and cost of money- with inflation rates that are out of range with targets and trending away being Negative- those rates within range being Positive, and expectations of inflation rates within range being Neutral,
- Currency Stability: Here we analysed the local currency performance against the US dollar, with more than a 5% depreciation, or depreciation larger than the previous 5-year average having a Negative outlook, depreciation within range having a Neutral outlook, while sustained appreciation of more than 5% having a Positive outlook,
- Corporate Earnings: For corporate earnings, we looked at annual growth rates and for earnings growth that exceeds the country’s growth rate, we consider that as a Positive, for earnings growth within 2% of the range of the country’s growth rate is Neutral, while slower earnings growth than the country growth rate is Negative,
- Investor Sentiment: This tracks sentiment by foreign investors towards a particular country and their investments. When Positive, more foreign investors are actively investing and establishing new positions in a country, while Negative sentiment means that foreign investors are actively exiting their positions in the country’s markets, while Neutral indicates that investors exiting and establishing new positions is fairly stable,
- Political Stability & Security: This refers to the general security situation in a country, coupled with the social and political stability. Positive outlook suggests minimal unrest in the country, be it political or social, while Neutral indicates a small possibility of unrest, however the country’s security forces have maintained peace and stability, and Negative indicates a state of unrest in the country.
Below is the summary table of the various countries we looked at:
|
Macro-Economic Drivers for Select Sub Saharan Africa Countries |
||||||||||
|
Driver |
Kenya |
Tanzania |
Uganda |
Rwanda |
Nigeria |
Ghana |
Mauritius |
Zambia |
Namibia |
Botswana |
|
GDP Growth |
Neutral |
Positive |
Neutral |
Positive |
Neutral |
Positive |
Positive |
Neutral |
Negative |
Neutral |
|
Interest Rates |
Neutral |
Neutral |
Positive |
Positive |
Neutral |
Positive |
Positive |
Positive |
Negative |
Neutral |
|
Inflation |
Neutral |
Neutral |
Positive |
Neutral |
Negative |
Positive |
Neutral |
Positive |
Neutral |
Positive |
|
Currency Stability |
Neutral |
Negative |
Neutral |
Neutral |
Neutral |
Neutral |
Neutral |
Positive |
Positive |
Neutral |
|
Corporate Earnings |
Neutral |
Positive |
Neutral |
Neutral |
Positive |
Positive |
Neutral |
Neutral |
Neutral |
Neutral |
|
Investor Sentiment |
Neutral |
Positive |
Neutral |
Positive |
Positive |
Neutral |
Positive |
Neutral |
Neutral |
Positive |
|
Stability & Security |
Neutral |
Positive |
Neutral |
Neutral |
Neutral |
Positive |
Positive |
Positive |
Positive |
Positive |
|
Overall |
Neutral |
Slightly Positive |
Slightly Positive |
Slightly Positive |
Slightly Positive |
Strong Positive |
Strong Positive |
Strong Positive |
Neutral |
Slightly Positive |
The 10 countries highlighted in the Macro-ranking table were supported by positive fundamentals, with:
- 3 countries, namely Ghana, Mauritius and Zambia emerged as having strong positive fundamentals,
- 5 countries, namely Tanzania, Uganda, Rwanda, Nigeria and Botswana had slightly positive fundamentals, while
- Kenya and Namibia had a Neutral rating, with their country fundamentals pointing to no significant change from the current operating environment.
Based on the overall ranking, we found these 10 SSA countries to be investable, with a bias to investing in Ghana, Mauritius and Zambia. We then proceeded to single out individual investable companies using our criteria for Micro rankings, which included stock market metrics such as:
- Market Capitalization: We included companies with a minimum of USD 70 mn in our coverage universe, as this presented companies that could absorb a fairly large investment amount,
- Turnover in Individual Stocks: Stocks with a minimum daily turnover of USD 20,000 were included in our coverage, as this presented stocks that were liquid enough to establish a sizeable position in,
- Foreign Investor Participation: Markets with considerable foreign participation and companies with considerable foreign investor interest are preferred, owing to better required disclosures and better price discovery, and
- Free Float: A company’s free float is the proportion of shares that is not locked-in or closely held by controlling interest investors or government and is freely traded in the stock market. We included companies with a minimum free float of 20% in our coverage.
Given our focus was on the Financial Services sector, we sought to identify the factors driving growth, development, and sustainability of the sector. Factors supporting the growth in SSA Financial Services sector include:
- Stable macro-economic indicators; from the above table it is clear that the region now enjoys a more stable economy and can be able to attract more capital into the region for growth. The largest beneficiary of a growing economy is the financial services sector,
- Improved regulations: we have seen improved regulations that have made the sector more transparent and adoption of new methods of reporting like Risk based. This means that the population is willing to take up more financial services products as they understand them more,
- The Sub-Saharan Africa region has a young and growing population, registering growth of 2.2% p.a. and is projected to more than double by 2050. This represents an opportunity in the Financial Services sector as, coupled with financial inclusion, which is on a rise in Africa, there is an inherent increase in consumption expenditure and a rise in the percentage of the population requiring financial services,
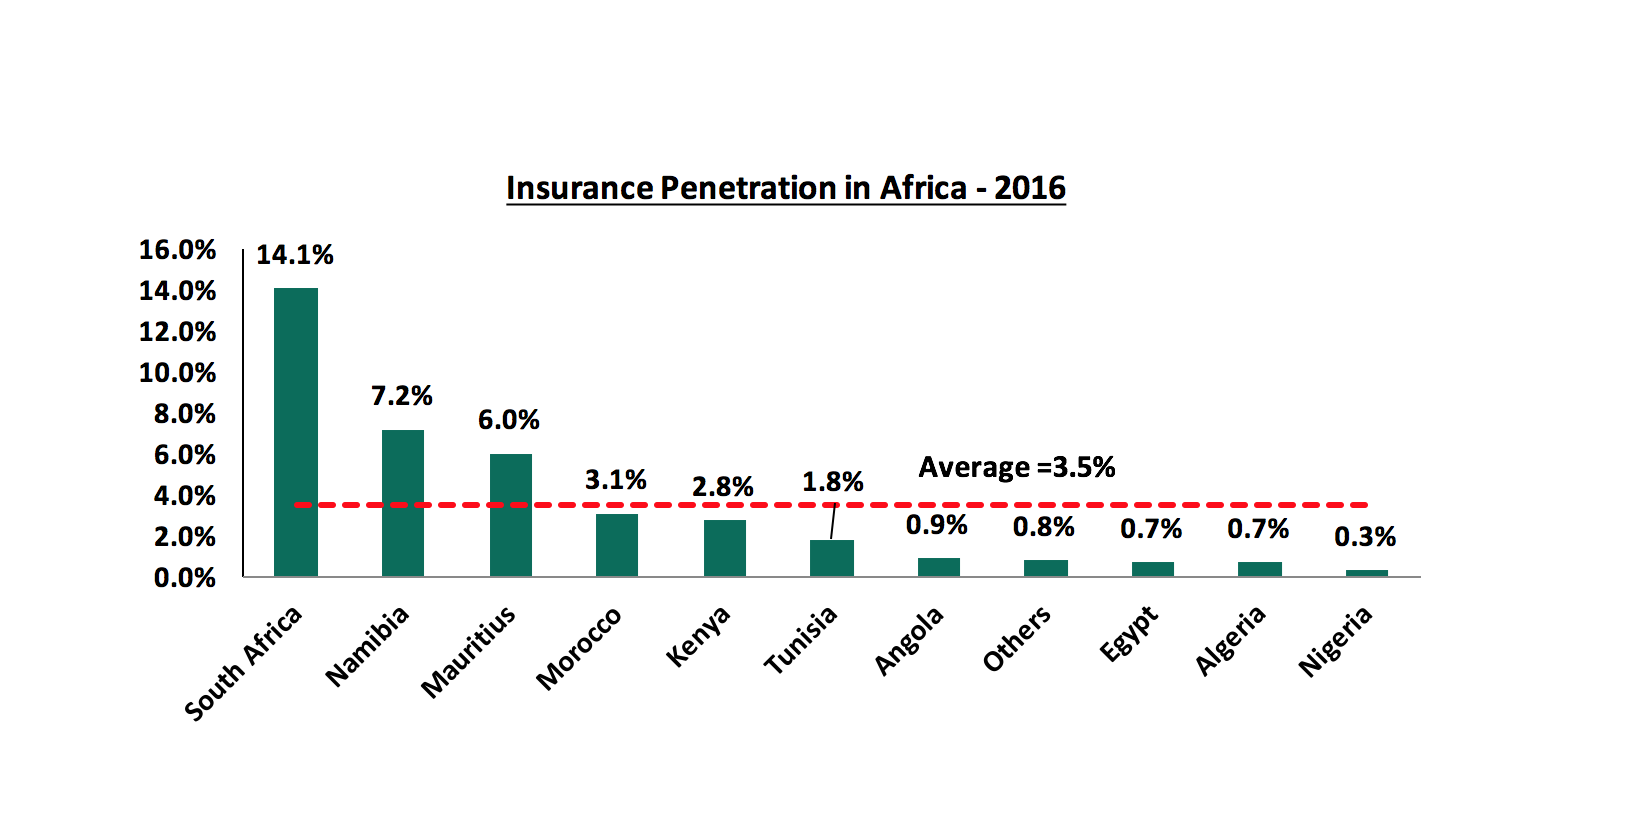
- Financial penetration remains low in Sub-Saharan Africa, with less than a quarter of the population having access to a formal bank account, hence limiting the degree to which private individuals can access financial services, while the average insurance penetration rate in Africa is very low, at 3.5%. Low inclusion presents ample runway for growth, given the backdrop of increased macroeconomic stability, positive consumer oriented reforms and financial sector deepening largely through telephone based systems.
- Increased adoption of technology to improve on efficiency. In a bid to minimize costs, banks and insurance companies have embraced technology to reduce operational costs and hence drive up efficiency. Some of these measures include integration with mobile application platforms and internet-banking to facilitate increased collection of deposits and premiums, and disbursement of loans with lower operating costs.
- Select stocks in the financial services sector provide attractive entry points at low valuations, and potential high returns for investors, with the banking stocks under coverage in Kenya, Nigeria and Ghana currently trading at P/B valuations of 1.4x, 0.7x and 1.9x, compared to 10-year historical averages of 2.0x, 1.0x and 2.3x, respectively
Sub-Saharan African countries have made substantial progress in financial development. The development of mobile telephone-based systems has helped to incorporate a large share of the population into the financial system, especially in East Africa. Nonetheless, there is a large untapped potential in this area in other countries, and this can compensate for some of the infrastructure and other shortcomings that most countries face. In addition to these factors supporting growth, a number of policies, if implemented, can also lead to acceleration in financial development in the region, which include:
- Providing strong legal and institutional frameworks and promoting sound corporate governance: Strengthening legal and institutional frameworks, including protecting the interests of minority shareholders and fostering contract enforcement and judicial independence, is critical for creating an environment in which the financial sector can develop and strive, and
- Strengthening supervision, including cross border oversight: Providing a region wide supervisory body with enforcement power should be at the fore of the agenda in continental unions like the African Union’s economic development program, New Partnership for Africa’s Development, NEPAD, so as to fast track harmonization of regulations and supervisory procedures, especially among Pan-African banks and financial institutions.
Moving to the companies selected for coverage, we segmented the financial services firms into banks and insurance companies in order to rank like for like. The overall ranking was based on a weighted average ranking of Franchise value (accounting for 40%) and Intrinsic value (accounting for 60%). As per our analysis on the banking sector, from a franchise value and from a future growth opportunity perspective, below is the comprehensive ranking of the listed SSA banks in our coverage:
|
CYTONN SUB-SAHARAN AFRICA FINANCIAL SERVICES REPORT – BANK COMPOSITE RANKINGS |
||||||
|
Bank |
Country |
Market Cap (USD mn) |
Franchise Value Total Score |
Total Return Score |
Weighted Score |
H1‘2017 Rank* |
|
KCB Group |
Kenya |
1,232.3 |
126 |
6 |
54.0 |
1 |
|
Zenith Bank Plc |
Nigeria |
2,136.2 |
119 |
11 |
54.2 |
2 |
|
Societe Generale |
Ghana |
70.4 |
134 |
8 |
58.4 |
3 |
|
NIC Bank |
Kenya |
224.6 |
143 |
3 |
59.0 |
4 |
|
DFCU Uganda |
Uganda |
94.2 |
148 |
1 |
59.8 |
5 |
|
Co-operative Bank |
Kenya |
911.6 |
127 |
19 |
62.2 |
6 |
|
Guaranty Trust Bank |
Nigeria |
3,569.9 |
113 |
29 |
62.6 |
7 |
|
Standard Chartered |
Ghana |
563.1 |
123 |
24 |
63.6 |
8 |
|
CAL Bank |
Ghana |
131.8 |
135 |
17 |
64.2 |
9 |
|
I&M Holdings |
Kenya |
480.2 |
142 |
13 |
64.6 |
10 |
|
Bank of Baroda |
Uganda |
76.6 |
150 |
12 |
67.2 |
11 |
|
Equity Group |
Kenya |
1,488.6 |
138 |
22 |
68.4 |
12 |
|
Access Bank |
Nigeria |
791.5 |
142 |
21 |
69.4 |
13 |
|
UBA Bank |
Nigeria |
982.5 |
141 |
26 |
72.0 |
14 |
|
Bank of Kigali |
Rwanda |
226.9 |
151 |
20 |
72.4 |
15 |
|
Barclays Bank |
Kenya |
517.9 |
168 |
9 |
72.6 |
16 |
|
GCB |
Ghana |
256.6 |
180 |
2 |
73.2 |
17 |
|
Access Bank |
Ghana |
101.6 |
174 |
7 |
73.8 |
18 |
|
Union Bank Plc |
Nigeria |
293.8 |
186 |
4 |
76.8 |
19 |
|
Stanbic Bank |
Uganda |
388.7 |
174 |
16 |
79.2 |
20 |
|
Ecobank |
Ghana |
502.0 |
191 |
5 |
79.4 |
21 |
|
MCB Group |
Mauritius |
1,460 |
176 |
15 |
79.4 |
22 |
|
CRDB |
Tanzania |
174.6 |
190 |
10 |
82.0 |
23 |
|
DTBK |
Kenya |
482.1 |
184 |
14 |
82.0 |
24 |
|
Stanbic IBTC Holdings |
Nigeria |
1,201.7 |
166 |
30 |
84.4 |
25 |
|
Stanbic Holdings |
Kenya |
306.2 |
177 |
23 |
84.6 |
26 |
|
NMB Bank |
Tanzania |
614.9 |
180 |
25 |
87.0 |
27 |
|
Standard Chartered |
Zambia |
126.6 |
165 |
36 |
87.6 |
28 |
|
HF Group |
Kenya |
41.6 |
195 |
18 |
88.8 |
29 |
|
SBM Holdings |
Mauritius |
565.3 |
191 |
28 |
93.2 |
30 |
|
Standard Chartered |
Kenya |
724.9 |
196 |
27 |
94.6 |
31 |
|
Ecobank Transnational |
Nigeria |
1,155.7 |
197 |
33 |
98.6 |
32 |
|
FNB Namibia |
Namibia |
940.6 |
205 |
31 |
100.6 |
33 |
|
FBN Holdings |
Nigeria |
698.7 |
205 |
32 |
101.2 |
34 |
|
ZNCB |
Zambia |
42.3 |
213 |
34 |
105.6 |
35 |
|
National Bank |
Kenya |
33.0 |
249 |
35 |
120.6 |
36 |
*- The ranking is based on H1’2017 results
As per our analysis on the insurance sector from a franchise value and from a future growth opportunity perspective, below is the comprehensive ranking of the listed SSA insurance companies in our coverage:
|
CYTONN SUB-SAHARAN AFRICA FINANCIAL SERVICES REPORT –INSURANCE COMPOSITE RANKINGS |
||||||
|
Insurance Company |
Country |
Market Cap (USD mn) |
Franchise Value Total Score |
Total Return Score |
Weighted Score |
H1‘2017 Rank* |
|
Botswana Holdings |
Botswana |
512.2 |
37 |
2 |
22.4 |
1 |
|
Kenya Re |
Kenya |
134.8 |
43 |
4 |
23.8 |
2 |
|
Custodial and Allied |
Nigeria |
62.2 |
52 |
3 |
28.0 |
3 |
|
Mauritius Union |
Mauritius |
80.5 |
47 |
9 |
30.6 |
4 |
|
Mauritian Eagle |
Mauritius |
22.1 |
62 |
1 |
31.6 |
5 |
|
Enterprise Group |
Ghana |
119.2 |
47 |
13 |
32.4 |
6 |
|
Jubilee Holdings |
Kenya |
315.1 |
59 |
6 |
33.6 |
7 |
|
Britam Holdings |
Kenya |
354.3 |
69 |
7 |
39.4 |
8 |
|
Liberty Holdings |
Kenya |
64.8 |
75 |
5 |
39.6 |
9 |
|
Continental Re |
Nigeria |
40.4 |
74 |
12 |
45.0 |
10 |
|
CIC Group |
Kenya |
114.1 |
77 |
11 |
37.4 |
11 |
|
AXA Mansard |
Nigeria |
60.7 |
86 |
10 |
40.4 |
12 |
|
Sanlam Kenya |
Kenya |
37.6 |
92 |
8 |
41.6 |
13 |
*- The ranking is based on H1’2017 results
Comparing the rankings of both the banks and insurance companies, we find that the list of top companies is dominated by Kenyan banks and insurance companies, along with Ghanaian banks and Mauritius and Nigerian insurance companies. This is due to Kenya’s growing financial intermediation and deep penetration of financial services penetration as compared to the rest of Sub-Saharan Africa.
This does not however mean that Kenyan investors should not seek to diversify their investments by investing regionally if they find an attractive investment opportunity. In terms of risk, local investors still have to take a number of factors into consideration when investing globally, these include:
- Currency risk: When investing in a foreign country, investors have to convert their currency into the local currency of that country, and convert back once their investment matures. The uncertainty of the value the future exchange rate most investors
- Political and Economic risk: This is the risk associated with a country’s political environment, governance and ability to meet country obligations.
- Transaction charges and tax implications for their investments: Transaction charges on investments is higher in some countries, while tax regulations also may differ from country to country. This all has affects the overall return an investor finally gets, so should be taken into consideration while investing
- Capital controls: These are measures including outright prohibitions, transaction taxes and other limits that a nation’s government may use to regulate flows from capital markets, thus affecting the direct flow of investments into a country and repatriation of profits out. Countries with capital controls make it harder for would be foreign-investors to invest, and harder to actualize the return from their investments.
For Sub-Saharan Africa, the outlook on the sector is positive, as:
- Technology and innovation capabilities are set to be key anchors of growth for Sub-Saharan Africa in the coming years and thus the adoption of mobile and online modes of product distribution, should drive financial penetration,
- We expect the synergy between banks and insurance companies to offer Bancassurance to continue as well as the integration of mobile money payments to allow for policy payments and mobilization of deposits,
- We also expect that there will be increased regulation in the Financial Services sector, as well as increased consolidation in the banking sector. These efforts will improve efficiency for banks and insurance firms and uptake of insurance products to enhance the sustainability of profitability.
For more details on the ranking, see our Sub Saharan Africa H1’2017 Financial Services Report.
The SSA financial services sector continues to undergo transition, mainly on the regulation front, which is critical for stability and sustainability of a conducive business environment. With, (i) a growing population that is embracing mobile phones for financial penetration, (ii) the increased usage of technology by Financial Services firms to drive alternative channel distribution of products and enhance efficiency, and (iii) the attractive valuations, which provide an attractive entry point for long-term investors, we are positive for investors in Sub Saharan African Financial Services Sector with a long term investment horizon.
- Talk to us
- Kenya
- P.O Box 20695 - 00200, Nairobi, Kenya
- Cell +254(0) 709 101 000
- Tel +254(0) 20 3929 000
- WhatsApp +254(0) 748 070 000
- United States
- +1 (240) 368-6217
- DOWNLOAD OUR APP
-


- Kenya
- Cysuites work spaces, Church Rd, Westlands, Nairobi, Kenya
- USA
- Suite 1150, 1775 Eye Street NW, USA, Washington DC 20006, USA
- Investments
- High Yield
- Private Equity
- Real Estate
- Real Estate
- RiverRun Estates
- Cytonn Towers
- The Ridge
- Taraji Heights
- The Alma