Accelerating Funding to Affordable Housing, & Cytonn Weekly #21/2020
By Research Team, May 24, 2020
Executive Summary
Fixed Income
During the week, T-bills remained oversubscribed, with the subscription rate coming in at 149.3%, up from 100.4% the previous week due to high liquidity in the money markets as well as the increased preference to shorter-dated papers. The subscription rate of the 91-day, 182-day, and 364-day papers increased to 271.0%, 104.9%, and 145.0%, respectively, from 191.8%, 44.9%, and 119.3% recorded the previous week, respectively. The recently issued five-year bond FXD1/2020/5 was undersubscribed with the overall subscription rate coming in at 68.6%. The May inflation is expected to remain stable around the 5.5% range in line with 5.6% recorded in April, as we expect the supply chain distortions to be countered by the reduction in oil prices. The Monetary Policy Committee (MPC) is set to meet on Wednesday, 29th May 2020, in our view they shall hold the Central Bank Rate stable as they await the recent two reductions to filter through into the economy. Also, during the week, the World Bank approved US Dollar 1.0 bn financing for Kenya to address the COVID-19 financing gap and support the economy through this period. This is the second-ever such lending from the World Bank after the first in May 2019 where the government received USD 750.0 mn for budgetary support;
Equities
During the week, the equities market was on an upward trend, with NASI, NSE 20 and NSE 25 gaining by 3.7%, 2.0% and 3.1%, respectively, taking their YTD performance to losses of 15.6%, 24.1% and 20.0%, for NASI, NSE 20 and NSE 25, respectively. During the week, the Central Bank of Kenya (CBK) presented to the Kenya Private Sector Alliance (KEPSA) The Status and Outlook of Kenya’s Banking Sector, which showed that the banking sector remains stable and resilient despite the ongoing challenges facing the economy. Also, the CBK announced the final acquisition of Imperial Bank’s assets and assumption of liabilities worth Kshs 3.2 bn each by KCB Group effective 2nd June 2020. KCB Group, Co-operative Bank, NCBA, and DTBK released their Q1’2020 financial results;
Real Estate
During the week the Ministry of Transport, Infrastructure, Housing and Urban Development published the new National Housing Development Fund Regulations 2020. In the retail sector, Car and General Kenya announced that it had secured Carrefour supermarket as the anchor tenant for its refurbished Nairobi Mega building located along Uhuru Highway. In the infrastructure sector, Water and sanitation Cabinet Secretary, Sicily Kariuki unveiled a Kshs 1.3bn Kiambu-Ruaka water supply and sewerage project. And in listed real estate, fund manager, ICEA Lion Asset Management (ILAM) announced the successful completion of its Stanlib Kenya Limited (SKL) transaction that will see it acquire the latter’s role of managing property fund, Stanlib Fahari I-REIT;
Focus of the Week
Kenya’s economy has seen significant growth with the GDP per capita increasing to Kshs 198,078 in 2019, a 137.5% growth from Kshs 83,393 in 2009, according to, Kenya National Bureau of Statistics. The growth has elevated the economy to middle-income status and in line with this, there has been an increase in demand for goods and services, including housing. According to the National Housing Corporation, the housing deficit in Kenya stands at 2.0 mn and continues to grow at a rate of 200,000 units a year while housing production is estimated at only 50,000 units a year, which is well below the annual demand. Affordability of housing remains a key challenge given the current high cost of construction, high cost of borrowing for end-user mortgages and insufficient access to financing. Through the affordable housing agenda by the Government of Kenya, institutions such as the Kenya Mortgage Refinance Company (KMRC) and the National Housing Development Fund (NHDF) were intended to enhance financing of the initiative. The recent proposed regulations by the Retirement Benefits Authority, RBA, will allow pensioners to use part of their pension towards purchasing houses. However, we are yet to see any improvement in mortgages being offered from the aforementioned initiatives. This week, we focus on ways of accelerating funding for affordable housing where we shall cover a brief introduction to housing in Kenya, challenges hindering the achievement of affordable housing, government initiatives towards the same, a case study on Singapore’s housing system and finally outline our recommendations with regard to accelerating funding towards the initiative.
- Weekly Rates:
- Cytonn Money Market Fund closed the week at a yield of 10.75% p.a. To invest, just dial *809#;
- Cytonn High Yield Fund closed the week at a yield of 14.42% p.a. To subscribe, email us at sales@cytonn.com;
- Elizabeth Nkukuu, Chief Investment Officer at Cytonn Investments, was on Metropol TV talking about currency and interest rates outlook. Watch Elizabeth here;
- Michael Obaga, Senior Investment Consultant Cytonn Investments, was on Metropol TV to discuss how the Coronavirus pandemic has affected the government’s ability to continue with a lean budget. Watch Michael here;
- Phase 1 of The Alma is now 100% sold with early buyers having achieved up to 55% capital appreciation. We are now running promotions:
- For Phase 2: Buy a unit in Phase 2 with a 15-year payment plan and 0% deposit;
- For Phase 1: Get a 10% rent discount on units we manage for investors;
- For inquiries, please email us on clientservices@cytonn.com;
- For an exclusive tour of Cytonn’s real estate developments, visit: Sharp Investor's Tour and for more information, email us at sales@cytonn.com;
- We continue to offer Wealth Management Training daily, from 9:00 am to 11:00 am, through our Cytonn Foundation. The aim of the training is to grow financial literacy among the general public. To register for any of our Wealth Management Training, click here. Below is the list of the Wealth Management topics for this week:
- Tuesday, 26th May 2020: Investing in Loan Markets for Chamas and Saccos;
- Wednesday, 27th May 2020: Options for Your Pensions Upon Retirement - Annuity Vs Income Drawdown;
- Thursday, 28th May 2020: Managing Personal Financial Challenges in the COVID Environment;
- Friday, 29th May 2020: Accessing Affordable Housing Benefits;
- Saturday, 30th May 2020: Evaluating Money Market Fund Returns;
- If interested in our Private Wealth Management Training for your employees or investment group, please get in touch with us through wmt@cytonn.com;
- For recent news about the company, see our news section here;
- We have 10 investment-ready projects, offering attractive development and buyer targeted returns. See further details here: Summary of Investment-ready Projects.
Money Markets, T-Bills & T-Bonds Primary Auction:
During the week, T-bills remained oversubscribed, with the subscription rate coming in at 149.3%, up from 100.4% the previous week. The oversubscription is partly attributable to the high liquidity in the money markets as well as the increased preference to shorter-dated papers by investors. The subscription rate for the 91-day, 182-day, and 364-day papers increased to 271.0%, 104.9%, and 145.0%, respectively, from 191.8%, 44.9%, and 119.3% recorded the previous week, respectively. The yields on the 91-day, 182-day, and 364-day papers all remained unchanged at 7.3%, 8.2%, and 9.2%, respectively. The acceptance rate declined to 74.1%, from 99.5% recorded the previous week, with the government accepting Kshs 26.6 bn of the Kshs 35.8 bn bids received.
The recently issued five-year bond, FXD1/2020/5, was undersubscribed, with the subscription rate coming in at 68.6%, as they received bids worth Kshs 20.6 bn, lower than the offered amount Kshs 30.0 bn. The yield on the bond came in at 11.7%, in-line with our recommended bidding range of 11.5% - 11.7%. Despite the undersubscription the government rejected high bids only accepting Kshs 8.9 bn out of the Kshs 20.6 bn worth of bids received, translating to an acceptance rate of 43.5%.
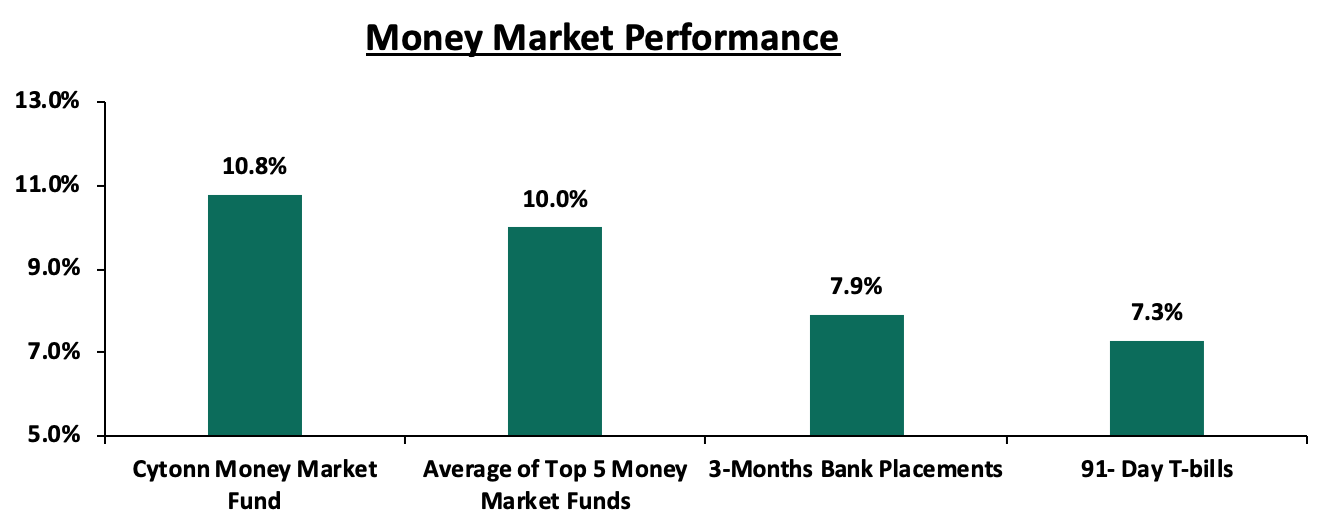
In the money markets, Yield on the short term papers remained unchanged at 7.9%, 7.3%, and 10.0% for 3-month bank placements, 91-day T-bill and the average yield of top 5 money market funds. The yield on the Cytonn Money Market Fund remained flat closing the week at 10.8%.
Liquidity:
During the week, liquidity remained high in the money market with the average interbank rate remaining unchanged at 4.2%, following the end of the monthly Cash Reserve Requirement (CRR) cycle and support from government payments. The average interbank volumes declined by 11.2% to Kshs 11.5 bn, from Kshs 12.9 bn recorded the previous week. The favourable liquidity in recent weeks has also partly been attributable to the reduction of the Cash Reserve Ratio (CRR) to 4.25%, from 5.25% previously, by the Monetary Policy Committee (MPC) during its March 2020 sitting, consequently freeing up Kshs 35.2 bn to provide additional liquidity to commercial banks for onward lending to distressed borrowers during the COVID-19 pandemic. Commercial banks’ excess reserves came in at Kshs 38.9 bn in relation to the 4.25% cash CRR.
Kenya Eurobonds:
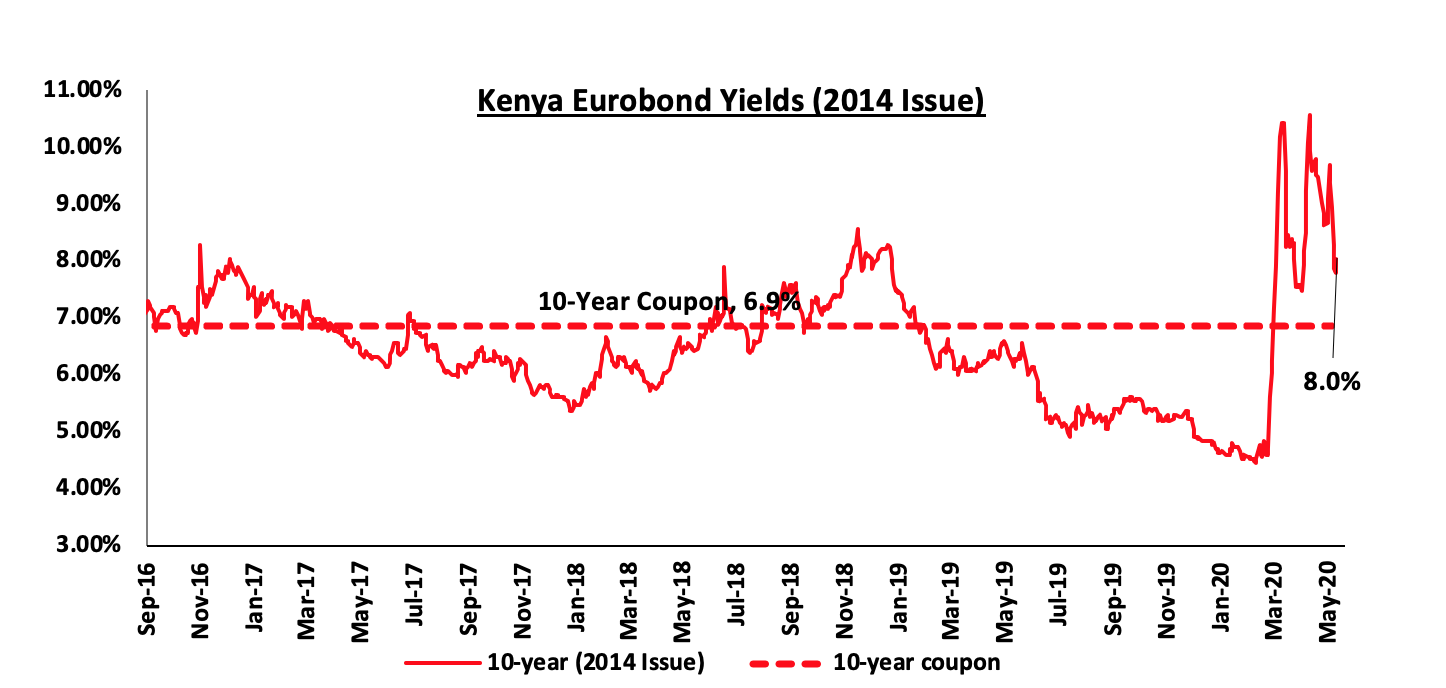
During the week, the yields on all the Eurobonds declined owing to improved investor sentiments as the market reacted to the news by the World Bank that they had approved USD 1.0 bn funding to support the economy. According to Reuters, the yields on the 10-year Eurobond issued in June 2014 declined by 1.4% points to 8.0%, from 9.4% recorded the previous week.
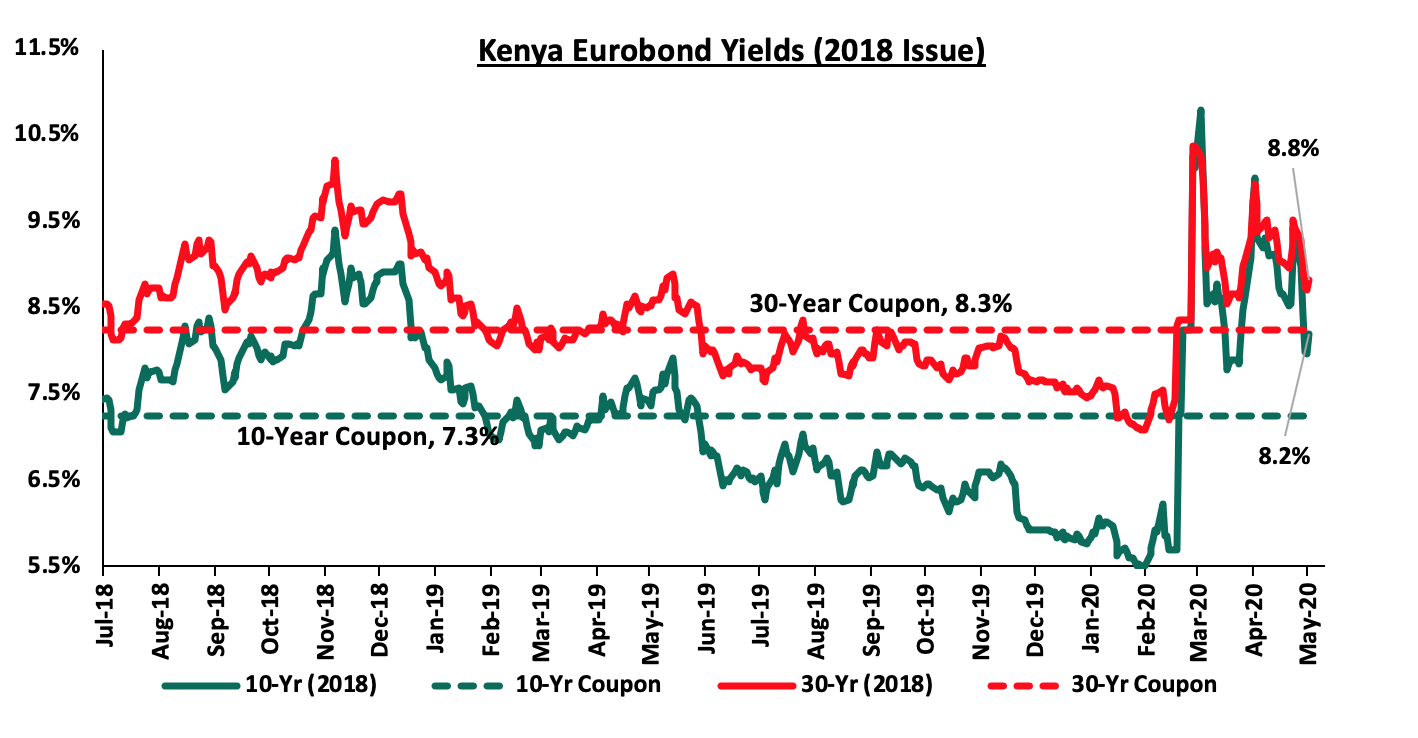
During the week, the yields on the 10-year and 30-year Eurobonds issued in 2018 declined by 1.1% points and 0.6% points to 8.2% and 8.8%, respectively, from 9.3% and 9.4% recorded previous week, respectively.
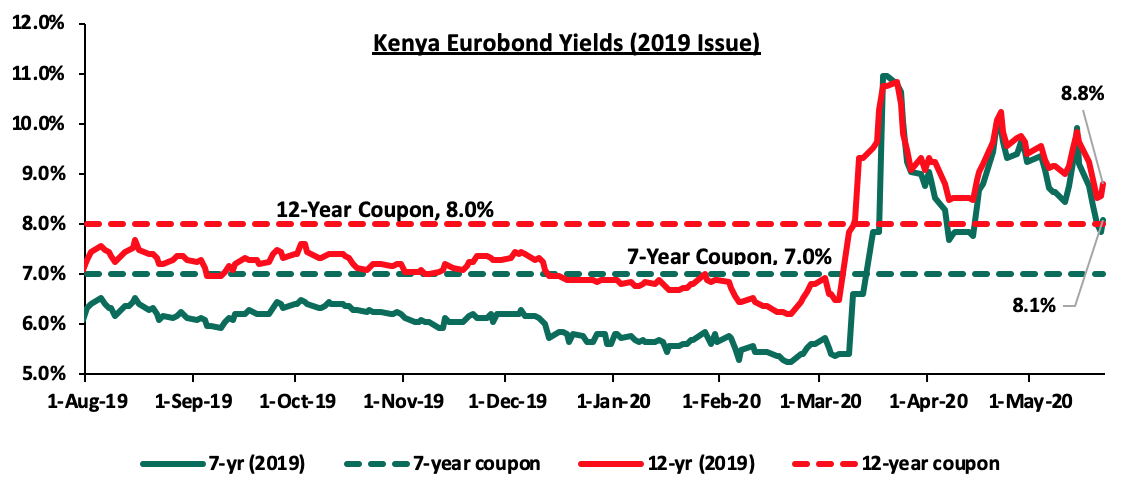
During the week, the yields on the 7-year and 12-year Eurobonds issued in 2019 declined by 1.1% points and 0.8% points, to 8.1% and 8.8%, respectively, from 9.2% and 9.6% recorded the previous week, respectively.
Kenya Shilling:
During the week, the Kenya Shilling remained relatively stable depreciating marginally by 0.1% against the US Dollar to close the week at Kshs 106.9, from Kshs 106.8, recorded the previous week. The shilling was supported by increased forex reserves, which rose to a four-month high USD 8.5 bn as the Central bank received the USD 750.0 mn from the International Monetary Fund for economic support. On a YTD basis, the shilling has depreciated by 5.5% against the dollar, in comparison to the 0.5% appreciation in 2019. We expect continued pressure on the shilling due to:
- High dollar demand from foreigners exiting the market as they direct their funds to safer havens,
- Increased demand as merchandise and energy sector importers beef up their hard currency positions amid a slowdown in foreign dollar currency inflows, and,
- Subdued diaspora remittances, due to the decline in economic activities globally coupled with increased prices of household items leading to lower disposable income.
The shilling is however expected to be supported by:
- High levels of forex reserves, currently at USD 8.5 mn (equivalent to 5.1-months of import cover), above the statutory requirement of maintaining at least 4.0-months of import cover, and the EAC region’s convergence criteria of 4.5-months of import cover. As a result of inflows from the IMF Rapid Credit Facility (RCF) approved during the week reserves rose by 8.7% to USD 8.4 mn from USD 7.8 mn,
Inflation Projection:
We are projecting the y/y inflation rate for May 2020 to remain stable within the range of 5.5% - 5.7%, compared to 5.6% recorded in April attributable to the following factors:
- The decline in oil prices (petrol prices by 10.3% and diesel prices by 19.7%), which has not led to a reduction in transport prices due to the measures taken by the government to curb the spread of COVID-19,
- Food prices have remained relatively stable during the month but there is an upward bias due to expected lower supply of foodstuffs as the effects of the locust invasion and recent floods take a toll on food production, and
- The reclassification of Food Index in the Consumer Price Index from 36.0% to 32.9%, which is expected to have an impact on the final inflation figures.
Monetary Policy:
The Monetary Policy Committee (MPC) is set to meet on Wednesday, 27th May 2020, to review the outcome of its previous policy decisions and recent economic developments, and to make a decision on the direction of the Central Bank Rate (CBR). In their previous meeting held on 29th April 2020, the committee decided to reconvene within a month for an early assessment of the impact of these measures and the evolution of the COVID-19 pandemic. In the last sitting, the MPC lowered the CBR by 25 bps to 7.00% from 7.25% after 1.00% revision the previous sitting. In their note, they indicated that the previous cut in CBR rate was having the intended outcome but they noted that the Coronavirus pandemic had continued to affect economic growth and as such, there would be a need to further cushion the economy. This was in line with our expectations as per our MPC Note.
During the meeting on Wednesday, 27th May 2020, we expect the MPC to maintain the Central Bank Rate (CBR) at 7.00%, with their decision mainly being supported by:
- High liquidity in the money markets from their previous action i.e. lowering of Cash Reserve Ratio (CRR) to 4.25%, from 5.25% in March 2020 meeting and the revision of the CBR rate by 25% over the previous two sittings,
- Inflation has remained stable and within the government target of 2.5% - 7.5%, and
- The need to monitor the effects the initial cuts will have on the economy as banks lend to businesses and individuals. Lower rates would make lending unattractive to banks as they might not reflect the true risk levels.
For our detailed MPC analysis, please see our MPC Note for the 27th May 2020 meeting here.
Weekly Highlight:
During the week, the World Bank approved US Dollar 1.0 bn financing for Kenya to address the COVID-19 financing gap and support the economy through this period. This is the second-ever such lending from the World Bank after the first in May 2019 where the government received USD 750.0 mn for budgetary support. The country undertook policy reforms to secure the financing and ultimately, directly benefit low-income households in the country. Through this policy, small scale farmers will benefit from better targeting of subsidized agricultural inputs through electronic vouchers. The supply of affordable housing is similarly expected to increase on the back of the updating of antiquated legislation that hindered the development of the housing market.
The approved financing will comprise of USD 750.0 mn credit from the International Development Association (IDA), to be repaid over 30 years after a 5 year grace period with 1.4% interest and a further loan of USD 250 from the International Bank for Reconstruction and Development (IBRD) which will attract a market-based interest of 2.0%. In our view, the move by the government is welcomed as it helps move the country’s loans to more concessional and commercial loans as opposed to bilateral and multilateral loans. Aside from the financial benefit, the initiative is also supporting more transparency in public financial management and as such, ordinary Kenyans will for the first time be able to review details of public procurement contracts through the public procurement information portal.
Rates in the fixed income market have remained relatively stable as the government rejects expensive bids. The government is 17.7% behind of its current domestic borrowing target of 404.4bn, having borrowed Kshs 294.4 bn against a prorated target of Kshs 357.7 bn. The government had also borrowed 98.4 bn (42.3%) of the 232.8 bn foreign borrowing target, as at 31st March 2020. The uncertainty brought about by the novel Coronavirus will make it harder for the government to access foreign debt due to uncertainty affecting the global markets which might see investors attaching a high-risk premium on the country. A budget deficit is likely to result from the depressed revenue collection with the revenue target for FY’2019/2020 at Kshs 2.1 tn, creating uncertainty in the interest rate environment as additional borrowing from the domestic market goes to plug the deficit. Owing to this uncertain environment, our view is that investors should be biased towards short-term fixed income securities to reduce duration risk.
Markets Performance
During the week, the equities market was on an upward trend, with NASI, NSE 20 and NSE 25 recording gains of 3.7%, 2.0% and 3.1%, respectively, taking their YTD performance to losses of 15.6%, 24.1%, and 20.0%, for NASI, NSE 20 and NSE 25, respectively. The performance of the NASI was driven by gains recorded by large-cap stocks, with Equity, Safaricom and KCB gaining by 7.3%, 6.1% and 1.8%, respectively, while both BAT and Bamburi recorded gains of 1.6%.
Equities turnover declined by 51.3% during the week to USD 22.5 mn, from USD 46.3 mn recorded the previous week, taking the YTD turnover to USD 671.5 mn. Foreign investors remained net sellers during the week, with the net selling position declining by 70.6% to USD 7.1 mn, from a net selling position of USD 24.0 mn recorded the previous week, a trend replicated in other emerging equity markets globally as foreign investors sold off riskier assets in favor of safe havens.
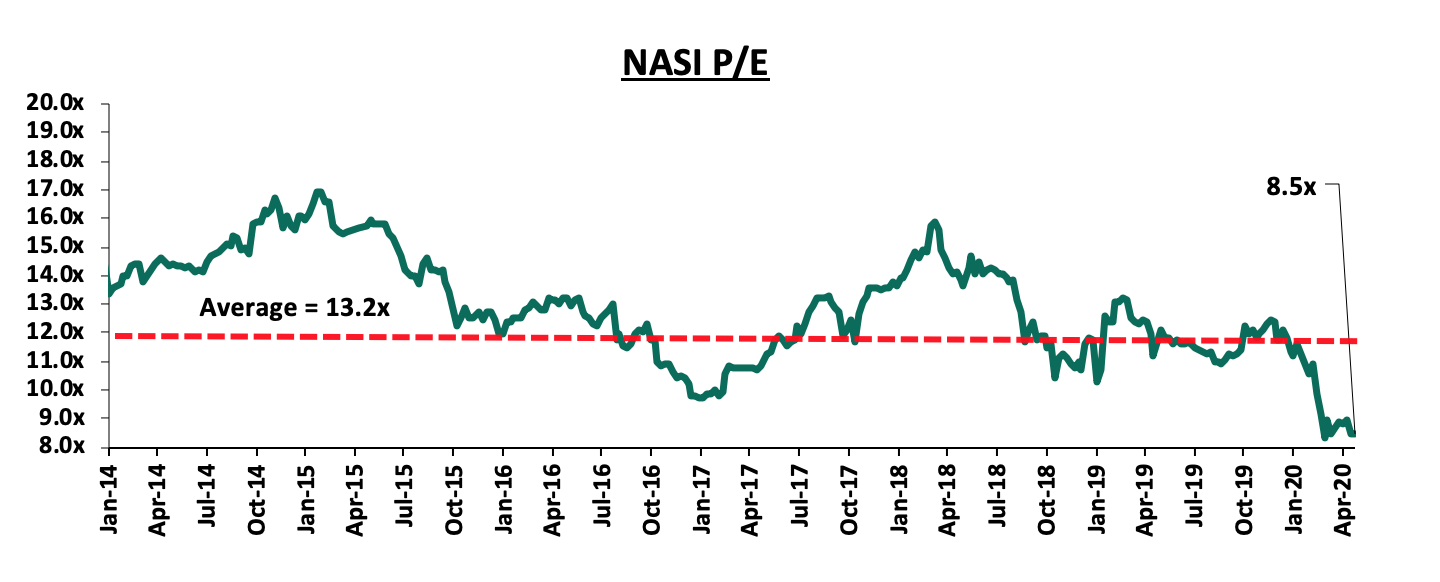
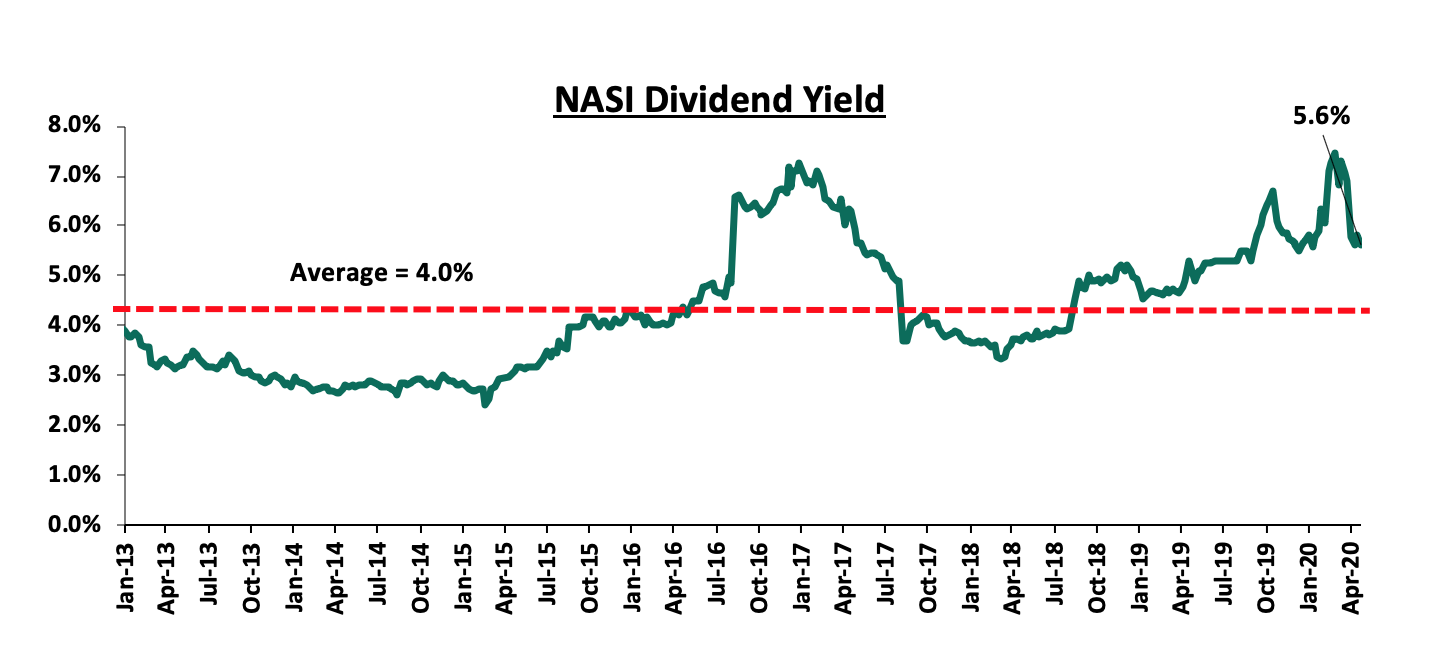
The market is currently trading at a price to earnings ratio (P/E) of 8.5x, 35.4% below the historical average of 13.2x. The current average dividend yield is at 5.6%, 1.6% points above the historical average of 4.0%. With the market trading at valuations below the historical average, we believe there are pockets of value in the market for investors with higher risk tolerance and are willing to wait. The current P/E valuation of 8.5x is 1.2% above the most recent valuation trough of 8.4x experienced in the last week of March 2020. The charts below indicate the historical P/E and dividend yields of the market.
Weekly Highlight
During the week, the Central Bank of Kenya (CBK) presented to the Kenya Private Sector Alliance (KEPSA) The Status and Outlook of Kenya’s Banking Sector. Below are some of the take-outs from the presentation by the CBK;
- As at the end of April 2020, the banking sector was stable and resilient as indicated by the strong liquidity ratio which stood at 51.2%, 31.2% points above the statutory minimum of 20.0% and strong capital adequacy ratios at 18.4%, 3.9% points above the statutory minimum of 14.5%,
- There was a slight deterioration in asset quality, with gross Non-Performing Loans (NPLs) ratio growing by 0.6% points to 13.1% in April 2020, from 12.5% in March 2020 and by 1.1% points from 12.0% recorded in December. This is an indication that the banking sector is feeling the adverse impact of the pandemic as a result of a slowdown in most economic sectors. Previously, in their announcement of additional measures to mitigate the adverse effects of the pandemic to the banking sector, the CBK announced it would be flexible concerning loan classification and provisioning for loans that were performing on 2nd March 2020 and whose repayment period was extended or restructured due to the pandemic,
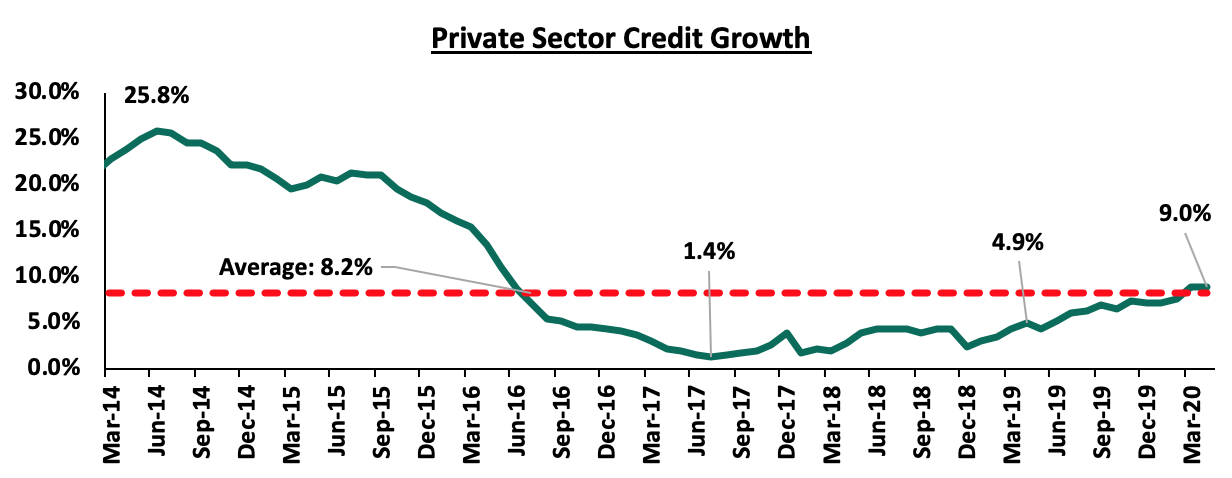
- Private sector credit grew by 9.0% in the 12 months to April, with strong growth in credit observed in manufacturing, trade, transport and communication, building and construction, and consumer durables. This is higher compared to the 4.9% recorded in the 12 months to April 2019, an indication that there has been an improvement in credit extension following the repeal of the interest rate cap in November 2019, as illustrated by the graph below,
- Personal/ household loans extended as at April 2020 grew by 9.4% to Kshs 102.5 bn from Kshs 9.9 bn as at March 2020 with most loans extended being for 9 to 12 months, which accounted for 47.7% of the loans extended in the personal/household sector. 26 out of 39 banks reported having extended personal/ household loans in April, an increase from 13 banks in March 2020, and,
- In April, restructured loans in the other ten sectors (excluding personal/ household loans) were worth Kshs 170.6 bn, accounting for 6.0% of the total Kshs 2.8 tn loan book as at April 2020, with Trade and Real Estate restructuring 26.3% and 18.6% of their loans, respectively, while both Tourism and Manufacturing restructured 13.6%.
In our view, the high Non-Performing Loans (NPLs), which stood at 10.5% as at the end of FY’2019, compared to the 5-year average of 8.2%, for the listed banking sector, is expected to increase in FY’2020 as businesses continue to be impacted by the pandemic. Bank’s earnings are also expected to take a hit as a result of reduced interest income and increased provisioning for bad debt. In our view, we believe a relaxation of provisioning rules, as part of the prudential guidelines would be welcomed. This might come in the form of adjustment to the loan classification in the different categories, (Normal and watch, Substandard, Doubtful Debts and Loss, where the loans are now classified as being impaired). Relaxation on the regulations when it comes to classification on how long before a loan is considered non-performing might see a reduction in the provisions’ requirements, consequently supporting Banks’ bottom line, as well as help conserve Bank's capital position.
In the presentation the CBK also disclosed that as at May 15th 2020, 18 commercial banks and 2 microfinance banks had been granted approval to access Kshs 29.1 bn (82.6% of the Kshs 35.2 bn), which was made available following the reduction in Cash Reserve Ration (CRR) by 1.0% points to 4.25% from 5.25%, this was a 65.3% increase from the Kshs 17.6 bn accessed by 11 commercial banks and one microfinance bank as at the end of April as highlighted in our Cytonn Weekly #19/2020. The table below shows the funding allocation by sector in the month of May compared to April 2020:
|
Sector Funding Allocation By Banks |
|||||
|
Economic Sector |
Total Amount (Kshs'000) |
% |
Total Amount (Kshs'000) |
% |
% Point Change |
|
Apr-20 |
May-20 |
||||
|
Tourism, Restaurant and Hotels |
8,018,521.0 |
45.6% |
10,033,540.0 |
34.5% |
(11.1%) |
|
Transport and Communication |
688,418.0 |
3.9% |
4,001,210.0 |
13.8% |
9.8% |
|
Trade |
1,825,080.0 |
10.4% |
3,600,272.0 |
12.4% |
2.0% |
|
Real Estate |
2,100,568.0 |
11.9% |
3,595,348.0 |
12.4% |
0.4% |
|
Manufacturing |
1,295,077.0 |
7.4% |
3,422,080.0 |
11.8% |
4.4% |
|
Agriculture |
2,937,148.0 |
16.7% |
3,172,524.0 |
10.9% |
(5.8%) |
|
Personal/Household |
593,786.0 |
3.4% |
1,041,368.0 |
3.6% |
0.2% |
|
Building and Construction |
97,084.0 |
0.6% |
143,919.0 |
0.5% |
(0.1%) |
|
Energy and Water |
17,142.0 |
0.1% |
31,368.0 |
0.1% |
0.0% |
|
Financial Services |
2,878.0 |
0.0% |
18,390.0 |
0.1% |
0.1% |
|
Mining and Quarrying |
16,206.0 |
0.1% |
16,206.0 |
0.1% |
0.0% |
|
Total |
17,591,908.0 |
100.0% |
29,076,225.0 |
100.0% |
|
Source: Central Bank
Key Take Outs:
- Tourism remained the main sector that has received funding, accounting for 34.5%, of funds provided by banks and is still considered the worst-hit sector of the economy by the ongoing pandemic,
- Funding reallocated to Agriculture accounted for 10.9%, a reduction from 16.7% seen in April as the sector continues to feel the impact of both COVID-19 and locust invasion,
- Transport and Communication recorded a 481.2% growth in funding requirements as the sector continues to be impacted by the restriction of movements into and out of major counties of Nairobi and Mombasa, and,
- Personal and household funding accounted for 3.6% of the funding as most individuals’ incomes continue to be affected by salary cuts and/or retrenchment by most businesses adversely affected by the global pandemic, especially Micro, Small and Medium Enterprises (MSMEs).
During the week, CBK also announced the acquisition of Imperial Bank’s assets and assumption of liabilities worth Kshs 3.2 bn each by KCB Group effective 2nd June 2020. The deal was officially sealed through the approval by CBK on 4th May 2020 and Treasury CS Ukur Yatani on 14th May 2020. The move will see Imperial Bank depositors paid a total of Kshs 3.2 bn over a period of 4 years and will have cumulatively recovered 37.3% of the deposits since 2015 when payments commenced, with a bulk of the deposits amounting to Kshs 53.3 bn remaining with Kenya Deposit Insurance Corporation (KDIC). The acquisition will see the assets and liabilities of KCB grow to Kshs 950.3 bn and Kshs 814.7 bn, respectively as shown below;
(All Values in Kshs Unless Stated Otherwise)
|
KCB Group Pro forma Financials |
|||
|
Balance Sheet |
KCB Group (Q1'2020) |
Imperial Bank |
Combined (Kshs bn) |
|
Total Assets |
947.1 |
3.2 |
950.3 |
|
Total Liabilities |
811.5 |
3.2 |
814.7 |
Source: KCB Group and Central Bank of Kenya
Imperial Bank was put under receivership (a process that can assist creditors to recover funds in default and can help troubled companies to avoid bankruptcy) in October 2015 due to inappropriate banking practices, with the CBK transferring Imperial Bank’s management and control to the KDIC.
Earnings Releases:
During the week, KCB Group, Co-operative Bank, NCBA, and DTBK released their Q1’2020 financial results. Below is a summary of their earnings:
KCB Group
Income Statement
- Core earnings per share rose by 8.4% to Kshs 1.95, from Kshs 1.80 in Q1’2019, driven by a 22.4% growth in total operating income to Kshs 23.0 bn, from Kshs 18.8 bn in Q1’2019. Total operating expenses grew by 36.7% to Kshs 14.0 bn, from Kshs 10.3 bn in Q1’2019. The growth in core earnings per share was not in line with our expectations of a 0.3% decrease, with the variance being attributable to the 22.4% increase in total operating income to Kshs 23.0 bn, from Kshs 18.8 bn in Q1’2020, which exceeded our expectations of a 0.7% increase,
- Total operating income rose by 22.4% to Kshs 23.0 bn, from Kshs 18.8 bn in Q1’2019. This was driven by a 30.5% rise in Non-Funded Income (NFI) to Kshs 7.9 bn, from Kshs 6.0 bn in Q1’2019, coupled with an 18.5% rise in Net Interest Income (NII) to Kshs 15.1 bn, from Kshs 12.7 bn in Q1’2019,
- Interest income grew by 20.4% to Kshs 20.2 bn, from Kshs 16.8 bn in Q1’2019. This was driven by 65.6% rise in interest income from government securities to Kshs 5.3 bn from Kshs 3.2 bn in Q1’2019, coupled with a 9.7% rise in interest income on loans and advances to Kshs 14.7 bn, from Kshs 13.4 bn in Q1’2019. The yield on interest-earning assets, however, declined to 10.8% from 11.2% in Q1’2019 attributable to a decline in lending rates, which saw trailing interest income grow by 15.4%, which was outpaced by the 19.8% growth recorded in the average interest-earning assets,
- Interest expense rose by 26.6% to Kshs 5.2 bn, from Kshs 4.1 bn in Q1’2019, following a 31.0% rise in interest expense on customer deposits to Kshs 4.7 bn from Kshs 3.6 bn in Q1’2019. Interest expense on deposits and placement from banking institutions, however, remained unchanged at Kshs 0.5 bn Q1’2020. The cost of funds, on the other hand, declined to 2.8% from 3.1% in Q1’2019 owing to a slower 11.7% growth in trailing interest expense, which grew slower than the 22.2% rise in the average interest-bearing liabilities. The Net Interest Margin (NIM) declined to 8.1% from 8.3% in Q1’2019, owing to the faster 19.8% growth in average interest-earning assets, which outpaced the 18.5% growth in Net Interest Income (NII),
- Non-Funded Income (NFI) rose by 30.5% to Kshs 7.9 bn, from Kshs 6.0 bn in Q1’2019. The increase was mainly driven by a 23.8% rise in fees and commissions on loans to Kshs 2.7 bn, from Kshs 2.2 bn in Q1’2019. As a result, the revenue mix shifted to 65:34 from 67:32 funded to non-funded income, due to the faster growth in NFI compared to NII,
- Total operating expenses grew by 36.7% to Kshs 14.0 bn, from Kshs 10.3 bn, largely driven by 25.5% rise in staff costs to Kshs 5.8 bn in Q1’2020, from Kshs 4.6 bn in Q1’2019, coupled with a 149.1% rise in Loan Loss Provisions (LLP) to Kshs 2.9 bn in Q1’2020, from Kshs 1.2 bn in Q1’2019. The increased provisioning levels were witnessed as the Group provided cover for downgraded facilities, with the expectation of an increase in defaults across sectors, brought about by the COVID-19 pandemic,
- Cost to Income Ratio (CIR) deteriorated to 61.1%, from 54.7% in Q1’2019 owing to the faster 36.7% rise in Total Operating Expenses to Kshs 14.0 bn from Kshs 10.3 bn in Q1’2019 which outpaced the 22.4% rise in Total Operating Income to Kshs 23.0 bn, from Kshs 18.8 bn in Q1’2019. Without LLP however, the cost to income ratio remained unchanged at 48.5% in Q1’2020, and,
- Profit before tax increased by 5.0% to Kshs 8.9 bn, up from Kshs 8.5 bn in Q1’2019. Profit after tax grew by 8.4% to Kshs 6.3 bn in Q1’2020, from Kshs 5.8 bn in Q1’2019 with the effective tax rate declining to 29.9% from 32.0% in Q1’2019,
Balance Sheet
- The balance sheet recorded an expansion as total assets grew by 30.5% to Kshs 947.1 bn, from Kshs 725.7 bn in Q1’2019. This growth was largely driven by a 52.0% increase in investment in government and other securities to Kshs 202.6 bn, from Kshs 133.3 bn in Q1’2019. The loan book also recorded a 19.3% growth to Kshs 553.9 bn, from Kshs 464.3 bn in Q1’2019. The strong balance sheet growth is also partly attributable to KCB consolidating assets following the acquisition of NBK,
- Total liabilities rose by 33.9% to Kshs 811.5 bn, from Kshs 606.2 bn in Q1’2019, driven by a 34.1% increase in customer deposits to Kshs 740.4 bn, from Kshs 552.2 bn in Q1’2019, with customer deposits from NBK amounting to Kshs 92.0 bn in Q1’2020. Deposits per branch rose by 4.8% to Kshs 2.2 bn from Kshs 2.1 bn in Q1’2019, with the number of branches having increased to 344 as at Q1’2020, from 258 in Q1’2019,
- The faster growth in deposits as compared to loans led to a decline in the loan to deposit ratio to 74.8%, from 84.1% in Q1’2019,
- Gross Non-Performing Loans (NPLs) rose by 70.5% to Kshs 66.2 bn in Q1’2020, from Kshs 38.8 bn in Q1’2019, attributable to the poor performance from the MSMEs segment of 16.4%, Mortgage segment of 8.3%, corporate segment of 8.2%, and Check-off loans of 2.4%. The NPL ratio thus deteriorated to 11.1%, from 8.0% in Q1’2019, due to the faster growth in Gross Non-Performing Loans (NPLs), which outpaced the growth in loans.
- General Loan Loss Provisions rose by 103.8% to Kshs 30.9 bn, from Kshs 15.2 bn in Q1’2019. The NPL coverage thus increased to 61.3%, from 51.0% in Q1’2019, due to the faster growth in General Loan Loss Provisions, which outpaced the growth in Gross Non-Performing Loans (NPLs),
- Shareholders’ funds increased by 13.5% to Kshs 135.5 bn in Q1’2020, from Kshs 119.5 bn in Q1’2019, as retained earnings grew by 8.6% y/y to Kshs 98.8 bn, from Kshs 91.0 bn in Q1’2019,
- KCB Group is currently sufficiently capitalized with a core capital to risk-weighted assets ratio of 17.1%, 6.6% points above the statutory requirement. In addition, the total capital to risk-weighted assets ratio was 19.0%, exceeding the statutory requirement by 4.5% points. Adjusting for IFRS 9, the core capital to risk-weighted assets stood at 17.1% while total capital to risk-weighted assets came in at 19.0%, and,
- The bank currently has a Return on Average Assets (ROaA) of 3.1%, and a Return on Average Equity (ROaE) of 20.1%.
Key Take-Outs:
- The group’s Profit after Tax (PAT) grew by 8.4% y/y to Kshs 6.3 bn from Kshs 5.8 bn in Q1’2019 attributable to the robust growth of Net Non-Interest Income (NII) of 22.4% to Kshs 23.0 bn from Kshs 18.8 bn. The growth in the Non-Interest Income was mainly attributable to the group’s ability to leverage on digital channels and the 65.0% growth in non-branch revenue to Kshs 2.8 bn. In Q1’2020, 97.0% of transactions were carried out outside the branch (73.0% on mobile, 20.0% on agency, Internet and POS and 4.0% on ATMs),
- Following the acquisition of National Bank of Kenya, the group’s asset quality remains under threat as seen in the increase of the groups Non- Performing Loans (NPL) ratio to 11.0% from 8.0% in Q1’2019. The significant rise is attributable to KCB’s acquisition of National Banks’ non-performing loans portfolio of Kshs 25.1 bn, and,
- Loan Loss Provisions increased by 149.1% to Kshs 2.9 bn from Kshs 1.2 bn. The increased provisioning levels were witnessed as the Group provided cover for downgraded facilities, with the expectation of an increase in defaults across sectors, brought about by the COVID-19 pandemic.
For a comprehensive analysis, please see our KCB Group Q1’2020 Earnings Note
Co-operative Bank
Income Statement
- Core earnings per share decreased marginally by 0.3% to Kshs 0.612 in Q1’2020, from Kshs 0.613 in Q1’2019, which was in line with our projections. The performance was driven by the 20.6% increase in total operating expenses, which grew faster than the 12.5% growth in total operating income in Q1’2020,
- Total operating income increased by 12.5% to Kshs 12.5 bn in Q1’2019, from Kshs 11.1 in Q1’2019. This was due to a 19.0% increase in Non-Interest Income to Kshs 5.0 bn from Kshs 4.2 bn in Q1’2019, coupled with an 8.5% growth in Net Interest Income (NII) to Kshs 7.5 bn from Kshs 6.9 bn in Q1’2019,
- Interest income rose by 4.5% to Kshs 10.5 bn in Q1’2020, from Kshs 10.1 bn in Q1’2019. The growth recorded was as a result of a 5.2% increase in interest income from loans and advances to Kshs 7.6 bn, from Kshs 7.2 bn in Q1’2019, as well as a 3.1% rise in interest income from government securities to Kshs 2.9 bn from Kshs 2.8 bn in Q1’2019. The yield on interest-earning assets, however, declined to 11.3%, from 11.9% in Q1’2019 due to the faster 9.0% growth in the average interest-earning assets that outpaced the 4.5% growth in interest income,
- Interest expense declined by 4.4% to Kshs 3.0 bn in Q1’2020, from Kshs 3.2 bn in Q1’2019, largely due to a 5.0% decline in interest expense from customer deposits to Kshs 2.6 bn from Kshs 2.8 bn in Q1’2019. Other interest expenses also declined by 1.8% to Kshs 382.7 mn from Kshs 389.7 mn in Q1’2019. Consequently, cost of funds declined to 3.4%, from 3.7% in Q1’2019, owing to the 4.4% decline in interest expense, which was outpaced by the 7.2% rise in average interest-bearing liabilities to Kshs 356.2 bn, from Kshs 323.1 bn in Q1’2019,
- Non-interest income rose by 19.0% to Kshs 5.0 bn in Q1’2020, from Kshs 4.2 bn in Q1’2019. The rise was mainly driven by a 31.0% increase in other fees and commissions from digital banking to 3.8 bn from 2.9 bn in Q1’2019, as well as a 14.0% rise in fees and commissions on loans to Kshs 0.6 bn, from Kshs 0.5 bn in Q1’2019 The growth in NFI was however weighed down by a 21.0% decline in forex trading income to Kshs 0.5 bn, from Kshs 0.6 bn in Q1’2019 as well as other income which declined by 29.1% to Kshs bn from Kshs in Q1’2019. As a consequence, the revenue mix shifted to 62:38, from 60:40 in Q1’2019 funded versus non-funded owing to the faster growth in NFI,
- Total operating expenses rose by 20.6% to Kshs 7.3 bn in Q1’2020, from Kshs 6.0 bn in Q1’2019, largely driven by the 79.5% rise in Loan Loss Provisions (LLP) to Kshs 0.9 bn from Kshs 0.5 bn in Q1’2019, coupled with a 25.0% rise in staff costs to Kshs 3.5 bn in Q1’2020 from Kshs 2.8 bn in Q1’2019. Key to note, the increased loan provisioning levels trend has been recorded in all banks that have released their financials as Banks’ cover for downgraded facilities, with the expectation of an increase in defaults across sectors, brought about by the COVID-19 pandemic,
- The Cost to Income Ratio (CIR) deteriorated to 58.1%, from 54.2% in Q1’2019, following the faster rise in total operating expenses that outpaced total operating profit. Without LLP, the cost to income ratio also deteriorated to 50.9% from 49.7% in Q1’2019,
- The bank registered a marginal 0.3% decline in profit after tax to Kshs 3.59 bn in Q1’2020 from Kshs 3.60 bn in Q1’2019. Profit before tax and exceptional items, on the other hand, grew by 3.7% to Kshs 3.7 bn from Kshs 3.6 bn in Q1’2019, with the effective tax rate increasing marginally to 29.9% in Q1’2020 from 29.6% seen in Q1’2019.
Balance Sheet
- The balance sheet recorded an expansion as total assets grew by 10.5% to Kshs 470.4 bn in Q1’2020 from Kshs 425.7 bn in Q1’2019, mainly attributable to the 11.5% growth in government securities to Kshs 115.9 bn in Q1’2020 from Kshs 103.9 bn, coupled with a 9.8% growth in net loans and advances to Kshs 276.2 bn in Q1’2020 from Kshs 251.6 bn in Q1’2019. Deposits placements also rose by 27.0% to Kshs 19.3 bn from Kshs 15.2bn,
- Total liabilities grew by 10.1% to Kshs 386.9 bn in Q1’2020 from Kshs 351.5 bn in Q1’2019, which was largely attributable to a 15.5% increase in borrowings to Kshs 27.4 bn from Kshs 23.7 bn in Q1’2019 and a 6.9% rise in customer deposits to Kshs 339.6 bn in Q1’2020 from Kshs 317.8 bn in Q1’2019.
- The faster 9.8% growth in net loans and advances which outpaced the 6.9% growth in deposits, led to a marginal increase in the loan to deposit ratio to 81.3%, from 79.2% in Q1’2019. Deposits per branch remained unchanged at Kshs 2.1 bn as the number of branches remained unchanged at 159 branches,
- Gross Non-Performing Loans (NPLs) increased by 7.1% to Kshs 31.8 bn in Q1’2020, from Kshs 29.7 bn in Q1’2020. The NPL ratio, however, improved to 10.8% in Q1’2020, from 11.1% in Q1’2019 owing to faster growth in gross loans by 9.9% outpacing the 7.1% growth in gross non-performing loans,
- General Loan Loss Provisions increased by 9.8% to Kshs 11.9 bn, from Kshs 10.9 bn in Q1’2019. The NPL coverage ratio thus increased to 54.8% in Q1’2020 from 52.2% in Q1’2019, due to the faster growth in General Loan Loss Provisions which outpaced the growth in Gross Non-Performing Loans (NPLs),
- Shareholders’ funds increased by 12.6% to Kshs 82.0 bn in Q1’2020 from Kshs 72.8 bn in Q1’2019, mainly driven by a 14.4% increase in the retained earnings to Kshs 66.9 bn, from Kshs 58.5 bn in Q1’2019,
- Co-operative Bank remains sufficiently capitalized with a core capital to risk-weighted assets ratio of 15.6%, 5.1% points above the statutory requirement of 10.5%. In addition, the total capital to risk-weighted assets ratio came in at 16.1%, exceeding the statutory requirement of 14.5% by 1.6% points. Adjusting for IFRS 9, the core capital to risk-weighted assets stood at 15.5%, while total capital to risk-weighted assets came in at 15.9%, and,
- The bank currently has a Return on Average Assets (ROaA) of 3.2%, and a Return on Average Equity (ROaE) of 18.5%.
Key Take-Outs:
- Non-Funded Income rose by rose by 19.0% to Kshs 5.0 bn in Q1’2020, from Kshs 4.2 bn in Q1’2019 below the industry average growth of 21.6%. The increase was mainly driven by the 31.0% increase in other fees and commissions to 3.8 bn from 2.9 bn in Q1’2019. As a consequence, the revenue mix shifted to 60:40, from 62:38 in Q1’2019 owing to the fast growth in NFI despite the repeal of the interest rate cap. The growth in NFI is below the current industry average of 21.6%, and,
- The bank’s asset quality improved, with the NPL ratio reducing to 10.8% in Q1’2020, from 11.1% in Q1’2019 owing to faster growth in gross loans by 9.9% outpacing the 7.1% growth in gross non-performing loans, which is attributable to the implementation of credit management strategies implemented since the beginning of the year such as adherence to credit risk appetite and limits, credit risk early warning indicators, proper credit appraisal, and approval mechanisms. The main sectors that contributed to Non-Performing Loans are Trade, Personal Consumer and Manufacturing sectors contributing 32.0%, 18.0%, and 16.0%, respectively, to total NPL.
Going forward, the factors that would drive the bank’s growth would be:
- Business Model Restructuring: The bank’s continued implementation of “Soaring Eagle” transformation initiatives is expected to drive growth and increase efficiency. The initiatives are set on the following eight key pillars; branch transformation, MSME transformation, sales force effectiveness, shared services and digitization, NPL management and credit processes, cost management, data analytics, and staff productivity. We expect the initiatives to culminate into improved revenue levels, and,
- Focus on diversification: The bank’s continued focus on channel diversification will likely continue to help the bank in generating profitability, as they continue to record increased usage and traffic. The focus on branch transformation and innovation centred on alternative channels will continue to drive NFI growth as well as transform braches to handle advisory, wealth management, and advisory services,
For a comprehensive analysis, please see our Co-op Bank Q1’2020 Earnings Note
Diamond Trust Bank Kenya
Income Statement
- Diamond Trust Bank Kenya released their Q1’2020 financial results, with core earnings per share increasing by 3.7% to Kshs 7.3, from Kshs 7.0 in Q1’2019, in line with our expectations. The performance was driven by the 3.0% increase in total operating income to Kshs 6.3 bn from Kshs 6.1 bn in Q1’2019 despite the 5.2% rise in total expenses,
- Total operating income increased by 3.0% to Kshs 6.3 bn from Kshs 6.1 bn in Q1’2019. This was due to a 3.4% increase in Non-Funded Income (NFI) to Kshs 1.6 bn, from Kshs 1.5 bn in Q1’2019, coupled with a, 2.9% increase in Net Interest Income (NII) to Kshs 4.7 bn, from Kshs 4.5 bn in Q1’2019,
- Interest income declined by 2.4% to Kshs 8.0 bn from Kshs 8.2 bn in Q1’2019. This was driven by a 1.8% decline in interest income from loans and advances to Kshs 4.8 bn, from Kshs 4.9 bn in Q1’2019, coupled up with a 1.2% decline in interest income from government securities to Kshs 3.11 bn from Kshs 3.14 bn in Q1’2019. The interest income from deposit placements declined by 72.0% to Kshs 26.4 mn from Kshs 94.4 mn in Q1’2019. The yield on interest-earning assets declined to 9.8% from 10.7% in Q1’2019, attributable to the 2.4% decline in interest income, despite the 1.7% growth in average interest-earning assets to Kshs 331.7 bn from Kshs 326.3 in Q1’2019,
- Interest expense declined by 9.0% to Kshs 3.3 bn from Kshs 3.6 bn in Q1’2019, following a 15.2% decline in interest expense on placement to Kshs 0.19 bn from Kshs 0.23 bn in Q1’2019, as well as a7.8% decline in interest expense on customer deposits to Kshs 2.8 bn from Kshs 3.0 bn in Q1’2019. Cost of funds declined to 4.5% from 5.0% in Q1’2019, owing to 9.0% decline in interest expenses, despite the 0.3% increase in average interest-bearing liabilities to Kshs 305.9 bn from Kshs 304.9 bn in Q1’2019. Net Interest Margin (NIM) declined to 5.7%, from 6.0% in Q1’2019 due to a 4.3% decline in trailing NII, despite the 1.7% growth in average Interest-Earning Assets,
- Non-Funded Income (NFI) rose by 3.4% to Kshs 1.6 bn, from Kshs 1.5 bn in Q1’2019. The increase was mainly driven by a 39.3% increase in fees and commissions to Kshs 0.4 bn from Kshs 0.3 in Q1’2019. The growth in NFI was however weighed down by the 13.1% decline in forex trading income, to Kshs 55.9 mn from Kshs 64.3 mn in Q1’2019. The revenue mix remained unchanged at 75:25 funded and non-funded,
- Total operating expenses increased by 5.2% to Kshs 3.3 bn from Kshs 3.2 bn in Q1’2019, largely driven by the 52.0% increase in Loan Loss Provisions (LLP) to Kshs 0.4 bn from Kshs 0.3 bn in Q1’2019, staff costs, which rose by 10.4% to Kshs 1.20 bn from Kshs 1.08 bn in Q1’2019. Other operating expenses however declined by 4.9% to Kshs 1.7 bn from Kshs 1.8 bn in Q1’2019,
- The Cost to Income Ratio (CIR) deteriorated to 52.9 %, from 51.8% in Q1’2019. However, without LLP, the cost to income ratio improved to 46.4%, from 47.4% in Q1’2019, highlighting improved efficiency levels,
- Profit before tax rose by 0.5% to Kshs 3.0 bn, from Kshs 2.9 bn in Q1’2019. Profit after tax grew by 3.7% to Kshs 2.04 bn in Q1’2020, from Kshs 1.97 bn in Q1’2019, with the effective tax rate declining to 30.9% from 33.0% in Q1’2019,
Balance Sheet
- The balance sheet recorded an expansion as total assets increased by 4.0% to Kshs 385.0 bn from Kshs 370.1 bn in Q1’2019. This growth was largely driven by a 6.7% increase in net loans to Kshs 201.3 bn from Kshs 188.6 bn in Q1’2019, coupled with a 1.9% increase in government securities to Kshs 128.2 bn from Kshs 125.8 bn in Q1’2019. The growth in assets was however slowed down by a 21.9% decline in placements to Kshs 8.6 bn from Kshs 11.1 bn in Q1’2019,
- Total liabilities rose by 2.8% to Kshs 318.1 bn from Kshs 309.3 bn in Q1’2019, driven by an 82.6% increase in placement liabilities to Kshs 23.4 bn from Kshs 12.8 bn in Q1’2019, coupled with the 20.3% increase in borrowings to Kshs 15.1 bn from Kshs 12.5 bn in Q1’2019. The growth was however slowed by the 20.7% decline in other liabilities to Kshs 6.9 bn from Kshs 8.7 bn in Q1’2019, coupled with a 0.9% decline in customer deposits to Kshs 272.8 bn from Kshs 275.3 bn in Q1’2019. Deposits per branch declined by 0.9% to Kshs 1.99 bn from Kshs 2.01 bn in Q1’2019, as the number of branches remaining unchanged at 137 in Q1’2020,
- Loans to deposit ratio increased to 73.8% from 68.5% in Q1’2019, owing to the 6.7% growth in net loans, with customer deposits having declined by 0.9% during the same period,
- Gross Non-Performing Loans (NPLs) rose by 15.7% to Kshs 16.6 bn in Q1’2020 from Kshs 14.4 bn in Q1’2019. Consequently, the NPL ratio deteriorated to 8.0% in Q1’2020 from 7.3% in Q1’2019 owing to slower growth in gross loans by 6.4% outpacing the 15.7% growth in gross non-performing loans. General Loan Loss Provisions declined by 14.5% to Kshs 4.5 bn from Kshs 5.3 bn in Q1’2019. Consequently, the NPL coverage declined to 42.4% in Q1’2020 from 50.7% in Q1’2019 due to the decline in General Loan Loss Provisions which was outpaced the growth in Gross Non-Performing Loans (NPLs),
- Shareholders’ funds increased by 10.1% to Kshs 61.0 bn in Q1’2020 from Kshs 55.5 bn in Q1’2019, largely due to the 11.9 % increase in the retained earnings to Kshs 49.1 bn, from Kshs 43.9 bn in Q1’2019,
- Diamond Trust Bank is currently sufficiently capitalized with a core capital to risk-weighted assets ratio of 19.3%, 8.8% points above the statutory requirement. In addition, the total capital to risk-weighted assets ratio was 21.0%, exceeding the statutory requirement by 6.5% points. Adjusting for IFRS 9, the core capital to risk-weighted assets stood at 19.7%, while total capital to risk-weighted assets came in at 21.5%,
- The bank currently has a Return on Average Assets (ROaA) of 1.9%, and a Return on Average Equity (ROaE) of 12.6%.
Key Take-Outs:
- The bank’s asset quality deteriorated, with the NPL ratio increasing to 8.0% from 7.3% in Q1’2019 owing to slower growth in gross loans by 6.4% outpacing the 15.7% growth in gross non-performing loans. The decline in asset quality is attributable to a 15.7% increase in the gross NPLs to Kshs 16.6 bn in Q1’2020 from Kshs 14.4 bn in Q1’2019,
- The bank recorded improved performance in NFI income, which recorded a 3.4% growth y/y, largely supported by the 67.2% growth in other non-interest income, coupled with a 39.3% increase in fees and commissions. Consequently, NFI contribution to total income rose by 0.1% to 25.4% from 25.3% in Q1’2019. This, however, remains below the current industry average of 21.6%,
- There was an improvement in efficiency levels as the cost to income ratio without LLP improved to 46.4%, from 47.4% in Q1’2019. The improvement was largely attributable to a 4.9% decline in other expenses.
Going forward, we expect the bank’s growth to be driven by:
- Geographical diversification: The bank’s forays into other markets such as Tanzania, Uganda, and Burundi, may aid the bank’s growth, given the lack of loan pricing controls in those markets. Continued focus on those markets would aid in alleviating the compressed interest income regime in the Kenyan market.
For a comprehensive analysis, please see our DTBK Q1’2020 Earnings Note
NCBA Group
Key to note: The financial statements of the bank have been prepared on a prospective basis (assuming a continuation of CBA), representing Q1’2020 results of NCBA bank (merged bank) with prior year comparatives (Q1’2019) being those of CBA bank. Hence, the results are not comparable on a like for like basis. As such, we have used proforma-combined financials for the two entities.
Income Statement
- Core earnings per share declined by 26.8% to Kshs 2.3 from Kshs 3.2 in Q1’2019, which was not in line with our projections of Kshs 1.6. The performance can be attributed to a 23.6% increase in total operating income to Kshs 10.9 bn from Kshs 8.8 bn in Q1’2019, coupled with the 49.8% increase in total operating expenses from Kshs 5.5 bn in Q1’2019 to Kshs 8.3 bn in Q1’2020,
- Total operating income increased by 23.6% to Kshs 10.9 bn in Q1’2020 from Kshs 8.8 bn in Q1’2019. This was due to a 49.7% increase in Non-Funded Income (NFI) to Kshs 5.4 bn in Q1’2020 from Kshs 3.6 bn recorded the previous year, coupled with a 5.5% increase in Net Interest Income (NII) to Kshs 5.5 bn from the Kshs 5.2 bn recorded in Q1’2019,
- Interest income rose by 6.8% to Kshs 10.2 bn from Kshs 9.5 bn in Q1’2019. This was mainly driven by a 39.1% rise in interest from loans and advances to Kshs 6.2 bn from Kshs 6.0 bn in 2019 coupled with an 11.8% rise in interest income on government securities to Kshs 3.8 bn in Q1’2020 from Kshs 3.4 bn in Q1’2019. Despite this, the yield on interest-earning assets declined to 6.3% in Q1’2020 from 9.8% in Q1’2019 due to the 32.6% decline in trailing interest income compared to 3.8% growth in average interest-earning assets to Kshs 412.4 bn from Kshs 397.3 bn in Q1’2019,
- Interest expense increased by 8.3% to Kshs 4.7 bn from Kshs 4.3 bn in Q1’2019, mainly attributable to an increase in interest expense on customer deposits by 14.1% to Kshs 4.2 bn from Kshs 3.6 bn in Q1’2019. The cost of funds fell to 3.1% from 4.8% in Q1’2019 owing to the 30.9% decline in trailing interest expense compared to the faster 6.7% growth in average interesting bearing liabilities. The Net Interest Margin came in at 3.3%, lower than the 5.2% seen in Q1’2019, due to the 34.1% decline in trailing NII compared to the faster 3.8% growth seen in the average interest-earning assets,
- Non-Funded Income rose by 49.7% to Kshs 5.4 bn from Kshs 3.6 bn in Q1’2019. The increase in NFI was driven by a 125.8% increase in fees and other commissions to Kshs 3.2 bn from Kshs 1.4 bn in Q1’2019, coupled with a 17.0% increase in forex trading income to Kshs 1.0 bn from Kshs 0.8 bn in Q1’2019. The revenue mix shifted to 50:50 funded to non-funded income in Q1’2020 from 59:41 in Q1’2019, owing to the faster increase in NFI compared to NII,
- Total operating expenses increased by 49.8% to Kshs 8.3 bn from Kshs 5.6 bn in Q1’2019, largely driven by a 404.3% increase in loan loss provision to Kshs 3.8 bn in Q1’2020 from Kshs 0.7 bn in Q1’2019, coupled with a 4.3% increase in other operating expenses to Kshs 2.9 bn in Q1’2020 from Kshs 2.7 bn in Q1’2019. The high increase in Loan loss provision is driven by the expectations of a significant increase in NPLs due to the economic fallouts caused by Coronavirus. However, the growth in total operating expenses was weighed down by an 18.4% decline in staff costs to Kshs 1.7 bn from Kshs 2.1 bn recorded in Q1’2019,
- The cost to income ratio deteriorated to 76.1% from 62.8% in Q1’2019. However, without LLP, the cost to income ratio improved to 41.5% from 54.3% in Q1’2019, highlighting improved efficiency
- Profit before tax declined by 26.5% to Kshs 2.4 bn from Kshs 3.3 bn in Q1’2019. Profit after tax declined by 26.8% to Kshs 1.6 bn in Q1’2020 from Kshs 2.2 bn in Q1’2019, with part of the variance being attributed to an exceptional item of Kshs 195.6 mn. The effective tax rate increased to 32.5% from 32.3% recorded in Q1’2019,
- The board of directors announced that it was changing its earlier recommendation to pay a cash dividend and instead recommend a bonus share issue where shareholders will receive one (1) share for every ten (10) shares held. This decision was mode considering the need to preserve capital for the stakeholders, in light of the challenges posed by the COVID-19 pandemic.
Balance Sheet
- The balance sheet recorded an expansion with a total assets growth of 9.2% to Kshs 509.6 bn from Kshs 466.8 bn in Q1’2019. This growth was largely driven by a 21.1% increase in government securities to Kshs 153.5 bn from the Kshs 126.8 bn recorded in Q1’2019. The loan book expanded by 3.9% to Kshs 245.9 bn in Q1’2020 from Kshs 240.6 bn in Q1’2019,
- Total liabilities rose by 10.4% to Kshs 440.8 bn from Kshs 399.1 bn in Q1’2019, driven by a 9.9% increase in customer deposits to Kshs 390.5 bn from Kshs 355.3 bn in Q1’2019. Placements decreased by 3.8% from the Kshs 9.2 bn recorded in Q1’2019 to Kshs 8.9 bn in Q1’2020. Deposits per branch stood at Kshs. 9.1 bn with the bank operating 43 branches,
- The faster 9.9% growth in deposits compared to the 2.2% growth in loans led to a decline in the loan to deposit ratio to 63.0% from 67.7% in Q1’2019,
- Gross non-performing loans increased by 31.8% to Kshs 38.8 bn in Q1’2020 from Kshs 29.5 bn in Q1’2019. Consequently, the NPL ratio deteriorated to 14.5% in Q1’2020 from 11.4% in Q1’2019.
- Shareholders’ funds increased by 1.9% to Kshs 68.6 bn in Q1’2020 from Kshs 67.0 bn in Q1’2019, as share premium grew by 199.3% to Kshs 22.2 bn from Kshs 7.4 bn recorded in Q1’2019, the growth was however weighed down by a 27.4% decline in retained earnings to Kshs 38.6 bn, from Kshs 53.5 bn in Q1’2019,
- NCBA Group is currently sufficiently capitalized with a core capital to risk-weighted assets ratio of 17.9%, 7.4% above the statutory requirement. In addition, the total capital to risk-weighted assets ratio was 18.5%, exceeding the statutory requirement by 4.0%. Adjusting for IFRS 9, the core capital to risk-weighted assets stood at 18.2%, while total capital to risk-weighted assets came in at 18.8%,
- NCBA Group currently has a return on average assets of 1.5% and a return on average equity of 10.7%.
Key Take-Outs:
- PAT and exceptional items decreased by 26.8% to Kshs 1.6 bn in Q1’2020, from the Kshs 2.2 bn recorded in Q1’2019, attributable to a 49.8% increase in Total operating expenses to Kshs 8.3 bn from Kshs 5.6 bn in Q1’2019, largely driven by a 404.3% increase in loan loss provision to Kshs 3.8 bn in Q1’2020 from Kshs 0.7 bn in Q1’2019. This was mitigated by the 23.6% increase in Total operating income to Kshs 10.9 bn in Q1’2020 from Kshs 8.8 bn in Q1’2019. This was due to a 49.7% increase in Non-Funded Income (NFI) to Kshs 5.4 bn in Q1’2020 from Kshs 3.6 bn recorded the previous year,
- NCBA’s Non-funded income (NFI) growth came in at 49.7%, higher than the industry average of 21.6%. As a result, the revenue mix shifted to 50:50 funded to non-funded income in Q1’2020 from 59:41 in Q1’2019, owing to the faster increase in NFI compared to NII,
- There was an improvement in efficiency levels as the cost to income ratio without LLP improved to 41.5% from 54.3% in Q1’2019. This was mainly attributable to the 18.4% decline in Staff costs to Kshs 1.7 bn from Kshs 2.1 bn recorded in Q1’2019.
Going forward, we expect the bank’s growth to be further driven by:
- The Bank is expected to continue increasing its synergy by capitalizing on the strengths of the previous entities. This can be seen through the use of their LOOP digital platform, which has allowed the bank to diversify its revenue streams.
For a comprehensive analysis, please see our NCBA Group Q1’2020 Earnings Note
The table below highlights the performance of the banks that have released so far, showing the performance using several metrics, and the key take-outs of the performance.
|
Bank |
Core EPS Growth |
Interest Income Growth |
Interest Expense Growth |
Net Interest Income Growth |
Net Interest Margin |
Non-Funded Income Growth |
NFI to Total Operating Income |
Growth in Total Fees & Commissions |
Deposit Growth |
Growth in Government Securities |
Loan to Deposit Ratio |
Loan Growth |
Return on Average Equity |
|
|
KCB |
8.4% |
20.4% |
26.6% |
18.5% |
8.1% |
30.5% |
34.4% |
23.8% |
34.1% |
52.0% |
74.8% |
19.3% |
20.1% |
|
|
DTBK |
3.7% |
(2.4%) |
(9.0%) |
2.9% |
5.7% |
3.4% |
25.4% |
39.3% |
(0.9%) |
1.9% |
73.8% |
6.7% |
12.6% |
|
|
Co-op |
(0.3%) |
4.5% |
(4.4%) |
8.5% |
8.2% |
19.0% |
39.9% |
14.0% |
6.9% |
11.5% |
81.3% |
9.8% |
18.5% |
|
|
NCBA*** |
(26.8%) |
6.8% |
8.3% |
5.5% |
3.3% |
49.7% |
49.7% |
125.8% |
9.9% |
21.1% |
63.0% |
3.9% |
10.7% |
|
|
Stanbic |
(33.5%) |
(7.1%) |
0.5% |
(11.0%) |
5.5% |
(29.2%) |
49.9% |
10.0% |
6.4% |
(11.5%) |
79.8% |
11.8% |
14.5% |
|
|
Q1'20 Mkt Weighted Average* |
(4.5%) |
9.4% |
10.3% |
9.4% |
6.9% |
21.6% |
39.3% |
36.6% |
17.7% |
25.9% |
75.1% |
12.7% |
17.0% |
|
|
Q1'19Mkt Weighted Average** |
12.2% |
3.6% |
2.5% |
4.5% |
8.0% |
10.7% |
36.0% |
11.2% |
11.0% |
16.1% |
74.0% |
7.7% |
19.2% |
|
|
*Market-cap-weighted as at 22/05/2020 |
||||||||||||||
|
**Market-cap-weighted as at 31/05/2019 *** The financial statements of the bank have been prepared on a prospective basis (assuming a continuation of CBA), representing Q1’2020 results of NCBA bank (merged bank) with prior year comparatives (Q1’2019) being those of CBA bank. Hence, the results are not comparable on a like for like basis. As such, we have used proforma-combined financials for the two entities. |
||||||||||||||
Key takeaways from the table above include:
- Five banks have released their Q1’2020 financial results, recording a (4.5%) average decrease in core Earnings Per Share (EPS), compared to a growth of 12.2% in Q1’2019 for the entire listed banking sector,
- The banks that have released results have recorded a deposit growth of 17.7%, faster than the 11.0% growth recorded in Q1’2019. The faster growth in deposits led to a faster 10.3% growth in interest expenses, compared to 2.5% in Q1’2019, indicating that banks struggled to mobilize relatively cheaper deposits amid the ongoing pandemic as most customers prefer liquidity,
- Average loan growth came in at 12.7%, which was faster than the 7.7% recorded in Q1’2019, with the growth in loans being accelerated following the repeal of interest rate cap in November 2019, coupled with increased demand in funding as businesses demand working capital to operate in the tough operating environment as a result of the pandemic. Government securities, on the other hand, recorded a growth of 25.9% y/y, which was faster compared to the loans, and the 16.1% growth recorded in Q1’2019. This highlights banks’ continued preference towards investing in government securities, which offer better risk-adjusted returns,
- Interest income increased by 9.4%, compared to a growth of 3.6% recorded in Q1’2019. The faster growth in interest income may be attributable to the 12.7% growth in loans and increased allocation to government securities. Consequently, the Net Interest Margin (NIM) now stands at 6.9%, compared to the 8.0% recorded in Q1’2019 for the whole listed banking sector, and,
- Non-Funded Income grew by 21.6% y/y, faster than 10.7% recorded in Q1’2019. The growth in NFI was supported by the 36.6% average increase in total fee and commission income, which was faster than the 11.2% growth recorded in Q1’2019.
Universe of Coverage
|
Banks |
Price at 15/05/2020 |
Price at 22/05/2020 |
w/w change |
YTD Change |
Year Open |
Target Price* |
Dividend Yield |
Upside/ Downside** |
P/TBv Multiple |
Recommendation |
|
Diamond Trust Bank |
77.0 |
74.0 |
(3.9%) |
(32.1%) |
109.0 |
179.7 |
3.6% |
146.5% |
0.4x |
Buy |
|
Kenya Reinsurance |
2.4 |
2.4 |
0.0% |
(22.4%) |
3.0 |
4.8 |
4.7% |
108.9% |
0.2x |
Buy |
|
Jubilee Holdings |
249.5 |
250.0 |
0.2% |
(28.8%) |
351.0 |
453.4 |
3.6% |
84.9% |
0.9x |
Buy |
|
KCB Group*** |
35.7 |
36.3 |
1.8% |
(32.8%) |
54.0 |
55.8 |
9.6% |
63.4% |
0.9x |
Buy |
|
Equity Group*** |
33.7 |
36.2 |
7.3% |
(32.4%) |
53.5 |
55.3 |
6.9% |
59.9% |
1.2x |
Buy |
|
I&M Holdings*** |
49.3 |
49.4 |
0.2% |
(8.5%) |
54.0 |
73.6 |
5.2% |
54.1% |
0.7x |
Buy |
|
Co-op Bank*** |
12.9 |
12.6 |
(2.7%) |
(23.2%) |
16.4 |
18.2 |
8.0% |
53.0% |
1.0x |
Buy |
|
NCBA |
27.2 |
27.2 |
(0.2%) |
(26.3%) |
36.9 |
39.4 |
0.9% |
46.0% |
0.7x |
Buy |
|
Standard Chartered |
176.0 |
173.3 |
(1.6%) |
(14.4%) |
202.5 |
223.6 |
11.5% |
40.6% |
1.4x |
Buy |
|
Stanbic Holdings |
88.0 |
85.8 |
(2.6%) |
(21.5%) |
109.3 |
109.8 |
8.2% |
36.3% |
1.0x |
Buy |
|
Sanlam |
15.4 |
16.1 |
4.2% |
(6.7%) |
17.2 |
21.7 |
0.0% |
35.2% |
1.3x |
Buy |
|
ABSA Bank*** |
10.5 |
10.4 |
(1.4%) |
(22.5%) |
13.4 |
12.6 |
10.6% |
32.4% |
1.2x |
Buy |
|
Liberty Holdings |
7.5 |
8.3 |
10.7% |
(19.8%) |
10.4 |
10.1 |
0.0% |
21.2% |
0.7x |
Buy |
|
CIC Group |
2.2 |
2.3 |
7.8% |
(12.7%) |
2.7 |
2.6 |
0.0% |
12.8% |
0.8x |
Accumulate |
|
HF Group |
4.0 |
4.1 |
1.5% |
(37.3%) |
6.5 |
4.3 |
0.0% |
6.2% |
0.2x |
Hold |
|
Britam |
6.0 |
6.6 |
10.0% |
(26.4%) |
9.0 |
6.8 |
3.8% |
5.8% |
0.7x |
Hold |
|
*Target Price as per Cytonn Analyst estimates **Upside/ (Downside) is adjusted for Dividend Yield ***Banks in which Cytonn and/ or its affiliates are invested in |
||||||||||
We are “Neutral” on equities for investors because, despite the sustained price declines, which have seen the market P/E decline to below its historical average presenting investors with attractive valuations in the market, the economic outlook remains grim.
- Residential Sector
During the week, the Ministry of Transport, Infrastructure, Housing and Urban Development published the National Housing Development Fund Regulations 2020, for stakeholder input. The regulations are aimed at guiding the operationalization of the National Housing Development Fund (NHDF), which was established in 2018 in line with the government’s affordable housing initiative and under the mandate of the National Housing Corporation (NHC), to help bridge the affordable housing gap in Kenya by:
- Guaranteeing offtake to affordable housing by private developers, thus giving them the necessary liquidity to construct more units,
- Enabling end-buyer uptake by providing affordable housing finance solutions such as Tenant Purchase Schemes (TPS), and,
- It will also allow mortgage and cash buyers to save towards the purchase of an affordable home, in addition to issuing them with loans at an interest rate of up to 7.0% p.a. on a reducing balance basis,
In 2018, the government introduced the mandatory housing fund levy through the Finance Act 2018 but was faced with a lot of legal hurdles leading to the president’s directive in December 2019 to the National Treasury and Housing Ministry to make the contribution voluntary with immediate effect. The proposed regulations are, therefore, an alteration to the 2018 regulations, which have been revoked. The main differences are as below:
|
Housing Fund Regulations Alterations |
||
|
Factor |
2018 NHDF Regulations |
2020 NHDF Regulations |
|
Contributions |
|
|
|
Registration |
|
|
|
Loan Eligibility |
|
|
|
Access to Contributions |
|
|
|
Qualifications for a Home Under the Affordable Housing Scheme |
|
|
|
Offences and Penalties |
|
|
In our view, the Kenya National Housing and Development Fund is a great move by the government towards the actualization of affordable housing provision in Kenya, especially when the initiative is far behind its target timelines head of 2022. If well governed and implemented, we expect the fund to be successful in raising the targeted funds and the same channeled to facilitating housing in the country. However, for the government to realize its goal of delivering 500,000 affordable housing units, there is still a need to provide the right environment for private sector investment to supplement government initiatives.
- Retail Sector
During the week, Car and General Kenya, a local supplier of power generation, automotive and engineering products, announced that it had secured Carrefour supermarket as the anchor tenants for its refurbished Nairobi Mega property on Uhuru Highway. The 170,000 SQFT property was previously anchored by Nakumatt, which had occupied 40,000 SQFT. Carrefour is expected to set up by June this year, marking its 8th store in the country. The multinational retailer has continued to record massive growth in Kenya since its first store in 2016 and this has been due to; (i) ability to leverage its scale and operation know-how to become one of the leading retailers locally, which saw it record Kshs 18.7 bn in revenues as of 2019, 28.0% increase from 2018, (ii) adequate funding such as the Kshs 3.0 bn loan from Standard Bank Group earlier this month, and, (iii) availability of prime locations vacated by struggling supermarket chains such as Nakumatt and Uchumi. For retail sector investors, the continued expansion of stable local and international retailers such as Carrefour and Quickmart is a welcome move, especially following the increased vacancy rates in the sector driven by the fall of struggling retailers namely, Nakumatt, Uchumi and Choppies. We expect global retailers to continue showing interest in the Kenyan retail sector, mainly attracted by the increasing change in consumer tastes & preferences, relatively low formal penetration rates at 35.0%, and fast economic growth enabled by infrastructural developments.
Car and General also commenced the planning of the second development in Shanzu, Mombasa (details undisclosed) alongside other plans to divest non-core businesses as it seeks to expand its property portfolio. Local firms are increasingly diversifying their portfolios by venturing into real estate. Last week, Sameer Africa, a local company whose principal business is the importation and sale of tyres, announced that it would be turning its focus to its real estate business after closing down its loss-making tyre distribution business. This is an indication of investor confidence in the real estate sector, which has continued to record growth despite a tough economic environment. According to Kenya National Bureau of Statistics (KNBS) Economic Survey 2020 Report, the sector recorded improved growth of 5.3% in 2019 compared to 4.1% in 2018 and accounted for 6.9% contribution to GDP.
- Infrastructure
During the week, Water and sanitation Cabinet Secretary, Sicily Kariuki unveiled a Kshs 1.3 bn Kiambu-Ruaka water supply and sewerage project. The project will be implemented by the Athi Water Works Development Agency through funding by the African Development Bank (AfDB), under the Kenya Towns Sustainable Water Supply and Sanitation Programme and will involve the rehabilitation of Kiambu’s water treatment plant and the construction of 108 km of trunk and reticulation sewers in Kiambu and Ruaka. In our view, the provision of reliable water supply and sanitation will enhance the appeal of Ruaka and Kiambu supporting the continued real estate growth and performance in both areas. The newly unveiled project is expected to benefit more than 100,000 residents of Kiambu and Ruaka with the expansion of the sewerage infrastructure expected to increase the county’s wastewater management capacity while reducing pressure on the current systems, thus supporting the areas’ rapid population growth that is largely driven by Kenya’s workforce stationed in Nairobi.
|
Nairobi Metropolitan water and sewerage coverage in 2018 |
||
|
County |
Water coverage |
Sewerage coverage |
|
Nairobi |
78% |
50% |
|
Kiambu |
77% |
16% |
|
Machakos |
54% |
19% |
|
Murang'a |
52% |
5% |
|
Kajiado |
43% |
0% |
|
Average |
61% |
18% |
Source: Water Services Regulatory Board
The improvement of infrastructure is expected to spur the growth of real estate in the Kiambu County through;
- Opening up the County for Development – Prospective developers are likely to buy or rent properties in well-developed areas. A developed neighbourhood assures the buyer of property appreciation at a rate higher than the prevailing market rates, thus better returns in the case of an investor. Consequently, it opens up areas which were otherwise unattractive not only for settlement but also trade and commerce thus uplifting economic prospects,
- Reduced Development Costs - Infrastructural costs in Kenya account for approximately 25.6% of construction costs, according to a report by the Centre for Affordable Housing Finance in Africa. Therefore the provision of the same relieves the cost burden that would have otherwise been incurred by the developer, and this has been noted to significantly facilitate the development of affordable housing units, and
- Higher Property Values - availability of services and utilities in the county will enhance demand for property in the county thus resulting in increased property values.
- Statutory Review
During the week, the Ministry of Transport, Infrastructure, Housing, Urban Development and Public Works gazetted the National Construction Authority (Defects Liability) Regulations 2020, which introduced various changes to the defects liability period with regards to commercial buildings. Amongst the changes introduced, was a latent defects liability period for commercial buildings which shall be a minimum period of six years from completion of the regular defects liability period (which will now be referred to as the patent defects liability period). If approved, the regulations will give commercial buildings owners up to seven years to recall contractors back to the site to rectify flaws in projects. Key highlights from the regulations include:
- Every contract for the construction of a commercial building shall prescribe a patent defects liability period which shall be a minimum period of twelve months after practical completion (this is seen as an extension of the traditional defects liability period which usually lasts 6 months in Kenya),
- Every contract for the construction of a commercial building shall prescribe a latent defects liability period which shall be a minimum period of six years after the completion of the patent defects liability period,
- The contractor, sub-contractor and other relevant professionals shall be liable for the rectification of defects that become apparent during the latent defects liability period, and,
- The contractor and sub-contractor will obtain insurance cover for defects that may become apparent during the latent defects liability period while other relevant professionals shall obtain a professional indemnity cover for the same.
The regulations have been proposed to safeguard commercial property developers’ interests against sub-par construction work by negligent contractors, sub-contractors and project consultants. However, lack of adequate public participation before the drafting of the regulations is apparent as they contain a lot of grey areas which, if not addressed, may become the source of future site conflicts due to misinterpretation of the regulations. Consequently, during the week, the Institution of Construction Project Managers of Kenya (ICPMK), through a letter to Transport, Infrastructure, Housing, Urban Development and Public Works Cabinet Secretary James Macharia, raised concerns on the gazetting of the Regulations by the cabinet secretary, citing lack of public participation prior to the publication of the gazette notice. Below are areas that may need further clarification:
- The regulations only apply to commercial buildings. As per the regulations, a commercial building means “premises occupied wholly or partially for trade or business or rendering services for money or money's worth”. This omits buildings such as residential buildings, buildings by non-profit organizations, government buildings etc. It is not clear why the limitations of the defects liability period either patent or latent are restricted to commercial buildings only,
- The regulations define an owner as, “a person who enters into a contract with a contractor for the construction of a commercial building.” This does not address a situation where an agent enters into a contract on behalf of the owner or an occasion where the owner sells the commercial building before the latent defects liability period is over (6 years),
- The regulations state that the contractor, sub-contractor and other relevant professionals shall be liable for the rectification of patent defects that become apparent during the latent defects liability period. It, however, doesn’t specify the extent to which either of the stakeholders will be liable. It is not clear whether they will all be liable or whether a party is only liable where the defects cover their area of expertise,
- The regulations state that upon correction of defects by the relevant professionals, the owner shall certify that the relevant professional or sub-contractor has made good the defects identified. An assumption seems to have been made that all owners are construction savvy which then undermines the role of the architect who is considered to be the ‘supervisor’ in a construction project,
- The extension of the patent defects liability period from the previous 6 months to 12 months appears to be an unnecessarily long time which will make contractors wait longer for their last moiety of retention and certificate of completion, and,
- The contractor and sub-contractor will be required to obtain insurance cover for defects that may become apparent during the latent defects liability period whereas other relevant professionals shall obtain a professional indemnity cover for the same. It is not clear whose expense this will be.
In our view, there is need for extensive negotiations and all-inclusive participation by stakeholders in the construction sector to ensure proper integration of any new regulations with the existing construction laws thus limiting any grey areas.
- Listed Real Estate
During the week, Fund manager, ICEA Lion Asset Management (ILAM) announced that it had completed a transaction with Stanlib Kenya Limited (SKL) that will see it acquire the latter’s role of managing property fund Stanlib Fahari I-REIT, from South Africa based Liberty Holdings Ltd. ILAM will now acquire all rights, obligations and benefits of SKL in connection with SKL’s role as promoter and REIT manager. The Stanlib Fahari I-REIT, which is the only publicly traded REIT in Kenya, was launched in November 2015, at a share price of Kshs 20.75 and currently owns and manages four properties, namely: Greenspan Mall in Donholm, 67 Gitanga Place in Lavington, Bay Holdings, along Enterprise Road, Industrial Area, and Signature International, along Pokomo Road, Industrial Area. The instrument has, however, continued to record a decline in performance since its listing in November 2015, trading at an average of Kshs 8.4 per unit as at April 2020, and 59.5% lower than its initial value of Kshs 20.75 per unit. As per Stanlib Fahari I-REIT- Audited Results FY’2019, the I–REIT’s performance in terms of dividend yield was 8.3% in 2019 compared to the commercial real estate market average of 7.8%, with 7.8% rental yield for retail space and 7.7% yield for office space in Q1’2020. However, the earning per unit recorded a 9.4% decline to Kshs 0.97 from Kshs 1.07, attributed to a 9.0% decline in net profits to Kshs 175.2 mn in 2019 from Kshs 193.5 mn in 2018 mainly due to the reduction in fair value gain on revaluation of investment property compared to the prior year, on the back of a sluggish performance in the real estate sector and continued downward pressure on rental income, especially in the retail sector.
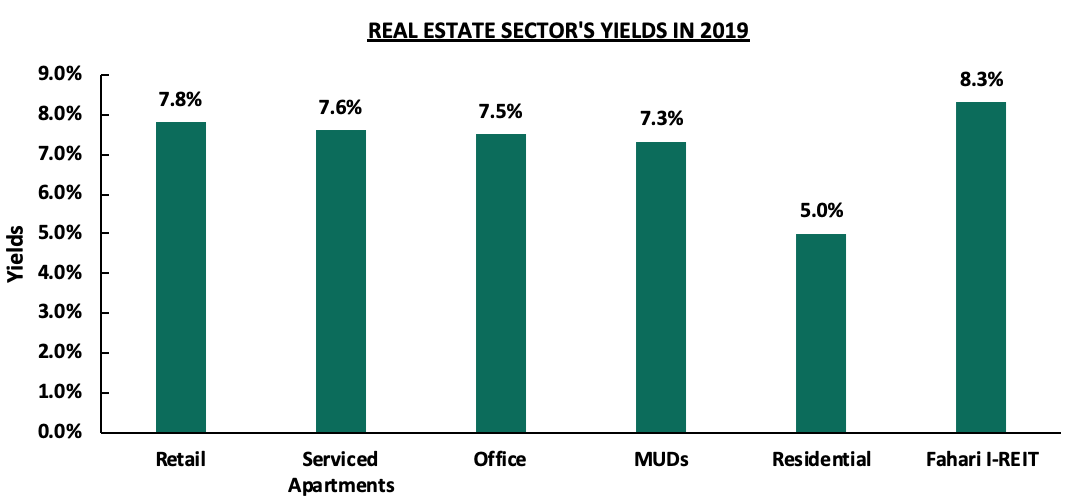
Source: Cytonn research
REITs in the Kenyan market, most notably the Stanlib Fahari I-REIT have continued to record poor performance, with key challenges being: (i) opacity of the exact returns from the underlying assets, (ii) inadequate investor knowledge, and, (iii) lack of institutional support for REITs. The REIT market in Kenya has the potential for growth if a supportive framework is provided. Some of the measures that may boost the REIT market include; (i) teaming up with market players and regulators to offer constant training to the investing public, (ii) Continuous improvement on the regulation, and, (iii) government support for REITs. Currently, the average Kenyan investor is left to invest in informal, unregulated real estate schemes that have exposed them to risks. For more, see our REITs topical.
We retain a neutral outlook towards the performance of the real estate sector, despite the effects of the COVID-19 pandemic on the Kenyan economy as a whole. We expect the sector to continue being supported by the expansion of local retailers in addition to supportive government policies geared towards enhancing homeownership as well as the continued investment towards infrastructure.
Kenya’s growing economy translates into an expanding middle class, thus, increasing demand for housing. According to the National Housing Corporation (NHC), the housing deficit stands at 2.0 mn and has been growing annually by approximately 200,000 units. As such the government introduced ‘provision of affordable housing’ in 2017 as one of its four key pillars for the following five years with the aim of delivering 500,000 units to alleviate the housing crisis. However, three years later, the government has only delivered approximately 228 housing units, an indicator that the target units might just be a pipe dream. The slow momentum is largely attributable to unavailability of financing for both developers and buyers alike. In our previous topicals, we have looked into government strides aimed at resolving the deficit: the establishment of Kenya Mortgage Refinancing Company, Home Ownership Savings Plan and the National Housing Development Fund, among others. Despite the progress made, unavailability of funding continues to be a key impediment to the fruition of the government’s Big Four Agenda on the provision of affordable housing. Therefore, this week, we focus on ways of accelerating funding for affordable housing where we shall cover:
- Introduction to the Current Housing Situation in Kenya,
- Government’s Initiatives Towards the Affordable Housing Initiative,
- Challenges Hindering the Achievement of Affordable Housing,
- Case Study: Singapore, and,
- Recommendation and Conclusion
- Introduction to the Current Housing Situation in Kenya
Kenya’s economy has grown tremendously over the past decade evidenced by the relatively high GDP per Capita of Kshs 198,078 as at 2019, with a ten-year CAGR of 10.1%, according to Kenya National Bureau of Statistics, resulting in the World Bank’s declaration of Kenya as a middle- income country in 2014. The growing economy translates into an expanding middle class, thus, increasing demand for goods and services, including decent housing. According to the Kenya National Bureau of Statistics, the Kenyan middle class can be defined as anyone having a disposable income of between Kshs. 23,670 and Kshs. 199,999 per month. However, 74.5% of the working population earns a median gross income of Kshs 50,000 per month or below.
With the increase in economic growth, demand for appropriate housing comes to the forefront. However, in most areas countrywide and for the majority of urban dwellers, access to decent affordable housing has been and remains a pipe dream. Despite the acknowledged importance of housing in Kenya, the demand still outstrips supply. This manifests itself through the increased informal settlements in urban areas with World Bank estimating that 56.0% of the Kenyan urban population live in slums and poor quality housing in rural areas. Delivery of housing to the low to middle-income citizens is further aggravated by inequality and imbalance in housing supply among income groups. Currently, more than 80.0% of new houses produced are for high and upper-middle-income earners, driven by the ease of exit by developers as well as high construction costs, ultimately leaving the low-end and lower mid-end income brackets, who make up approximately 75.4% of the population not catered for.
- Government’s Initiatives Towards the Affordable Housing Initiative
To alleviate the housing issue, the government has made tremendous progress by implementing various policies and fiscal reforms for the past three decades with the aim of enhancing house ownership. So far, the incentives and tax exemptions aimed at driving homeownership in Kenya include:
For Home Buyers:
- Tax exemption on funds deposited under a registered Home Ownership Savings Plan (HOSP) subject to a maximum of Kshs 8,000 per month or Kshs 96,000 per annum, for 10 years,
- Affordable housing relief of 15.0% of gross emoluments up to Kshs 108,000 per annum or Kshs 9,000 per month for Kenyans buying houses under the Affordable Housing Scheme,
- Tax exemption for interest on mortgage repayments up to Kshs 25,000 per month or Kshs 300,000 per annum provided that the taxpayer occupies the property,
- Formation of the National Housing Development Fund (NHDF)- The Fund aims to bridge the gap for affordable housing in Kenya by; enabling end-buyer uptake by providing affordable financing solutions such as the anticipated nationwide Tenant Purchase Scheme (TPS), allowing mortgage and cash buyers to save towards the purchase of an affordable home through the Home Ownership Savings Plan and extending mortgage loans to members at an interest rate of up to 7.0% p.a.,
- Establishment of the Kenya Mortgage Refinancing Company (KMRC) - The facility’s main objective is to grow Kenya’s mortgage market by providing long-term funding to primary mortgage lenders. The facility is set to lend money to local financial institutions at an annual interest rate of 5.0%, enabling them to write home loans at 7.0%, 6.0% points lower than the market rate of approximately 13.0%, and,
- A waiver on stamp duty for first- time home buyers under the affordable housing programme.
- Allowing the use of 40.0% of accumulated pension benefits for the purchase of a residential house in addition to the previous use of 60.0% as mortgage collateral.
For Developers;
- Reduction in corporate tax by 50.0% from 30.0% to 15.0% for developers of over 100 affordable housing units annually,
- Exemption from Value Added Tax for supplies imported or purchased for direct and exclusive use in the construction of affordable houses by licensed Special Economic Zones (SEZ), subject to; i) recommendation of the Cabinet Secretary for Housing, and ii) a minimum of 5,000 units to qualify,
- A 25.0% tax exemption for investors in commercial property, who spend on social infrastructure such as power, water, sewer lines, and roads to allow recovery of their expenses within 4-years, and,
- The waiving of building approval fees for all affordable housing projects in Nairobi, under the Nairobi City County Sessional Paper Number 1 of 2018.
- Challenges Hindering the Achievement of the Affordable Housing
Despite the above incentives, Kenya has failed to develop a robust housing finance system leading to relatively low homeownership rates. According to the 2015/16 Kenya Integrated Household Budget Survey (KIHBS), only 26.1% of Kenyans living in urban areas own the homes they live in. This is in comparison to countries like South Africa and the United States with 53.5% and 64.5%, respectively. Those who own homes rely mainly on savings and other sources of financing including commercial bank loans, and local investment groups commonly referred to as chamas, and Savings & Credit Co-operative Societies (SACCOs). Mortgage loans uptake remains relatively low totaling to 26,554 as at December 2018 out of an adult population of 23.0 mn. On the supply end, the Kenya residential market has continued to witness increased activities within the high-end markets fueled by the relatively good returns as investors can charge a premium on units within these submarkets. However, the highest demand for housing remains within the low and mid-end markets, which have suffered low supply as developers are not keen on such submarkets, given the relatively low property market prices and resultant low returns.
The main challenges facing housing include;
- Inadequate Supply of Affordable Development Class Land - There is an inadequate supply of serviced land at affordable prices due to soaring land prices in urban areas, which has led to increased development costs as land costs account for 25.0% - 40.0% of development costs in urban areas, which consequently impacts on end-user property prices,
- Costs of Construction - Mid-level construction costs in Kenya range from Kshs 44,000 - Kshs 64,000 per square metre (SQM) depending on the level of finishes, height and other related factors, which account for 50.0% - 70.0% of development costs. Considering a mid-level 2-bed house of 70 SQM, the construction cost alone would be at least Kshs 3.0 mn using a rate of Kshs 44,000 per SQM, meaning the total development cost will range from Kshs 4.0 mn - Kshs 6.0 mn, limiting the affordability of such a house,
- Inadequate Infrastructure - Several parts of Kenya lack the requisite infrastructure for development, such as proper access roads, power and sewerage services. Developers are thus forced to incur these costs, which are then passed on to the end buyer,
- Access to Finance for Development - Real estate development is a capital-intensive investment and thus, developers have to explore alternative sources of capital, which come at a relatively high cost ranging from 14.0% - 18.0% per annum,
- Access to and Affordability of Mortgages - Access to mortgages in Kenya remains low mainly due to; i) low-income levels that cannot service a mortgage, ii) soaring property prices, iii) high interest rates and deposit requirements which lockout many borrowers, iv) exclusion of employees in the informal sector due to insufficient credit risk information, and v) lack of capital markets funding towards real estate purchases for end buyers. According to Central Bank of Kenya, there were only 26,554 mortgage accounts in Kenya as at December 2018 out of a total adult population of approximately 23 mn persons, with the mortgage to GDP ratio standing at 3.1% in 2016 compared to countries such as South Africa and the USA, which have a ratio of above 30.0% and 70.0%, respectively,
- Underdeveloped Capital Markets Infrastructure – Financing for real estate is capital intensive and cannot be done by only bank financing. In more developed economies, businesses depend on banks for only 40.0% of the funding with the balance coming from alternative channels such as capital markets. However, in Kenya businesses rely on banks for over 95.0% of the funding with only 5.0% of funding coming from capital markets. To increase funding from capital markets, we will need to open our capital markets from the current restrictive rules and regulations, which serve to constrain capital markets development. Specifically, we need; (i) expedited and time-bound approval processes, (ii) liberalize eligibility for Trustees beyond the current few banks, who are also conflicted, to include Corporate Trustees, (iii) enable unit trust funds to have as many bank custodians as necessary to serve their clients, (iv) reduce the minimum investment required for development REITs from the current Kshs. 5 million, which is too high given the current median income of just Kshs 50,000 per month, (v) expand room for private offers to increase the diversity of funding available in the market, (vi) allow for specialized collective investment schemes so that investors can invest in funds focused on housing, as current rules only allow up to 25.0% investment into one asset class, and (vii) reduce the capital requirements for a REIT Trustee from Kshs 100 million, which has limited the REIT trustees to less than 3 players,
- Ineffectiveness of Public-Private Partnerships (PPPs) for Housing Development - The government has previously enlisted the help of the private sector for financing and development of affordable housing. This has however not achieved the intended objective as a result of:
- Regulatory hindrances such as lack of a mechanism to transfer public land to a Special Purpose Vehicle (SPV) to facilitate access to private capital through the use of the land as security,
- Lack of clarity on returns and revenue-sharing,
- The extended time-frame of PPPs while private developers prefer to exit projects within 3-5 years, and,
- Bureaucracy and slow approval processes.
- Case Study: Singapore
Singapore is a country with one of the best housing solutions in the world. In 1960, just after acquiring independence, Singapore had a cumulative housing requirement of 147,000 units for the 10-year period that ended in 1969 for a population of 1.6 mn people, which was growing at 6.4% per annum. The private sector could only provide approximately 2,500 housing units per year and at price levels out of reach for the low-income segment. The government, therefore, put in place policies and strategies to promote home-ownership for its residents. According to the World Bank, as at 2018, 80.0% of Singaporeans lived in houses built by the government, through the Housing Development Board (HDB) (the equivalent of the National Housing Corporation in Kenya), with 90.0% being owner-occupied, yet when they attained self-government in 1959 only 9.0% lived in public housing.
Some of the initiatives that have led to the fruition and sustenance of affordable housing in Singapore are:
- Establishment of the Singapore Improvement Trust (SIT) in 1927 by the British colonial government to carry out town planning, slum clearance and to provide low-cost housing for resettled residents and low-income earners, and,
- Establishment of the Housing and Development Board in 1960 by the Singapore Government whose top priority was to ramp up a large-scale public housing program that would be able to house the majority of the population.
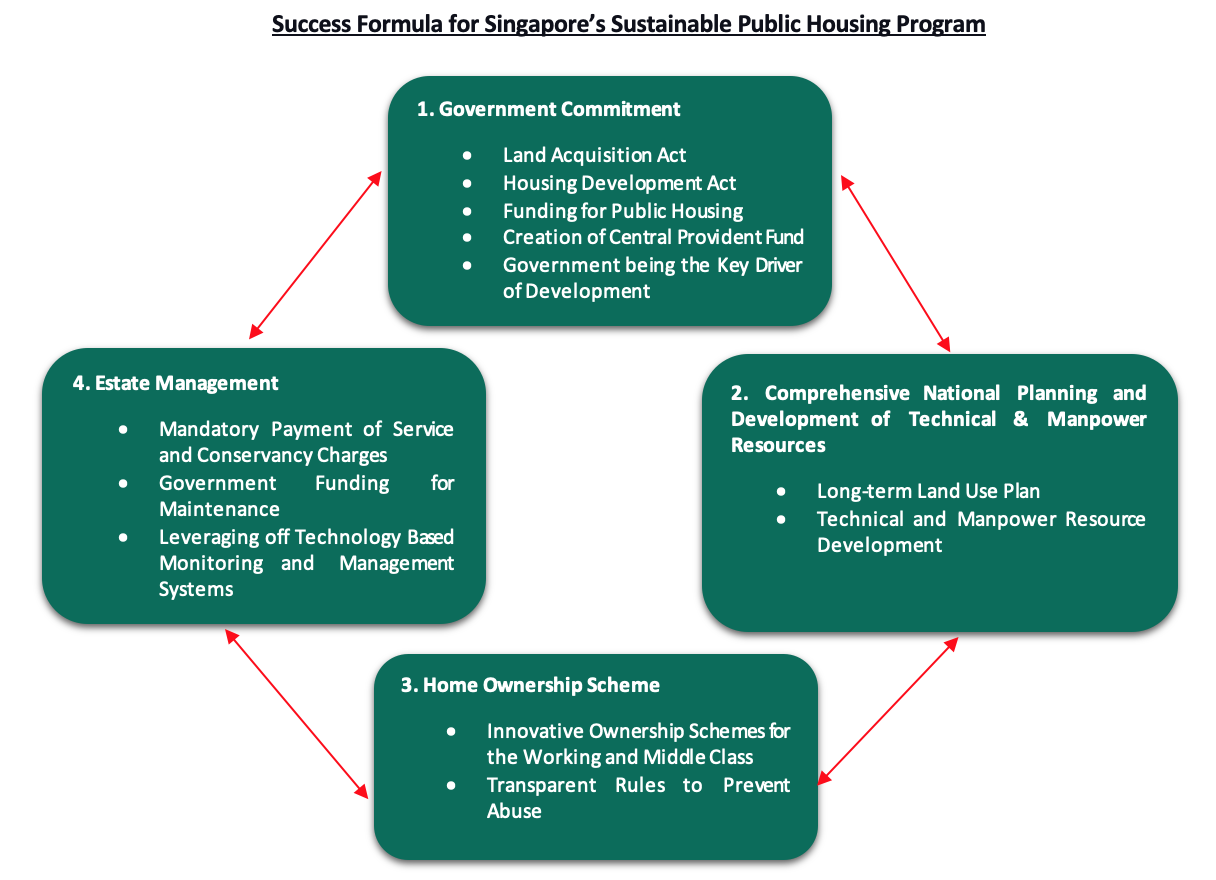
NOTE: Central Provident Fund (CPF):- is a compulsory comprehensive savings and pension plan for working Singaporeans and permanent residents primarily to fund their retirement, healthcare, and housing needs in Singapore.
The public housing program in Singapore has been enabled predominantly by the availability of funds from the general government tax revenue and the Central Provident Fund (CPF). Similar to the National Housing Development Fund in Kenya, Singapore has in place the Central Provident Fund which was initially installed as a vehicle for housing finance. A major policy innovation was later implemented to allow withdrawals from the fund to finance the purchase of houses sold by the Housing Development Board. When the CPF was established in 1955, both employers and employees contributed 10.0% (5.0% each by employees and employers) of the individual employee’s monthly salary toward the employee’s personal and portable account in the fund. The contribution rates in 2016 were 20.0% of wages for employees (the portion of pay withheld by an employer to go into the CPF account) and 17.0% of wages for employers (an amount an employer is required to pay into an employees’ CPF account out of their own pocket, above and beyond the stipulated salary), up to a monthly salary ceiling of an equivalent of Kshs 44,000.
The Housing Development Board (HDB) receives government loans to finance its mortgage lending and pays interest at the prevailing CPF savings rate. The HDB uses the loans to provide mortgage loans and mortgage insurance to buyers of its leasehold flats (both new and resale). The typical loan represents 80.0% of the price of the flat. The maximum repayment period is limited to 25 years. In Singapore, every household can apply for a maximum of two HDB loans. The mortgage interest rate charged by the HDB is pegged at 0.1% points above the CPF ordinary account savings interest rate. The latter is based on savings rates offered by the commercial banks, subject to a minimum of 2.5%. The use of CPF savings for the purchase of public housing has been an important factor in making the homeownership program in Singapore possible and successful.
Initially, HDB introduced the homeownership scheme which aimed at providing public housing for people whose housing needs were not met by the private sector. The scheme then grew slowly because of the small number of flats available and the requirement of a handsome amount of down payment. To improve the situation, a CPF Act was introduced to allow members to withdraw up to 80.0% of their total CPF savings to purchase a flat. The Act also stipulated that the employers and employees had to contribute a monthly sum to the employees’ CPF accounts. As the returns on CPF savings are low comparing to the price increase in public ownership flats, most residents chose to withdraw their CPF savings to purchase public flats to maximize the returns of their savings. This mandatory savings deposited with the government had built up a huge capital reserve for the government to finance housing developments and simultaneously enabled all CPF members to purchase their houses and meet their initial and mortgage payments. Therefore, utilization of savings can enhance homeownership by either fully settling the unit sale value or the deposit.
These are the financing options for each type of housing as provided by the Housing Development Board:
- Build to Order: These are apartments that HDB sells off-plan. This is financed by the HDB loan by banks which lend at a fixed rate of 2.6%. Accessibility to this loan requires individuals to pay a very little amount of cash or none provided they have enough CPF savings,
- Design, Build and Sell Scheme:Units built under this scheme were for public housing but were developed by private developers. The scheme was however suspended after 2015 due to the unsatisfactory spaces of units and high prices charged by developers which led to poor reception, and,
- Executive Condominiums:These are more executive apartments built and sold by private developers to buyers who can exceed Housing Development Board income ceilings but cannot afford private homes. Individuals pursuing these developments get bank loans and get to choose a floating rate package.
In conclusion, key take-outs and lessons Kenya could take up from the Singapore housing system would be;
- It will be challenging to deliver affordable housing without a comprehensive urban plan and hence, to meet housing demand sustainably, there is a need to have efficient urban planning measures in place,
- Without adequate incentives, the private sector will not be empowered enough to significantly contribute to the housing supply, and,
- Just like in Singapore, there is a need to consider the use of social security payments as a down payment for housing.
- Recommendation and Conclusion
Accessing funding for real estate continues to be a key challenge in Kenya, and especially with the need to fuel the government’s initiative on the provision of affordable housing with the target of developing approximately 500,000 housing units by 2020. Borrowing lessons from the case study in Singapore, the private sector is also a key player in resolving the housing deficit. Majorly, the private sector’s participation in the development of affordable housing in Kenya has been crippled by the unavailability of financing in the wake of tough economic times, bank dominance where approximately 95.0% of financing is from banks and only 5.0% is obtained from other sources according to World Bank and the relatively high cost of funding in Kenya. Learning from developed countries such as Singapore and the United Kingdom, capital markets play a key role in the mobilization of commercial financing mainly to boost housing. Therefore, while seeking to accelerate funding for affordable housing development, there is a need for consideration of ways of deepening capital markets and access to non-bank funding. Some of the ways of achieving this include:
- Reduced Minimum Amount Investable in Real Estate Investment Trusts (REIT) - The hefty minimum investment required for a REIT has continued to push away potential investors. Therefore, to attract capital into capital markets vehicles such as REITs to develop affordable housing, there is a need to conduct a review on the REIT. The current regulations, which define the minimum subscription amount per investor at Kshs 5.0 mn for a Development REIT (D-REIT) is too high to attract significant interest from a diverse set of investors. An amount of approximately Kshs 1.0 mn ensures the investor is sophisticated while also allowing a larger pool of investors to participate,
- Development Of Structured Products In The Kenyan Market – Structured products have been a welcome alternative to banks for businesses seeking capital for growth, and the same can come in handy in the funding of affordable housing projects. Currently, the supply of affordable housing has been significantly crippled by the unavailability of financing with 95.0% of the funding being sourced from banks while only 5.0% from other alternative funding. Thus, the market lacks favorable options which would otherwise be availed through structured products at competitive rates thus increasing the development of affordable housing,
- Review of the Regulations of Pension Schemes Funds to be Invested in a Residential House- According to the Retirement Benefits Regulations, citizens can utilize a proportion up to 40.0% of their accumulated benefits subject to a maximum of 7 million towards the purchase of a house, in addition to using up to 60.0% of the same as mortgage collateral. However, as is the 40.0% may prove to be insufficient for some members, hindering the ambitions of becoming a home-owner, and thus not achieved the intended impact. Therefore, there is need for a review of the same and we propose matching what already exists as an allowable limit for mortgage loans guarantees. Additionally, the members should be allowed to select the developer they would wish to buy the house from,
- Review of Public-Private Partnerships (PPPs) - There is still uncertainty regarding revenue-sharing and the returns to private investors in PPPs, as well as policies that will curtail corruption and bureaucracy associated with government projects. In addition, private developers are likely to shy away from projects of more than 5 years given the uncertainty associated with transitioning to a new government after the end of the current term. Unless resolved, the above issue is likely to continue resulting in the ineffectiveness of these PPPs,
- General Bureaucracy and Ineffective Policy Actions: To deliver the high numbers of affordable housing units required, the process of land and real estate transactions need to be much faster and less susceptible to rent collection by gatekeepers. Policy actions, such as the reduction of income tax for developers producing 100 affordable units annually from 30.0% to 15.0%, need to be clear and accessible, and,
- Specialized Collective Investment Schemes- To allow for the mobilization of funds specifically for affordable housing projects, there is need for the Capital Markets Regulations to allow for the formation of a Collective Investment Scheme that invests in a single asset class or is formed for a specific purpose or specific sectors such as affordable housing, technology or financial fund etc.
In conclusion, the supply of affordable housing units has mainly been constrained by the unavailability of financing, especially with the current bank dominance. There is, therefore, the need to mobilize alternative sources of funding, particularly the opening up of capital markets’ access to developers, which will provide a low-cost capital raising mechanism, thus, fill in the existing financing gap in addition to complementing the government efforts aimed at driving one of the government’s Big Four Agenda on the provision of affordable housing.
Disclaimer: The views expressed in this publication are those of the writers where particulars are not warranted. This publication is meant for general information only and is not a warranty, representation, advice or solicitation of any nature. Readers are advised in all circumstances to seek the advice of a registered investment advisor.

- Talk to us
- Kenya
- P.O Box 20695 - 00200, Nairobi, Kenya
- Cell +254709101200
- Tel +254709101200
- WhatsApp +254741676635
- United States
- +254709101200
- DOWNLOAD OUR APP
-


- Kenya
- 8th Floor, Pinetree Plaza, Kaburu Drive, Ngong Road, Nairobi, Kenya
- USA
- Suite 1150, 1775 Eye Street NW, USA, Washington DC 20006, USA
- Investments
- High Yield
- Private Equity
- Real Estate
- Real Estate
- RiverRun Estates
- Cytonn Towers
- The Ridge
- Taraji Heights
- The Alma