Commercial Office Sector H1’2021 Markets Review Note
By Research Team, Jul 21, 2021
Gigiri and Karen were the best performing submarkets in H1’2021 recording rental yields of 8.2% and 7.9%, respectively against a market average of 6.9%
The commercial office sector recorded a 0.1% and 1.9% points decline in the average rental yields and occupancy rates to 6.9% and 76.3% in H1’2021, from 7.0% and 77.7%, respectively in FY’2020. The performance decline is attributable to the containment measures for the COVID-19 pandemic which has led to reduced demand for physical spaces as businesses continue to embrace the working from home strategy and may make it a permanent measure, coupled with the 7.3 mn SQFT office space oversupply as at 2020.
The table below shows a five-year performance summary of commercial office sector for the average rental yields;
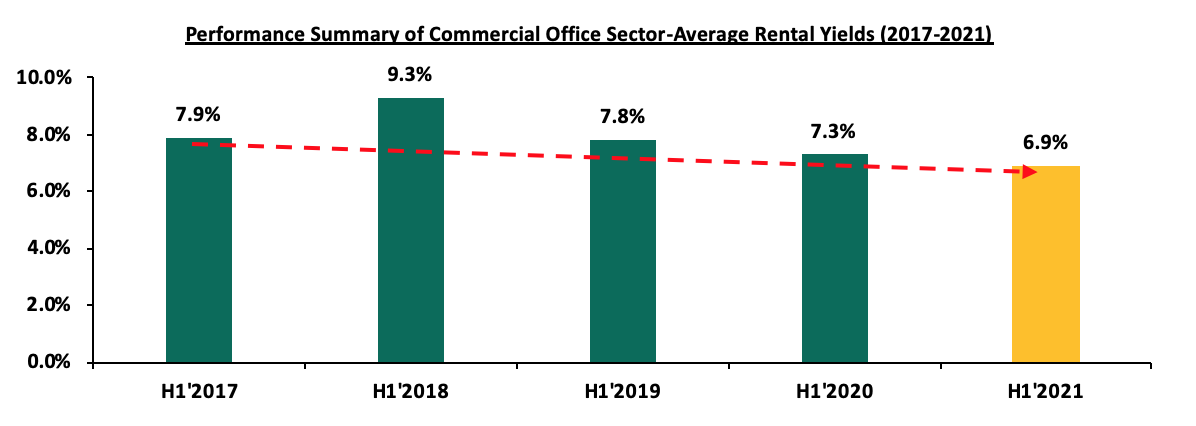
Source: Cytonn Research
The asking rents and selling prices also registered a 0.1% and 0.5% decline to an average of Kshs 92.8 per SQFT and Kshs 12,224 per SQFT in H1’2021, from Kshs 93.1 per SQFT and Kshs 12,228 per SQFT, respectively in FY’2020. The decline in the asking prices and rents is attributed to landlords providing incentives to tenants such as rent-free periods as well as reducing their rates so as to retain existing tenants and attract new occupants for their office spaces.
The table below highlights the performance of the Nairobi Metropolitan Area (NMA) Commercial Office sector over time:
(All values in Kshs Unless Stated Otherwise)
|
Nairobi Metropolitan Area (NMA) Commercial Office Returns Over Time |
|||||||
|
Year |
Q1'2020 |
H1"2020 |
Q3' 2020 |
FY'2020 |
Q1'2021 |
H1'2021 |
∆ FY'2020/H1'2021 |
|
Occupancy % |
81.7% |
80.0% |
79.9% |
77.7% |
76.3% |
75.8% |
(1.9%) |
|
Asking Rents (Kshs/SQFT) |
97 |
95 |
94 |
93 |
92 |
93 |
(0.1%) |
|
Average Prices (Kshs/SQFT) |
12,535 |
12,516 |
12,479 |
12,280 |
12,228 |
12,224 |
(0.5%) |
|
Average Rental Yields (%) |
7.8% |
7.3% |
7.2% |
7.0% |
6.8% |
6.9% |
(0.1%) |
Gigiri and Karen were the best performing submarkets of the commercial office sector in H1’2021 recording rental yields of 8.2% and 7.9%, respectively against a market average of 6.9% attributed to their serene environments hence attracting prime, developments and rental prices, relatively good infrastructure, and low supply of commercial office spaces within the markets. However, Mombasa Road recorded the lowest performance within the Nairobi Metropolitan Area with rental yields coming in at 4.7% attributed to the effect of traffic snarl-ups which has been worsened by the current construction of the Nairobi-Express Way, low quality office spaces, and zoning regulations as Mombasa Road is mainly considered as an industrial area.
The table below shows the Nairobi Metropolitan Area (NMA) sub-market performance;
(All values in Kshs Unless Stated Otherwise)
|
Nairobi Metropolitan Area Commercial Office Submarket Performance H1’2021 |
|
|||||||||||
|
Area |
Price (Kshs) /SQFT H1’2021 |
Rent (Kshs) /SQFT H1’2021 |
Occupancy (%) H1’2021 |
Rental Yields (%) H1’2021 |
Price Kshs/ SQFT FY 2020 |
Rent Kshs/SQFT FY 2020 |
Occupancy FY 2020(%) |
Rental Yield (%) FY 2020 |
∆ in Rent |
∆ in Occupancy (% points) |
∆ in Rental Yields (% points) |
|
|
Gigiri |
13,375 |
115 |
80.0% |
8.2% |
13,400 |
116 |
82.5% |
8.5% |
(0.9%) |
(2.5%) |
(0.3%) |
|
|
Karen |
13,429 |
108 |
81.7% |
7.9% |
13,567 |
106 |
83.6% |
7.8% |
2.1% |
(1.9%) |
0.1% |
|
|
Parklands |
10,947 |
92 |
77.5% |
7.8% |
10,958 |
93 |
79.9% |
7.6% |
(0.2%) |
(2.4%) |
0.2% |
|
|
Westlands |
11,964 |
104 |
73.3% |
7.7% |
11,975 |
104 |
74.4% |
7.8% |
(0.2%) |
(1.0%) |
(0.1%) |
|
|
Kilimani |
12,245 |
93 |
79.5% |
7.3% |
12,233 |
93 |
79.1% |
6.8% |
0.2% |
0.4% |
0.5% |
|
|
Upperhill |
12,614 |
95 |
77.4% |
6.9% |
12,684 |
92 |
78.5% |
6.9% |
2.7% |
(1.1%) |
0.0% |
|
|
Nairobi CBD |
11,767 |
81 |
77.1% |
6.4% |
11,889 |
82 |
82.4% |
6.8% |
(1.8%) |
(5.3%) |
(0.4%) |
|
|
Thika Road |
12,429 |
77 |
73.7% |
5.5% |
12,500 |
80 |
76.1% |
5.8% |
(3.7%) |
(2.4%) |
(0.3%) |
|
|
Mombasa road |
11,250 |
71 |
61.7% |
4.7% |
11,313 |
73 |
63.0% |
4.8% |
(2.5%) |
(1.3%) |
(0.1%) |
|
|
Average |
12,224.30 |
92.8 |
75.8% |
6.9% |
12,280 |
93 |
77.7% |
7.0% |
(0.5% |
(1.9%) |
(0.1%) |
|
Source: Cytonn Research 2021
We retain a NEGATIVE outlook for the NMA commercial office sector which is expected to continue being affected by factors such as the existing oversupply at 7.3 mn SQFT of space, reduced demand as people continue embracing working from home which has proven to be a viable cost saving option for most firms and declines in the rental rates brought about by the reduced forces of demand. Despite the negative outlook, investment opportunity lies in areas such as Gigiri and Karen which fetch relatively higher rental yields with favorable locations.
For more information, please see our Cytonn H1’2021 Markets Review.

- Talk to us
- Kenya
- P.O Box 20695 - 00200, Nairobi, Kenya
- Cell +254709101200
- Tel +254709101200
- WhatsApp +254741676635
- United States
- +254709101200
- DOWNLOAD OUR APP
-


- Kenya
- 8th Floor, Pinetree Plaza, Kaburu Drive, Ngong Road, Nairobi, Kenya
- USA
- Suite 1150, 1775 Eye Street NW, USA, Washington DC 20006, USA
- Investments
- High Yield
- Private Equity
- Real Estate
- Real Estate
- RiverRun Estates
- Cytonn Towers
- The Ridge
- Taraji Heights
- The Alma