
Cytonn Monthly July 2026
By Research Team, Aug 2, 2026
Executive Summary
Fixed Income
During the month of July 2026, T-bills were oversubscribed, with the overall average subscription rate coming in at 154.7%, lower than the subscription rate of 156.3%, recorded in June 2026. The overall average subscription rates for the 182-day paper increased to 95.2% from 34.9% in June 2026, while that for 91-day, and 364-day papers decreased to 413.9%, and 56.3% from 698.0%, and 61.1% recorded in June 2026 respectively. The average yields on the government paper were on an upward trajectory during the month, with the average yield for 182-day, 364-day and 91-day papers increasing by 36.5 bps, 17.0 bps and 15.0 bps respectively to 9.0%, 9.0% and 8.8% from the 8.6%, 8.8% and 8.7% recorded the previous month respectively. For the month of July, the government accepted a total of Kshs 115.1 bn of the Kshs 167.4 bn worth of bids received in T-Bills, translating to an acceptance rate of 69.3%, compared to an acceptance rate of 83.7% in the month of June 2026;
During the week, T-bills were undersubscribed for the first time in nine weeks, with the overall subscription rate coming in at 97.7% lower than the subscription rate of 137.5%, recorded the previous week. Investors’ preference for the shorter 91-day paper persisted, with the paper receiving bids worth Kshs 14.4 bn against the offered Kshs 8.0 bn, translating to a subscription rate of 180.0%, lower than the subscription rate of 275.7%, recorded the previous week. The subscription rate for the 364-day paper decreased marginally to 47.9% from 48.8% recorded the previous week, while that of the 182-day paper decreased significantly to 81.7% from 115.6% recorded the previous week. The government accepted a total of Kshs 27.3 bn worth of bids out of Kshs 27.4 bn bids received, translating to an acceptance rate of 99.7%. The yields on the government papers recorded a mixed performance with the yields on the 91-day paper increasing by 0.6 bps to 8.79% from 8.78% recorded the previous week. The yields on the 182-day papers remained unchanged from 8.95% recorded the previous week. While, the yields on the 364-day papers decreased the most by 1.9 bps to 9.02% from the 9.04% recorded the previous week;
Additionally, July 2026 bonds were oversubscribed, with the overall average subscription rate coming in at 209.5%, higher than the average subscription rate of 34.4%, recorded in June 2026. The reopened bonds FXD1/2019/020, FXD1/2022/025, FXD1/2022/010, FXD1/2021/020 and FXD1/2026/030 with tenors to maturity of 12.8 years, 21.4 years, 5.8 years, 15.2 years and 29.2 years respectively and fixed coupon rates of 12.9%, 14.2%, 13.5%, 13.4% and 12.5% respectively, received bids worth Kshs 230.4 bn against the offered Kshs 110.0 bn translating to an oversubscription rate of 209.5%. The government accepted bids worth Kshs 133.9 bn, translating to an acceptance rate of 58.1%. The weighted average yield for the accepted bids for the FXD1/2019/020, FXD1/2022/025, FXD1/2022/010, FXD1/2021/020 and FXD1/2026/030 came in at 13.9%, 14.4%, 12.8%, 14.3% and 14.6% respectively;
In the primary bond market, the government announced the re-opening of three Infrastructure Bonds, IFB1/2019/016, IFB1/2021/018 and IFB1/2021/021, seeking to raise Kshs 150.0 bn to finance infrastructure projects. The bonds have fixed coupon rates of 11.75%, 12.67%, and 12.73%, with remaining tenors to maturity of 9.3 years, 12.7 years, and 16.2 years, respectively. The offer period opened on 30th July 2026 and will close on 12th August 2026. Our bidding ranges for IFB1/2019/016, IFB1/2021/018, and IFB1/2021/021 are 12.50% - 13.00%, 12.75% - 13.25%, and 13.00% - 13.50%, respectively;
Additionally, the government announced a switch auction with an amount on offer of Kshs 15.0 bn, allowing holders of FXD1/2012/15 and Treasury Bills 2685/091, 2646/182, and 2574/364 to switch their holdings into FXD4/2019/010 as part of its debt liability management strategy. The destination bond, FXD4/2019/010, has a fixed coupon rate of 12.28% and a remaining tenor to maturity of 3.23 years. The offer period opened on 30th July 2026 and will close on 24th August 2026. Our recommended bidding range for FXD4/2019/010 is 11.75% -12.25%, based on our fair value assessment using the current government securities yield curve, secondary market pricing of comparable bonds, and prevailing liquidity conditions in the fixed-income market;
The year-on-year inflation in July 2026 increased by 0.1% points to 6.5% from the 6.4% recorded in June 2026;
We expect the MPC to maintain the Central Bank Rate (CBR) at 8.75% in their August 2026 meeting;
Equities
During the month of July, the equities market was on an upward trajectory, with NSE 20, NASI, NSE 25 and NSE 10 gaining by 9.0%, 6.1%, 5.8% and 5.8% respectively. The performance was mainly driven by gains recorded by large cap stocks such as KCB, Equity and Safaricom of 9.2%, 8.4% and 7.2% respectively;
During the week, the equities market was on an upward trajectory, with NSE 20, NASI, NSE 10, and NSE 25 gaining by 2.4%, 1.9%, 1.6% and 1.5% respectively, taking the YTD performance to gains of 30.3%, 29.0%, 28.4% and 27.0% for NSE 20, NSE 10, NSE 25 and NASI respectively. The week-on-week equities market performance was driven by gains recorded by large-cap stocks such as KCB, EABL and Safaricom of 4.2%, 3.3% and 2.5% respectively. The performance was however weighed down by losses recorded by large cap stocks such as BAT, Cooperative Bank, and Equity of 1.7%, 0.4% and 0.3% respectively;
Also, during the month, the banking sector index gained by 5.6% to close at 269.4 from the 255.1 recorded at the end of the June 2026. This was attributable to gains recorded by large-cap stocks such as KCB, Equity and DTB-K of 9.2%, 8.4% and 5.2% respectively;
During the week, the banking sector index gained by 1.3% to 269.4 from 265.9 recorded the previous week. This is attributable to gains recorded by large cap stocks such KCB, DTB-K and SCB-K of 4.2, 1.2% and 1.0% respectively. The performance was however weighed down by losses recorded by large cap stocks such as Cooperative Bank, Equity and Stanbic of 0.4%, 0.3% and 0.2% respectively;
During the week, Centum Investments Company PLC released their FY’2026 financial results for the period ending 31st March 2026, recording an 8.5% decrease in the Profit After Tax to Kshs 0.7 bn in FY’2026, from Kshs 0.8 bn in FY’2025. The decrease was mainly attributable to the 28.8% increase in Profit from investment operations to Kshs 1.5 bn from Kshs 1.2 bn from FY’2025. The performance was however weighed down by the 18.4% decrease in loss from trading businesses to Kshs 0.4bn from Kshs 0.5 bn recorded in FY’2025;
Real Estate
During the week, the Government announced plans to borrow Kshs 81.0 bn to finance the expansion and modernization of Jomo Kenyatta International Airport (JKIA), representing 70.0% of the revised Kshs 116.0 bn project cost. The remaining Kshs 35.0 bn will be raised through a securitized bond and the National Infrastructure Fund (NIF), with the bond expected to be backed by future air passenger service levy revenues. The Government has appointed the Trade and Development Bank (TDB) and the Africa Finance Corporation (AFC) as lead arrangers for the financing, reflecting the Government's increasing use of alternative financing mechanisms to deliver large-scale infrastructure projects amid constrained public finances;
During the week, the Government announced that the feasibility study for the planned 243-kilometre Mau Summit–Malaba dual carriageway will commence in Q1'2026/27, following completion of the pre-feasibility study in May 2026. The project will upgrade the existing two-lane highway into a four-lane, access-controlled tolled road under a Public-Private Partnership (PPP) model. The highway forms part of the Northern Corridor connecting western Kenya to Uganda and will complement the Kshs 170.0 bn Rironi–Mau Summit dual carriageway currently under construction;
During the week, the Kenya Tourism Board (KTB) announced plans to leverage the 16th edition of the Magical Kenya Travel Expo (MKTE), scheduled for 6th–8th October 2026 in Nairobi, to strengthen Kenya's position as a key global tourism hub. The event is expected to attract more than 10,000 delegates from 40 countries, providing a platform to showcase Kenya's tourism offerings and connect local tourism operators with international markets;
On the Unquoted Securities Platform Acorn D-REIT and I-REIT traded at Kshs 29.6 and Kshs 23.8 per unit, respectively, as per the last updated data on 17th July 2026. The performance represented a 48.0% and 18.8% gain for the D-REIT and I-REIT, respectively, from the Kshs 20.0 inception price. The volumes traded for the D-REIT and I-REIT came in at 13.5 mn and 43.3 mn shares, respectively. Additionally, ILAM Fahari I-REIT traded at Kshs 13.8 per share as of 17th July 2026, representing a 31.0% loss from the Kshs 20.0 inception price;
Digital Payments:
During the week, Kenya officially gazetted the Virtual Asset Service Providers (VASP) Regulations, 2026 (Legal Notice No. 134 of 2026), operationalizing the licensing framework under the VASP Act, 2025 across ten activity categories. The framework establishes joint oversight by the Central Bank of Kenya and the Capital Markets Authority while enforcing tiered capital rules, asset segregation, and strict AML/CTF controls. The move forces existing operators and new entrants to prepare licensing applications ahead of the November 4, 2026 compliance deadline;
During the week, Visa Inc. reported its fiscal third-quarter 2026 financial results, beating Wall Street expectations with diluted earnings per share (EPS) of USD 3.3 beating consensus estimates of USD 3.2, representing a 14.0% year-on-year increase to USD 3.3 in 2026 from USD 2.9 in 2025 alongside net revenue of USD 11.6 bn, representing a 14.0% year-on-year increase. Total net revenue reached USD 11.6 bn, reflecting a 14.0% year-on-year increase driven by record payment volumes and continued strength in cross-border spending;
During the week, Mastercard Incorporated reported its Q2’2026 financial results, surpassing expectations with adjusted diluted earnings per share (EPS) of USD 5.0 exceeding consensus estimates of USD 4.8, representing a 22.0% year-on-year increase to USD 5.0 in 2026 from USD 4.1 in 2025 alongside net revenue of USD 9.3 bn, representing a 14.0% year-on-year increase. The strong performance was supported by continued growth in cross-border volumes and expanding revenues from its Value-Added Services and Solutions segment;
During the week, PayPal Holdings, Inc. reported its Q2’2026 financial results. The company reported diluted earnings per share (EPS) of USD 1.4, beating consensus estimates of USD 1.3, representing a 7.0% year-on-year decrease to 1.4 in 2026 from 1.5 in 2025 while net revenue increased by 5.0% year-on-year to USD 8.7 bn. Net revenue reached USD 8.7 bn, supported by continued growth in Total Payment Volume (TPV), Venmo and Braintree;
The digital payment stocks we track (AXP, Visa, Mastercard, Circle, Block, and PayPal) are currently trading at an average P/E of 22.8x, implying that investors continue to price in resilient earnings growth and strong digital payment adoption, although elevated operating costs and higher client incentives across legacy card networks may moderate valuation expansion in the near term.
Investment Updates:
-
Weekly Rates: Cytonn Money Market Fund closed the week at a yield of 11.18% p.a. To invest, dial *809# or download the Cytonn App from Google Play store here or from the Appstore here;
-
We continue to offer Wealth Management Training every Tuesday, from 7:00 pm to 8:00 pm. The training aims to grow financial literacy among the general public. To register for any of our Wealth Management Trainings, click here. If interested in our Private Wealth Management Training for your employees or investment group, please get in touch with us through wmt@cytonn.com;
-
Cytonn Insurance Agency acts as an intermediary for those looking to secure their assets and loved ones’ future through insurance namely; Motor, Medical, Life, Property, WIBA, Credit and Fire and Burglary insurance covers. For assistance, get in touch with us through insuranceagency@cytonn.com;
-
Cytonn Asset Managers Limited (CAML) continues to offer pension products to meet the needs of both individual clients who want to save for their retirement during their working years and Institutional clients that want to contribute on behalf of their employees to help them build their retirement pot. To more about our pension schemes, kindly get in touch with us through pensions@cytonn.com;
Hospitality Updates:
-
We currently have promotions for Staycations. Visit cysuites.com/offers for details or email us at sales@cysuites.com;
Money Markets, T-Bills Primary Auction:
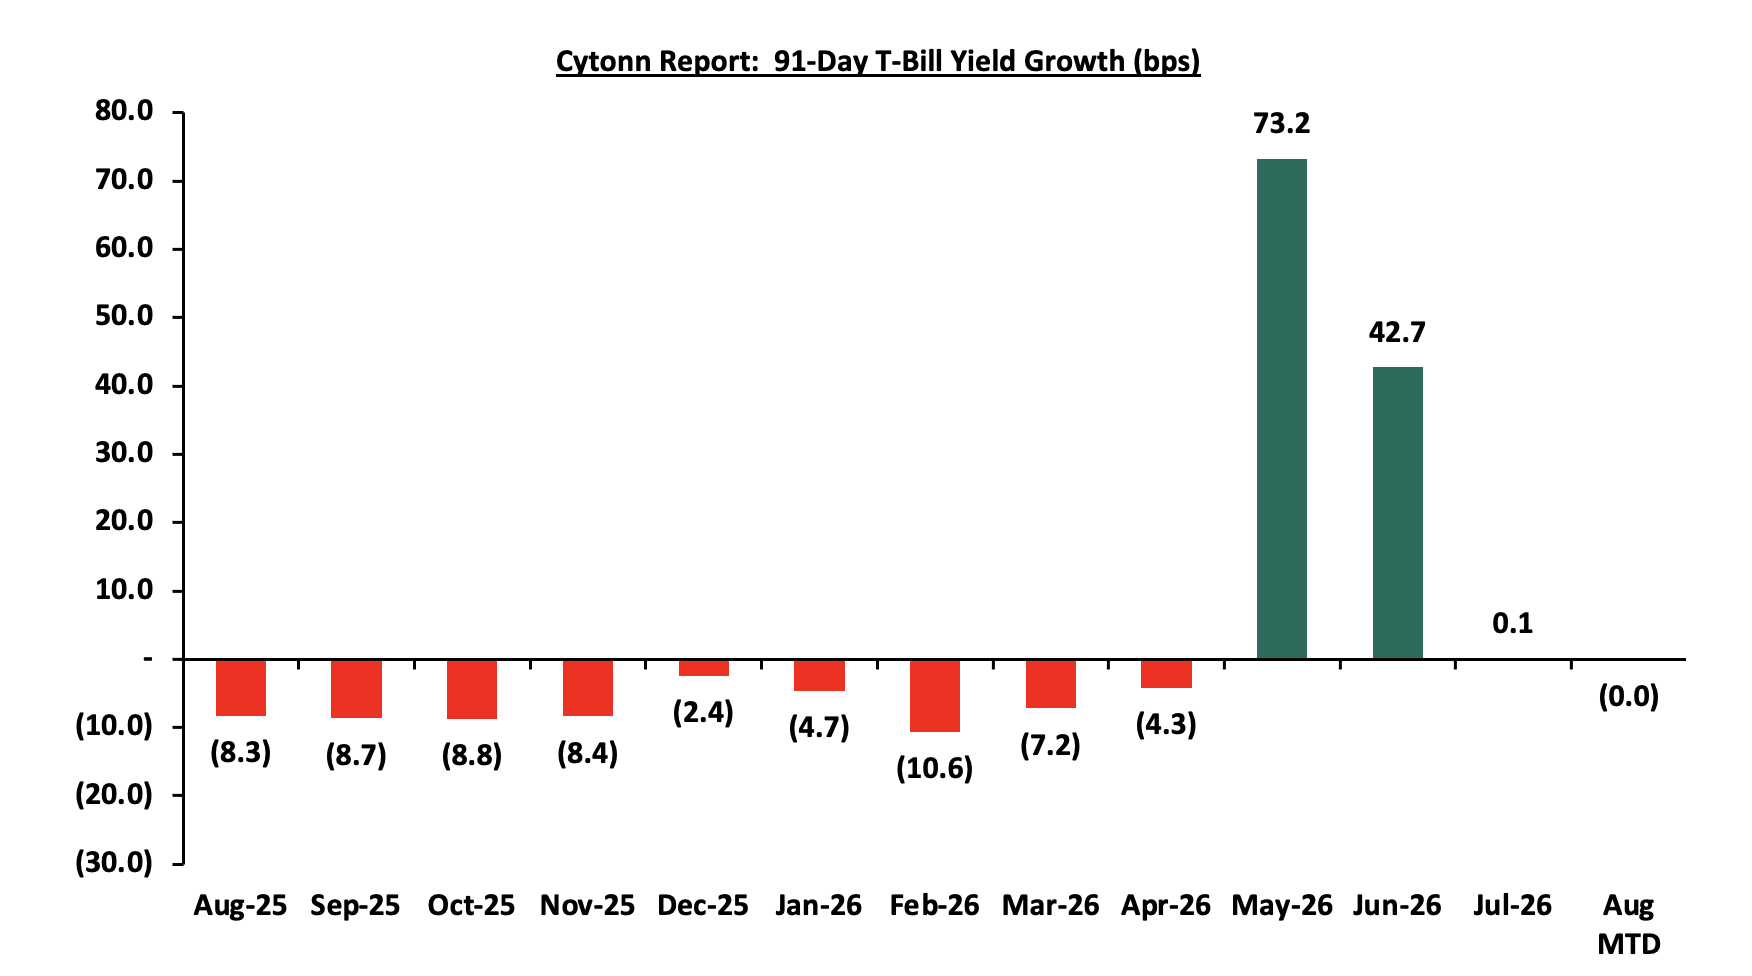
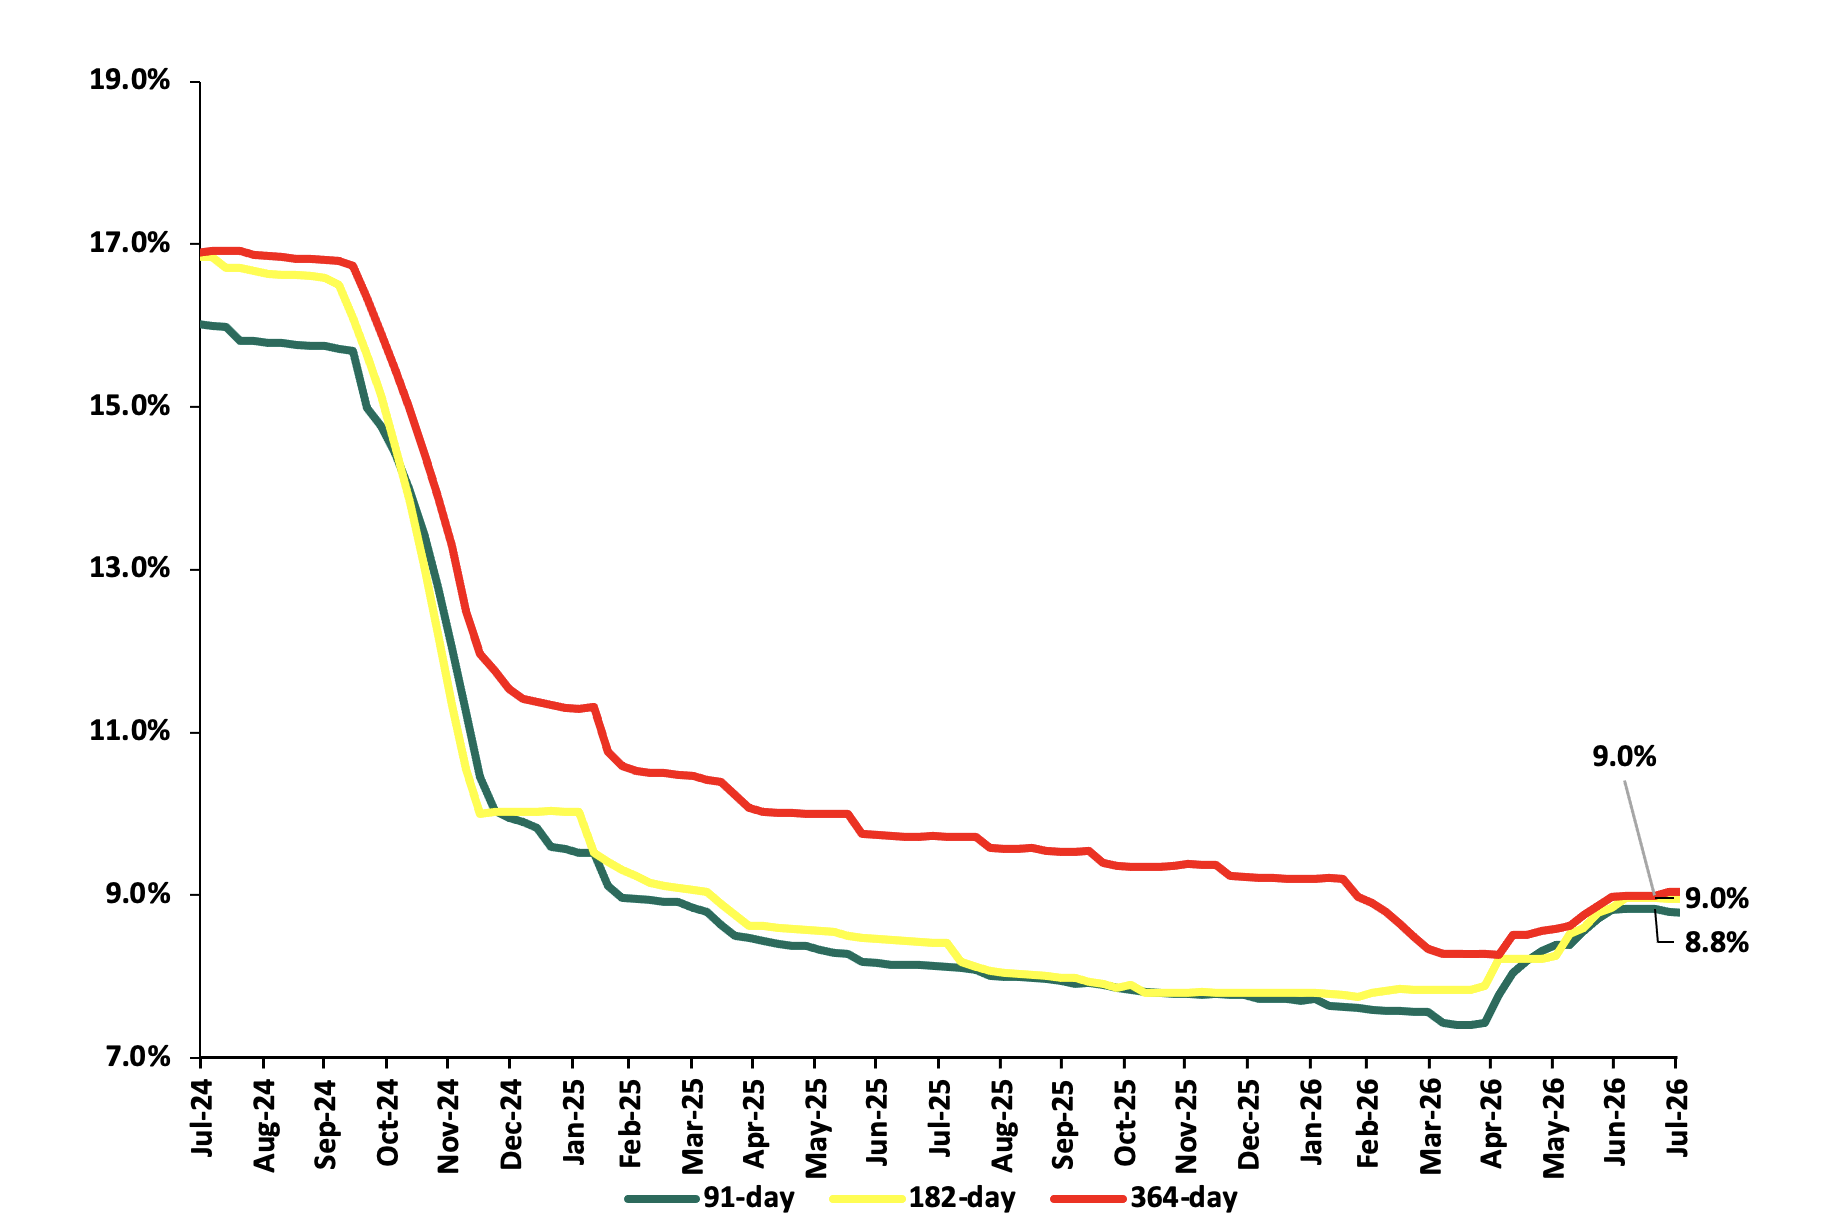
During the month of July 2026, T-bills were oversubscribed, with the overall average subscription rate coming in at 154.7%, lower than the subscription rate of 156.3%, recorded in June 2026. The overall average subscription rates for the 182-day paper increased to 95.2% from 34.9% in June 2026, while that for 91-day, and 364-day papers decreased to 413.9%, and 56.3% from 698.0%, and 61.1% recorded in June 2026 respectively. The average yields on the government paper were on an upward trajectory during the month, with the average yield for 182-day, 364-day and 91-day papers increasing by 36.5 bps, 17.0 bps and 15.0 bps respectively to 9.0%, 9.0% and 8.8% from the 8.6%, 8.8% and 8.7% recorded the previous month respectively. For the month of July, the government accepted a total of Kshs 115.1 bn of the Kshs 167.4 bn worth of bids received in T-Bills, translating to an acceptance rate of 69.3%, compared to an acceptance rate of 83.7% in the month of June 2026. The chart below shows the yield growth rate for the 91-day paper for the past one year:
During the week, T-bills were undersubscribed for the first time in nine weeks, with the overall subscription rate coming in at 97.7% lower than the subscription rate of 137.5%, recorded the previous week. Investors’ preference for the shorter 91-day paper persisted, with the paper receiving bids worth Kshs 14.4 bn against the offered Kshs 8.0 bn, translating to a subscription rate of 180.0%, lower than the the subscription rate of 275.7%, recorded the previous week. The subscription rate for the 364-day paper decreased marginally to 47.9% from 48.8% recorded the previous week, while that of the 182-day paper decreased significantly to 81.7% from 115.6% recorded the previous week. The government accepted a total of Kshs 27.3 bn worth of bids out of Kshs 27.4 bn bids received, translating to an acceptance rate of 99.7%. The yields on the government papers recorded a mixed performance with the yields on the 91-day paper increasing by 0.6 bps to 8.79% from 8.78% recorded the previous week. The yields on the 182-day papers remained unchanged from 8.95% recorded the previous week. While, the yields on the 364-day papers decreased the most by 1.9 bps to 9.02% from the 9.04% recorded the previous week.
The charts below show the performance of the 91-day, 182-day and 364-day papers from June 2024 to June 2026:
So far in the current FY’2026/27, government securities totaling Kshs 246.0 bn have been advertised. The government has accepted bids worth Kshs 276.3 bn, of which Kshs 142.4 bn and Kshs 133.9 bn were treasury bills and bonds, respectively. Total redemptions so far in FY’2026/27 equal to Kshs 117.6 bn, with treasury bills accounting for the entire amount. As a result, the government has a domestic borrowing surplus of Kshs 158.7 bn in FY’2026/27.
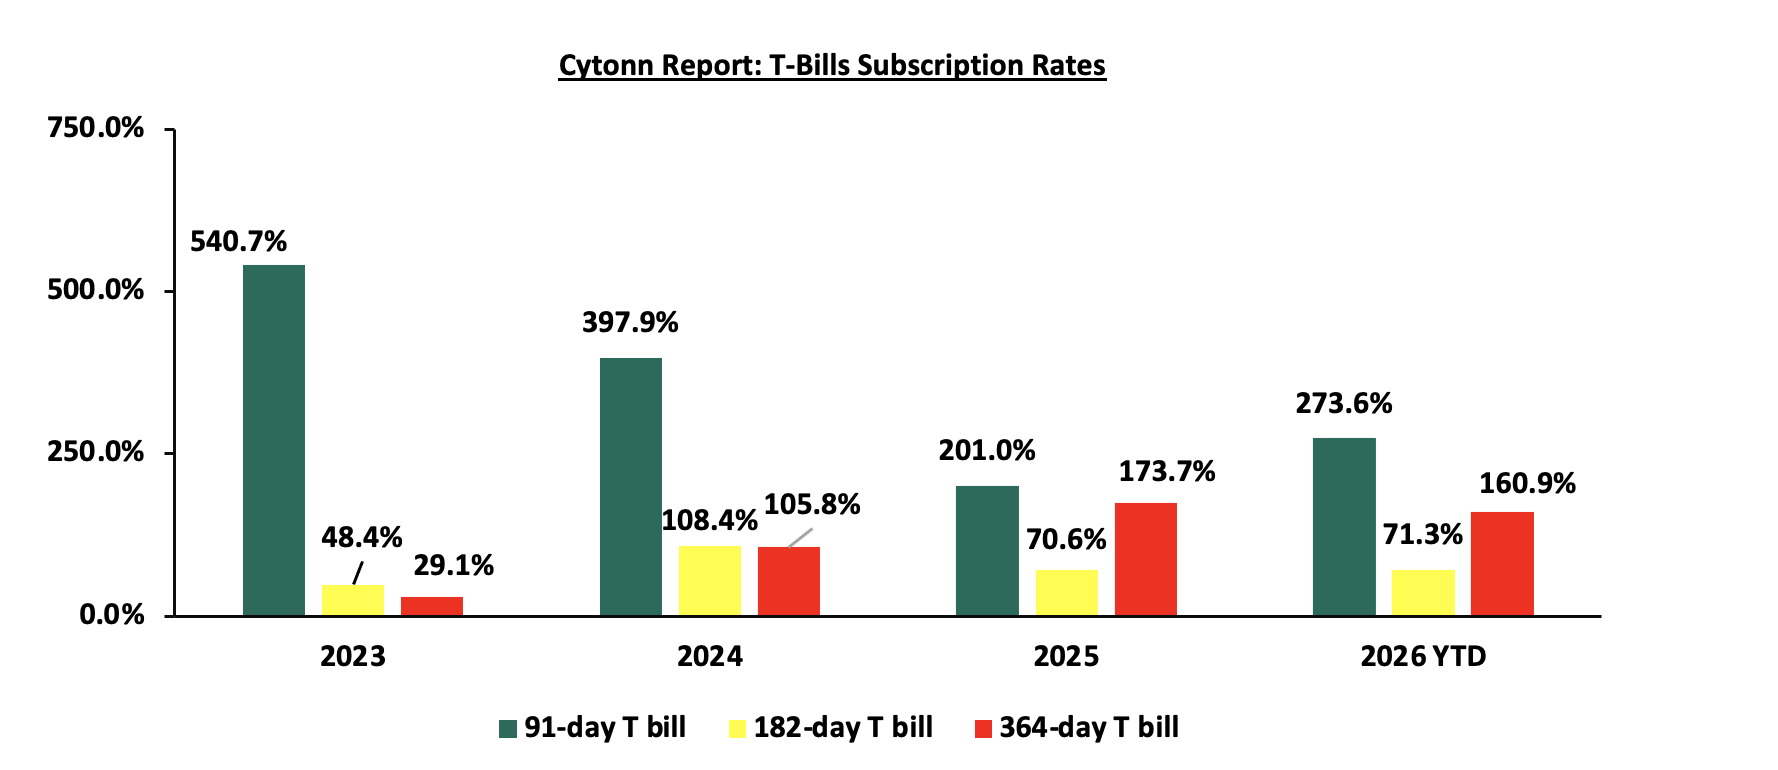
The chart below compares the overall average T-bill subscription rates obtained in 2023,2024, 2025 and 2026 Year-to-date (YTD):
T-bonds Primary Market
Additionally, July 2026 bonds were oversubscribed, with the overall average subscription rate coming in at 209.5%, higher than the average subscription rate of 34.4%, recorded in June 2026. The reopened bonds FXD1/2019/020, FXD1/2022/025, FXD1/2022/010, FXD1/2021/020 and FXD1/2026/030 with tenors to maturity of 12.8 years, 21.4 years, 5.8 years, 15.2 years and 29.2 years respectively and fixed coupon rates of 12.9%, 14.2%, 13.5%, 13.4% and 12.5% respectively, received bids worth Kshs 230.4 bn against the offered Kshs 110.0 bn translating to an oversubscription rate of 209.5%. The government accepted bids worth Kshs 133.9 bn, translating to an acceptance rate of 58.1%. The weighted average yield for the accepted bids for the FXD1/2019/020, FXD1/2022/025, FXD1/2022/010, FXD1/2021/020 and FXD1/2026/030 came in at 13.9%, 14.4%, 12.8%, 14.3% and 14.6% respectively. The table below provides more details on the bonds issued in June 2026 and July 2026:
|
Cytonn Report: Bond Issuances for June 2026-July 2026 |
|||||||||
|
Issue Date |
Bond Auctioned |
Effective Tenor to Maturity (Years) |
Coupon |
Amount offered (Kshs bn) |
Actual Amount Raised/Accepted (Kshs bn) |
Total bids received (Subscription) |
Average Accepted Yield |
Subscription Rate |
Acceptance Rate |
|
22-Jul |
FXD1/2019/020 - Reopened |
12.8 |
12.9% |
40.00 |
12.2 |
24.0 |
13.9% |
59.9% |
51.1% |
|
FXD1/2022/025-Reopened |
21.4 |
14.2% |
51.0 |
62.0 |
14.4% |
154.9% |
82.4% |
||
|
15-Jul |
FXD1/2012/020-Switch |
6.3 |
12.0% |
10.00 |
8.0 |
8.2 |
12.8% |
81.6% |
97.5% |
|
08-Jul |
FXD1/2022/010-Reopened |
5.8 |
13.5% |
70.00 |
51.0 |
104.0 |
12.8% |
148.5% |
49.1% |
|
FXD1/2021/020-Reopened |
15.2 |
13.4% |
13.5 |
20.9 |
14.3% |
29.8% |
64.9% |
||
|
FXD1/2026/030-Reopened |
29.2 |
12.5% |
6.0 |
19.7 |
14.6% |
28.1% |
30.7% |
||
|
17-Jun |
FXD1/2018/020- Reopened |
11.8 |
13.2% |
60.00 |
19.6 |
22.7 |
14.0% |
129.4% |
86.3% |
|
FXD1/2021/025-Reopened |
20.0 |
13.9% |
23.0 |
54.9 |
14.9% |
41.9% |
|||
|
08-Jun |
FXD1/2020/015-Reopened |
8.7 |
12.8% |
40.00 |
20.2 |
20.2 |
13.3% |
86.0% |
99.99% |
|
FXD1/2018/025-Reopened |
17.1 |
13.4% |
14.2 |
14.2 |
14.2% |
100.0% |
|||
|
July 2026 Average
|
16.9 |
13.3% |
110.0 |
133.9 |
230.4 |
14.0% |
209.5% |
58.1% |
|
|
June 2026 Average
|
12.9 |
13.1% |
100.0 |
34.4 |
34.4 |
13.8% |
34.4% |
100.0% |
|
|
2026 Average |
15.1 |
13.1% |
570.0 |
335.6 |
501.4 |
13.5% |
88.0% |
66.9% |
|
Also, during the month, the government conducted a bond switch auction, involving a switch from FXD1/2021/005 to FXD1/2012/020 which was undersubscribed, receiving bids worth Kshs 8.2 bn against the offered 10.0 bn, translating to subscription rate of 81.6% having an average acceptance yield of 12.8% and a coupon rate of 12.0%. The government accepted bids worth Kshs 8.0 bn, translating to an acceptance rate of 97.5%
In the primary bond market, the government announced the re-opening of three Infrastructure Bonds, IFB1/2019/016, IFB1/2021/018 and IFB1/2021/021, seeking to raise Kshs 150.0 bn to finance infrastructure projects. The bonds have fixed coupon rates of 11.75%, 12.67%, and 12.73%, with remaining tenors to maturity of 9.3 years, 12.7 years, and 16.2 years, respectively. The offer period opened on 30th July 2026 and will close on 12th August 2026. Our bidding ranges for IFB1/2019/016, IFB1/2021/018, and IFB1/2021/021 are 12.50% - 13.00%, 12.75% - 13.25%, and 13.00% - 13.50%, respectively.
Additionally, the government announced a switch auction with an amount on offer of Kshs 15.0 bn, allowing holders of FXD1/2012/15 and Treasury Bills 2685/091, 2646/182, and 2574/364 to switch their holdings into FXD4/2019/010 as part of its debt liability management strategy. The destination bond, FXD4/2019/010, has a fixed coupon rate of 12.28% and a remaining tenor to maturity of 3.23 years. The offer period opened on 30th July 2026 and will close on 24th August 2026. Our recommended bidding range for FXD4/2019/010 is 11.75% -12.25%, based on our fair value assessment using the current government securities yield curve, secondary market pricing of comparable bonds, and prevailing liquidity conditions in the fixed-income market.
Secondary Bond Market:
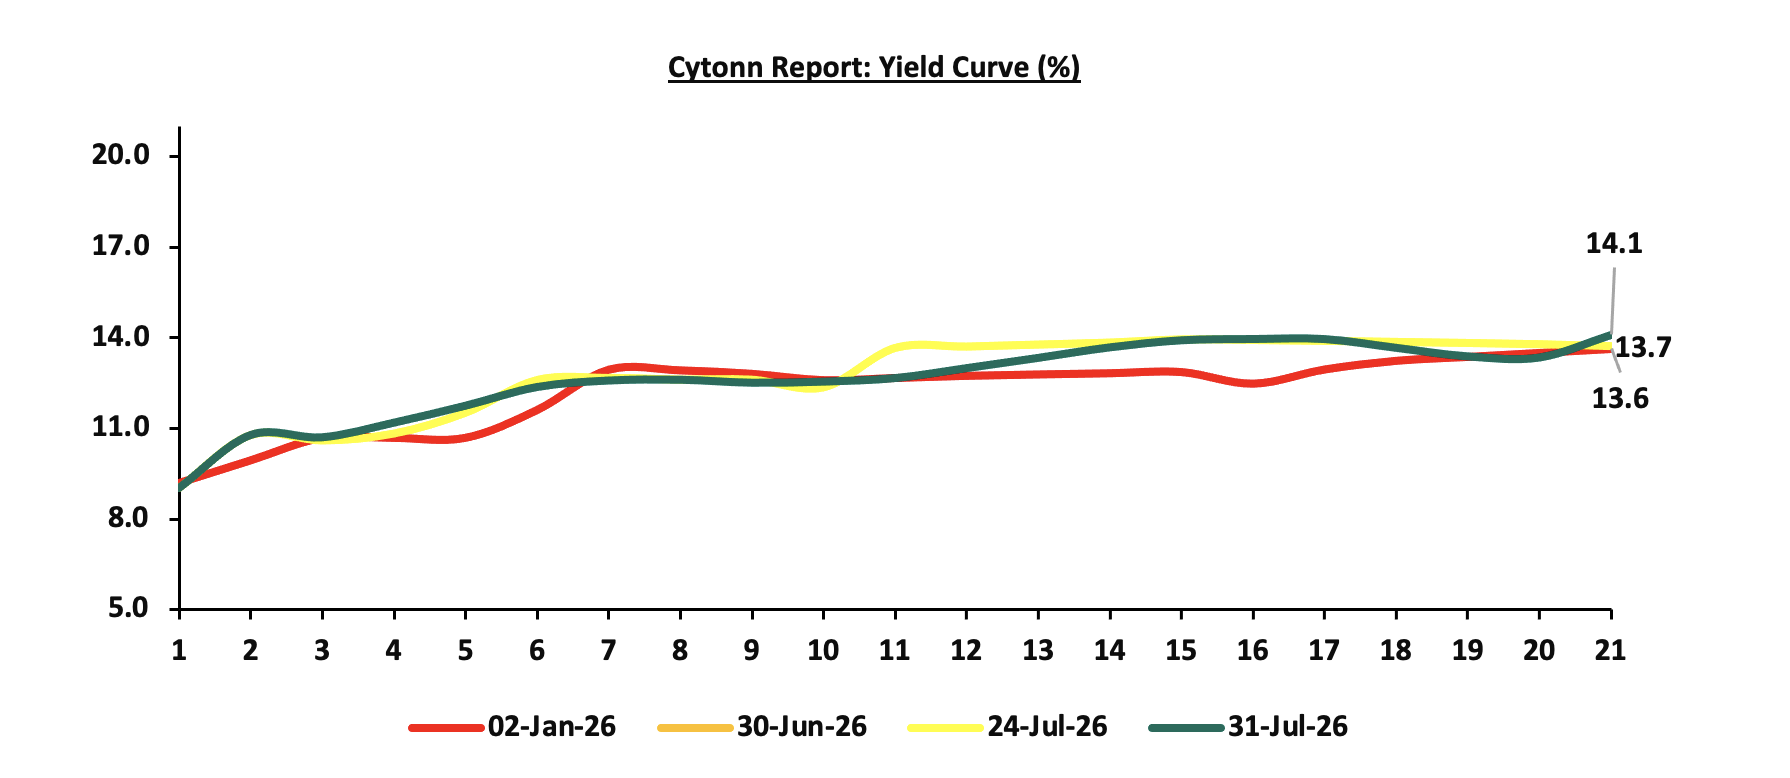
The yields on the government securities recorded a mixed performance during the month of July similar to June. This is attributable to a divergence between short-term monetary policy anchoring and rising medium to long-term risk premium. The Central Bank of Kenya’s decision to maintain the policy rate at 8.75% helped stabilize short-term rates by anchoring expectations on the near-term cost of funds, limiting significant movements in Treasury bill yields. However, upward pressure on inflation driven by elevated global fuel prices linked to the Middle East conflict, eroded real returns and heightened uncertainty around the inflation outlook. This led investors to demand higher compensation on longer-dated securities, pushing yields upward at the belly and long end of the curve. At the same time, intermittent liquidity conditions and selective demand for specific maturities created pockets of downward movement in some tenors, ultimately resulting in a mixed yield curve performance for the month. The chart below shows the yield curve movement during the period:
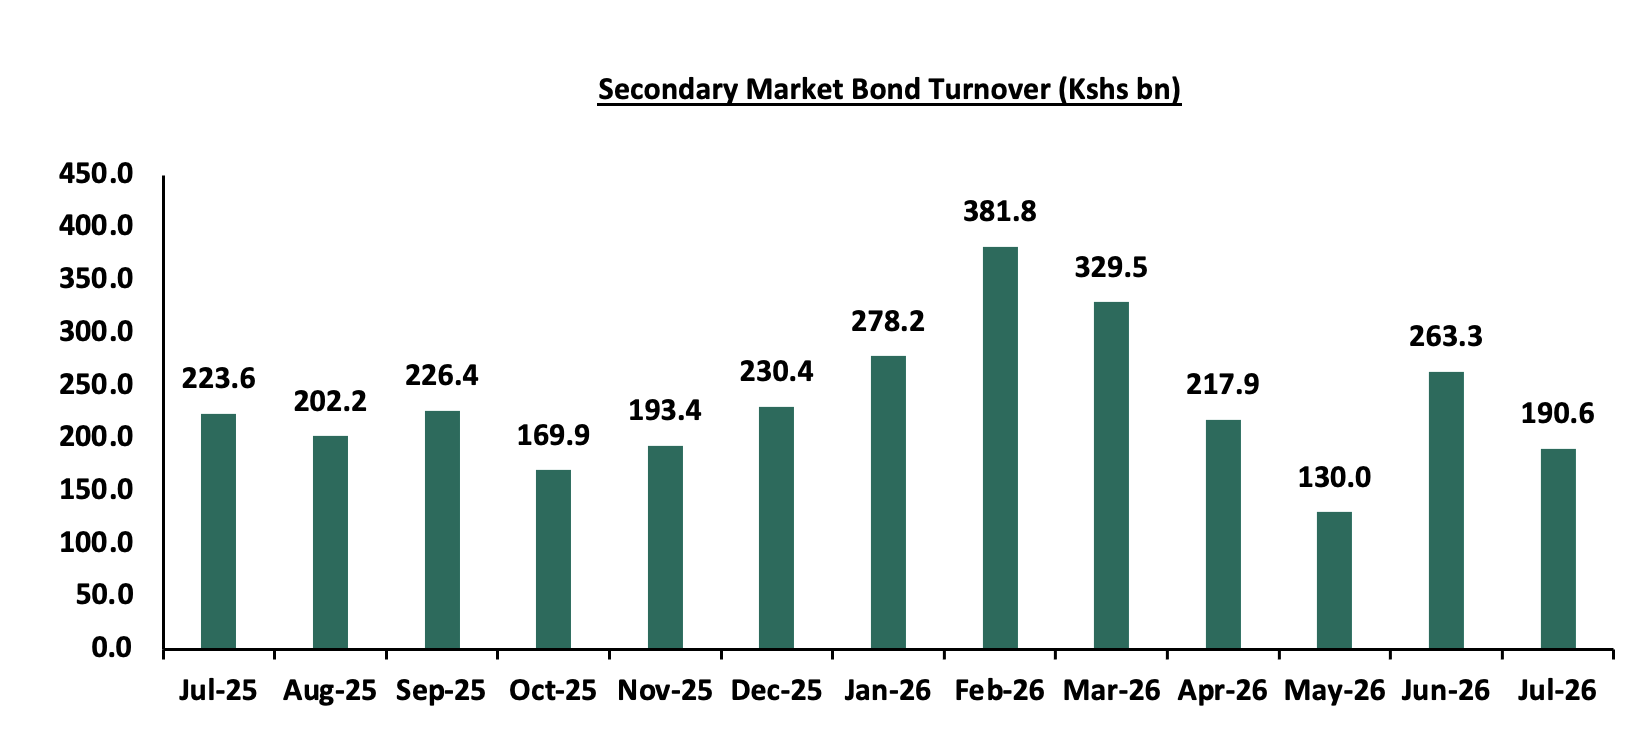
The secondary bond turnover decreased by 27.6% to Kshs 190.6 bn, from Kshs 263.3 bn recorded in June 2026, pointing towards decreased activities by commercial banks in the secondary bonds market for the month of July driven by tighter liquidity during the month hence banks preferring to hold on to cash. On a year-on-year basis, the bond turnover decreased by 14.7% from Kshs 223.6 bn worth of treasury bonds transacted over a similar period last year. The chart below shows the bond turnover over the past 12 months.
Money Market Performance:
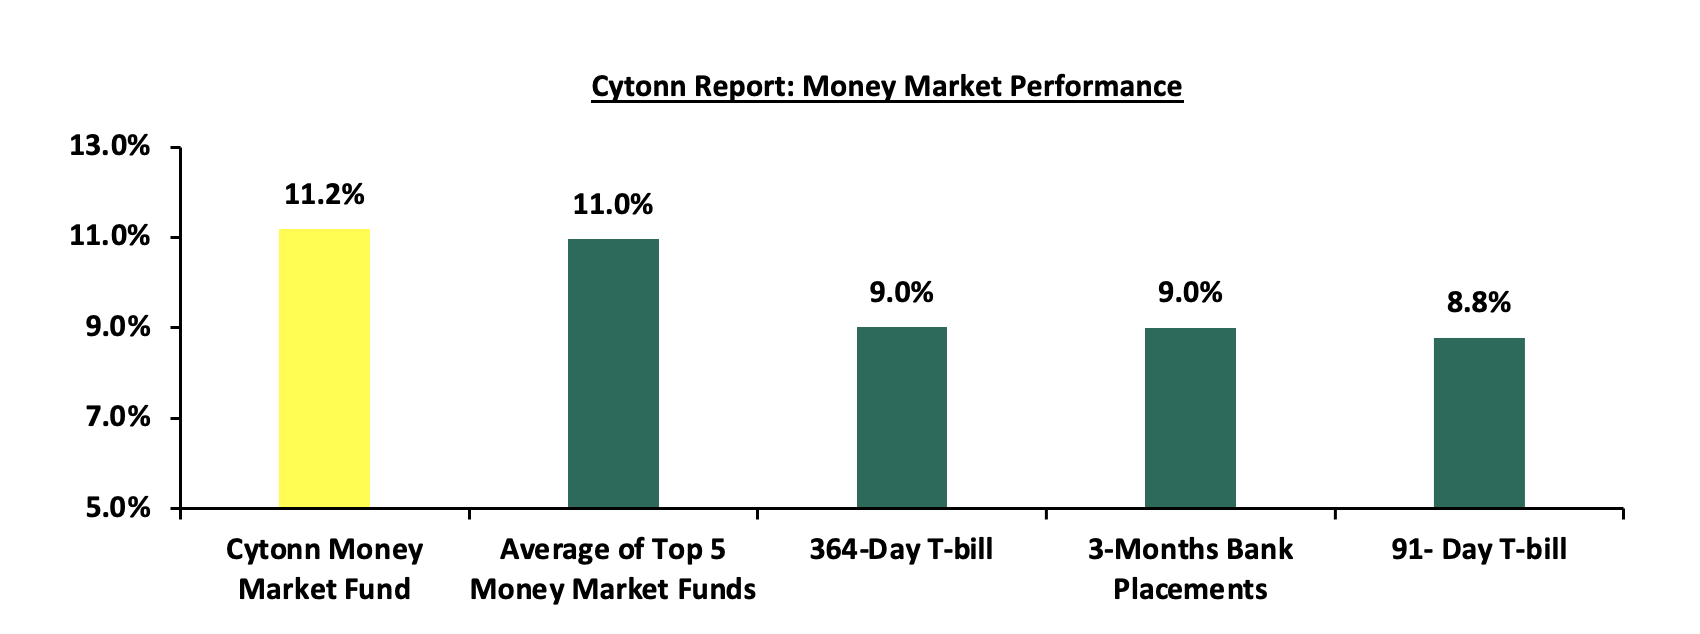
In the money markets, 3-month bank placements ended the week at 9.0% (based on what we have been offered by various banks). The yields on the 364-day paper decreased by 1.9 bps to 9.02% from the 9.04% recorded the previous week, while the 91-day paper increased by 0.6 bps to 8.79% from 8.78% recorded the previous week and the yield on the Cytonn Money Market Fund decreased by 17.0 bps to 11.2% from the 11.4% recorded the previous week, while the average yields on the Top 5 Money Market Funds increased by 1.2 bps to 11.0% from 10.9% recorded in the previous week.
The table below shows the Money Market Fund Yields for Kenyan Fund Managers as published on 31st July 2026:
Source: Business Daily
Liquidity:
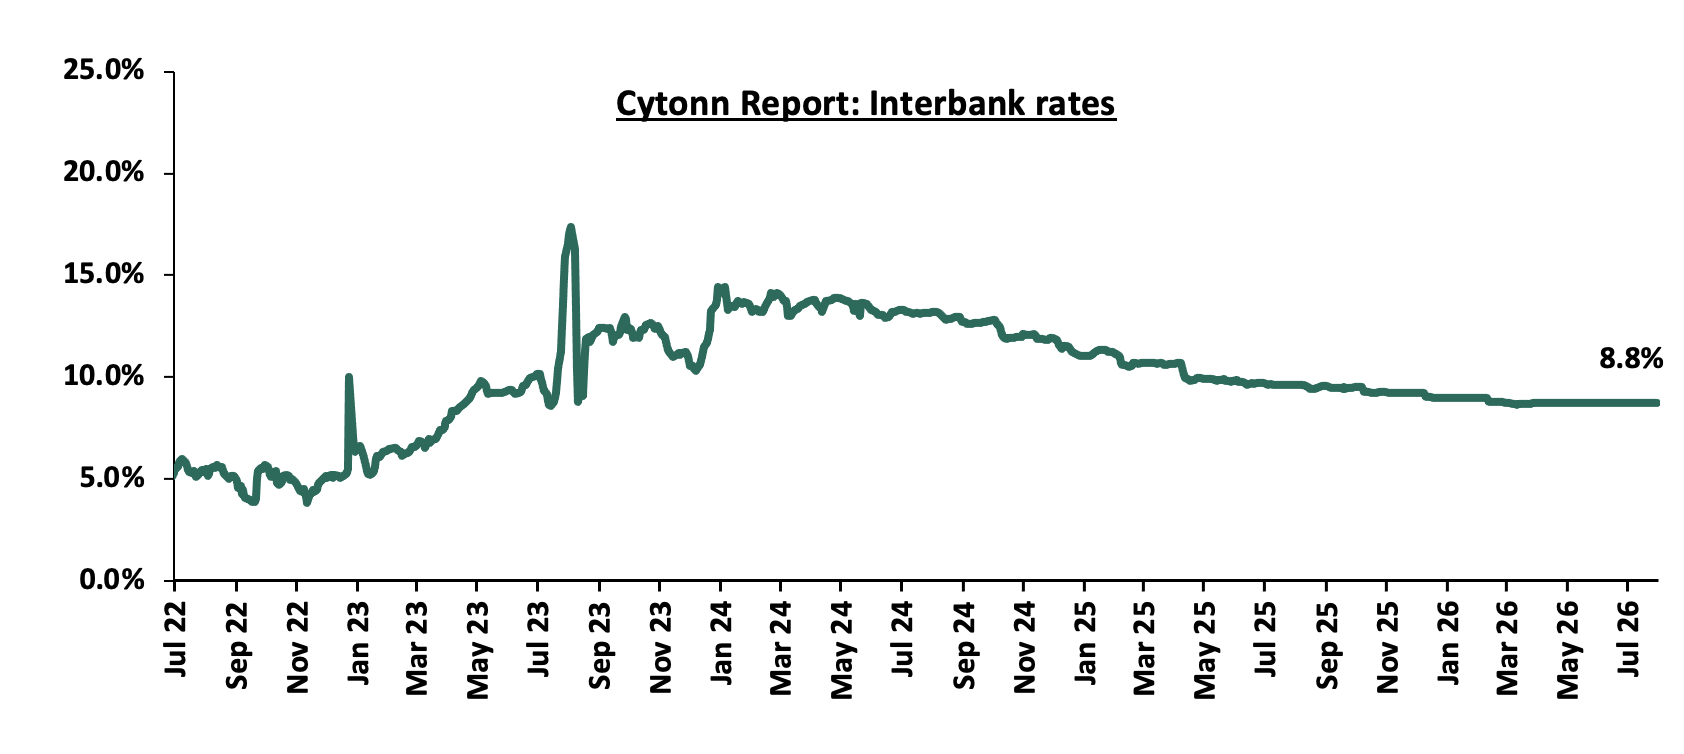
Liquidity in the money markets tightened in the month of July 2026, with the average interbank rate increasing marginally to remain relatively unchanged from 8.8% recorded the previous month. The average interbank volumes traded decreased by 39.6% to Kshs 6.6 bn, from Kshs 10.9 bn recorded in June 2026. Additionally, during the week, liquidity in the money markets tightened, with the average interbank rate increasing by 0.01 bps, to remain relatively unchanged from the 8.8% recorded the previous week, partly attributable to government payments that offset tax remittances. The average interbank volumes traded increased by 227.0% to Kshs 12.0 bn from Kshs 3.7 bn recorded the previous week. The chart below shows the interbank rates in the market over the years:
Kenya Eurobonds:
During the month, the yields on the Eurobonds were on an upward trajectory, with the yield on the 7-year Eurobond issued in 2024 increasing the most by 76.7 bps to 7.8% from 7.0% recorded at the end of June 2026. Also, during the week, the yields on the Eurobonds recorded a mixed performance with the yield on the 30-year Eurobond issued in 2018 increasing the most by 0.9 bps remain relatively unchanged from 9.1% recorded the previous week, while the yield on the 12-year Eurobond issued in 2019 decreasing the most by 6.6 bps remain to 8.0% from 8.1% recorded the previous week. The table below shows the summary performance of the Kenyan Eurobonds as of 30th July 2026:
|
|
2018 |
2019 |
2021 |
2024 |
||
|
Tenor |
10-year issue |
30-year issue |
12-year issue |
13-year issue |
7-year issue |
|
|
Amount Issued (USD) |
1.0 bn |
1.0 bn |
1.2 bn |
1.0 bn |
1.5 bn |
|
|
Years to Maturity |
2.5 |
22.5 |
6.7 |
8.8 |
5.5 |
|
|
Yields at Issue |
7.3% |
8.3% |
7.9% |
6.2% |
10.4% |
|
|
02-Jan-26 |
6.1% |
8.8% |
7.2% |
7.8% |
7.1% |
|
|
30-Jun-26 |
6.7% |
8.7% |
7.4% |
7.9% |
7.0% |
|
|
23-Jul-26 |
7.1% |
9.1% |
8.1% |
8.6% |
7.8% |
|
|
24-Jul-26 |
7.2% |
9.1% |
8.1% |
8.6% |
7.8% |
|
|
27-Jul-26 |
7.1% |
9.0% |
8.0% |
8.5% |
7.7% |
|
|
28-Jul-26 |
7.0% |
9.0% |
8.0% |
8.5% |
7.7% |
|
|
29-Jul-26 |
7.0% |
9.0% |
8.0% |
8.5% |
7.7% |
|
|
30-Jul-26 |
7.0% |
9.1% |
8.0% |
8.6% |
7.8% |
|
|
Weekly Change |
(0.0%) |
0.0% |
(0.1%) |
0.0% |
(0.1%) |
|
|
MTD Change |
0.4% |
0.4% |
0.7% |
0.7% |
0.8% |
|
|
YTD Change |
1.0% |
0.2% |
0.9% |
0.8% |
0.7% |
|
Source: Central Bank of Kenya (CBK) and National Treasury
Kenya Shilling:
During the month, the Kenya Shilling appreciated by 7.0 bps against the US Dollar, to Kshs 129.4 from the Kshs 129.5 recorded at the end of June. Also, during the week, the Kenya Shilling appreciated by 10.0 bps against the US Dollar, to Kshs 129.4 from the Kshs 129.5 recorded the previous week. On a year-to-date basis, the shilling has depreciated by 27.1 bps against the dollar, as compared to the 22.9 bps appreciation recorded in 2025.
We expect the shilling to be supported by:
-
Diaspora remittances standing at a cumulative USD 4,960.4 mn in the twelve months to June 2026, slightly lower than the USD 5,084.1 mn recorded over the same period in 2025. These have continued to cushion the shilling against further depreciation. In the June 2026 diaspora remittances figures, North America remained the largest source of remittances to Kenya accounting for 50.8% in the period,
-
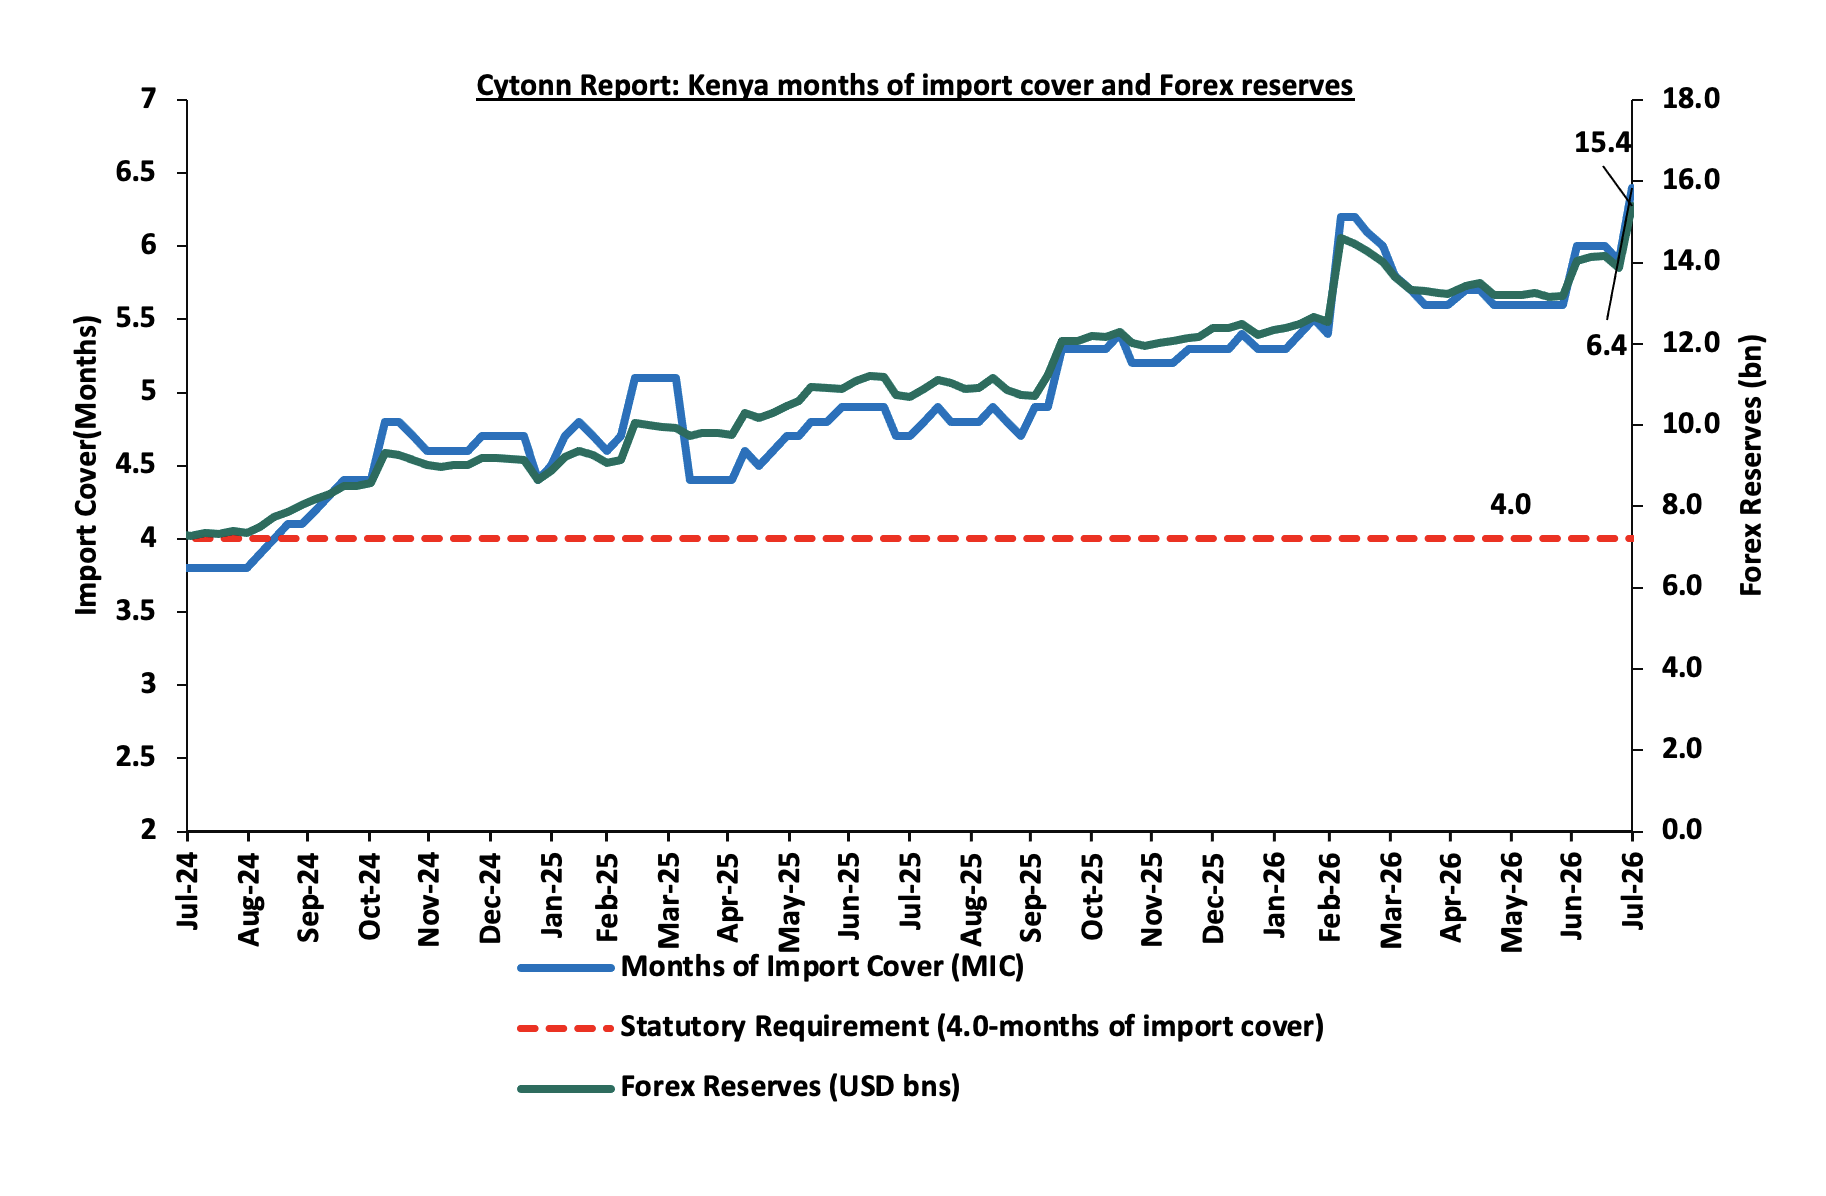
Improved forex reserves currently at USD 15.4 bn (equivalent to 6.4-months of import cover), which is above the statutory requirement of maintaining at least 4.0-months of import cover and above the EAC region’s convergence criteria of 4.5-months of import cover.
The shilling is however expected to remain under pressure in 2026 as a result of:
-
An ever-present current account deficit which is estimated at 2.6% of GDP in the 12 months to April 2026 compared to 1.7 percent of GDP in a similar period in 2025 and,
-
The need for government debt servicing, continues to put pressure on forex reserves given that 53.0% of Kenya’s external debt is US Dollar-denominated as of December 2025
-
Rising geopolitical tensions in the Middle East, which could exert pressure on the shilling through higher global oil prices and increased uncertainty in international markets. Given that Kenya is a net importer of petroleum products, any sustained increase in oil prices would widen the import bill, increase demand for US Dollars, and consequently put depreciation pressure on the shilling
Kenya’s forex reserves increased by 11.2% during the week to USD 15.4 bn from USD 13.9 bn recorded the previous week, equivalent to 6.4 months of import cover, and above the statutory requirement maintaining at least 4.0-months of import cover.
Weekly Highlights
-
July 2026 Inflation Highlight
The year-on-year inflation in July 2026 increased by 0.1% points to 6.5% from the 6.4% recorded in June 2026. The price increase was primarily driven by a rise in prices of items in the Food and Non-alcoholic Beverages at 9.0%; Transport 15.6%; and Housing, Water, Electricity, Gas and other fuels at 3.2%; over the one-year period. The month-on-month inflation rate stood at 0.2% in July 2026. The table below summarizes the performance of commodity indices both on a year-on-year and month-on-month basis:
In July 2026, overall inflation increased by 0.1% points to 6.5% from the 6.4% recorded in June 2026 on a y/y basis, signaling a sharp uptick in price pressures across major categories, but still remained within the Central Bank of Kenya’s preferred range of 2.5%-7.5%, for the thirty seventh consecutive month. Notably, the maximum allowed prices for Super Petrol, Diesel and Kerosene remain unchanged at Kshs 214.0, Kshs 222.9 and Kshs 191.4 recorded in June 2026 respectively. Electricity costs increases with 50kWh and 200 kWh increasing by 3.5% and 3.1% respectively. Additionally, the Monetary Policy Committee (MPC) of the Central Bank of Kenya (CBK) maintained the Central Bank Rate (CBR) at 8.75% for a second consecutive meeting on 9th June 2026, reflecting a cautious, data-dependent approach aimed at anchoring inflation expectations, preserving exchange rate stability, amid persistent geopolitical uncertainty stemming from the Middle East conflict. The chart below shows the inflation rates for the past 5 years:
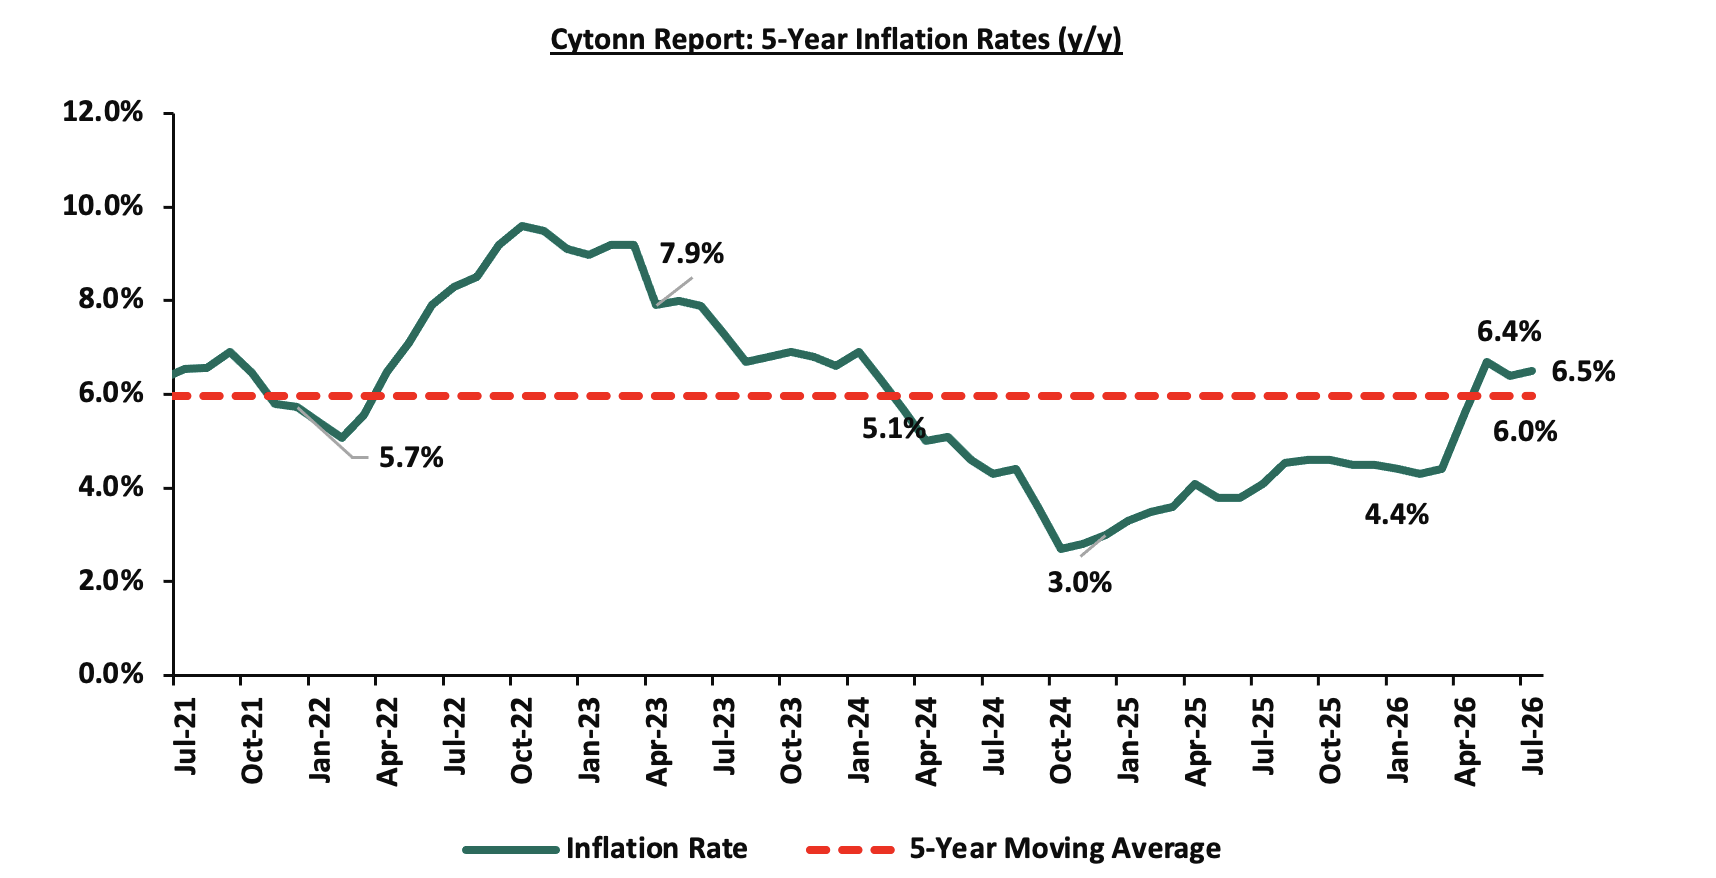
Going forward, we expect Kenya's inflation to remain above the midpoint of the CBK's target range of 2.5%–7.5%, in the short to medium term driven by persistent food price volatility due to weather-related supply disruptions, elevated fuel and electricity costs, fluctuations in global commodity prices, and exchange rate pass-through effects that increase the cost of imported goods and production inputs, majorly as a result of the Middle East War. Geopolitical tensions continue to trigger higher global oil prices exerting upward pressure on domestic fuel, transport, and production costs Nevertheless, we expect the CBK's prudent monetary policy stance and relative exchange rate stability to help anchor inflation expectations and keep inflation within the target range over the medium term.
-
Highlight of the August 2026 Monetary Policy Committee (MPC) Meeting Note
We expect the MPC to maintain the Central Bank Rate (CBR) at 8.75%, with their decision mainly being supported by;
-
Global monetary policy stance: The latest meetings confirm that most major economies have opted to hold rates steady .US Federal Reserve maintained the federal funds rate at 3.5%-3.75% in June, citing that monetary policy cannot directly offset oil price shocks but must ensure inflation expectations remain anchored. The European Central Bank raised its deposit rate by 25 bps, due to inflationary pressures linked to higher energy prices. The Bank of England maintained its Bank Rate at 3.75%, noting inflation had eased down to 2.8%. Other central banks such as the Bank of Japan and Swiss National Bank also adopted steady or conditional easing stances. This collective posture underscores that global policy remains cautious, prioritizing stability over aggressive moves, and provides the MPC with room to hold the CBR at 8.75% without risking policy divergence.
-
The need to support the economy: Private sector indicators point to the need for a supportive monetary stance. The Stanbic Bank PMI increased to 50.0 in June 2026, from 46.6 in May 2026, marking the first expansion in four months since March 2026 . This is attributable to increase in sales which boosted sentiment and led to higher backlogs, fresh job creation and restocking efforts. Furthermore, it was supported by a pickup in new order inflows, as firms reported a revival in customer demand, aided by referrals, marketing efforts, and business development initiatives. However, business activity remained under pressure, with output still subdued as firms continued to face thin client numbers, supplier capacity constraints, and tighter cash flow conditions. Input costs also remained elevated, with rising fuel levies and other cost pressures pushing total input cost inflation higher. At the same time, private sector credit growth improved to 9.3% in May 2026 from 7.1% recorded in April 2026, indicating a significant recovery in financing activity. However, lending rates remain high at around 14.6% as at June 2026 leaving borrowers sensitive to additional increases. A rate hike could undermine this recovery. Maintaining the policy rate at 8.75% therefore offers the most balanced approach. It supports credit growth and business confidence while allowing the CBK to monitor external risks, particularly energy-driven inflation and exchange rate pressures, without adding strain to an already fragile economy.
-
The continued stability of the Shilling against major currencies: The Kenyan Shilling has remained relatively stable in recent months, supported by foreign exchange reserves at USD 15.4 bn equivalent to 6.4 months of import cover, comfortably above the statutory minimum of 4.0 months. This stability has provided the MPC with flexibility to maintain the current rate without risking volatility or capital outflows. However, if the shilling were to depreciate further, the import bill would widen significantly given that Kenya’s fuel and most essential imports are dollar denominated. A weaker shilling would therefore amplify inflationary pressures, erode household purchasing power, and strain the current account further widening the import bill. The de-escalation of tensions in the Middle East has eased pressure on global oil prices, reducing the likelihood of supply chain disruptions and helping to contain imported inflation. Maintaining the CBR at 8.75% helps anchor investor confidence, preserve currency stability, and mitigate the risk of sharp depreciation. This stance ensures that external buffers remain intact while shielding the economy from the inflationary pass through of a weaker shilling
For a more detailed analysis, please see our Cytonn August 2026 MPC Note
Notable Monthly Highlights:
-
The Energy and Petroleum Regulatory Authority (EPRA) released their monthly statement on the maximum retail fuel prices in Kenya, effective from 15th July 2026 to 14th August 2026. For more information, please see our Cytonn Weekly #28/2026
-
During the week, The National Treasury gazetted the revenue and net expenditures for the twelfth month of FY’2025/2026, ending 30th June 2026, highlighting that the total revenue collected as at the end of June 2026 amounted to Kshs 2,607.3 bn. For more information, please see our Cytonn Weekly #28/2026
-
Stanbic Bank released its monthly Purchasing Manager’s Index (PMI) indicating that Kenya’s Purchasing Managers’ Index (PMI) rose by 3.4 points to the neutral mark of 50.0 in June 2026 from 46.6 in May 2026, ending three consecutive months of contraction in private sector activity. For more information, please see our Cytonn Weekly #27/2026
-
During the month, Kenya National Bureau of Statistics (KNBS) released the Q1’2026 Quarterly Gross Domestic Product Report, highlighting that the Kenyan economy recorded a 5.3% growth in FY’2025, higher than the 4.9% growth recorded in Q1’2026. For more information, please see our Cytonn Weekly #27/2026
-
During the month, Kenya National Bureau of Statistics (KNBS) released Q1’2026 Quarterly Balance of Payments Report, highlighting that Kenya’s balance of payments position deteriorated by 128.6% in Q1’2026, to a deficit of Kshs 176.0 bn, from a deficit of Kshs 77.0 bn in Q1’2025 and the current account deficit widened by 72.7% to Kshs 120.9 bn in Q1’2026 from the Kshs 70.0 bn deficit recorded in Q1’2025. For more information, please see our Cytonn Weekly #27/2026
-
During the month, the President assented to law the Sovereign Wealth Fund Bill, 2026, following its passage by the National Assembly with amendments on 2nd July 2026, giving Kenya a legal vehicle to save part of its oil, mineral and privatization earnings and shield them from political misuse and debt repayment. For more information, please see our Cytonn Weekly #27/2026
Rates in the fixed income market have been on an upward trend, reversing the sharp declines seen through the CBK's easing cycle. The shift has been driven by the CBK's decision to pause its rate-cutting cycle, alongside a resurgence in inflation. The government is 169.9% ahead of its prorated net domestic borrowing target of Kshs 93.4 bn, having a net borrowing position of Kshs 158.7 bn (inclusive of T-bills). We expect investors to maintain a preference for short to medium-term papers as they monitor the pace of government issuance and the path of inflation before committing further out on the curve, with the yield curve likely to remain under upward pressure rather than stabilize, at least until the inflation trajectory becomes clearer.
Market Performance:
During the month of July, the equities market was on an upward trajectory, with NSE 20, NASI, NSE 25 and NSE 10 gaining by 9.0%, 6.1%, 5.8% and 5.8% respectively. The performance was mainly driven by gains recorded by large cap stocks such as KCB, Equity and Safaricom of 9.2%, 8.4% and 7.2% respectively;
During the week, the equities market was on an upward trajectory, with NSE 20, NASI, NSE 10, and NSE 25 gaining by 2.4%, 1.9%, 1.6% and 1.5% respectively, taking the YTD performance to gains of 30.3%, 29.0%, 28.4% and 27.0% for NSE 20, NSE 10, NSE 25 and NASI respectively. The week-on-week equities market performance was driven by gains recorded by large-cap stocks such as KCB, EABL and Safaricom of 4.2%, 3.3% and 2.5% respectively. The performance was however weighed down by losses recorded by large cap stocks such as BAT, Cooperative Bank, and Equity of 1.7%, 0.4% and 0.3% respectively;
Also, during the month, the banking sector index gained by 5.6% to close at 269.4 from the 255.1 recorded at the end of the June 2026. This was attributable to gains recorded by large-cap stocks such as KCB, Equity and DTB-K of 9.2%, 8.4% and 5.2% respectively;
During the week, the banking sector index gained by 1.3% to 269.4 from 265.9 recorded the previous week. This is attributable to gains recorded by large cap stocks such KCB, DTB-K and SCB-K of 4.2, 1.2% and 1.0% respectively. The performance was however weighed down by losses recorded by large cap stocks such as Cooperative Bank, Equity and Stanbic of 0.4%, 0.3% and 0.2% respectively;
During the month of July, equities turnover decreased by 93.1% to USD 124.4 mn from USD 1,803.1 mn recorded during the month of June 2026. Foreign investors became net sellers, with a net selling position of USD 26.9 mn, from a net buying position of USD 3.9 mn recorded in June 2026.
During the week, equities turnover decreased by 9.9% to USD 27.7 mn from USD 30.7 mn recorded the previous week, taking the YTD total turnover to USD 2,608.8 mn. Foreign investors remained net sellers for the third consecutive weeks with a net selling position of USD 18.5 mn, from a net selling position of USD 7.5 mn recorded the previous week, taking the YTD foreign net selling position to USD 104.2 mn, compared to a net selling position of USD 92.9 mn recorded in 2025.
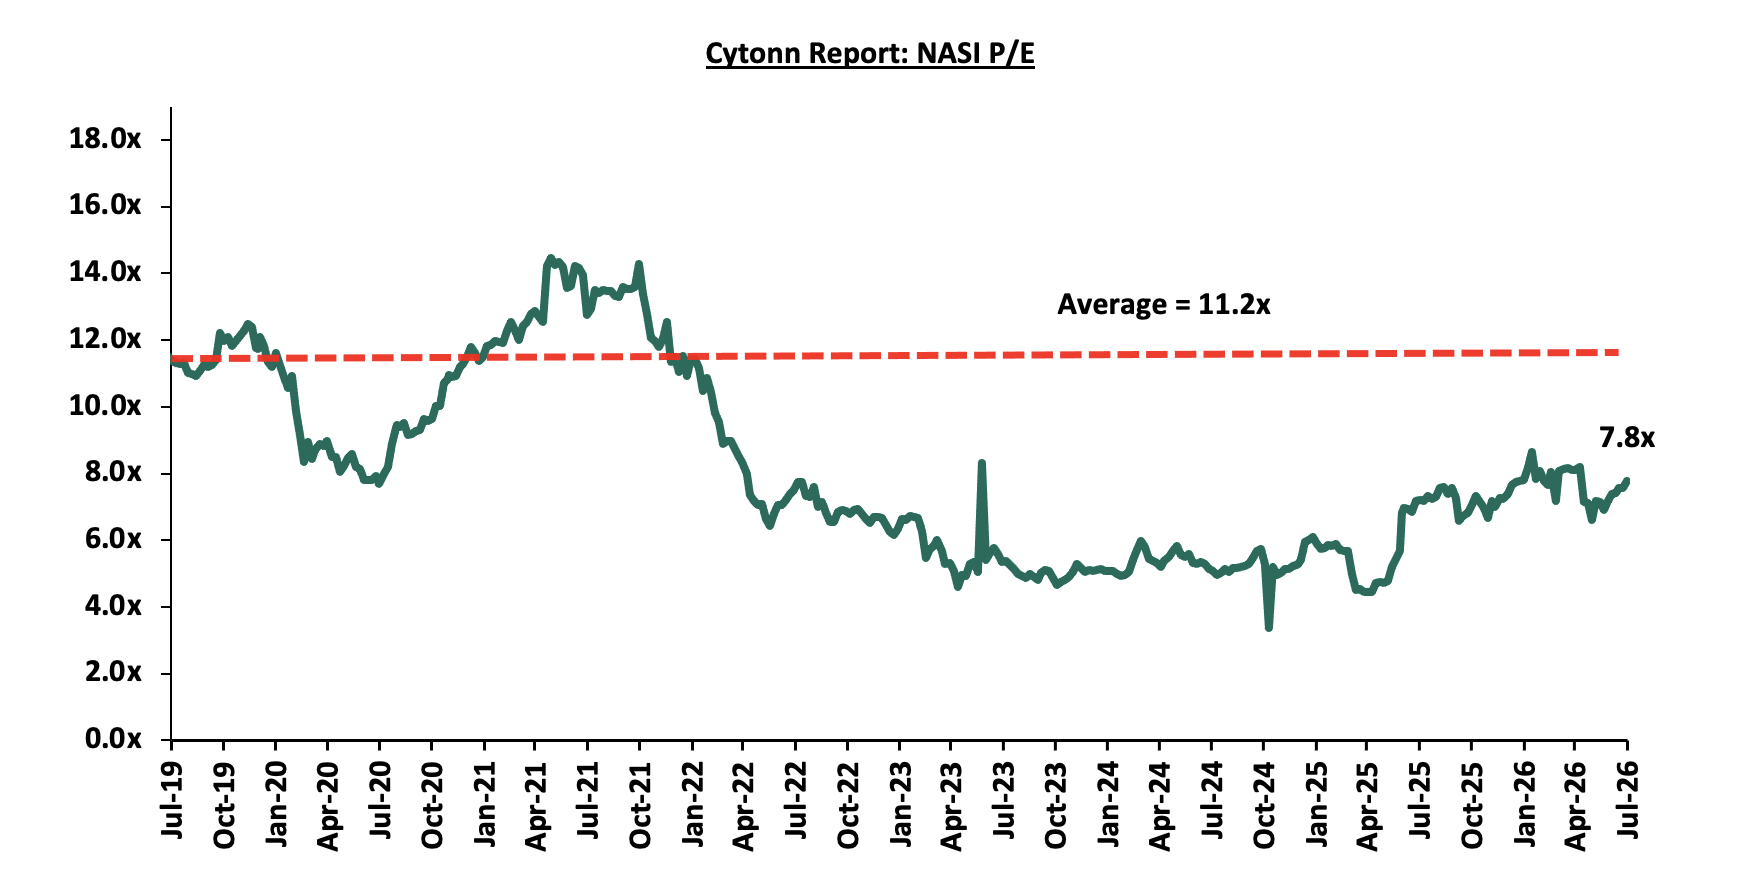
The market is currently trading at a price to earnings ratio (P/E) of 7.8x, 30.7% below the historical average of 11.2x, and a dividend yield of 5.9%, 1.1% points above the historical average of 4.7%. Key to note, NASI’s PEG ratio currently stands at 1.0x, suggesting that the market is fairly valued relative to its expected earnings growth. A PEG ratio lower than 1.0x indicates the market may be undervalued while a PEG ratio greater than 1.0x indicates that the market is overvalued.
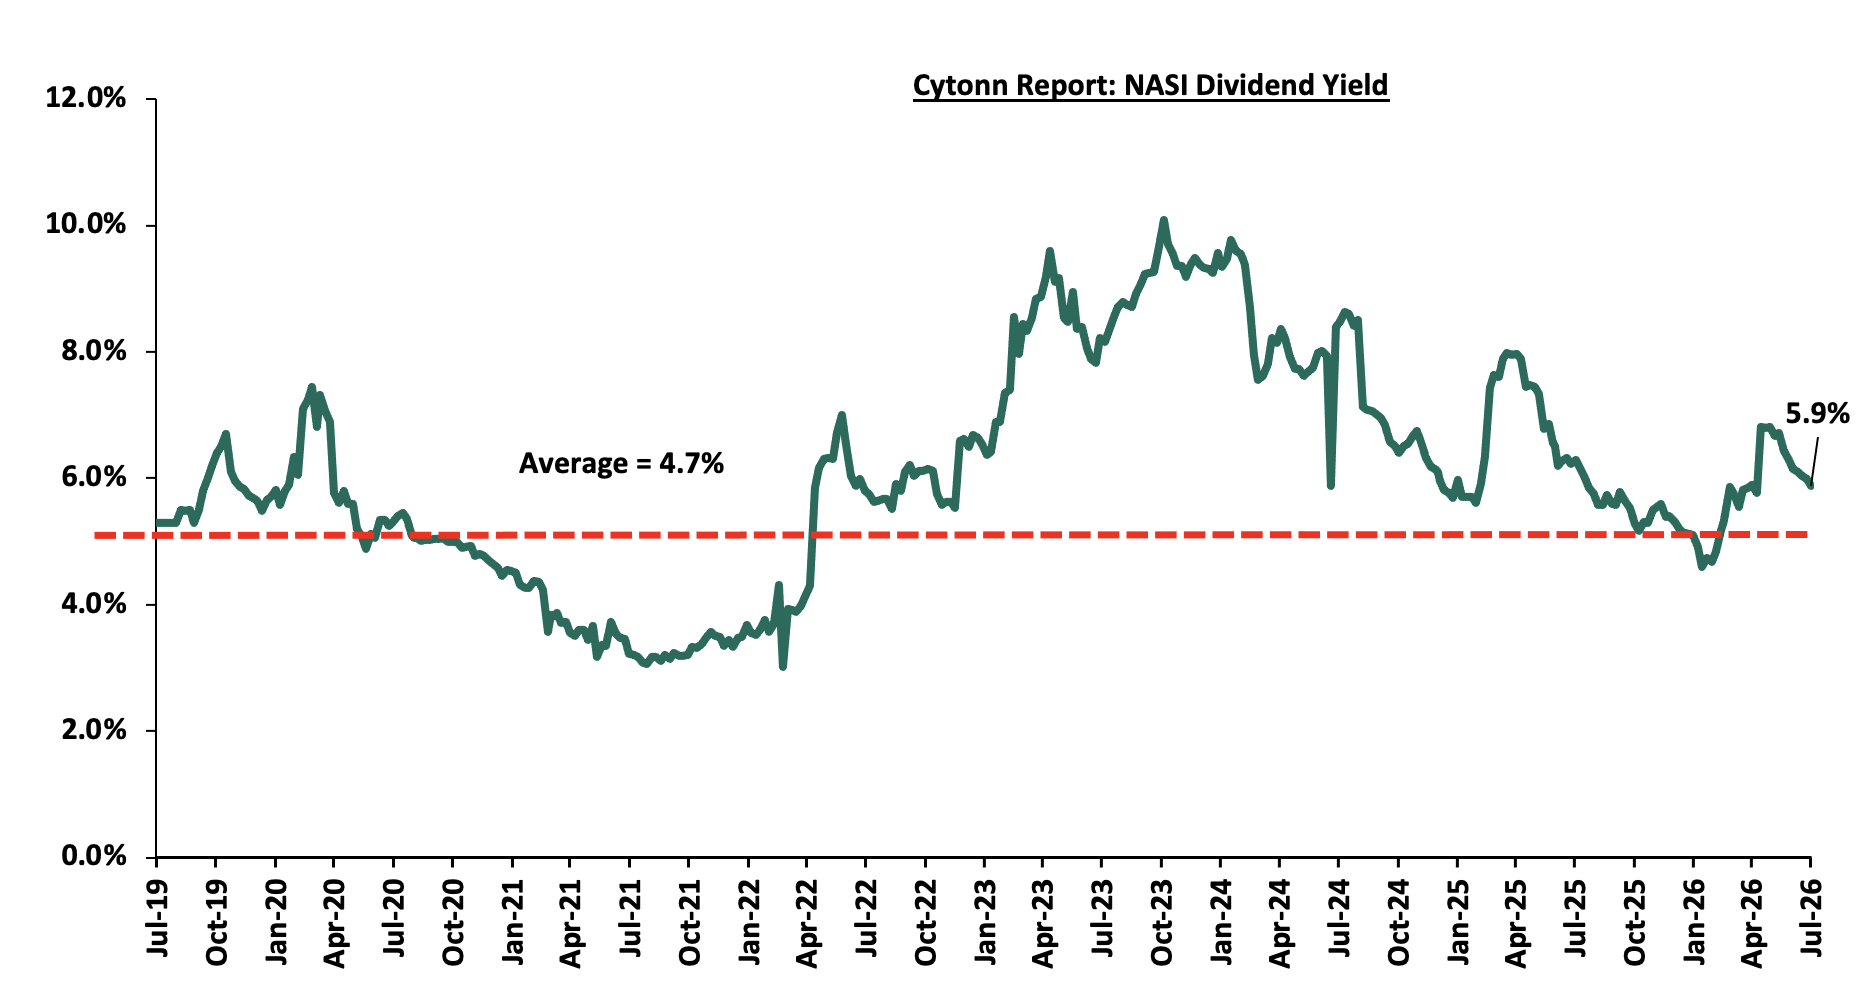
The charts below indicate the historical P/E and dividend yields of the market;
Universe of Coverage:
|
Cytonn Report: Equities Universe of Coverage |
|||||||||||
|
Price as at 24/07/2026 |
Price as at 31/07/2026 |
w/w change |
m/m change |
YTD Change |
Year Open 2026 |
Target Price* |
Dividend Yield |
Upside/ Downside** |
P/TBv Multiple |
Recommendation |
|
|
NCBA |
89.8 |
90.0 |
0.3% |
0.6% |
5.9% |
85.0 |
108.9 |
7.9% |
28.9% |
1.2x |
Buy |
|
ABSA Bank |
33.0 |
33.3 |
0.9% |
3.9% |
34.0% |
24.9 |
36.8 |
6.2% |
16.8% |
1.8x |
Accumulate |
|
Co-op Bank |
35.0 |
34.9 |
(0.4%) |
1.6% |
45.8% |
23.9 |
36.9 |
7.2% |
13.1% |
1.3x |
Accumulate |
|
Jubilee Holdings |
375.5 |
376.8 |
0.3% |
4.4% |
16.8% |
322.5 |
407.5 |
4.0% |
12.1% |
0.5x |
Accumulate |
|
Diamond Trust Bank |
150.8 |
152.5 |
1.2% |
5.2% |
32.9% |
114.8 |
161.4 |
5.9% |
11.8% |
0.4x |
Accumulate |
|
Standard Chartered Bank |
334.3 |
337.8 |
1.0% |
3.1% |
12.7% |
299.8 |
345.8 |
9.2% |
11.6% |
2.1x |
Accumulate |
|
Stanbic Holdings |
292.0 |
291.5 |
(0.2%) |
4.0% |
47.4% |
197.8 |
300.3 |
7.7% |
10.7% |
1.6x |
Accumulate |
|
Equity Group |
87.0 |
86.8 |
(0.3%) |
8.4% |
29.5% |
67.0 |
87.5 |
6.6% |
7.5% |
1.1x |
Hold |
|
CIC Group |
4.7 |
4.7 |
1.3% |
4.4% |
4.4% |
4.5 |
5.0 |
2.7% |
7.4% |
1.2x |
Hold |
|
Britam |
16.5 |
17.4 |
5.5% |
38.6% |
92.1% |
9.1 |
18.5 |
0.0% |
6.0% |
1.3x |
Hold |
|
I&M Group |
67.8 |
67.75 |
0.0% |
(2.5%) |
58.3% |
42.8 |
67.9 |
5.5% |
5.8% |
1.1x |
Hold |
|
KCB Group |
82.5 |
86.0 |
4.2% |
9.2% |
30.8% |
65.8 |
83.9 |
8.1% |
5.8% |
0.9x |
Hold |
|
Family Bank |
27.7 |
31.5 |
13.7% |
30.0% |
74.7% |
18.0 |
31.3 |
3.8% |
3.2% |
1.6x |
Lighten |
|
*Target Price as per Cytonn Analyst estimates **Upside/ (Downside) is adjusted for Dividend Yield ***Dividend Yield is calculated using FY’2025 Dividends |
|||||||||||
Weekly Highlights
-
Centum Investments Company PLC FY’2026 Financial Performance
During the week, Centum Investments Company PLC released their FY’2026 financial results for the period ending 31st March 2026, recording an 8.5% decrease in the Profit After Tax to Kshs 0.7 bn in FY’2026, from Kshs 0.8 bn in FY’2025. The decrease was mainly attributable to an 86.8% decrease in profits from their Real Estate business to Kshs 0.2 bn, from Kshs 1.5 bn in FY’2025, coupled with a 62.9% decrease in profits from their financial services to Kshs 0.03 bn in FY’2026, from Kshs 0.1 bn in FY’ 2025. However, the decrease was supported by 28.8% increase in Profit from investment operations to Kshs 1.5 bn from Kshs 1.2 bn from FY’2025.
The tables below show the breakdown of the Group’s financial performance;
|
Cytonn Report: Centum Investments Plc Income Statement |
|||
|
|
FY' 2025 |
FY' 2026 |
y/y change |
|
|
(Kshs. Bn) |
(Kshs. Bn) |
(%) |
|
Trading Business |
|||
|
Net income from trading businesses |
0.5 |
0.5 |
(8.6%) |
|
Direct and other operating costs |
(1.0) |
(0.9) |
(13.4%) |
|
Loss from trading businesses |
(0.5) |
(0.4) |
(18.4%) |
|
Financial Services |
|||
|
Income from financial services |
0.6 |
0.6 |
14.3% |
|
Funding and other costs |
(0.5) |
(0.6) |
28.9% |
|
Profit/(loss) from financial services |
0.1 |
0.03 |
(62.9%) |
|
Real Estate Business |
|||
|
Gross profit from residential unit sales |
0.3 |
0.2 |
(50.3%) |
|
Operating costs |
(0.9) |
(0.8) |
(13.2%) |
|
Operating profit from Centum Real Estate |
1.5 |
0.7 |
(54.2%) |
|
Funding Income/(Costs) |
0.0 |
(0.5) |
(9093.9%) |
|
Profit/(loss) from real estate investments |
1.5 |
0.2 |
(86.8%) |
|
Two Rivers Development |
|||
|
Sales and investments income |
0.4 |
0.4 |
0.6% |
|
Direct and other operating costs |
(0.4) |
(0.3) |
(14.6%) |
|
Finance costs |
(0.3) |
(0.3) |
22.9% |
|
Loss from Two Rivers Development Group |
(0.2) |
(0.2) |
(1.3%) |
|
Two Rivers Special Economic Zone |
|||
|
Sales and investments income |
0.1 |
0.4 |
232.2% |
|
Fair value gains on investments property |
1.2 |
0.1 |
(89.9%) |
|
Funding and other costs |
(1.3) |
(1.5) |
17.0% |
|
Profit/(loss) from Two Rivers Special Economic Zone |
0.1 |
(1.0) |
(1190.9%) |
|
Development Operations |
|||
|
Direct and other operating costs |
0.0 |
(0.7) |
0.0% |
|
Finance costs |
0.0 |
(0.1) |
0.0% |
|
Loss from Development operations |
0.0 |
(0.8) |
0.0% |
|
Investment operations |
|||
|
Investment and other income |
2.0 |
1.6 |
(20.0%) |
|
Fair value gains on investment property |
0.0 |
0.4 |
|
|
Operating and administrative costs |
(0.6) |
(0.3) |
(42.4%) |
|
Finance costs |
(0.2) |
(0.1) |
(61.5%) |
|
Profit/(loss) from investment operations |
1.2 |
1.5 |
28.8% |
|
Profit before tax |
2.1 |
(0.6) |
(130.1%) |
|
Income tax (expense)/credit |
(1.3) |
1.4 |
(204.9%) |
|
Profit/(loss) for the year |
0.8 |
0.7 |
(8.5%) |
|
Earnings Per Share |
2.1 |
2.0 |
(1.5%) |
|
Dividend Per Share |
0.7 |
0.8 |
11.6% |
|
Dividend Yield |
6.0% |
4.9% |
(1.1%) |
|
ROE |
1.9% |
1.7% |
(0.2%) |
|
ROA |
1.0% |
0.9% |
(0.1%) |
Source: Centum Investments Company PLC FY’2026 financial statements
|
Cytonn Report: Centum Investments PLC Balance Sheet |
|||
|
|
FY' 2025 |
FY' 2026 |
y/y change |
|
|
(Kshs. Bn) |
(Kshs. Bn) |
(%) |
|
Investment Portfolio |
61.5 |
54.4 |
(11.7%) |
|
Loans and advances |
0.4 |
0.5 |
18.3% |
|
Cash and cash equivalents |
1.1 |
1.3 |
17.7% |
|
Other assets |
19.3 |
18.5 |
(4.1%) |
|
Assets classified as held for sale |
0.0 |
4.7 |
|
|
Total Assets |
82.4 |
79.4 |
(3.6%) |
|
Borrowings |
17.9 |
17.1 |
(4.3%) |
|
Other liabilities |
21.3 |
18.5 |
(13.0%) |
|
Liabilities classified as held for sale |
0.0 |
0.3 |
|
|
Total Liabilities |
39.1 |
35.8 |
(8.4%) |
|
Total Equity |
43.2 |
43.6 |
0.7% |
|
Total Equity and Liabilites |
82.4 |
79.4 |
(3.6%) |
Source: Centum Investments Company PLC FY’2026 financial report
Key take outs from the financial performance include;
-
Profits from the Group decreased by 8.5% to Kshs 0.7 bn in FY’ 2026, from Kshs 0.8 bn recorded in FY’2025. This is attributable to the 28.8% increase in Profit from investment operations to Kshs 1.5 bn from Kshs 1.2 bn from FY’2025. The performance was however weighed down by the 18.4% decrease in loss from trading businesses to Kshs 0.4bn from Kshs 0.5 bn recorded in FY’2025.
-
The Group witnessed a 28.8% profit increase from investments operations business to Kshs 1.5bn, from Kshs the 1.2 bn profits recorded in FY’2025. This is attributable to a decrease in Finance costs and Administrative costs by 61.5% and 42.5% to Kshs 0.1 bn and Kshs 0.3 bn from Kshs 0.2 bn and Kshs 0.6 bn respectively.
-
The Group’s balance sheet recorded a contraction, with the total assets decreasing by 3.6% to Kshs. 79.4 bn in FY’ 2026 from the Kshs 82.4 bn recorded in FY’2025. This is mainly attributable to decrease in investment portfolio by 11.7% to Kshs 54.4 bn during the period, from Kshs 61.5 bn in FY’2025, coupled with a 4.1% decrease in other assets to Kshs 18.5 bn in FY’2026 from Kshs 19.3 bn in FY’2025. This was supported by a 17.7% increase in cash and cash equivalent to Kshs 1.3 bn in FY’2026 from Kshs 1.1 bn recorded the previous year.
-
Earnings per share decreased by 1.5% to Kshs 2.02, from the Kshs 2.05 per share in FY’2025, largely driven by an 8.5% decrease in profit after tax to Kshs 0.7 bn, from Kshs 0.8 bn in FY’2025.
-
The Board of Directors declared an ordinary dividend of Kshs 0.42 per share and a special dividend of Kshs 0.36 per share bringing the total dividend per share to Kshs 0.78 share, compared to an ordinary dividend payment and a special dividend of Kshs 0.32 and Kshs 0.379 respectively bringing the total to Kshs 0.7 in FY’2025 translating to a dividend yield of 4.9% compared to 6.0% in FY’2025
Going forward, Centum is expected to build on its strengthened financial position by accelerating cash generation, growing recurring income streams, and unlocking value from its investment portfolio. The company's focus on capital recycling and disciplined allocation of resources is likely to enhance returns while preserving financial flexibility to pursue new investment opportunities. In addition, continued progress in the development and monetization of strategic assets such as Vipingo Special Economic Zone and TRIFIC should support earnings growth by attracting third-party capital and creating additional revenue streams. However, the pace of value realization will depend on successful execution, favorable market conditions, and sustained demand across its key sectors. Overall, we expect Centum's improved balance sheet, diversified investment portfolio, and strategic focus on operational efficiency to support stronger financial performance and long-term shareholder value creation.
Notable Monthly Highlights
-
During the month, British American Tobacco Kenya Plc released their H1’2026 financial results, recording a 3.1% increase in Profits after Tax (PAT) to Kshs 3.1 bn, from Kshs 3.0 bn recorded in H1’2025. For more information, please see our Cytonn Weekly #29/2026;
-
During the month, Nedbank Group announced the results of its offer to acquire a 66.0% stake in NCBA Group, with total acceptances reaching 1.3 bn shares, equivalent to an acceptance rate of 79.9% of NCBA's issued ordinary shares, well above the targeted acquisition. For more information, please see our Cytonn Weekly #29/2026;
We maintain a “cautiously optimistic” short-term outlook supported primarily earnings-led attractive valuations, despite rising yields on short-term government papers, which increase competition for capital by drawing investors towards risk-free government securities, as well as heightened geopolitical risks such as Iran war that may weigh on investor sentiment, and, “neutral” in the long term as persistent foreign investor outflows continue to constrain market liquidity and limit broad-based market re-rating. With the market currently trading at a discount to its future growth (PEG Ratio at 1.0x), where performance will be driven by company-specific fundamentals rather than general market direction, we believe that investors should reposition towards value stocks exhibiting strong earnings growth, attractive dividend yields, solid balance sheets, sustainable competitive advantages and trading at compelling discounts to their intrinsic value. While foreign investor sell-offs are expected to continue exerting pressure in the near term, we believe this will create selective entry opportunities for long-term investors.
-
Infrastructure Sector
-
Government adopts blended financing for Kshs 116.0 bn JKIA expansion.
During the week, the Government announced plans to borrow Kshs 81.0 bn to finance the expansion and modernization of Jomo Kenyatta International Airport (JKIA), representing 70.0% of the revised Kshs 116.0 bn project cost. The remaining Kshs 35.0 bn will be raised through a securitized bond and the National Infrastructure Fund (NIF), with the bond expected to be backed by future air passenger service levy revenues. The Government has appointed the Trade and Development Bank (TDB) and the Africa Finance Corporation (AFC) as lead arrangers for the financing, reflecting the Government's increasing use of alternative financing mechanisms to deliver large-scale infrastructure projects amid constrained public finances.
The project will involve rehabilitation of existing airport facilities, including runways and aprons, and construction of a new passenger terminal, increasing JKIA's annual passenger handling capacity from 7.5 mn to 22.0 mn. The revised project cost of Kshs 116.0 bn is lower than the previously estimated Kshs 155.0 bn, with the Government seeking to leverage the NIF to reduce financing costs. The expansion is expected to strengthen Kenya's position as a regional aviation hub amid increasing competition from Ethiopia and Rwanda, which are also investing heavily in airport infrastructure.
Going forward, the JKIA expansion is expected to improve aviation connectivity, support tourism, trade and investment, and strengthen Nairobi's position as a regional transport and logistics hub. For the Real Estate sector, increased passenger and cargo capacity could support demand for hospitality, commercial, logistics and mixed-use developments around JKIA and along key transport corridors. Additionally, the adoption of securitization and NIF financing highlights the Government's continued shift towards alternative infrastructure financing, which could facilitate delivery of strategic projects while reducing pressure on public finances.
During the week, the Government announced that the feasibility study for the planned 243-kilometre Mau Summit–Malaba dual carriageway will commence in Q1'2026/27, following completion of the pre-feasibility study in May 2026. The project will upgrade the existing two-lane highway into a four-lane, access-controlled tolled road under a Public-Private Partnership (PPP) model. The highway forms part of the Northern Corridor connecting western Kenya to Uganda and will complement the Kshs 170.0 bn Rironi–Mau Summit dual carriageway currently under construction.
The project is expected to improve the efficiency of the Northern Corridor, which currently experiences heavy traffic congestion and frequent accidents, while reducing transportation costs and travel times between key commercial centres. The feasibility study, funded by the Asia Infrastructure Investment Bank (AIIB), will also determine the project's cost and applicable toll charges, providing a basis for private sector participation and long-term financing.
Going forward, development of the Mau Summit–Malaba highway is expected to enhance regional connectivity, facilitate trade with Uganda and other East African markets, and stimulate economic activity along the corridor. For the Real Estate sector, improved connectivity could increase the attractiveness of surrounding towns for residential, commercial, logistics, and industrial developments, while supporting land value appreciation and encouraging private sector investment along the Northern Corridor.
-
Hospitality Sector
-
Kenya targets increased tourism through Magical Kenya Travel Expo
During the week, the Kenya Tourism Board (KTB) announced plans to leverage the 16th edition of the Magical Kenya Travel Expo (MKTE), scheduled for 6th–8th October 2026 in Nairobi, to strengthen Kenya's position as a key global tourism hub. The event is expected to attract more than 10,000 delegates from 40 countries, providing a platform to showcase Kenya's tourism offerings and connect local tourism operators with international markets.
Going forward, increased tourism promotion is expected to support growth in visitor arrivals and strengthen activity across the hospitality and tourism value chain. For the Real Estate sector, higher tourist and business visitor numbers could support demand for hotels, serviced apartments, restaurants, retail facilities, and other hospitality-related developments, particularly in Nairobi and major tourism destinations. In the medium to long term, sustained tourism growth could encourage investment in hospitality infrastructure and support the performance of Kenya's hospitality real estate market.
-
Real Estate Investments Trusts
-
ALP I-REIT’s H1’2026 Performance
ALP released the maiden financial results (H1’2026) for the ALP I-REIT for the period ended 30th June 2026. The I-REIT was authorized by the Capital Markets Authority (CMA) on 8th December 2025 and listed on the Nairobi Securities Exchange on 11th March 2026. The USD-denominated income REIT invests in institutional-grade industrial and logistics Real Estate. As at 30th June 2026, the REIT's seed portfolio comprised three operational assets, ALP North Two in Tatu City, and Courtyard and Kyoga in Tilisi, Limuru, with ALP North Three identified as the immediate pipeline asset for acquisition.
Below is a summary of the ALP I-REIT’s H1’2026 Performance.
|
Figures in USD mn unless stated otherwise |
|
|
Balance Sheet |
H1'2026 |
|
Total Assets |
45.2 |
|
Total Equity |
41.7 |
|
Total Liabilities |
3.5 |
|
Figures in USD unless stated otherwise |
|
|
Income Statement |
H1'2026 |
|
Rental Income |
399,737.0 |
|
Income from Other Sources |
2,284.0 |
|
Operating Expenses |
356,538.0 |
|
Profit/Loss |
233,088.0 |
|
Basic EPS (Kshs) |
0.0058 |
|
Figures in USD unless stated otherwise |
|
|
Ratios Summary |
H1'2026 |
|
ROA |
0.5% |
|
ROE |
0.6% |
|
Debt Ratio |
7.8% |
|
PBT Margin |
58.3% |
|
Rental Yield |
1.5% |
|
Annualized Rental Yield |
3.0% |
Income Statement:
-
The basic earnings per unit (EPU) came in at USD 0.0058 in H1’2026, with a net profit of USD 233,088. The relatively modest EPU reflects the REIT's maiden reporting period, during which only 2 months of rental income were recognized following the transfer of the seed assets. Profitability was also weighed down by USD 243,287.0 in one-off REIT set-up expenses incurred during the launch and listing of the fund.
-
Rental and related income for the REIT stood at USD 399,737.0 in H1’2026, implying a gross rental yield of 1.5% and an annualized rental yield of 3.0% based on the six-month reporting period. However, the REIT only began accruing rental income from 1st May 2026 following the transfer of the seed assets, meaning the reported income reflects only 2 months of rental operations. On a normalized two-month operating basis, the portfolio would have generated an annualized gross rental yield of approximately 9.4%, providing a more representative indication of the underlying income-generating capacity of the investment properties, which were valued at USD 26.5 mn.
-
Total operating expenses in H1’2026 for the REIT came in at USD 356,538.0, attributed to USD 243,287.0 incurred in REIT set-up expenses, USD 81,289.0 in fund operating expenses, and USD 31,962.0 in administrative expenses. Notably, the REIT set-up expenses accounted for 68.2% of total operating expenses, highlighting the significant non-recurring costs associated with the establishment and listing of the REIT.
Balance Sheet:
-
Total assets for the REIT stood at USD 45.2 mn in H1’2026. Total non-current assets stood at USD 26.6 in H1’2026, consisting mainly of USD 26.5 mn in investment, while total current assets stood at USD 18.6 in H1’2026, consisting mainly of USD 14.7 mn cash and cash equivalents and USD 3.1 mn in trade and other receivables. The substantial cash balance reflects the unutilized IPO proceeds earmarked for the acquisition of ALP North Three, underscoring the REIT's strong liquidity position and capacity to expand its income-generating portfolio in the near term.
-
Total liabilities in H1’2026 came in at USD 3.5 mn, with USD 2.2 mn in provision for VAT payable and USD 1.3 mn in trade and other payables,
-
The shareholder’s funds recorded in H1’2026 was USD 41.7 mn, with Trust capital at USD 39.6 mn and other reserve at USD 1.9 mn.
-
The REIT currently has a Return on Asset and a Return on Equity of 0.5% and 0.6% respectively.
We expect the REIT's financial performance to strengthen as it transitions from its maiden reporting period into a fully operational phase. While the maiden results were weighed down by one-off establishment costs and the limited rental contribution during the reporting period, the REIT's high-quality portfolio, fully equity-funded balance sheet, strong occupancy, and visible acquisition pipeline provide a solid foundation for stronger recurring earnings and sustainable distributions in the periods ahead.
For more comprehensive analysis, please see our ALP I-REIT Earnings Note
-
ILAM Fahari I-REIT’s H1’2026 Performance
Below is a summary of the ILAM Fahari I-REIT’s H1’2026 Performance;
|
Values in Kshs bn unless stated otherwise |
|
|
|
|
|
||
|
Balance Sheet |
FY'2023 |
H1'2024 |
FY'2024 |
H1'2025 |
FY'2025 |
H1'2026 |
∆ Y/Y (H1' 2026/H1'2025) |
|
Total Assets |
3.5 |
3.4 |
3.7 |
3.7 |
3.8 |
3.8 |
4.7% |
|
Total Equity |
3.3 |
3.2 |
3.6 |
3.6 |
3.7 |
3.7 |
4.2% |
|
Total Liabilities |
0.2 |
0.1 |
0.1 |
0.1 |
0.1 |
0.1 |
26.9% |
|
Values in Kshs bn unless stated otherwise |
|
|
|
|
|
|
|
|
Income Statement |
FY'2023 |
H1'2024 |
FY'2024 |
H1'2025 |
FY'2025 |
H1'2026 |
∆ Y/Y (H1' 2026/H1'2025) |
|
Rental Income |
0.3 |
0.1 |
0.3 |
0.1 |
0.3 |
0.2 |
14.0% |
|
Income from Other Sources |
0.1 |
0.0 |
0.1 |
0.0 |
0.05 |
0.02 |
(13.5%) |
|
Operating Expenses |
0.2 |
0.1 |
0.22 |
0.1 |
0.21 |
0.10 |
(3.7%) |
|
Profit/Loss |
(0.0003) |
0.1 |
0.4 |
0.1 |
0.2 |
0.1 |
31.6% |
|
Basic EPS |
(0.002) |
0.3 |
2.1 |
0.4 |
1.4 |
0.5 |
32.2% |
|
Ratios Summary |
FY'2023 |
H1 2024 |
FY'2024 |
H1'2025 |
FY'2025 |
H1'2026 |
∆ Y/Y (H1' 2026/H1'2025) |
|
ROA |
(0.01%) |
1.6% |
10.3% |
1.8% |
6.4% |
2.2% |
(3.9%) |
|
ROE |
(0.01%) |
1.7% |
10.6% |
1.8% |
6.6% |
2.3% |
(4.0%) |
|
Debt Ratio |
4.7% |
4.3% |
3.1% |
2.6% |
2.3% |
3.1% |
(0.8%) |
|
PBT Margin |
(0.1%) |
38.4% |
128.5% |
44.1% |
80.8% |
52.0% |
(47.7%) |
|
Annualized Rental Yield |
11.6% |
10.2% |
9.2% |
9.6% |
9.7% |
10.6% |
0.5% |
Income Statement:
-
The basic earnings per unit increased by 32.2% to Kshs 0.5 bn in H1’2026 from Kshs 0.4 in HY’2025. The performance is attributed to an increase in ILAM Fahari’s comprehensive profit by 31.6% to Kshs 84.7 mn in H1’2026, from Kshs 64.4 mn recorded in H1’2025. This was mainly driven by a 7.7% increase in total income of Kshs 185.4 mn realized in H1’2026 from Kshs 172.2 mn in H1’2025. Additionally, operating expenses declined by 3.7% to Kshs 100.8 mn in H1’2026 from Ksh 104.7 mn in H1’2025,
-
Rental income increased by 14.0% to Kshs 162.7 mn in H1’2026, from Kshs 142.8 mn recorded in H1’ 2025, mainly due to increased occupancy at Greenspan Mall which increased by 8.0% points to 94.0% in H1’2026 from 86.0% in H1’2025.
-
The REIT Manager did not recommend an interim distribution for the period ended 30th June 2026.
-
The annualized rental yield, increased by 1.0% points to 10.6% in H1’2026 from 9.7% recorded in H1’2025. This was mainly driven by a 14.0% increase in rental and related income of Kshs 162.7 mn realized in H1’2026 from Kshs 142.8 mn in H1’2025.
Balance Sheet:
-
Total assets increased by 4.7% to Kshs 3.8 bn in H1’2026, from Kshs 3.7 bn in H1’2025. This was primarily attributable to a 45.2% increase in investment securities to Kshs 0.5 bn in H1’2026, from Kshs 0.4 bn recorded in H1’2025,
-
Total liabilities increased by 26.9% to Kshs 120.1 mn in H1’2026, from Kshs 94.7 mn in H1’2026 attributable to a similar increase in the trade and other payables to Kshs 120.1 mn in H1’2026, from Kshs 94.7 mn in H1’2025. The REIT remained without non-current liabilities as at H1’2026,
-
The shareholder’s funds increased by 4.2% to Kshs 3.7 bn in H1’2026, from Kshs 3.6 bn in H1’2025, following an increase retained earnings of 52.8% to Kshs 140.2 mn in H1’2026 from Kshs 91.8 mn H1’2025, and,
-
The REIT currently has a Return on Assets of 2.2% which was a 0.4%-point increase from 1.8% in H1’ 2025 and a Return on Equity of 2.3% which was a 1.8%-point increase from 1.8% in H1’2025.
Going forward,
ILAM Fahari I-REIT’s strategic focus will be on enhancing asset performance through active portfolio management, tenant retention, and targeted capital improvements, particularly at high-potential assets such as Greenspan Mall. With increased occupancy already evident, the REIT is well-positioned to drive further rental income growth. Additionally, prudent cost management and operational efficiency will remain key levers for sustaining profitability and distributable income. The REIT also aims to optimize its investment portfolio by exploring yield-accretive opportunities and diversifying income streams. Supported by a stronger balance sheet, low leverage, and positive earnings momentum, ILAM Fahari is set to deliver stable returns to investors while reinforcing its market position as a leading listed property income fund in Kenya.
For more comprehensive analysis, please see our ILAM Fahari I-REIT Earnings Note
-
Acorn Holdings H1’2026 Performance
Acorn Holdings released their HY’2026 financial results for the Acorn D-REIT and I-REIT, which invests in purpose-built student accommodation (PBSA). The Development Real Estate Investment Trust (D-REIT) finances the development of Purpose-Built Student Accommodation (PBSA) housing projects and later exit the projects to the Investment Real Estate Investment Trust (I-REIT) through legally bidding acquisition agreement. Rental incomes and other sources of income play a significant role in driving the investments and operations of the REITs.
Below is a summary of the Acorn’s I-REIT and D-REIT HY’2026 performances:
Figures in Kshs mn Unless Stated Otherwise
|
Cytonn Report: Income Statement |
||||||
|
|
Acorn I-REIT |
Acorn D-REIT |
||||
|
HY’2025 |
HY’2026 |
Change |
HY’2025 |
HY’2026 |
Change |
|
|
Rental Income |
524.1 |
544.9 |
4.0% |
157.9 |
298.4 |
89.0% |
|
Income from Other Sources |
0.27 |
0.31 |
15.4% |
0.0 |
2.7 |
0.0% |
|
Total operating income |
524.4 |
596.6 |
13.8% |
805.5 |
914.7 |
13.6% |
|
Operating Expenses |
231.4 |
251.4 |
8.6% |
238.6 |
423.9 |
77.6% |
|
Finance costs |
(202.7) |
(129.1) |
(36.3%) |
(0.4) |
(0.5) |
25.5% |
|
Profit Before Tax |
251.6 |
285.2 |
13.3% |
205.0 |
29.1 |
(85.8%) |
|
Basic EPS (Kshs) |
0.69 |
0.7 |
2.0% |
0.7 |
0.1 |
(86.3%) |
Figures in Kshs bn Unless Stated Otherwise
|
Cytonn Report: Balance Sheet |
|||||||
|
|
Acorn I-REIT |
Acorn D-REIT |
|||||
|
HY’2025 |
HY’2026 |
Change |
HY’2025 |
HY'2026 |
Change |
||
|
Total Assets |
11.3 |
13.7 |
21.0% |
16.1 |
17.4 |
8.1% |
|
|
Total Equity |
8.6 |
9.9 |
14.9% |
7.7 |
8.7 |
12.4% |
|
|
Total Liabilities |
2.7 |
3.8 |
40.6% |
8.4 |
8.7 |
4.1% |
|
Ratios summary for the I-REIT and D-REIT
|
Cytonn Report: Ratios Summary |
||||||
|
|
Acorn I-REIT |
Acorn D-REIT |
||||
|
H1'2025 |
H1’2026 |
Change |
H1'2025 |
H1’2026 |
Change |
|
|
ROA |
2.2% |
2.1% |
-0.1% |
1.3% |
0.2% |
(1.1%) |
|
ROE |
2.9% |
2.9% |
0.0% |
2.7% |
0.3% |
(2.3%) |
|
Debt Ratio |
24.0% |
27.9% |
3.9% |
52.1% |
50.2% |
(1.9%) |
|
PBT Margin |
48.0% |
52.3% |
4.3% |
25.5% |
3.2% |
(22.3%) |
|
Annualized Rental Yield |
10.0% |
4.1% |
(5.9%) |
1.3% |
2.8% |
1.5% |
|
Distribution Per Unit |
7.4% |
17.4% |
10.0% |
0.5 |
0.01 |
(51.8%) |
|
Payout Ratio |
10.8% |
24.9% |
14.1% |
72.7% |
9.9% |
(62.7%) |
Acorn I-REIT
Income Statement:
-
The basic earnings per unit increased by 2.0% to Kshs 0.7 in HY’2026, from Kshs 0.69 recorded in HY’2025. This was mainly driven by a 13.3% increase in Profit After Tax to Kshs 285.2 mn recorded in HY’2026, from Kshs 251.6 mn that was recorded in HY’2025, largely on the back of the 4.0% increase in rental income to Kshs 544.9 mn from Kshs 524.1 mn in HY’2025 coupled with 15.4% increase in income from other sources to Kshs 0.31 mn from Kshs 0.27 mn, as compared to the 36.3% decline in finance costs to Kshs 129.1 mn from Kshs 202.7
-
The I-REIT recorded a 4.0% increase in rental income, coming in at Kshs 544.9 mn in HY’2026 from Kshs 524.1 mn in HY’2025, attributable to a 4.1% increase in residential rental income to Kshs 537.8 mn from Kshs 516.4 mn in HY’2025;
-
The REIT’s total operating expenses increased by 8.6% to Kshs 251.4 mn in HY’2026 from Kshs 231.4 mn in HY’2025, mainly driven by a Kshs 18.1 mn allowance for expected credit losses recognized in HY’2026 which was initially written back in HY’2025 as a Kshs 3.3 mn, partly offset by a 5.1% decline in fund operating expenses to Kshs 53.4 mn from Kshs 56.2 mn, while administrative expenses were broadly flat at Kshs 179.9 mn from Kshs 178.5 mn in HY’2025, and,
-
The rental yield for the I-REIT decreased by 0.8% points to 4.1% in HY’2026, from 4.9% in HY’2025 mainly attributable to the 4.0% increase in the rental income that was outpaced by the 23.4% increase in investment property to Kshs 13.2 bn in HY’2026 from Kshs 10.7bn in HY’2025;
Balance Sheet:
-
Total assets for the I-REIT increased by 21.0% to Kshs 13.7 bn in HY’2026, from Kshs 11.3 bn in HY’2025, mainly attributable to the 23.4% increase in investment properties to Kshs 13,237.0 mn from Kshs 10,943.0 mn in the prior period after a Kshs 2.2 bn acquisition of the Qwetu Karen and Qejani Karen properties from the ASA D-REIT on 1st May 2026,
-
Total liabilities increased by 40.6% to Kshs 3.8 bn in HY’2026, from Kshs 2.7 bn in HY’2025, as additional borrowings funded the Karen acquisition, taking total debt drawn to Kshs 3,070.8 mn at 30 June 2026 from Kshs 1,819.1 mn as at 31st December 2025,
-
The shareholder’s funds for I-REIT increased by 14.9% to Kshs 9.9 bn in HY’2026, from Kshs 8.6 bn in HY’2025, mainly attributable to the 65.5% increase in retained earnings to Kshs 294.7 mn from Kshs 177.9 mn in HY ’2025,
-
The I-REIT’s Return on Assets (ROA) decreased by 0.1% points to 2.1% in HY’2026, from 2.2% in HY’2025. Return on Equity (ROE) remained flat at 2.9% in HY’2026, from 2.9% in HY’2025
Acorn D-REIT
Income Statement:
-
The basic earnings per unit for the REIT decreased by 86.3% to Kshs 0.1 in HY’2026, from Kshs 0.7 in HY’2025. This was mainly driven by an 85.8% decrease in Profit After Tax to Kshs 29.1 mn in HY’2026, from Kshs 205.0 mn in HY’2025 as operating expenses increased by 77.6% to Kshs 423.9 mn from Kshs 238.6 mn,
-
Acorn D-REIT posted a 89.0% increase in rental income to Kshs 298.4 mn in HY’2026 from Kshs 157.9 mn in HY’2025. This can be attributed to increase in residential income by 89.3% to Kshs 294.9 mn in HY’2026 from Kshs 155.7 mn in HY’2025,
-
The total operating expenses for the D-REIT increased by 77.6% to Kshs 423.9 mn in HY’2026 from Kshs 238.6 mn in HY’2025, mainly driven by a 80.8% increase in administrative expenses to Kshs 164.3 mn in HY’2026 from Kshs 90.9 mn in HY’2025, and,
-
The rental yield for the D-REIT increased by 1.5% points to 2.8% in HY’2026 from 1.3% recorded in HY’2025. This can be attributed to the 89.0% increase in rental income to Kshs 298.4 mn in HY’2026 from Kshs 157.9 mn in HY’2025.
Balance Sheet:
-
Total assets for the D-REIT increased by 8.1% to Kshs 17.4 bn in HY’2026, from Kshs 16.1 bn in HY’2025. Mainly attributable to the 107.2% increase in assets held for sale to Kshs 4.8 bn in HY’2026 from Kshs 2.3 bn in HY’2025.
-
Total liabilities for the D-REIT increased by 4.1% to Kshs 8.7 bn in HY’2026, from Kshs 8.4 bn in HY’2025, mainly driven by the 227.0% increase in liabilities held for sale to Kshs 114.1 mn from 34.9 mn,
-
The total equity for the D-REIT increased by 15.5% to Kshs 8.5 bn in HY’2026, from Kshs 7.3 bn in HY’2026. The increase was attributed to an increase in shareholders contribution by 5.0% to Kshs 6.0 bn in HY’2026, from Kshs 5.7 bn in HY’2025.
-
The D-REIT recorded 1.1% points decrease in ROA to 0.2% in HY’2026 from 1.3% in HY’2025. The ROE recorded 2.3% points decrease to 0.3% from 2.7% in HY’2025 which was mainly attributable to 85.8% increase in total profit to Kshs 29 mn in HY’2026 from Kshs 205.0 mn in HY’2025 as compared to the 15.5% in increase in equity
Looking ahead, Acorn Holdings is expected to sustain growth by leveraging its strong development pipeline and rising demand for student housing in Kenya. The I-REIT will focus on improving occupancy, operational efficiency, and rental stability, while the D-REIT will drive income growth through continued project execution and asset transfers. Careful management of rising finance and administrative costs will be essential to protect margins. Overall, Acorn’s solid balance sheet and specialized focus position it to deliver sustainable long-term value
For more comprehensive analysis, please see our Acorn I-REIT and D-REIT Earnings Note
On the Unquoted Securities Platform Acorn D-REIT and I-REIT traded at Kshs 29.6 and Kshs 23.8 per unit, respectively, as per the last updated data on 17th July 2026. The performance represented a 48.0% and 18.8% gain for the D-REIT and I-REIT, respectively, from the Kshs 20.0 inception price. The volumes traded for the D-REIT and I-REIT came in at 13.5 mn and 43.3 mn shares, respectively. Additionally, ILAM Fahari I-REIT traded at Kshs 13.8 per share as of 17th July 2026, representing a 31.0% loss from the Kshs 20.0 inception price. The volume traded to date came in at 1.2 mn shares for the I-REIT, REITs offer various benefits, such as tax exemptions, diversified portfolios, and stable long-term profits. However, the ongoing decline in the performance of Kenyan REITs and the restructuring of their business portfolios are hindering significant previous investments. Additional general challenges include:
-
Insufficient understanding of the investment instrument among investors leading to a slower uptake of REIT products,
-
Lengthy approval processes for REIT creation,
-
High minimum capital requirements of Kshs 100.0 mn for REIT trustees compared to Kshs 10.0 mn for pension funds Trustees, essentially limiting the licensed REIT Trustee to banks only
-
The rigidity of choice between either a D-REIT or and I-REIT forces managers to form two REITs, rather than having one Hybrid REIT that can allocate between development and income earning properties
-
Limiting the type of legal entity that can form a REIT to only a trust company, as opposed to allowing other entities such as partnerships, and companies,
-
We need to give time before REITS are required to list – they would be allowed to stay private for a few years before the requirement to list given that not all companies maybe comfortable with listing on day one, and,
-
Minimum subscription amounts or offer parcels set at Kshs 0.1 mn for D-REITs and Kshs 5.0 mn for restricted I-REITs. The significant capital requirements still make REITs relatively inaccessible to smaller retail investors compared to other investment vehicles like unit trusts or government bonds, all of which continue to limit the performance of Kenyan REITs.
We expect the performance of Kenya's Real Estate sector to remain resilient, supported by several factors: i) Government adopting a blended financing for Kshs 116.0 bn JKIA expansion ii) Feasibility study for dual Mau Summit–Malaba highway to commence, and iii) Kenya targeting increased tourism through Magical Kenya Travel Expo. However, challenges such the weak investor appetite in listed REITs like ILAM Fahari I-REIT and high capital requirements will continue to constrain the sector's optimal performance.
-
Kenya Gazettes Virtual Asset Service Providers Regulations, 2026
During the week, Kenya officially gazetted the Virtual Asset Service Providers (VASP) Regulations, 2026 (Legal Notice No. 134 of 2026), operationalizing the legal and supervisory framework under the VASP Act, 2025. The framework introduces a comprehensive licensing regime covering ten virtual asset activity categories including exchanges, custodial wallets, payment processors, tokenization platforms, and stablecoins jointly overseen by the Central Bank of Kenya (CBK) for payment services and the Capital Markets Authority (CMA) for investment activities. Regulated entities must maintain local incorporation or registration, physical offices, local bank accounts, fit-and-proper executive leadership, tiered prudential capital up to Ksh 300.0 mn for stablecoins, customer asset segregations while strictly banning anonymity tools like mixers. With the Act now active, existing operators, new entrants, and foreign providers targeting Kenya must immediately assess their compliance perimeter and prepare application packs ahead of the firm November 4th, 2026 transitional deadline to secure early-mover operational clearance in Kenya’s regulated digital asset ecosystem.
-
Visa Reports Strong Q3 FY2026 Earnings
During the week, Visa Inc. reported its fiscal third-quarter 2026 financial results on July 28, beating Wall Street revenue and earnings expectations driven by resilient consumer spending and continued growth in cross-border payment activity. The payments network posted diluted earnings per share (EPS) of USD 3.3, beating consensus estimates of USD 3.2, representing a 14.0% year-on-year increase to USD 3.3 in 2026 from USD 2.9 in 2025 alongside net revenue of USD 11.6 bn, representing a 14.0% year-on-year increase. Total payment volume surpassed USD 4.0 tn for the first time, while non-GAAP net income increased to USD 6.3 bn. During the quarter, Visa also returned USD 6.2 bn to shareholders through dividends and share repurchases. The results reinforce Visa's leadership in the global payments industry, demonstrating the resilience of its network and its ability to sustain strong financial performance through growing payment volumes and cross-border transactions.
-
Mastercard Reports Strong Q2 2026 Financial Results
During the week, Mastercard Incorporated reported its second-quarter 2026 financial results on July 30, surpassing analyst expectations across both revenue and earnings. The company reported adjusted diluted earnings per share (EPS) of USD 5.0, exceeding consensus estimates of USD 4.8, representing a 22.0% year-on-year increase to USD 5.0 in 2026 from USD 4.1 in 2025 alongside net revenue of USD 9.3 bn, representing a 14.0% year-on-year increase. Worldwide Gross Dollar Volume (GDV) increased to USD 2.9 tn, supported by a 12.0% rise in cross-border volumes, while Value-Added Services and Solutions revenue grew to USD 3.8 bn. The strong performance highlights Mastercard's continued success in expanding both its core payments business and higher-margin value-added services, strengthening its long-term revenue diversification strategy.
-
PayPal Reports Strong Q2 2026 Earnings and Raises Full-Year Guidance
During the week, PayPal Holdings, Inc. reported its second-quarter 2026 financial results on July 29, surpassing market expectations and raising its full-year earnings outlook. The company reported diluted earnings per share (EPS) of USD 1.4, beating consensus estimates of USD 1.3, representing a 7.0% year-on-year decrease to 1.4 in 2026 from 1.5 in 2025 while net revenue increased by 5.0% year-on-year to USD 8.7 bn. Total Payment Volume (TPV) grew by 10.0% to USD 486.5 bn, driven by continued growth across Venmo and Braintree. The results demonstrate PayPal's continued progress in improving operating performance, reflecting stronger transaction activity, expanding payment volumes and ongoing execution of its profitability and growth strategy.
-
Digital Payments Stock Performance
The table below presents a snapshot of NYSE-listed digital payments stocks, covering Visa, Mastercard, American Express (AXP), Circle, Block and PayPal:
|
Cytonn Report: Digital Payments NYSE Stock Perfomance |
||||||||
|
Company |
Year Open 2026 |
Price 6/30/2026 |
Price 7/24/2026 |
Price 7/31/2027 |
m/m change |
w/w change |
YTD change |
P/E* |
|
American Express |
372.7 |
338.3 |
326.2 |
336.3 |
(0.6%) |
3.1% |
(9.8%) |
21.3x |
|
Visa |
346.5 |
343.1 |
355.7 |
366.1 |
6.7% |
2.9% |
5.7% |
34.7x |
|
Mastercard |
563.1 |
513.6 |
539.7 |
573.1 |
11.6% |
6.2% |
1.8% |
34.1x |
|
Circle |
83.5 |
62.6 |
62.4 |
62.6 |
(0.0%) |
0.4% |
(25.0%) |
(0.2)x |
|
Block |
65.2 |
76.0 |
77.2 |
81.2 |
6.9% |
5.3% |
24.7% |
37.2x |
|
Paypal Holdings |
58.1 |
43.2 |
56.2 |
57.2 |
32.5% |
1.9% |
(1.6%) |
10.0x |
|
Average |
22.8x |
|||||||
Source: Visa, AXP, Circle, Mastercard, Block and Paypal financials, NYSE, PE* calculated using FY’2025 audited financials
The stocks are currently trading at an average P/E multiple of 22.8x, indicating that investors are pricing in strong future earnings growth and are prepared to pay a substantial premium for current earnings. This also suggests that valuations may be stretched relative to near-term fundamentals.
Other notable digital payments sector highlights during the month of July 2026 Include:
-
During the month, Visa introduced the Visa Stablecoin Platform (VSP), enabling banks, fintechs and payment providers to issue, manage and settle stablecoins through a unified infrastructure, accelerating institutional adoption and interoperability across stablecoin payment networks. Cytonn Weekly #28/2026
-
During the month, Mastercard Incorporated announced major enhancements to its enterprise Virtual Card Number (VCN) platform, Mastercard In Control, integrating issuer-enforced spend controls, embedded payments infrastructure and unified single-API integration. Additionally, Mastercard partnered with Intuit to launch a dedicated small-business card directly integrated with QuickBooks, streamlining bookkeeping, expense management and liquidity management for SMEs. Cytonn Weekly #29/2026
We expect the global digital payments sector to continue evolving toward greater payment sovereignty, digital infrastructure modernization, and reduced reliance on traditional card-based payment networks as governments and financial institutions increasingly prioritize control over domestic payment ecosystems. Recent developments, particularly the European Central Bank’s progress toward launching the Digital Euro, signal a growing global shift toward central bank-backed digital payment infrastructure aimed at enhancing financial resilience, improving transaction efficiency, and strengthening monetary independence in an increasingly digital economy. This trend is likely to accelerate competition between public-sector digital currencies and established private payment networks such as Visa Inc. and Mastercard Incorporated, while driving broader innovation across digital finance infrastructure. However, despite these favorable long-term structural tailwinds, valuations within the sector remain relatively elevated, with the companies under coverage currently trading at an average P/E of 22.8x, suggesting that a significant portion of future growth expectations may already be priced in. As such, we expect near-term performance to remain sensitive to regulatory developments, execution risk, and the pace at which both incumbents and emerging digital payment infrastructure providers adapt to the rapidly changing payments landscape.
Disclaimer: The views expressed in this publication are those of the writers where particulars are not warranted. This publication, which is in compliance with Section 2 of the Capital Markets Authority Act Cap 485A, is meant for general information only and is not a warranty, representation, advice or solicitation of any nature. Readers are advised in all circumstances to seek the advice of a registered investment advisor

- Talk to us
- Kenya
- P.O Box 20695 - 00200, Nairobi, Kenya
- Cell +254709101200
- Tel +254709101200
- WhatsApp +254741676635
- United States
- +254709101200
- DOWNLOAD OUR APP
-


- Kenya
- 8th Floor, Pinetree Plaza, Kaburu Drive, Ngong Road, Nairobi, Kenya
- USA
- Suite 1150, 1775 Eye Street NW, USA, Washington DC 20006, USA
- Investments
- High Yield
- Private Equity
- Real Estate
- Real Estate
- RiverRun Estates
- Cytonn Towers
- The Ridge
- Taraji Heights
- The Alma