Dar es Salaam Real Estate Investment Opportunity, & Cytonn Weekly #11/2018
By Cytonn Research Team, Mar 18, 2018
Executive Summary
Fixed Income
Treasury bills continued to be oversubscribed this week, with the overall subscription rate coming in at 139.9%, compared to 155.0% recorded the previous week. Yields on the 91, 182 and 364-day T-bills remained unchanged at 8.0%, 10.4%, and 11.1%, respectively. The Monetary Policy Committee (MPC) is set to meet on Monday 19th March, 2018, to review the prevailing macroeconomic conditions and give direction on the Central Bank Rate (CBR); we expect the MPC to maintain the CBR at 10.0% as per our MPC Note;
Equities
During the week, the equities market was on an upward trend, with NASI, NSE 20 and NSE 25 rising 1.9%, 2.2%, and 3.5%, respectively, driven by gains in the banking sector stocks such as Barclays Bank, Equity Group, and KCB Group that gained 7.7%, 6.8% and 4.6%, respectively. Stanbic Africa Holdings Ltd (SAHL) has announced plans to increase its shareholding in Nairobi Stock Exchange listed bank, Stanbic Holdings, to 74.9% from the current 60.0%, through a tender offer. Co-operative Bank released FY’2017 results, registering a 10.0% decline in core earnings per share;
Real Estate
The County Government of Nairobi has requested prospective partners to submit letters of interest, innovative designs and proposals for the Urban Regeneration of Informal Settlements programme. The programme focuses on upgrading at least 26 slums in Nairobi, including Kibera, Mukuru, Huruma, among others, to provide low cost housing units, improve on sanitation and security. Nielsen, a global consumer research firm released the Nielsen Consumer Confidence and Spending Intentions Survey 2018, which indicates that there is a gap in the retail e-commerce space, where approximately 25.0% of consumers shop and find out about fast moving consumer goods brands online;
Focus of the Week
In a bid to offer a diversified investment portfolio for our clients, Cytonn has been conducting comprehensive research in various markets across Africa in our key focus areas of financial services, education, hospitality, and real estate. So far, we have conducted market research for Nairobi, Kigali, Kampala, and Accra markets; this week, we look at Tanzania with a focus on Dar es Salaam, its largest city and commercial hub, where we recently conducted real estate market research. From the findings, the retail sector was the best performing sector with average rental yields of 9.4%, followed by the commercial office sector with yields of 6.4%, and finally, the residential sector with 5.2%. The hospitality sector continues to do well with international arrivals growing at a 6-year CAGR of 9.9% in the period 2012-2017 with tourism earnings growing by 11.2% during the same period, according to the Tanzania National Bureau of Statistics (NBS). The growth in the hospitality sector has been supported by holiday tourism and the country’s relative political calm and security.
- Our Research Analyst, Nancy Murule, discussed the Cytonn Commercial Office Report - 2018 Release. Watch Nancy on K24 here
- Our Research Analyst, Nancy Murule, discussed the Cytonn Commercial Office Report - 2018 Release. Watch Nancy on Ebru Africa here
- Our Research Analyst, Nancy Murule, discussed the Cytonn Commercial Office Report - 2018 Release. Watch Nancy on KTN News here
- Our Investment Analyst, Caleb Mugendi, discussed the Kenyan markets with a focus on the insurance and banking sectors. Watch Caleb on CNBC here
- On Thursday 15th March 2018, Cytonn Investments Head of Legal and company Secretary Addressed League of Young Professionals on the theme " scaling up: insights from Cytonn’s journey”. See attached the event note here
- On Friday 16thMarch 2018, Cytonn held Q1’2018 Staff Team Building Event - Themed ‘Jeans & Boots'. See attached the event note here
- We continue to hold weekly workshops and site visits on how to build wealth through real estate investments. The weekly workshops and site visits target both investors looking to invest in real estate directly and those interested in high yield investment products to familiarize themselves with how we support our high yields. Watch progress videos and pictures of The Alma, Amara Ridge, The Ridge, and Taraji Heights. Key to note is that our cost of capital is priced off the loan markets, where all-in pricing ranges from 16.0% to 20.0%, and our yield on real estate developments ranges from 23.0% to 25.0%, hence our top-line gross spread is about 6.0%. If interested in attending the site visits, kindly register here
- We continue to see very strong interest in our weekly Private Wealth Management Training (largely covering financial planning and structured products). The training is at no cost and is open only to pre-screened participants. We also continue to see institutions and investment groups interested in the trainings for their teams. The Wealth Management Trainings are run by the Cytonn Foundation under its financial literacy pillar. If interested in our Private Wealth Management Training for your employees or investment group, please get in touch with us through wmt@cytonn.com or book through this link Wealth Management Training. To view the Wealth Management Training topics, click here
- For recent news about the company, see our news section here
- We have 10 investment-ready projects, offering attractive development and buyer targeted returns of around 23.0% to 25.0% p.a. See further details here: Summary of Investment-Ready Projects
- We continue to beef up the team with ongoing hires for: Clerks of Works, Financial Advisors and Unit Managers for Mt Kenya Region, among others. Visit the Careers section at Cytonn’s Website to apply
Treasury bills were oversubscribed during the week, with the overall subscription rate coming in at 139.9%, compared to 155.0% recorded the previous week. The subscription rates for the 91, 182 and 364-day papers came in at 63.8%, 114.2%, and 196.0% compared to 96.1%, 149.7%, and 183.8%, respectively, the previous week. Yields on the 91, 182 and 364-day T-bills remained unchanged at 8.0%, 10.4%, and 11.1%, respectively. The overall acceptance rate decreased to 86.2% compared to 87.8% the previous week, with the government accepting a total of Kshs 28.9 bn of the Kshs 33.6 bn worth of bids received, against the Kshs 24.0 bn on offer. The government is currently 4.6% ahead of its domestic borrowing target for the current fiscal year, having borrowed Kshs 221.4 bn, against a target of Kshs 211.8 bn (assuming a pro-rated borrowing target throughout the financial year of Kshs 297.6 bn from the 2018 Budget Policy Statement (BPS)).
The Kenyan Government has issued two new bonds, a 5-year (FXD 1/2018/5) and a 20-year (FXD 1/2018/20) with the 5-year coupon to be market-determined and the 20-year coupon set at 13.2%. The government will be seeking to raise Kshs 40.0 bn for budgetary support. With (i) the government being 4.6% ahead of its pro-rated domestic borrowing target and having collected 69.9% of its foreign borrowing target, (ii) KRA having collected 91.2% of its half year 2017/18 target, and (iii) the Treasury working on a Supplementary Budget that will see reduction of expenditure as development expenditure budget absorption remains below 80.0%, we expect the interest rate environment to remain relatively stable for the rest of the fiscal year. Treasury bonds with the same tenures to maturity are currently trading at a yield of 12.4% and 13.3% in the secondary market, for 5-years and 20-years, respectively, and as such we see the average yield of the bonds coming in between 12.4% and 12.6% for the FXD 1/2018/5 and between 13.2% and 13.4% for the FXD 1/2018/20.
Liquidity levels improved in the market as indicated by the decline in the interbank rate to 4.3% from 4.7% recorded the previous week, and there was an increase in the average volumes traded in the interbank market by 24.4% to Kshs 16.8 bn, from Kshs 13.5 bn the previous week. Larger banks continued to dominate the market, borrowing at the lower rates.
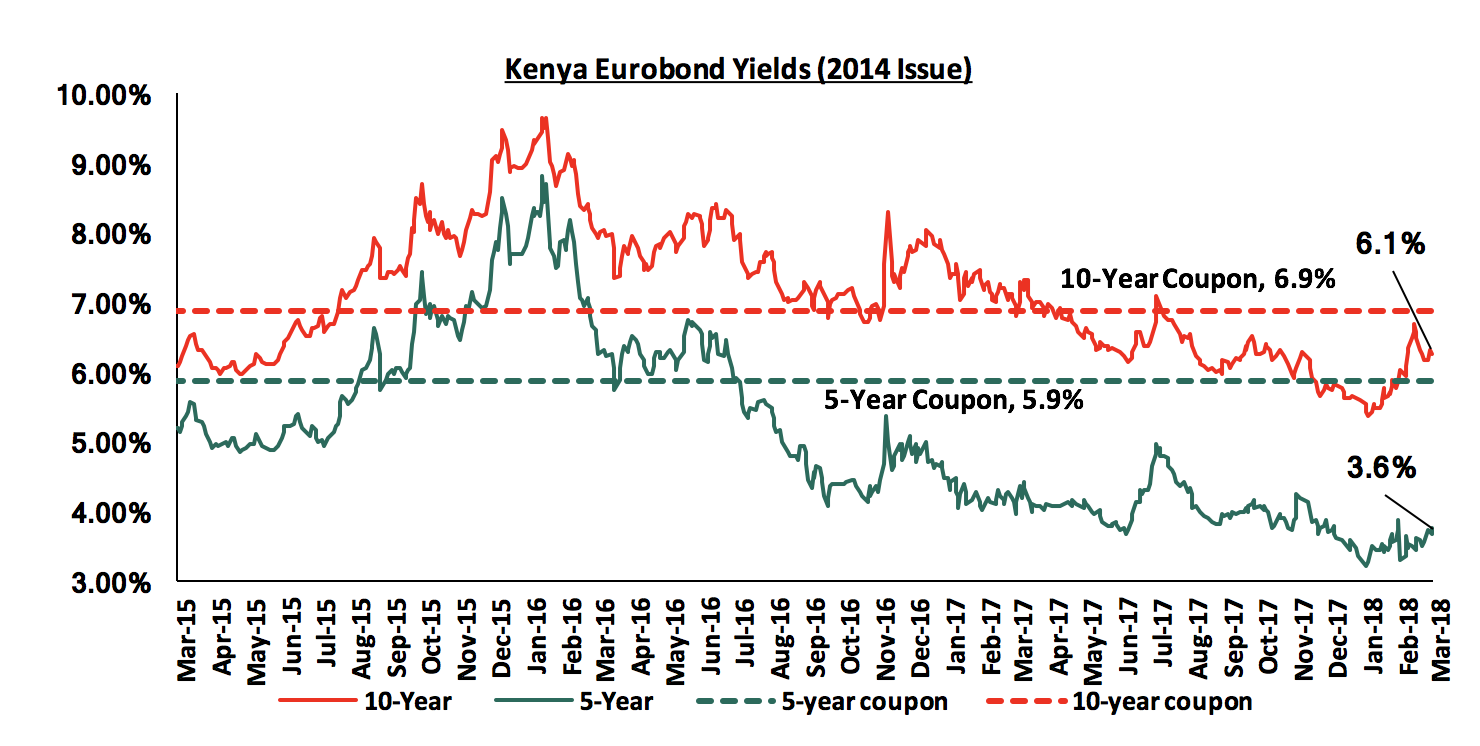
According to Bloomberg, yields on the 5-year and 10-year Eurobonds issued in June 2014 declined by 10 bps each to 3.6% and 6.1% from 3.7% and 6.2%, respectively, the previous week. Since the mid-January 2016 peak, yields on the Kenya Eurobonds have declined by 5.2% points and 3.5% points for the 5-year and 10-year Eurobonds, respectively, due to the relatively stable macroeconomic conditions in the country.
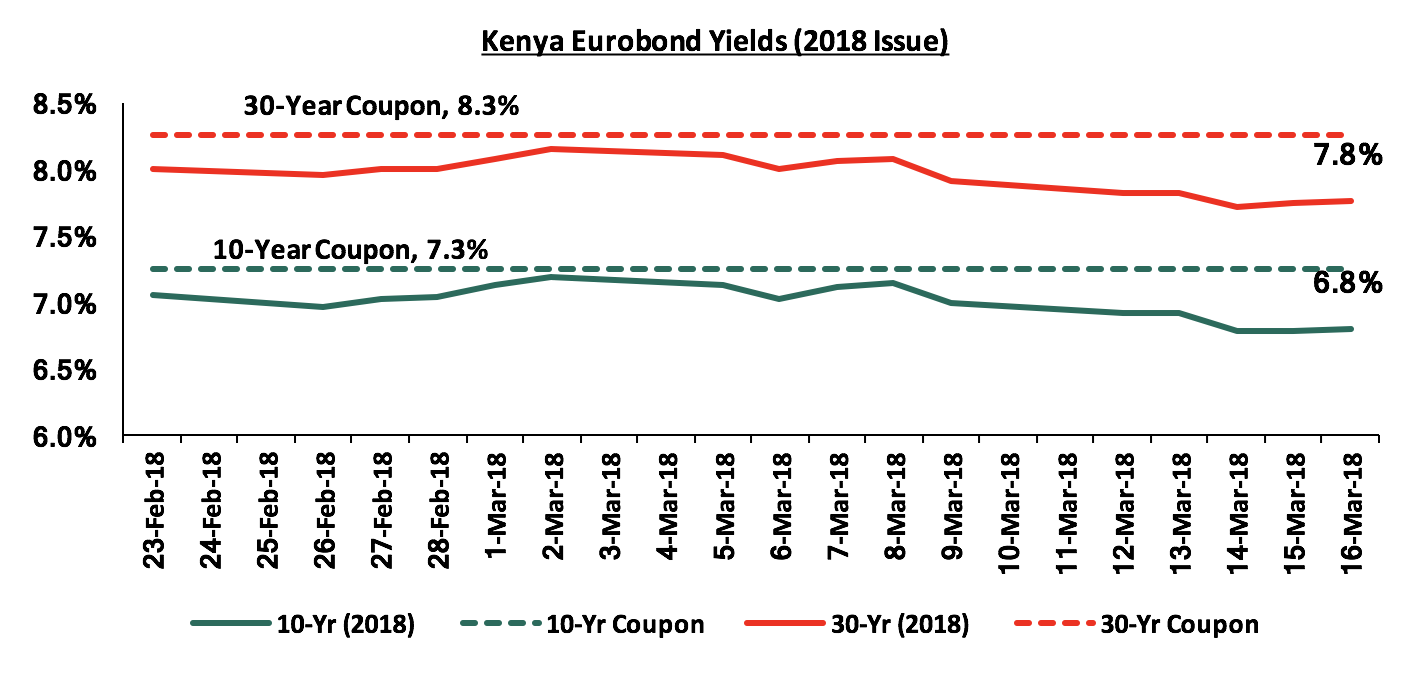
For the February 2018 Eurobond issue, during the week, the yields on the 10-year and 30-year Eurobonds have decreased by 20 bps and 10 bps to close the week at 6.8% and 7.8% from 7.0% and 7.9%, respectively, the previous week. Since the issue date, yields on the 10-year and 30-year Eurobonds have declined by 0.2% points each, indicating foreign investor confidence in Kenya’s strong and relatively diversified economy. Key to note is that last week, Senegal issued two Eurobonds, a 9-year and 29-year, at coupons of 4.8% and 6.8%: 2.5% points and 1.5% points lower than Kenya’s February 2018 issue with nearly similar tenures, respectively. The issue was 4.5x subscribed with bids received worth USD 10.0 bn, against a target of USD 2.2 bn. The lower than recommended yields and the oversubscription is an indication of the growing foreign demand for higher yielding emerging and frontier market bonds.
The Kenya Shilling depreciated marginally by 0.1% against the US Dollar, during the week, to close at Kshs 101.3, from Kshs 101.2 the previous week, due to increased dollar demand from oil importers. On a YTD basis, the shilling has gained 1.8% against the USD. In our view, the shilling should remain relatively stable against the dollar in the short term, supported by:
- Weakening of the USD in the global markets as indicated by the US Dollar Index, which shed 9.9% in 2017, and has shed 2.3% YTD, as the Euro and the Sterling Pound continue to strengthen against the USD with the continued recovery of the Eurozone,
- Improving diaspora remittances, which increased by 26.6% to USD 203.8 mn in December 2017 from USD 160.9 mn in December 2016, driven by a 39.2% and 30.9% increase in remittances from North America and Europe, respectively, and,
- CBK’s intervention activities, as they have sufficient forex reserves, currently at USD 7.2 bn (equivalent to 4.8 months of import cover). Key to note is that the IMF approved Kenya’s request for a 6-month extension on the USD 1.5 bn stand-by credit facility, allowing for completion of outstanding reviews of the program, before discussing a new program. Kenya will now have access to the equivalent of 1-month of import cover for the next 6-months, with the review process expected to end in September 2018. Previously, the IMF had indicated a withdrawal of the facility effective 13th March 2018 as conditions previously agreed upon for the facility to be extended had not been met.
The Monetary Policy Committee (MPC) is set to meet on Monday 19th March 2018 to review the prevailing macroeconomic conditions and give direction on the Central Bank Rate (CBR). We expect the MPC to maintain the CBR at 10.0% due to a relatively stable macro-economic environment, as evidenced by (i) inflation, which eased to 4.5% in February 2018 from 4.8% since the last meeting, and an average of 8.0% in 2017, (ii) the Kenya Shilling, that has appreciated by 1.5% since the last meeting on January 22nd, 2018, and (iii) the expected improvement in economic growth in 2018. For our comprehensive analysis on the same, see our MPC Note.
According to the new monthly prices from the Energy Regulatory Commission (ERC), effective until April 14th, petrol prices are down 0.4% to Kshs 107.5 per litre, while diesel and kerosene prices are both up 0.9% to Kshs 97.9 and Kshs 77.5 per litre, respectively. This was due to a corresponding fall in petrol pump prices by 1.3% to USD 680.1 per tonne, and a 4.2% and 3.5% rise in diesel and kerosene pump prices to USD 618.5 and USD 668.0 per tonne, respectively. The fall in petrol prices is expected to ease the rise in the transport index. Inflation for low income earners however will be on the increase due to the continued rise in kerosene prices, a key cooking fuel among lower income earners, but will receive some reprieve as the ERC has now decided against scrapping the “Lifeline Tariff” that enables lower income households to enjoy subsidized electricity rates paid for by high-income households. We shall be releasing our March inflation projection in the next weekly report.
Rates in the fixed income market have remained stable as the government rejects expensive bids. With the government under no pressure to borrow for this fiscal year as (i) they are currently ahead of their domestic borrowing target by 4.6%, (ii) have met 69.9% of their total foreign borrowing target for the current fiscal year, and (iii) the KRA is not significantly behind target in revenue collection, we expect interest rates to remain stable. With the expectation of a relatively stable interest rate environment, our view is that investors should be biased towards medium to long term fixed income instruments.
During the week, the equities market was on an upward trend, with NASI, NSE 20 and NSE 25 rising 1.9%, 2.2%, and 3.5%, respectively, taking their YTD performance to 7.5%, 2.4% and 11.4% for NASI, NSE 20 and NSE 25, respectively. This week’s performance was due to gains in large cap banking stocks, with Barclays Bank, Equity Group, and KCB Group gaining 7.7%, 6.8% and 4.6%, respectively. For the last twelve months (LTM), NASI, NSE 20 and NSE 25 have gained 47.6%, 28.2%, and 45.5%, respectively.
Equities turnover declined by 11.3% to USD 41.0 mn, from USD 46.2 mn registered last week. We expect the market to remain supported by positive investor sentiment this year, as investors take advantage of the attractive stock valuations on select counters.
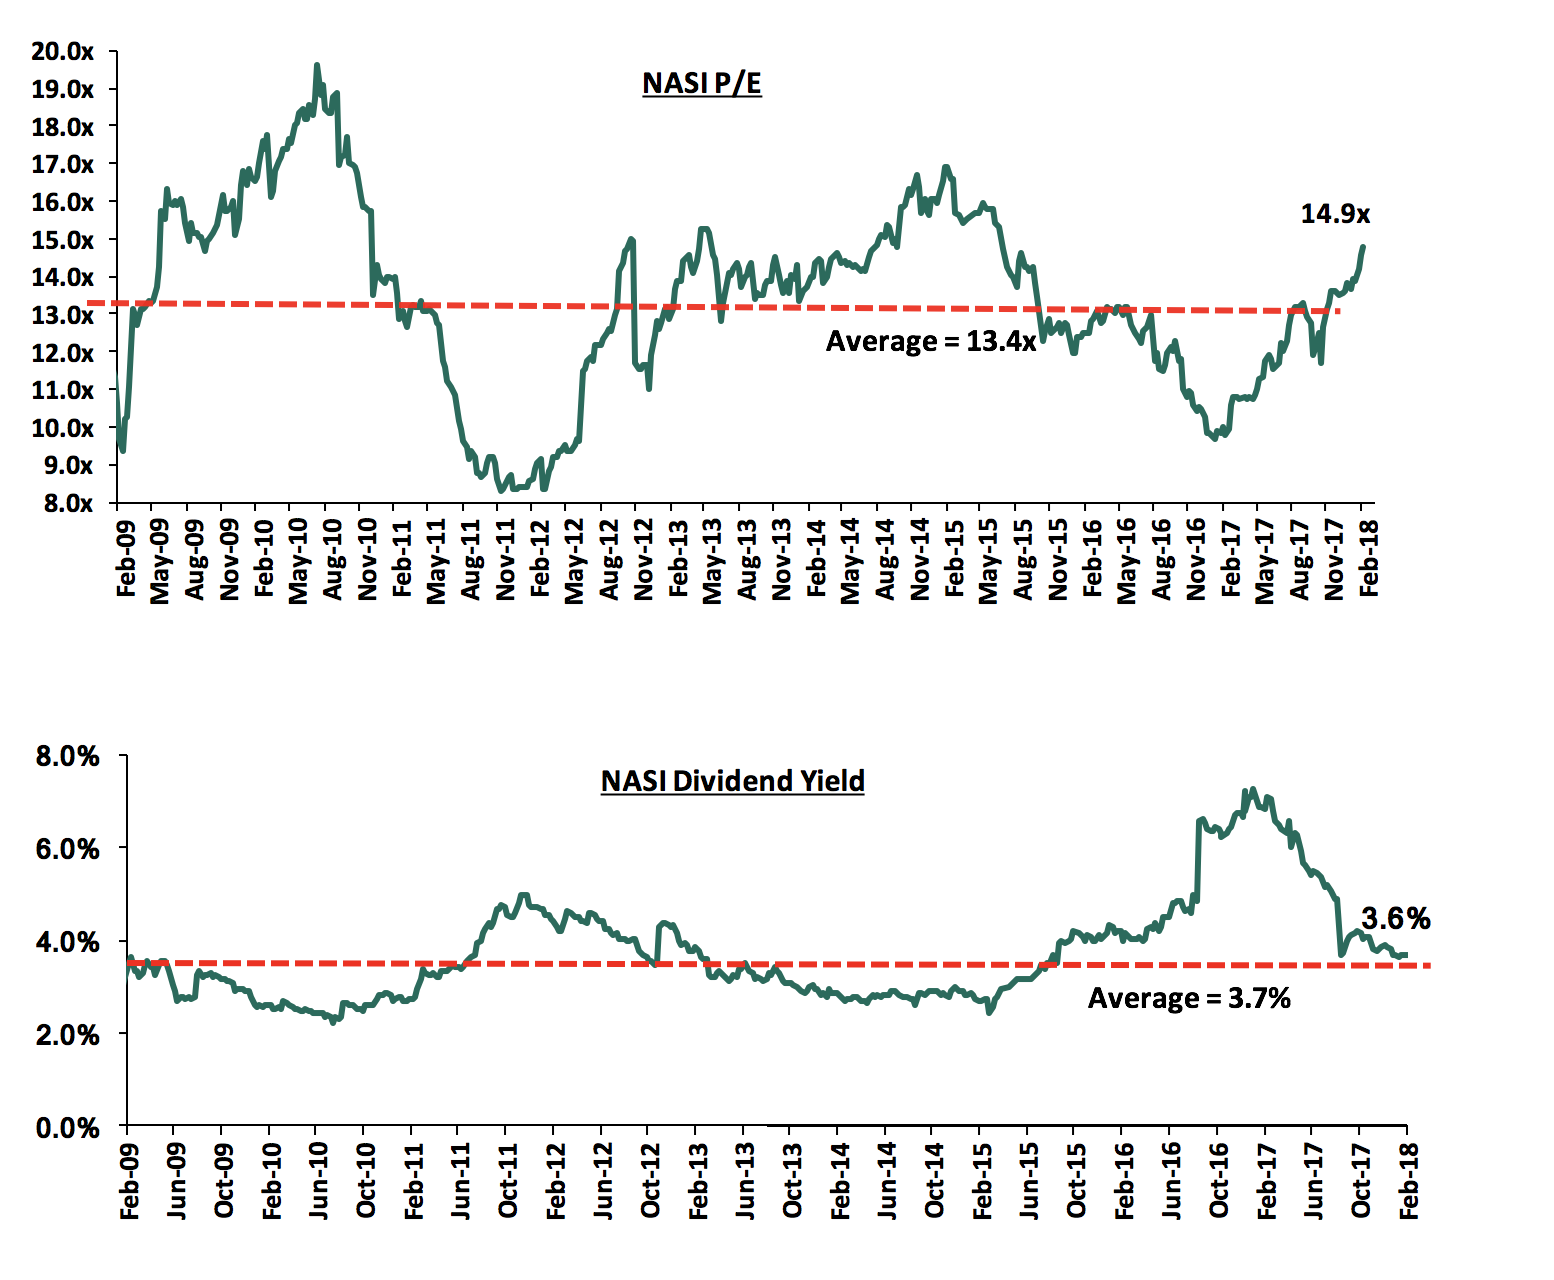
The market is currently trading at a price to earnings ratio (P/E) of 14.9x, which is 11.2% above the historical average of 13.4x, and a dividend yield of 3.6%, slightly below the historical average of 3.7%. The current P/E valuation of 14.9x is 53.6% above the most recent trough valuation of 9.7x experienced in the first week of February 2017, and 79.5% above the previous trough valuation of 8.3x experienced in December 2011.
Stanbic Africa Holdings Ltd (SAHL) has announced plans to increase its shareholding in its subsidiary and Nairobi Stock Exchange listed bank, Stanbic Holdings, through a tender offer (a public offer, made by an investor looking to acquire a given amount of a particular security by inviting the existing stockholders to "tender", or sell, their shares to them at a quoted price). In terms of the transaction:
- SAHL targets to purchase additional 59.0 mn shares, bringing its total shareholding at Stanbic Holding to 296.2 mn shares, representing 74.9% shareholding, from the current 237.2 mn shares, representing 60% shareholding,
- SAHL will pay Kshs 95.0 for each share offered, with the price including the right for SAHL to receive the proposed final dividend of up to Kshs 4.0 per share. The price of Kshs 95.0 per share represents a 14.5% premium on the stock’s average price on the day before the announcement, Kshs 81.2 per share,
- The tender offer will close in two phases, with the first closing on 27th April and the second closing on 18th May, 2018,
- SAHL intends to give preference to shareholders on the register on members on 15th March, 2018, being the date of the Notice of Intention, in respect to shares held by them at that date, up to a maximum of 10,000 Ordinary Shares,
- Following the announcement, the stock price rose by 10.2%, to close the week at Kshs 89.5. As such, the premium is now at 6.1%,
- As per the FY’2017 results, Stanbic Holdings has a Tangible Book Value of Kshs 32.3 bn and recorded Earnings of Kshs 4.3 bn. As such the share acquisitions will be done at a P/TBv multiple of 1.2x and a P/E multiple of 8.7x vs a market average of Kenya’s Banking sector of 1.6x and 9.3x, P/TBv and P/E multiples, respectively. The transaction will be carried out below the average P/TBv of previous acquisitions in the banking sector of 1.9x, as per the table below:
|
Acquirer |
Bank Acquired |
Book Value at Acquisition (Kshs bn) |
Transaction Stake |
Transaction Value (Kshs bn) |
P/BV Multiple |
Date |
|
Stanbic Africa Holdings |
Stanbic Holdings |
42.96 |
14.9% |
5.61 |
1.2x |
Mar-18 |
|
Diamond Trust Bank Kenya |
Habib Bank Limited Kenya |
2.38 |
100.0% |
1.82 |
0.8x |
Mar-17 |
|
SBM Holdings |
Fidelity Commercial Bank |
1.75 |
100.0% |
2.75 |
1.6x |
Nov-16 |
|
M Bank |
Oriental Commercial Bank |
1.80 |
51.0% |
1.30 |
1.4x |
Jun-16 |
|
I&M Holdings |
Giro Commercial Bank |
2.95 |
100.0% |
5.00 |
1.7x |
Jun-16 |
|
Mwalimu SACCO |
Equatorial Commercial Bank |
1.15 |
75.0% |
2.60 |
2.3x |
Mar-15 |
|
Centum |
K-Rep Bank |
2.08 |
66.0% |
2.50 |
1.8x |
Jul-14 |
|
GT Bank |
Fina Bank Group |
3.86 |
70.0% |
8.60 |
3.2x |
Nov-13 |
|
Average |
72.1% |
1.9x |
||||
Conclusion: As per our research, Stanbic Holdings target price is Kshs 79.0 per share. Given this, we are of the view that Stanbic Shareholders should participate in the tender offer at Kshs 95.0 per share, and benefit from the 6.1% premium on the current share price of Kshs 89.5.
Co-operative Bank released FY’2017 results during the week
Co-operative Bank released FY’2017 results, registering a 10.0% decline in its core earnings per share to Kshs 1.9 from Kshs 2.2 in FY’2016, lower than our expectation of a 1.1% decline. The performance was impacted by a 1.6% decline in operating income, coupled with a 2.8% increase in operating expenses.
Highlights for the performance from FY’2016 to FY’2017 include:
- Total operating revenue declined by 1.6% to Kshs 41.6 bn from Kshs 42.3 bn, driven by a 4.7% decline in Net Interest Income (NII), despite a 5.6% increase in Non-Funded Income (NFI). NII declined by 4.7% to Kshs 28.1 bn from Kshs 29.5 bn in FY'2016, while NFI rose 5.6% to Kshs 13.5 bn from Kshs 12.8 bn in FY'2016,
- Interest Income declined by 4.5% to Kshs 40.4 bn from Kshs 42.4 bn in FY’2016. The interest income on loans and advances alone declined by 4.5% y/y to Kshs 31.9 bn from Kshs 33.4 bn, while interest income on government securities declined by 3.3% y/y to Kshs 8.2 bn from Kshs 8.5 bn. As a result, the yield on interest-earning assets declined to 11.9% from 13.9% in FY’2016,
- Interest expense decreased by 3.9% to Kshs 12.3 bn from Kshs 12.8 bn in FY’2016, following a 7.0% decline in interest expense on customer deposits to Kshs 10.8 bn from Kshs 11.7 bn, thus bringing down the cost of funds to 4.1% from 4.5% in FY’2016. The Net Interest Income declined by 4.7% to Kshs 28.1 bn from Kshs 29.5 bn leading to a decline in the Net Interest Margin to 9.2% from 9.9% in FY'2016,
- Non-Funded Income (NFI) recorded a growth of 5.6% to Kshs 13.5 bn from Kshs 12.8 bn in FY'2016. The growth in NFI was driven by an 11.5% increase in fees and commissions to Kshs 2.6 bn from Kshs 2.3 bn in FY'2016, and a 23.5% y/y increase in forex income to Kshs 2.2 bn from Kshs 1.8 bn. The current revenue mix stands at 68:32 funded to non-funded income from 70:30 in FY’2016, with the proportion of NFI increasing following the decline in Net Interest Income coupled with the increase in NFI,
- Total operating expenses increased by 2.8% to Kshs 25.3 bn from Kshs 24.6 bn, driven by a 38.5% increase in Loan Loss Provisions to Kshs 3.6 bn from Kshs 2.6 bn in FY'2016, coupled with a 7.5% increase in staff costs to Kshs 10.1 bn from Kshs 9.4 bn in FY'2016. Other operating expenses declined by 13.6% to Kshs 7.4 bn from Kshs 8.6 bn in FY'2016,
- The Cost to Income ratio deteriorated to 61% from 58% in FY'2016. Without LLP, the Cost to Income ratio remained unchanged at 52%,
- Profit before tax declined by 7.3% to Kshs 16.4 bn from Kshs 17.7 bn while profit after tax declined by 10% to Kshs 11.4 bn from Kshs 12.7 bn in FY’2016,
- The bank recommends a first and final dividend of Kshs 0.8 per share, unchanged from 2016, translating to a dividend yield of 4.2%,
- The total assets grew by 9.9% to Kshs 386.9 bn from Kshs 351.9 bn in FY'2016. This growth was driven by a 7.1% growth in the loan book to Kshs 253.9 bn from Kshs 236.9 bn in FY’2016. Investment in government and other securities grew by 19.7% to Kshs 69.2 bn from Kshs 57.8 bn in FY'2016,
- Total liabilities rose by 8.9% to Kshs 316.6 bn from Kshs 290.7 bn in FY'2016, driven by a 9.2% increase in deposits to Kshs 263.6 bn from Kshs 287.7 bn in FY'2016. Deposits per branch increased 8.6% to Kshs 1.9 bn from Kshs 1.8 bn in FY’2016,
- The faster growth in deposits compared to the loan book led to a decline in the loan to deposit ratio to 88.2% from 89.9% in FY'2016,
- Gross non-performing loans increased by 66.4% to Kshs 18.8 bn from Kshs 11.3 bn, owing to increase in NPLs in the Trade sector and the Real Estate sector. The NPL ratio thus deteriorated to 7.0% from 4.3% in FY’2016, due to the faster growth NPLs compared to the loan book growth,
- Shareholders’ funds increased by 13.5% to Kshs 61.3 bn from Kshs 69.6 bn in FY’2016, due to a 14.8% increase in retained earnings to Kshs 55.3 bn from Kshs 48.2 bn,
- Co-operative Bank is currently sufficiently capitalized with a core capital to risk weighted assets ratio at 15.8%, 5.3% above the statutory requirement, with total capital to total risk weighted assets at 22.0%, exceeding statutory requirement by 7.5%.
Going forward, we expect Co-operative Bank’s growth to be propelled by;
- Channel diversification to more efficient and customer convenient channels such as mobile and digital channels that allow for more transactional fee-based income, thus increasing its Non-Funded Income,
- Improvements in asset quality, with the increase in NPLs causing Co-operative Bank’s Gross Non-Performing Loans ratio to deteriorate to 7.0%, which is however still below peer average of 8.2%.
For a comprehensive analysis, see our Co-operative Bank FY’2017 Earnings Note.
Below is a summary of the FY’2017 results for the three listed banks that have released, and key take-outs from the results:
|
Listed Banks FY'2017 Earnings and Growth Metrics |
||||||||||
|
Bank |
Core EPS Growth |
Interest Income Growth |
Interest Expense Growth |
Net Interest Income Growth |
Non-Funded Income (NFI) Growth |
NFI to Total Operating Income |
Growth in Total Fees& Commissions |
Deposit Growth |
Loan Growth |
Growth in Govt. Securities |
|
KCB Bank |
(0.1%) |
1.4% |
(3.1%) |
2.9% |
2.5% |
32.2% |
16.4% |
11.5% |
9.6% |
7.4% |
|
Stanbic |
(2.5%) |
(3.0%) |
(5.3%) |
(2.0%) |
10.0% |
44.2% |
38.6% |
24.1% |
8.1% |
42.6% |
|
Barclays Bank |
(6.4%) |
(3.4%) |
(7.2%) |
(2.4%) |
(9.5%) |
27.9% |
8.6% |
12.5% |
(0.7%) |
20.1% |
|
Co-op Bank |
(10.0) |
(4.5%) |
(3.9%) |
(4.7%) |
5.6% |
32.4% |
0.3% |
9.2% |
7.1% |
19.7% |
|
Weighted Average |
(4.4%) |
(1.7%) |
(4.3%) |
(0.8%) |
2.0% |
32.7% |
12.3% |
12.2% |
6.9% |
16.7% |
|
* *The weighted average is based on Market Cap as at 16th March, 2018 |
||||||||||
Key takeaways:
- None of the 4 banks has recorded a growth in core earnings per share, with the average decline in core earnings across the banking sector at 4.4%, owing to the tough operating environment as a result of the interest rate caps and political uncertainty in the country that affected the business environment,
- Average deposit growth came in at 12.2%. However, despite the average deposits having grown, the interest expense paid on deposits recorded a negative growth of 4.3% on average, indicating that banks are growing deposits but opening less interest earning accounts and possibly transferring some existing interest earning accounts to transaction accounts,
- Average loan growth has been recorded at 6.9%, however interest income has decreased by 1.7%, showing the effects of the rate cap,
- Investment in government securities has grown by 16.7%, outpacing loan growth of 6.9%, showing increased lending to the government by banks as they avoid the risky borrowers,
- Non-funded income has however grown by 2.0%, which included a Fee and Commissions growth of 12.3%. This shows that banks are charging more fee income to improve their income on loans above the rate cap maximum.
Helios Towers Plc, a telecommunications tower infrastructure company, whose Africa’s operations are headquartered in South Africa, is planning for an Initial Public Offering in Q2’2018. Helios Towers Plc is looking to sell its shares in the London Stock Exchange and Johannesburg Stock Exchange, targeting to have at least 25% of its 909.1 mn shares freely traded after the listing. This highlights the opportunities available for African firms to list in global markets, especially the London Stock Exchange (LSE), with Kenya’s National Oil Corporation also planning to list at the LSE in 2019.
In an effort to keep our rankings of companies on the Cytonn Corporate Governance Ranking (Cytonn CGR) Report up-to-date, we continually update the rankings whenever there are changes on any of the 24 metrics that we track, and how this affects the company ranking. This week, Kenya Re’s Mr. Michael Mbeshi replaced Mr. Jadiah Mwarania as Managing Director and Executive Director in the Board. The change in Executive Director did not have a change in the metrics that we track, and thus Kenya Re maintains its 34th Position with a score of 60.4%.
Below is our Equities Universe of Banking Coverage:
|
all prices in Kshs unless stated otherwise |
|||||||||||||
|
No. |
Company |
Price as at 9/03/18 |
Price as at 16/03/18 |
w/w Change |
YTD Change |
LTM Change |
Target Price* |
Dividend Yield |
Upside/ (Downside)** |
P/TBv Multiple |
|||
|
1. |
NIC Bank*** |
37.5 |
37.3 |
(0.7%) |
4.4% |
63.7% |
61.4 |
3.4% |
68.2% |
0.7x |
|||
|
2. |
Ghana Commercial |
4.8 |
5.3 |
10.7% |
4.2% |
6.0% |
7.7 |
7.2% |
54.0% |
1.3x |
|||
|
3. |
Diamond Trust Bank |
210.0 |
215.0 |
2.4% |
9.4% |
100.9% |
281.7 |
1.2% |
32.2% |
1.1x |
|||
|
4. |
Zenith Bank |
30.9 |
27.8 |
(10.0%) |
8.4% |
91.1% |
33.3 |
10.7% |
30.5% |
1.2x |
|||
|
5. |
CRDB |
190.0 |
170.0 |
(10.5%) |
6.3% |
(8.1%) |
207.7 |
5.6% |
27.7% |
0.6x |
|||
|
6. |
Stanbic Bank Uganda |
29.0 |
29.0 |
0.0% |
6.4% |
13.7% |
36.3 |
0.0% |
25.1% |
2.0x |
|||
|
7. |
I&M Holdings |
120.0 |
124.0 |
3.3% |
(8.7%) |
47.6% |
150.4 |
2.8% |
24.1% |
1.4x |
|||
|
8. |
KCB Group |
48.8 |
51.0 |
4.6% |
6.4% |
72.9% |
59.7 |
5.9% |
22.9% |
1.6x |
|||
|
9. |
Union Bank Plc |
7.1 |
6.7 |
(5.6%) |
(14.1%) |
57.6% |
8.2 |
0.0% |
21.6% |
0.7x |
|||
|
10. |
Barclays |
11.1 |
12.0 |
7.7% |
13.0% |
37.4% |
12.8 |
8.4% |
15.5% |
1.6x |
|||
|
11. |
HF Group*** |
10.5 |
10.8 |
2.9% |
(1.4%) |
(5.3%) |
11.7 |
4.6% |
13.0% |
0.4x |
|||
|
12. |
CAL Bank |
1.3 |
1.2 |
(3.9%) |
14.8% |
67.6% |
1.4 |
0.0% |
12.9% |
1.2x |
|||
|
13. |
Bank of Baroda |
116.0 |
120.0 |
3.4% |
6.2% |
9.1% |
130.6 |
0.0% |
8.8% |
1.1x |
|||
|
14. |
Bank of Kigali |
295.0 |
295.0 |
0.0% |
(1.7%) |
21.9% |
299.9 |
4.2% |
5.8% |
1.7x |
|||
|
15. |
Ecobank |
11.6 |
11.0 |
(5.1%) |
44.9% |
51.9% |
10.7 |
7.5% |
4.9% |
3.7x |
|||
|
16. |
Stanchart KE |
209.0 |
213.0 |
1.9% |
0.0% |
6.5% |
201.1 |
8.7% |
3.1% |
1.7x |
|||
|
17. |
UBA Bank |
12.9 |
11.2 |
(13.2%) |
8.7% |
107.4% |
10.7 |
6.7% |
2.2% |
0.9x |
|||
|
18. |
Co-operative Bank |
18.8 |
19.0 |
1.1% |
7.5% |
76.7% |
18.6 |
4.2% |
2.1% |
1.7x |
|||
|
19. |
Stanbic Holdings |
82.0 |
89.5 |
9.1% |
1.9% |
36.6% |
79.0 |
5.9% |
(5.9%) |
1.1x |
|||
|
20. |
Guaranty Trust Bank |
47.7 |
44.9 |
(6.0%) |
10.1% |
73.8% |
37.2 |
6.0% |
(11.0%) |
2.5x |
|||
|
21. |
Access Bank |
13.0 |
11.7 |
(10.4%) |
11.5% |
79.0% |
9.5 |
5.6% |
(12.9%) |
0.7x |
|||
|
22. |
SBM Holdings |
7.6 |
7.7 |
0.8% |
2.1% |
9.4% |
6.6 |
1.3% |
(13.1%) |
0.9x |
|||
|
23. |
Equity Group |
47.8 |
51.0 |
6.8% |
7.5% |
80.5% |
42.3 |
3.9% |
(13.1%) |
2.3x |
|||
|
24. |
Stanbic IBTC Holdings |
48.5 |
50.0 |
3.1% |
16.8% |
170.3% |
37.0 |
1.0% |
(25.0%) |
3.1x |
|||
|
25. |
National Bank |
8.6 |
8.8 |
1.7% |
(11.2%) |
47.1% |
5.6 |
0.0% |
(36.0%) |
0.3x |
|||
|
26. |
Stanchart- Ghana |
34.5 |
34.9 |
1.1% |
38.1% |
126.8% |
19.5 |
3.2% |
(41.0%) |
5.0x |
|||
|
27. |
FBN Holdings |
11.6 |
11.7 |
0.9% |
32.4% |
278.2% |
6.6 |
1.7% |
(41.4%) |
0.7x |
|||
|
28. |
Ecobank Transnational |
19.8 |
19.8 |
0.0% |
16.5% |
102.0% |
9.3 |
3.1% |
(50.0%) |
0.9x |
|||
|
|
*Target Price as per Cytonn Analyst estimates |
||||||||||||
|
|
**Upside / (Downside) is adjusted for Dividend Yield |
||||||||||||
|
|
***Banks in which Cytonn and/or its affiliates holds a stake. For full disclosure, Cytonn and/or its affiliates holds a significant stake in NIC Bank, ranking as the 5th largest shareholder |
||||||||||||
We are “NEUTRAL” on equities for investors with a short-term investment horizon since the market has rallied and brought the market P/E slightly above its’ historical average. However, pockets of value exist, with a number of undervalued sectors like Financial Services, and with expectations of higher corporate earnings this year, the market will be cheaper for long-term investors, hence we are “POSITIVE” for investors with a long-term horizon.
During the week, the County Government of Nairobi, through Acting County Secretary Leboo Morintat, requested prospective partners to submit letters of interest, innovative designs and proposals for redevelopment of at least 26 slums in Nairobi, including Kibera, Mukuru, Huruma, among others. The target is to provide low cost housing units, improve on sanitation, and improve security in the areas. This is part of the Urban Regeneration of Informal Settlements Programme, which is being carried out by the County Government of Nairobi. The successful investors will be tasked with mobilising finances, technology and managerial expertise to roll out the programme. The programme, if successful, will improve slum dwellers living standards, provide better infrastructural amenities and help reduce the housing deficit currently at approximately 2 mn units growing by 200,000 units p.a. according to the National Housing Corporation (NHC). The programme falls under one of Kenyan Government’s Big Four Pillar of Affordable Housing, in which, they seek to reduce the housing deficit by constructing 500,000 houses over the next 5-years, mainly through Public – Private Partnerships (PPP’s). This is the latest proposal request, with a previous one issued in 2017, resulting in 35 consultants being selected to work with the government on the proposed affordable housing project in Mavoko. However, similar projects launched by the Kenyan Government such as the Urban Renewal Programme to upgrade the county’s old estates such as Ngara, Suna, Uhoro, Ngong Road Inspectorate, and Jevanjee – Bachelor, through PPP’s announced in 2016, and a project to construct Embu University, Kenyatta University (K.U) and Moi University hostels announced in 2017 are all yet to kick off. The key constraints being the lack of a framework to enable transfer of public land into special purpose vehicles required to enable PPP’s to attract private capital and bank debt into projects. We therefore remain sceptical on the success of the initiatives, based on the above challenge.
The increase in the number of buildings collapsing has come to the forefront in the real estate sector, with three buildings collapsing during the week: (i) a four-storey building in Kariobangi South, (ii) a five-storey building in Orion Estate – Juja, and (iii) a four-storey building in Ruai that contained a restaurant and a lodging. This follows various similar incidences in the past, such as a six-storey building in Huruma in 2016, a four-storey building in Zimmerman and a seven-storey building in Kware Pipeline Estate in 2017.
The factors leading to buildings’ collapse are mainly:
- Weak Foundations - For example, in swampy areas, the foundations can cost up to twice the construction cost compared to normal ground. Developers thus escape this by laying the substructure on hard-core instead of reinforced concrete strip footings,
- Use of Sub-Standard Materials - Some contractors use scrap metal instead of steel to cut on costs,
- Poor Quality of Concrete - Specifications for good mix of concrete are mostly ignored, and there is use of poor quality concrete materials, which affect the strength of the building,
- Poor Workmanship - Contractors employ unskilled workers to cut on construction costs,
- Poor Regulation - Strength of the buildings are not tested, and most small-scale developers don’t get building and construction permits, and,
- Poor Planning of the Cities / Towns - Buildings are built on unsafe grounds such as swampy areas and near water banks.
The National Construction Authority (NCA) and National Building Inspectorate need to put strict regulations such as frequent inspections, training of artisans, easing the building approval process by reducing costs and time and ensure they are adhered to, and demolish the substandard developments, currently approximately 1,476 buildings in Nairobi, according to National Buildings Inspectorate Audit 2016, in order to reduce these incidences. They will however need to build capacity, automate processes and get support from both the County Government’s and the contractors to do so. Until the above measures are implemented, the trend of buildings collapsing in Kenya is likely to continue.
During the week, Nielsen, a global consumer research firm, released the Nielsen Consumer Confidence and Spending Intentions Survey 2018, which looks at consumer attitudes about the job market, spending intentions and changing habits. According to the report, there is a huge gap in e-commerce in Kenya where approximately 25.0% of consumers shop and find out about fast moving consumer goods brands online. This indicates that retailers should adapt to changing needs and demand for products and shopping experience by embracing e-commerce, hence meeting consumer needs for speed, efficiency and convenience. This is consistent with the Consumer Connected Study 2017 by Google Africa, which indicates a 14.0%-point rise in online shopping from the 3.0% in 2014 to the 17.0% in 2017. In our view, due to increased technology adoption, and a large internet penetration at 89.4% according to the Communications Authority of Kenya (CAK), we expect to witness an increase in online shopping. This will lead to both positive and negative impact in the market. On the positive side, it will (i) increase efficiency and convenience for clients, (ii) increase the retailers’ reach to a larger population compared to traditional retail shops, and (iii) decrease retailer’s operational costs, through a decrease in number of stores and employees hence increase on returns. On the other hand, this may lead to a decrease in retail space occupancies, which are currently at 80.3% as demand for traditional shops decrease.
We expect the real estate sector, to continue its upward growth, especially middle to low income residential sector, backed by the government’s support, as it targets to provide affordable housing units to the public as one of the key pillars of its big four strategy for 2018-2022.
In a bid to offer a diversified investment portfolio to our clients, Cytonn has been conducting comprehensive studies in various markets across Africa in our key focus areas of real estate, banking, education, and hospitality. We have so far released the following reports:
- Kampala Real Estate Investment Opportunity in September 2017,
- Accra Real Estate Investment Opportunity in November 2017,
- Sub-Saharan Africa Financial Services Report in November 2017,
- Kigali Rwanda Real Estate Report in February 2018.
This week, we turn our focus to Tanzania with a focus on Dar es Salaam, its largest city and commercial hub, where we conducted real estate research with a focus on the performance of its residential, commercial office, retail and hospitality sectors. We cover the following areas:
- The macro-economic overview of Tanzania and Dar es Salaam city,
- Overview of real estate market in Tanzania,
- Factors driving real estate and challenges facing the sector in Dar es Salaam,
- We then delve into the real estate thematic performance for Dar es Salaam,
- We compare the market to other markets in Sub-Saharan Africa including Nairobi, Kampala, Accra, and Kigali,
- We then conclude with our outlook on the Dar es Salaam real estate investment opportunity.
i. Tanzania Overview
Located in East Africa, Tanzania is one of the largest countries in Africa with an area of 947,303 SQKM and the second highest population in Eastern Africa, with a current population of 56.9 mn, after Ethiopia, which has a population of 102.4 mn. In comparison, Kenya has a population of 48.5 mn. The population has been growing at a five-year CAGR of 3.1%, compared to the global average of 1.2% p.a. It also has a relatively high urban population of 32.3% compared to Kenya’s 26.5%, Rwanda’s 29.8% and Uganda’s 18.0%, with an urbanization rate of 5.3% p.a compared to the global average of 2.1% p.a. The United Republic of Tanzania is composed of mainland Tanzania and the semi-autonomous Zanzibar Island and while the capital city is Dodoma, the main economic city is Dar es Salaam. Tanzania is bordered by Kenya, Burundi, DRC Congo, Zimbabwe, Rwanda, Mozambique, Malawi, Zambia, and Uganda as well as the Indian Ocean to the East.
Economically, Tanzania has had one of the strongest economic growths in Sub-Saharan Africa with a GDP growth rate averaging at 6.6% for the period 2012-2016, and a marginal decline to 6.5% expected for 2017. The trend is however, expected to continue in 2018 and 2019, with World Bank projecting 6.8% and 6.9%, respectively. The stable economic growth is supported by the mining, construction, financial services, and information and communication sectors. As at 2017, the service sector, entailing real estate, accommodation, and finance industries, has been the largest contributor to GDP with a 42.0% share, while agriculture, forestry, and fishing accounted for 31.0% and the industrial and construction sectors accounted for 27.0% of the GDP. In comparison, Kenya’s service sector accounted for 50.8% of the GDP, agriculture, forestry and fishing accounted for 23.1%, with the industrial and construction sector accounted for 13.8%.
Dar es Salaam Overview
Dar es Salaam is the largest city and main economic hub of Tanzania. It has an area of 1,590 SQKM, as per United Nations data, with a population of 5.1 mn as at 2017 according to the African Development Bank, resulting in a population density of 3,661 persons per SQKM. Dar es Salaam served as Tanzania’s capital city up to 1996, before the capital city function was moved to Dodoma. The city has the second largest port in Eastern Africa after Kenya’s Mombasa. The main drivers of the economy in Dar es Salaam are the financial services, transport, manufacturing and tourism sectors.
Services & Amenities
Dar es Salaam is served by major roads such as Ali Hassan Mwinyi, Nyerere, Bagamoyo, Morogoro and Kilwa roads, which are in a good state of repair. It is also served by a 6-phased Bus Rapid Transit System (BRTS), with Phase 1 of the project consisting of 29 stations having being completed in 2015. This has helped to ease congestion in the city and also opened up the area for development. Ferry services are also common especially for transit to surrounding islands, while the newly constructed 680-meter-long Kigamboni Bridge, which was completed in 2016, links the district of Kigamboni and Dar es Salaam’s CBD at Kurasini.
Electricity is provided by Tanzania Electric Supply Company Limited (TANESCO), which accounts for approximately 60% of the total power generation, while other players include US-based Symbion, and Tanzanian Firms Independent Power Tanzania and Songas, which account for the remaining 40%. Water and sewerage disposal services are provided by Dar es Salaam Water & Sewerage Corporation (DAWASCO).
ii. Overview of Real Estate in Tanzania
A bulk of real estate property, especially housing, in Tanzania is dominated by individual home-builders who account for over 70.0% of the total supply. The public sector through local governments, National Housing Corporation, Tanzania Building Agency, Watumishi Housing and pension funds such as National Social Security Fund (NSSF), account for approximately 12.6% of the supply while residential private developers cater for approximately 3.9%. The housing demand is estimated to grow by 200,000 units annually with the cumulative deficit currently at 3.0 mn units, according to National Housing Corporation (NHC).
The sector contributed to 3.8% of Tanzania’s GDP in H1’2017, a decline from 4.0% during the same period in 2016 while its growth softened to 2.3% in H1’2017, from a 2.4% growth in H1’2016. Similarly, the construction sector’s growth declined to 8.6% in H1’2017 compared to a 10.0% growth in the same period in 2016. The decline in growth of the two sectors is attributable to tight liquidity, inadequate infrastructural development and slowed real estate uptake following a tough macroeconomic environment.
iii. Factors Driving Real Estate in Dar es Salaam
Majority of Dar es Salaam’s investment grade real estate is developed by government entities through the National Housing Corporation, Tanzania Building Agency, and pension bodies. The sector has however seen an increase in private developers with players such as Avic, Nevada Properties, Quality Group, Shamo Group, Actis, and GSM Group, among others, carrying out developments.
The factors driving growth of real estate in Dar es Salaam include:
- Stable Economic Growth: Tanzania has had one of the fastest growing economies with GDP growth averaging at 6.6% annually since 2012 driven mainly by growth in mining, construction, financial services, and information and communication sectors. The World Bank projects a GDP growth rate of 6.5% for 2017, a decline of 0.5% points from 7.0% in 2016, attributable to the government’s ban on export of raw minerals and ores for metallic minerals. However, this is expected to pick up in 2018 and 2019, with projections of 6.8% and 6.9%, respectively, premised on the recovery of the global commodity prices, scaled-up investments in public infrastructure and a tightening trade deficit with a drop in imports,
- Influx of Multinational Players: The discovery of gas in 2015 and the presence of a seaport has attracted multinational companies in the transport, manufacturing and mining sectors, who demand institutional grade real estate including housing, offices, retail as well as hospitality facilities,
- Positive Demographic Dividend: Tanzania has a population of 56.9 mn people growing at 3.1% p.a., compared to the global average of 1.2% p.a. and East African average of 2.9% p.a. This translates to a density of 60.5 people per SQKM (Kenya has 87 people per SQKM). 32.3% of its population is urban and growing at 5.3% p.a. compared to the global average of 2.1% p.a. and East African average of 5.1% p.a, thus creating demand for real estate,
- Infrastructural Development: The government has invested in infrastructure through construction of roads to remote areas such as Kigamboni through construction of the Kigamboni Bridge, implementation of the Bus Rapid Transit System and ongoing construction of a Standard Gauge Railway to ease accessibility, thus boosting real estate growth in out of town areas,
- Institutional Funds: Government corporations such as National Housing Corporation (NHC) and Watumishi Housing, pension schemes such as National Social Security Fund (NSSF), Government employees pension Fund (GEPF), Local Authorities Pension Fund (LAPF), among others, have been at the forefront of real estate investments. As per the Social Security Regulatory Authority investment guidelines, pension schemes are mandated to invest a maximum of30% of their funds in real estate. As at 2017, NHC accounted for 70% of all housing in Dar es Salaam,
- Housing Deficit: As per the National Housing Corporation, housing deficit in Tanzania stands at an approximately cumulative 3.0 mn units and expanding by 200,000 units per annum. The gap has attracted interest from both the public and private players especially for lower-mid end and low-end segments, evidenced by the various masterplan communities by NHC, Watumishi Housing, Avic, across the country.
The real estate sector has been facing fundamental challenges, among them:
- Access to Credit: Credit growth fell from 24.8% in 2015 to 7.2% in 2016 and to 0.3% in August 2017, attributable to a rise in the risk premium due to an increase in non-performing loans and thus banks preferred to lend to the Tanzanian Government. Despite the Bank of Tanzania lowering the monetary policy rate to 9.0% in H2’2017, banks still charge relatively high interest rates reaching highs of 17% - 21% p.a. and a 5-year average of 16.1% p.a., thus limiting the uptake of mortgages, which affects property purchases. The Mortgage to GDP ratio in Tanzania stood at 0.5% as at 2016 compared to Kenya at 2.7% and Uganda at 0.9% in the same period,
- Unfavourable Government Policies: The implementation of austerity measures such as surplus income cuts for government employees thus restricting their property purchasing capabilities, as well as a strict new tax regime by the new government since 2015 resulting in reduced spending, leading to low purchasing power of real estate consumers. It has also resulted in the closure of firms and scaling back of multinational firms. The imposed 18% VAT on all property purchases increases the cost of buying property, limiting affordability, compared to countries such as Kenya where VAT is only imposed on commercial real estate purchases,
- Insufficient Infrastructure: Various parts of Dar es Salaam such as Mwenge, parts of Mikocheni and Kigamboni lack requisite infrastructure such as adequate water connection, mains sewers, mains electricity and proper road access hindering the growth of real estate as developers have to incur extra costs to provide these services.
iv. Real Estate Market Performance
|
Real Estate Performance Summary 2018 – Dar es Salaam |
||||
|
Theme |
Average Rent per SQM (USD) |
Average Price per SQM (USD) |
Average Occupancy Rates |
Average Rental Yield |
|
Retail Sector |
20.0 |
2,200.0 |
87.1% |
9.4% |
|
Office Sector |
15.0 |
2,200.0 |
72.1% |
6.4% |
|
Residential Sector |
5.3 |
902.0 |
79.5% |
5.2% |
|
Hotels |
59.8% |
|||
|
Average |
74.6% |
7.0% |
||
|
· The retail sector has higher returns to investors with an average rental yield of 9.4% compared to commercial office’s 6.4% and the residential sector at 5.2%. This is due to the high occupancy rates of 87.1%, indicating demand for retail space · The performance of the office sector has recorded increasing vacancy rates due to the exit of multinationals, migration of government offices to Dodoma and the increasing supply, thus relatively lower yields at 6.4% with 72.1% occupancy · The residential sector has seen a reduction in rents and prices due to reduced spending power, thus has yields of 5.2% as at 2017 and occupancy of 79.4% |
||||
Source: Cytonn Research
Below is a review of performance across the various sectors:
- Residential Sector
The residential sector in Tanzania is dominated by individual home builders and the public sector either through the National Housing Corporation or the Tanzania Building Agency (TBA) who cater for Tanzanians or government employees.
We conducted research on housing by both private and public developers and sub-divided Dar es Salaam into the following segments:
- High End - Areas such as Oyster Bay, Masaki, Morocco, and Msasani,
- Mid End - Areas such as Mbezi, Kunduchi, Kinondoni, Mikocheni, Mwenge, Upanga, Kariakoo, and Kisutu,
- Low End - Areas such as Mbagala and satellite locations such as Kigamboni and Bunju.
In summary, the residential sector has been recording subdued performance for the past two-years, especially in the high and mid-end segments, which have continued to record negative price growth, attributable to tight liquidity, slow credit growth, which declined to 7.2% in 2016 and to 0.3% in August 2017 from 24.8% in 2015. However, the low-end segment had the best performance with an annual uptake of 53.7%, and average total returns to investors of 5.2%.
Due to a tough operating environment in the market, prices have either stagnated or declined indicating that the market is more suitable for investors targeting returns in terms of rental income as opposed to price appreciation.
NB: (All yields are dollarized)
|
Residential Performance Summary |
||||||||
|
Segment |
Unit Type |
Price per SQM (USD) |
Rent per SQM (USD) |
Occupancy |
Annual Uptake |
Rental Yield |
Price Appreciation |
Total Returns |
|
High End |
Apartments |
1,394 |
6.5 |
90.2% |
20.0% |
4.9% |
(6.2%) |
(1.3%) |
|
High End |
Detached |
1,071 |
7.7 |
86.5% |
7.8% |
(6.2%) |
1.6% |
|
|
Mid End |
Apartments |
1,204 |
7.6 |
79.4% |
20.8% |
7.8% |
(9.2%) |
(1.4%) |
|
Mid End |
Detached |
1,243 |
4.6 |
71.2% |
19.7% |
3.4% |
(9.2%) |
(5.8%) |
|
Low End |
Apartments |
390 |
1.6 |
8.3% |
3.3% |
1.4% |
4.8% |
|
|
Low End |
Detached |
388 |
1.7 |
70.0% |
53.7% |
3.9% |
1.4% |
5.4% |
|
Average |
|
948 |
4.9 |
79.5% |
24.5% |
5.2% |
(4.7%) |
0.5% |
|
· Detached units in the high-end sector have the highest yields at 7.8% as they charge a premium on rent due to the relatively low supply given the increasing land prices in their locations · Apartments in the mid-end sector have the highest yields at 7.8% due to their relative affordability for the growing middle class · Detached units in the low-end sector have a relatively high annual uptake of 53.7% due to their relative affordability. They, however, have low yields of 3.9% and are thus more suitable for prospective residents as opposed to investors |
||||||||
Source: Cytonn Research
The performance breakdown of the various market segments and typologies is as shown below:
a. High End
|
Performance Summary - High End |
||||||||||||||||
|
Apartments |
||||||||||||||||
|
Typology |
Unit Plinth Area (SQM) |
Price (USD) |
Price (Kshs) |
Price (Tshs) |
Price per SQM (USD) |
Rent per SQM (USD) |
Occupancy (%) |
Annual Uptake (%) |
Rental Yield (%) |
|||||||
|
2 Bed |
168 |
260,000 |
27.6m |
580.7m |
1,377 |
6.4 |
90.6% |
23.3% |
4.9% |
|||||||
|
3 Bed |
228 |
254,050 |
26.3m |
567.4m |
1,402 |
6.3 |
87.4% |
20.0% |
4.7% |
|||||||
|
4 Bed |
256 |
370,375 |
38.3m |
827.2m |
1,403 |
6.8 |
92.7% |
16.7% |
5.2% |
|||||||
|
Average |
|
|
|
|
1,394 |
6.5 |
90.2% |
20.0% |
4.9% |
|||||||
|
Detached |
||||||||||||||||
|
Typology |
Unit Plinth (SQM) |
Price (USD) |
Price (Kshs) |
Price (Tshs) |
Price per SQM (USD) |
Rent per SQM (USD) |
Occupancy (%) |
Rental Yield (%) |
||||||||
|
2 Bed |
216 |
8.1 |
83.3% |
7.6% |
||||||||||||
|
3 Bed |
323 |
8.9 |
71.1% |
8.2% |
||||||||||||
|
4 Bed |
430 |
8.0 |
91.7% |
9.1% |
||||||||||||
|
5 Bed |
560 |
600,000 |
61.4m |
1,340.1m |
1,071 |
5.6 |
100.0% |
6.3% |
||||||||
|
Average |
|
|
|
|
1,071 |
7.7 |
86.5% |
7.8% |
||||||||
|
· Detached units had the highest yields at 7.8% as they are relatively lower in supply, compared to apartments, which are the most common in the Dar es Salaam market, thus detached units are able to charge premium rents |
||||||||||||||||
Source: Cytonn Research
b. Mid End
|
Performance Summary - Mid End |
|||||||||
|
Apartments |
|||||||||
|
Typology |
Unit Plinth (SM) |
Price (USD) |
Price (Kshs) |
Price (Tshs) |
Price per SM (USD) |
Rent per SM (USD) |
Occupancy (%) |
Annual Uptake (%) |
Rental Yield (%) |
|
2 Bed |
73 |
134,648 |
13.9m |
300.7m |
1,750 |
10.5 |
82.2% |
18.3% |
8.7% |
|
3 Bed |
136 |
143,097 |
14.8m |
319.6m |
1,026 |
6.9 |
81.0% |
25.6% |
6.9% |
|
4 Bed |
181 |
151,231 |
15.6m |
337.8m |
835 |
5.4 |
75.0% |
18.5% |
7.8% |
|
Average |
|
|
|
|
1,204 |
7.6 |
79.4% |
20.8% |
7.8% |
|
Detached |
|||||||||
|
Typology |
Unit Plinth (SM) |
Price (USD) |
Price (Kshs) |
Price (Tshs) |
Price per SM (USD) |
Rent per SM (USD) |
Occupancy (%) |
Annual Uptake (%) |
Rental Yield (%) |
|
2 Bed |
110 |
136,500 |
14.0m |
304.9m |
1,281 |
27.8% |
3.2% |
||
|
3 Bed |
171 |
224,814 |
23.0m |
502.1m |
1,303 |
4.3 |
75.0% |
13.0% |
2.8% |
|
4 Bed |
327 |
311,848 |
31.9m |
696.5m |
1,143 |
4.9 |
67.5% |
18.4% |
4.2% |
|
Average |
|
|
|
|
1,243 |
4.6 |
71.2% |
19.7% |
3.4% |
|
· Apartments had the highest yields at 7.8% and annualized uptake at 20.8% compared to detached units with a yield of 3.4% and annual uptake of 19.7% driven by demand from the growing middle class who seek quality developments with relatively affordable prices/rents |
|||||||||
Source: Cytonn Research
c. Low End
|
Performance Summary: Low End |
|||||||||
|
Apartments |
|||||||||
|
Typology |
Unit Plinth (SM) |
Price (USD) |
Price (Kshs) |
Price (Tshs) |
Price per SM (USD) |
Rent per SM (USD) |
Occupancy (%) |
Annual Uptake (%) |
Rental Yield (%) |
|
2 Bed |
76 |
30,331 |
3.1m |
67.7m |
402 |
1.5 |
70.0% |
8.3% |
3.2% |
|
3 Bed |
101 |
57,028 |
3.9m |
127.4m |
379 |
1.6 |
70.0% |
8.3% |
3.5% |
|
Average |
|
|
|
|
390 |
1.6 |
70.0% |
8.3% |
3.3% |
|
Detached |
|||||||||
|
Typology |
Unit Plinth (SM) |
Price (USD) |
Price (Kshs) |
Price (Tshs) |
Price per SM (USD) |
Rent per SM (USD) |
Occupancy (%) |
Annual Uptake (%) |
Rental Yield (%) |
|
2 Bed |
61 |
23,477 |
2.4m |
52.4m |
361 |
1.6 |
70.0% |
66.7% |
4.1% |
|
3 Bed |
104 |
43,242 |
4.4m |
96.6m |
414 |
1.9 |
70.0% |
40.7% |
3.8% |
|
Average |
|
|
|
|
388 |
1.7 |
70.0% |
53.7% |
3.9% |
|
· Apartments have relatively slow uptake at 8.3% annually compared to detached units with 53.7% due to preference to own-compound houses · Rentals in the low-end sector are relatively low ranging from USD 1.5-USD 1.9 per SQM indicating low demand and thus is more of a buyers’ market |
|||||||||
Source: Cytonn Research
2. Commercial Sector
The commercial sector has been steadily growing, especially in terms of supply. According to Cytonn Research, office stock in Dar es Salaam stands at approximately 350,000 - 450,000 SQM, and another 100,000 - 150,000 SQM expected to be delivered in 2018/19. Commercial office supply growth is propelled by infrastructural development in key regions around the city, a stable economic growth and continued entry of multinational firms into the country and the budding small and medium enterprises industry, especially in the manufacturing, financial and telecommunication industries. However, as demand stabilizes and stock supply increases, the sector has been recording subdued returns and increasing vacancy rates in the last three-years. This has been attributed to high rental rates that do not sustain the small and medium enterprises, emerging cities that are slowly catching up such as Dodoma, Arusha and Mwanza and the high cost of borrowing affecting expansion of enterprises.
The performance is as shown below:
|
Commercial Office Performance Summary by Grade |
|||||
|
Grade |
Monthly Rent Per SQM (USD) |
Monthly Rent Per SQFT (Kshs) |
Monthly Rent Per SQFT (Tshs) |
Occupancy |
Rental Yield |
|
A |
17.0 |
193 |
37,968.5 |
92.9% |
8.6% |
|
B |
16.0 |
186 |
35,735.0 |
70.7% |
6.7% |
|
C |
12.0 |
135 |
26,801.3 |
68.4% |
5.2% |
|
Average |
15.0 |
167 |
33,501.6 |
72.1% |
6.4% |
|
*Rents are exclusive of service charge · Grade A offices recorded the highest yields in the market with average yields of 8.6%, 2.2% points higher than the market average of 6.4%. We attribute this to their high occupancy rates whose demand stem from the multinational players who demand top notch quality office stock |
|||||
Source: Cytonn Research
|
Commercial Office Performance Summary by Node |
|||||||
|
Node |
Monthly Rent Per SQM (USD) |
Monthly Rent Per SQFT (Kshs) |
Monthly Rent Per SQFT (Tshs) |
Service Charge per SQM (USD) |
Service Charge per SQFT (Kshs) |
Occupancy |
Rental Yield |
|
Kinondoni |
15.8 |
161 |
35,288.4 |
1.9 |
18 |
79.0% |
7.3% |
|
Masaki/Oyster Bay |
20.4 |
211 |
45,562.2 |
2.6 |
25 |
66.3% |
7.2% |
|
CBD |
15.9 |
167 |
35,511.7 |
2.3 |
22 |
76.0% |
6.3% |
|
Mwenge |
11.9 |
123 |
26,577.9 |
2.2 |
21 |
60.1% |
4.3% |
|
Average |
16.0 |
165.5 |
35,288.4 |
2.2 |
22 |
70.4% |
6.3% |
|
· Kinondoni was the best performing node with average rental yields of 7.3%, 1.0% points higher than the market average of 6.3%, attributable to good infrastructure, proximity to key upscale neighbourhoods such as Masaki, Oyster bay and Msasani Peninsula as well as its proximity to the CBD and the fact that firms are increasingly relocating here away from the congestion of the city centre thus raising its occupancy rates · Mwenge area had the lowest yields at 4.3% being the node with most grade C office stock thus the lowest rents. In addition, firms are increasingly moving to more prime nodes such as Kinondoni thus resulting in lower occupancies at 60.1% |
|||||||
Source: Cytonn Research
3. Retail Sector
Tanzania’s formal retail activity is centered in Dar es Salaam, which is considered the main economic hub of the country. As per JLL Dar es Salaam Report 2017, Dar es Salaam had a retail stock of 153,000 SQM. The main premium malls are Mlimani City Mall in Mwenge, Aura Mall in Upanga and Mkuki Mall in Kisutu. According to the Cytonn Research, at least 84,000 SQM is expected to be complete in the next five-years with malls such as Peninsula Plaza in Masaki, AICC Shopping Mall and Ngorongoro Towers in Arusha as well as shopping plazas in the upcoming MNF Square and Morocco Square in Dar es Salaam. Other premium malls in the country include Aim Mall in Arusha and Rock City Mall in Mwanza, measuring 15,454 SQM and 5,000 SQM, respectively.
The retail sector has grown on the back of positive demographic dividends with increased consumerism from the expanding middle class, increased interest from foreign players, and the growth of e-commerce. The performance is as shown below:
|
Retail Performance Summary by Node |
|||||
|
Location |
Monthly Rent Per SQM (USD) |
Monthly Rent Per SQFT (Kshs) |
Monthly Rent Per SQFT (Tshs) |
Occupancy Rate |
Rental Yield |
|
Masaki & Oysterbay |
20.0 |
206.7 |
44,668.8 |
96.1% |
10.9% |
|
Upanga |
19.8 |
205.1 |
44,222.1 |
91.9% |
10.3% |
|
CBD |
17.0 |
171.6 |
37,968.5 |
71.1% |
6.9% |
|
Average |
18.9 |
194.5 |
42,212.0 |
86.4% |
9.4% |
|
*(all rents are exclusive of service charge) · The Masaki and Upanga regions offer the highest retail yields to investors with 10.9%. This is attributable to the high upper mid-end populations as well as expatriates that reside in the neighborhood which drives demand for retail space · The CBD region is congested and businesses are now shifting to the outskirts of the city which has resulted in the low occupancy rates and hence low yields of 6.9%, 2.5% lower than the market average |
|||||
Source: Cytonn Research
|
Retail Performance Summary by Classification |
|||||
|
Type |
Monthly Rent Per SQM (USD) |
Monthly Rent Per SQFT (Kshs) |
Monthly Rent Per SQFT (Tshs) |
Occupancy Rate |
Rental Yield |
|
Community |
14.7 |
151.5 |
32,831.6 |
85.7% |
7.5% |
|
Neighborhood |
19.7 |
204.1 |
43,998.8 |
87.0% |
9.8% |
|
Regional |
39.6 |
409.8 |
88,444.2 |
95.0% |
11.1% |
|
Average |
19.4 |
201.1 |
43,328.7 |
87.1% |
9.4% |
|
*(all rents are exclusive of service charge) · The regional mall recorded the highest returns in terms of yield with an average of 11.1%, due to the high rental rates it attracts averaging at USD 39-40 per SQM as well as high occupancy rates of 95% · Neighborhood malls which are the main malls in Dar es Salaam also performed well with average yields of 9.8%, 0.4% higher than the market average as they also attract premium rates as they are limited in supply despite demand especially from foreign retailers |
|||||
Source: Cytonn Research
4. Hospitality Sector
The hospitality sector is growing supported by (i) holiday travelers who are the main drivers of Tanzania’s hospitality sector accounting for 78.0% of international arrivals over the last 5-years attracted mostly by key attractions such as wildlife, coastal beaches and mountain climbing, and (ii) political and social security in the last few years making it a preferred destination in East Africa compared to countries such as Kenya that suffered a setback between 2013 and 2015 due to terrorism and negative travel advisories. The sector’s performance, however, was low in 2016 due to the introduction of VAT to tourism services making Tanzania a relatively more expensive tourism destination. The sector, however, recorded improved performance in 2017 and is expected to sustain growth due to political stability and government efforts to improve infrastructure.
|
Hospitality Sector Performance (Tanzania) |
||||||||
|
Factor |
2011 |
2012 |
2013 |
2014 |
2015 |
2016 |
2017F |
2016/17F |
|
Accommodation and Food Services contribution to GDP |
1.6% |
1.6% |
1.5% |
1.5% |
1.4% |
1.4% |
1.3% |
(0.1)% |
|
Growth of GDP from Accommodation and Food Services |
4.1% |
6.7% |
2.8% |
2.2% |
2.3% |
3.7% |
2.0% |
(1.7)% |
|
International Visitor Arrivals ('000) |
867 |
1,077 |
1,096 |
1,140 |
1,137 |
1,284 |
1,389 |
8.2% |
|
Earnings in USD (mn) |
1,353 |
1,713 |
1,853 |
2,006 |
1,902 |
2,132 |
2,300 |
7.9% |
|
Bed Occupancy |
32.9% |
30.7% |
27.4% |
27.8% |
0.4% |
|||
|
Room Occupancy |
|
|
|
71.0% |
66.0% |
58.9% |
59.8% |
0.9% |
|
· International arrivals increased by a 6-year CAGR of CAGR of 9.9% while tourism earnings have grown by 11.2% during the same period, indicating the growth of the sector · However, the sector declined in 2015 evidenced by the reduction in international visitor arrivals and reduction in bed occupancy from 32.9% to 30.7%. This is because 2015 was an election year in Tanzania and may have resulted in security concerns due to the annulment of elections in Zanzibar. In addition, there may have been a spill-over effect of reduced tourist arrivals to Africa due to terrorist activities in Kenya and the Ebola pandemic in West Africa that resulted in issuance of negative travel advisories |
||||||||
Source: Cytonn Research, NBS
5. Land Sector
Land in Tanzania is divided into 3 categories; general land, village land and reserved land. The Land Act provides for rights of occupancy for between 33-years and 99-years for general land and reserved land. The Village Land Act recognizes the rights of villages to land held collectively by village residents under customary law. Under the TIC (Tanzania Investment Centre), a foreigner can be allocated land designated for investment purposes and which is already listed, or can look for desirable land owned by a Tanzanian national, and after agreeing on the acquisition of such land with the owner, the owner will submit the existing title deed to the Ministry of Lands whereby it will be re-issued as a land designated for investment purposes under the name of TIC and thereafter derivative rights issued to the investor (foreign entity).
The table below shows the average land prices in various parts of Dar es Salaam:
|
Average Land Prices in Dar es Salaam |
||||
|
Location |
Price Per SQM (USD) |
Price per Acre (USD) |
Price per Acre (Kshs) |
Price per Acre (Tshs) |
|
CBD |
732 |
2,927,906 |
302,745,474 |
6,539,302,231 |
|
Oysterbay& Masaki |
931 |
3,722,081 |
384,863,140 |
8,313,043,827 |
|
Victoria |
1,071 |
4,285,714 |
443,142,857 |
9,571,885,714 |
|
Bagamoyo Road |
392 |
1,567,341 |
162,063,093 |
3,500,562,802 |
|
Goba, Mbezi Beach |
12 |
38,625 |
3,993,876 |
86,267,727 |
|
Kurasini |
210 |
841,248 |
86,985,075 |
1,878,877,612 |
|
· Land prices are highest in commercial areas such as Victoria and CBD, and also the two most prime neighborhoods, Masaki and Oysterbay · Areas located far from the city centre such as Goba and Mbezi Beach are affordable. However, developers in these areas have to incur extra costs of providing infrastructure which is either poor or non-existent |
||||
Source: Cytonn Research
v. Comparison to Other Sub-Saharan African Markets
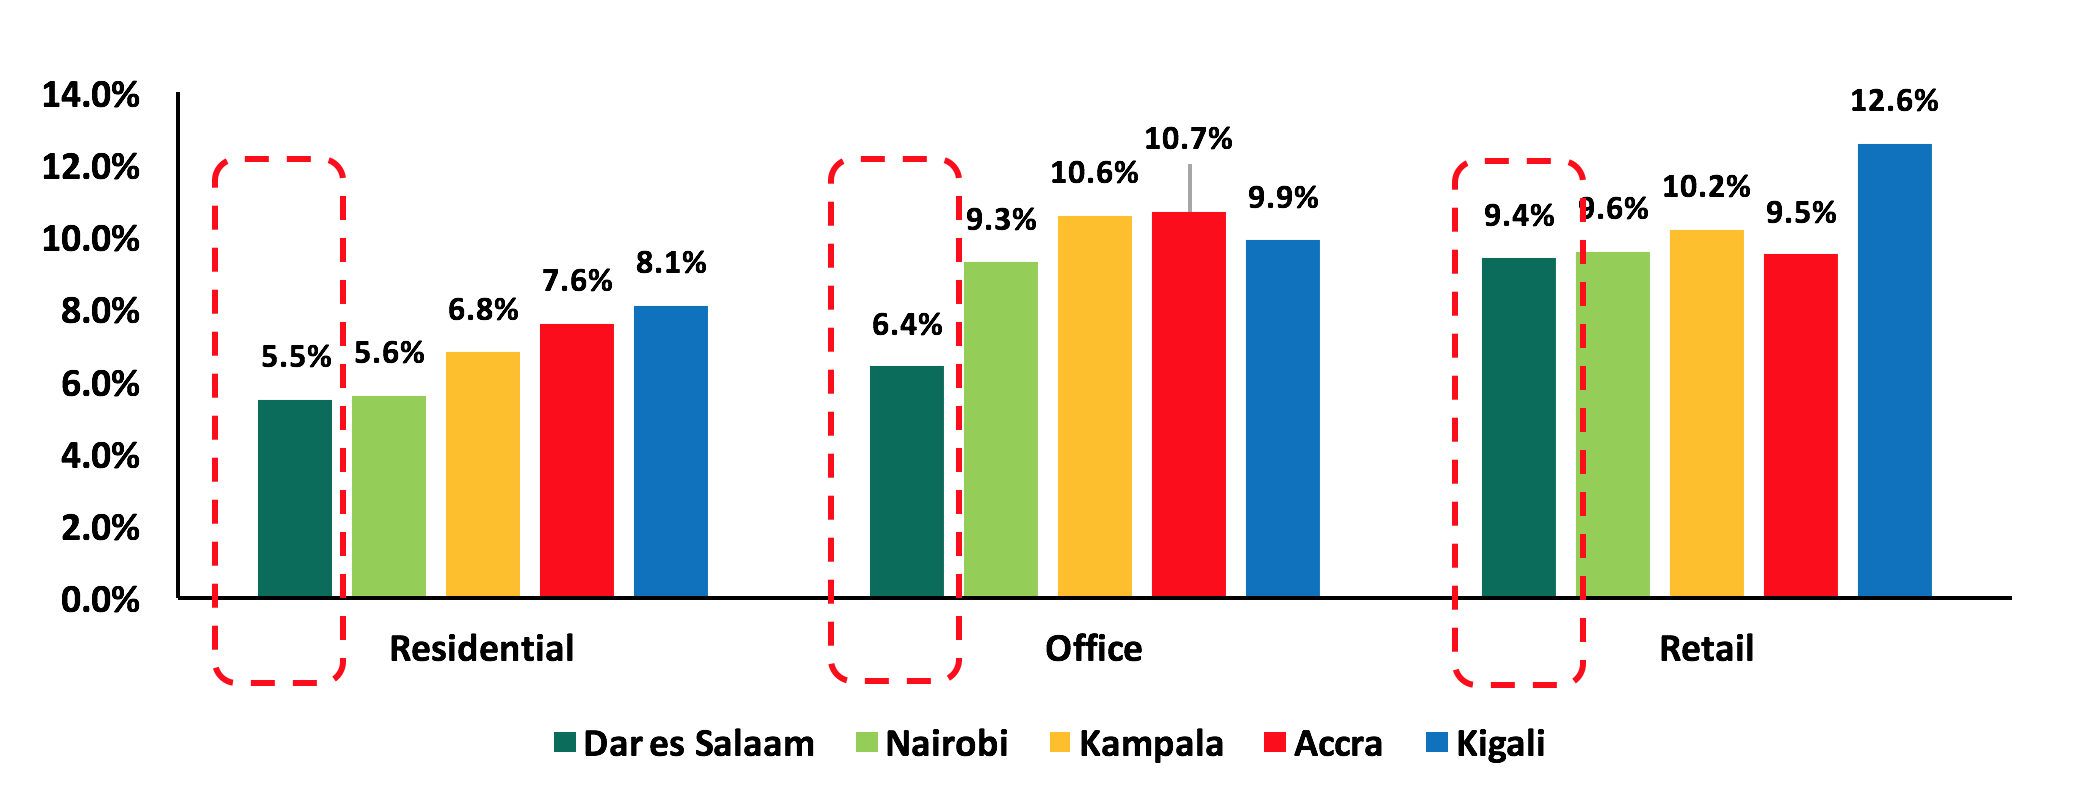
In comparison with other cities in Sub-Saharan Africa, Dar es Salaam has low residential and office yields at 5.2% and 6.4%, respectively, attributable to the shrinking demand resulting in reduced rents mainly in the residential and office sector.
The retail sector, however, has relatively competitive yields at 9.4% compared to Kenya’s and Accra’s at 9.6% and 9.5%, respectively.
Sub-Saharan Africa Cities Dollarized Rental Yields Comparison
Source: Cytonn Research
vi. Real Estate Investment Outlook
Our outlook on the Dar es Salaam real estate sector is neutral with a bias to positive. We have a positive view on the retail and hospitality sectors, a negative on the commercial sector and a neutral view on the residential sector. Investors entering the real estate market should, therefore, focus on the retail and hospitality sectors, which have potential and therefore offer new opportunities for growth. In addition, the residential sector has pockets of value in the low-end segment where demand is highest for detached units and in the mid-end segment where rental apartments have the best yields.
|
Theme |
Recommendation/Outlook |
Area of Focus |
Outlook |
|
Commercial Office |
The office market is on a declining trend and vacancy rates are likely to increase due to i) increasing supply ii) firms increasingly taking up smaller office spaces iii) migration of government offices to Dodoma |
Affordable offices/co-working stations
Investors should seek opportunities in other regions such as Arusha, Dodoma, and Mwanza |
 |
|
Retail |
The formal retail sector is gaining traction, with demand being driven by foreign retailers looking to set up shop in the region, and consumer’s preference for international brands |
Good quality community malls in prime areas such as Masaki and Upanga, which are densely populated
Growing cities; Dodoma, Arusha, and Mwanza |
 |
|
Residential Sector |
The best performing segment for rentals is the mid-end apartments with 7.4% yields and for sales being low-end detached units with 54.0% annual uptake. Demand remains strong for low-end affordable housing |
Mid-end apartments in areas such as Mbezi, Kawe, and Mwenge for rent
Low-mid end detached units in satellite areas such as Kigamboni |
 |
|
Hospitality Sector |
Despite the slight decline recorded in 2016, the sector is expected to recover driven by growth in leisure tourism and government efforts to improve infrastructure |
Luxury hotel class developments which have low supply in Dar es Salaam |
|
From the above themes we track, two are positive, one is negative, and one is neutral. As a result, our outlook is neutral with a bias to positive. We remain cautious about the real estate sector in Dar es Salaam. However, we expect the pockets of value identified in themes such as hospitality and retail to deepen against the backdrop of (i) continued stable economic growth, (ii) an expanding middle class, (iii) increased tourism, (iv) improved infrastructure, and (v) improving policy environment.
For a comprehensive market research refer to the full report here: Dar es Salaam Real Estate Investment Opportunity

- Talk to us
- Kenya
- P.O Box 20695 - 00200, Nairobi, Kenya
- Cell +254709101200
- Tel +254709101200
- WhatsApp +254741676635
- United States
- +254709101200
- DOWNLOAD OUR APP
-


- Kenya
- 8th Floor, Pinetree Plaza, Kaburu Drive, Ngong Road, Nairobi, Kenya
- USA
- Suite 1150, 1775 Eye Street NW, USA, Washington DC 20006, USA
- Investments
- High Yield
- Private Equity
- Real Estate
- Real Estate
- RiverRun Estates
- Cytonn Towers
- The Ridge
- Taraji Heights
- The Alma