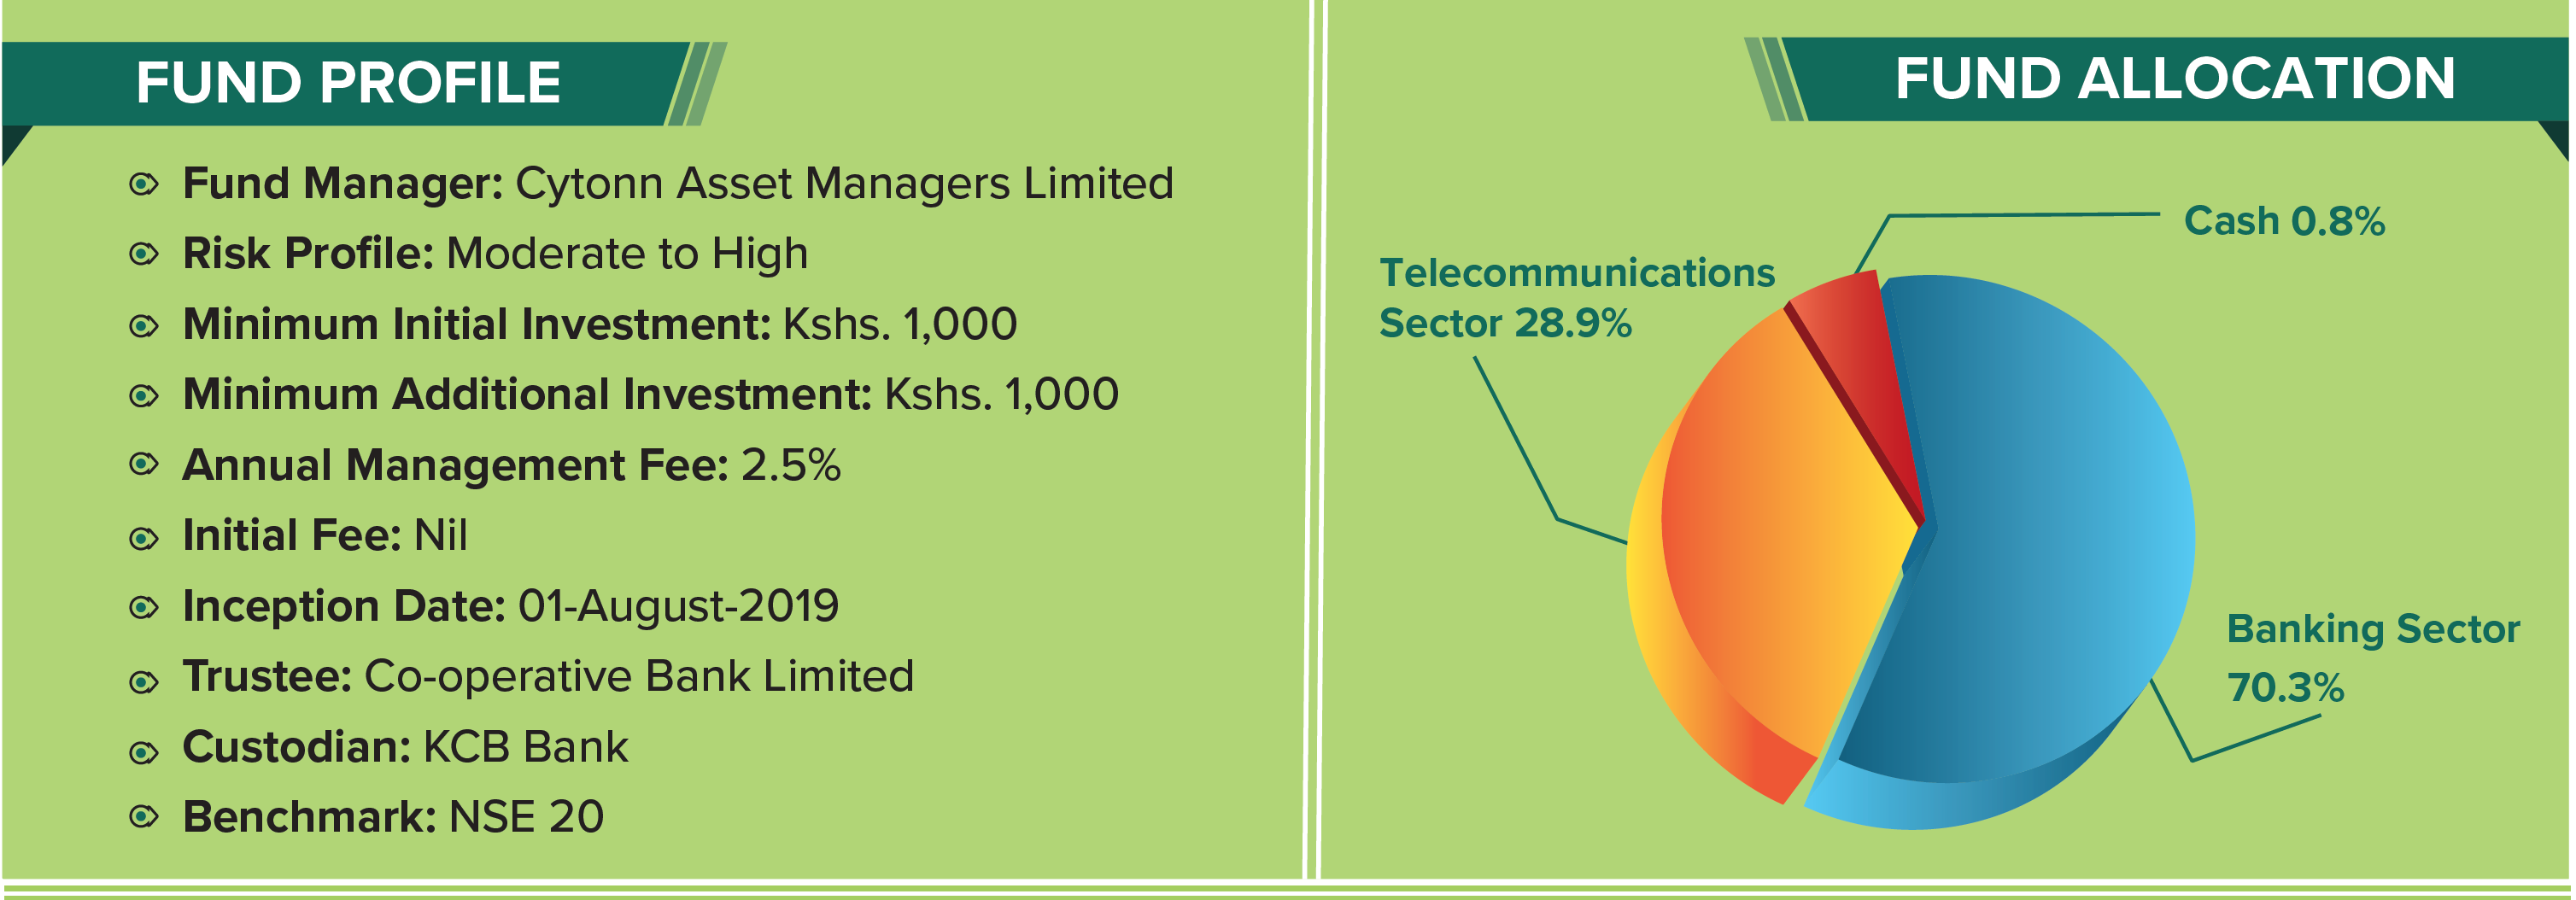
Equity Fund Fact Sheet June'20-min
By Research Team, Jul 8, 2020
1. FUND PERFOMANCE

*Aggregate percent amount that your investment would have gained since the fund started (01-August-2019)
**Percentage you can expect to earn with the fund during one year of investment on basis of the so far realized monthly returns since inception.
2. FUND MANAGER’S REPORT AND OUTLOOK
Fund Objective
The Cytonn Equity Fund is a moderate to high-risk fund that seeks to generate long-term capital growth and endeavors to maximize the total return to investors over the long term by investing in both listed and unlisted equity securities.
Portfolio Strategy
The Fund seeks to invest in companies with low valuation and good growth potential while providing su cient stability by investing in relatively mature companies. The key is to deliver a high total return from both capital appreciation and attractive dividend yields. The Fund seeks to outperform the benchmark, NSE 20, by maintaining a carefully selected and diversified portfolio.
Portfolio Performance
The Cytonn Equity fund gained by 2.1% in June 2020. The improvement in the Fund's performance was mainly driven by gains recorded in the stocks held in the fund’s portfolio where; I&M Holdings, KCB Group and Safaricom PLC gained by 5.6%, 2.5% and 0.4%, respectively, while Equity Group declined by the 1.6%. The equities market recorded mixed performance, with both NASI and NSE 25 gaining by 0.4%, while NSE 20 declined by 0.3%. The NASI performance was driven by gains recorded by large cap stocks such as KCB and Standard Chartered Bank, of 2.5% and 2.3%, respectively. Safaricom and EABL also recorded gains of 0.4% and 0.3%, respectively.
Economic report and outlook
Economic growth has remained subdued due to the ongoing COVID-19 pandemic, which has disrupted various sectors. According to the recent pronouncement, from the June Monetary Policy Committee press release, most recent economic indicators points that growth in Q1’2020 was strong, as the impact of COVID-19 virus was majorly pronounced in April 2020. There was however a notable recovery in the economy in May 2020 driven by increased agricultural output and exports. There has been pressure on interest rates with the yield curve shifting upwards from the December levels, which has seen the FTSE NSE Kenya Government Bond Index shed 1.0% YTD, this is despite a cumulative 1.5% points’ downward revision of the Central Bank Rate (CBR) since the beginning of the year to the current rate at 7.0%. On the short end of the yield curve, the Central Bank of Kenya has managed to maintain the yields relatively stable with the 91 day T-Bill declining to 6.7% in June, from 7.3% recorded in May. Inflation has remained within the Central Bank’s target of between 2.5% and 7.5%, with the June y/y inflation coming in at 4.6% a decline from 5.3% in May, driven by a 1.3% decline in the food and non-alcoholic drinks’ Index, coupled with a 0.8% decline in the housing, water, electricity, gas and other fuels’ index . Slight pressure has been recorded on the Kenyan Shilling on the back of increased dollar demand from merchandise importers as the easing of coronavirus restrictions jumpstart economic activities, thus boosting demand for hard currency but we do not foresee further declines as the Central Bank remains active in the market to cushion the shilling.
The Nairobi securities markets recorded a 0.4% gain in the month of June as per the Nairobi All Share Index. With the market trading at valuations below the historical average, the valuations current P/E valuation of 8.2x, 37.2% below the historical average of 13.1x. The dividend yield came in at 5.1%, 1.1% above its historical average of 4.0%

Disclaimer: Past performance is not a guarantee of future performance and the value of the fund will fluctuate from time to time.

