Everstrong Capital, Usahihi Expressway, and Local Fundraising Feasibility, & Cytonn Weekly #07/2025
By Research Team, Feb 16, 2025
Executive Summary
Fixed Income
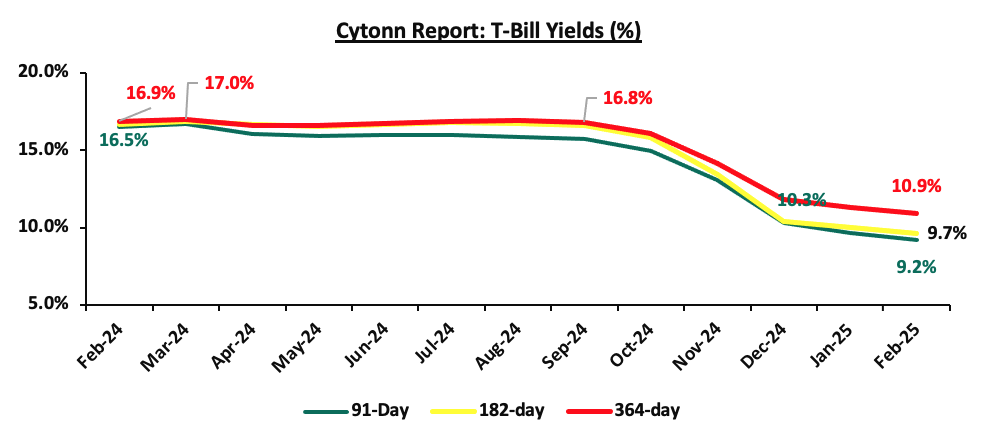
During the week, T-bills were oversubscribed for the second consecutive week, with the overall subscription rate coming in at 184.4%, albeit lower than the subscription rate of 296.6%% recorded the previous week. Investors’ preference for the shorter 91-day paper waned, with the paper receiving bids worth Kshs 2.5 bn against the offered Kshs 4.0 bn, translating to an undersubscription rate of 63.2%, a reversal from the oversubscription rate of 250.0% recorded the previous week. The subscription rates for the 182-day and 364-day papers decreased to 236.2% and 181.1% respectively, from the 240.0% and 371.8% recorded the previous week. The government accepted a total of Kshs 25.1 bn worth of bids out of Kshs 44.3 bn bids received, translating to an acceptance rate of 56.8%. The yields on the government papers were on a downward trajectory with the yields on the 364-day paper decreasing the most by 16.4 bps to 10.6% from 10.8% recorded the previous week, while the yields on the 182-day and 91-day papers decreased by 10.9 bps and 14.6 bps respectively to 9.4% and 9.0% respectively from 9.5% and 9.1% respectively recorded the previous week;
Also, during the week, the Central Bank of Kenya released the auction results for the re-opened bonds IFB1/2022/014 and IFB1/2023/017 with tenors to maturity of 11.8 years and 15.1 years respectively, and a fixed coupon rate of 13.9% and 14.4% respectively. The bonds were oversubscribed with the overall subscription rate coming in at 277.0%, receiving bids worth Kshs 193.9 bn against the offered Kshs 70.0 bn. The government accepted bids worth Kshs 130.8 bn, translating to an acceptance rate of 67.5%. The weighted average yield for the accepted bids for the IFB1/2022/014 and IFB1/2023/017 came in at 14.0% and 14.3% respectively, which was slightly above our expectation of within a range of 12.85%-13.55% and 12.95%-13.65% for the IFB1/2022/14 and IFB1/2023/17 respectively. Notably, the 14.0% on the IFB1/2022/014 was slightly higher than the 13.9% rate recorded in the last auction in November 2022, while the 14.3% yield on the IFB1/2023/017 was lower than the 17.7% rate recorded on the last auction in August 2024. With the Inflation rate at 3.3% as of January 2024, the real return of the IFB1/2022/014 and IFB1/2023/017 is 10.7% and 11.0% respectively. Given the bonds are tax free, compared to 10.0% withholding tax for other long-term bonds, the effective tax yield is 15.5% and 15.9% for the IFB1/2022/014 and IFB1/2023/017 respectively;
During the week, the Energy and Petroleum Regulatory Authority (EPRA) released their monthly statement on the maximum retail fuel prices in Kenya, effective from 15th February 2025 to 14th March 2025. Notably, the maximum allowed prices for Super Petrol, Diesel, and Kerosene remained unchanged at Kshs 176.6, Kshs 167.1, and Kshs 151.4 per litre respectively;
Equities
During the week, the equities market was on an upward trajectory, with NSE 25 and NSE 20 gaining the most by 1.3% each, while NASI and NSE 10 gained by 1.1% each, taking the YTD performance to gains of 8.0%, 4.6%, 2.8% and 2.1% for NSE 20, NASI, NSE 25 and NSE 10, respectively. The equities market performance was driven by gains recorded by large-cap stocks such DTB Kenya, Stanbic and Standard Chartered Bank Kenya of 7.2%, 4.5%, and 3.8% respectively. The gains were however, weighed down by losses recorded by large-cap stocks such as Bamburi, Equity and BAT of 1.3%, 0.7%, and 0.2% respectively;
Real Estate
During the week, Naivas, a leading supermarket chain in Kenya, launched a new store at Tatu City in Ruiru, marking its 110th store in the country. The new store aims to enhance convenience and accessibility for customers around Tatu City and its environs and has created direct employment opportunities, contributing to the companies growing workforce across Kenya;
On the Unquoted Securities Platform, Acorn D-REIT and I-REIT traded at Kshs 25.4 and Kshs 22.2 per unit, respectively, as per the last updated data on 14th February 2025. The performance represented a 27.0% and 11.0% gain for the D-REIT and I-REIT, respectively, from the Kshs 20.0 inception price. Additionally, ILAM Fahari I-REIT traded at Kshs 11.0 per share as of 14th February 2025, representing a 45.0% loss from the Kshs 20.0 inception price;
Focus of the Week
Infrastructure development remains one of the key objectives of the Kenyan government in achieving its vision 2030 mandate as these systems are essential for economic growth and development of any country. Specifically, good infrastructure reduces costs of doing business, attracts foreign investment, opens up remote areas to investment and boosts the trade competitiveness of the country. Recognizing this, the government continues to actively support infrastructure expansion through financing strategies such as Public-Private Partnerships (PPPs), infrastructure bonds, debt financing, and substantial budgetary allocations, with a primary focus on road networks.
Investment Updates:
- Weekly Rates: Cytonn Money Market Fund closed the week at a yield of 16.3% p.a. To invest, dial *809# or download the Cytonn App from Google Play store here or from the Appstore here;
- We continue to offer Wealth Management Training every Tuesday, from 7:00pm to 8:00 pm. The training aims to grow financial literacy among the general public. To register for any of our Wealth Management Trainings, click here;
- If interested in our Private Wealth Management Training for your employees or investment group, please get in touch with us through wmt@cytonn.com;
- Cytonn Insurance Agency acts as an intermediary for those looking to secure their assets and loved ones’ future through insurance namely; Motor, Medical, Life, Property, WIBA, Credit and Fire and Burglary insurance covers. For assistance, get in touch with us through insuranceagency@cytonn.com;
- Cytonn Asset Managers Limited (CAML) continues to offer pension products to meet the needs of both individual clients who want to save for their retirement during their working years and Institutional clients that want to contribute on behalf of their employees to help them build their retirement pot. To more about our pension schemes, kindly get in touch with us through pensions@cytonn.com;
Hospitality Updates:
We currently have promotions for Staycations. Visit cysuites.com/offers for details or email us at sales@cysuites.com
Money Markets, T-Bills Primary Auction:
During the week, T-bills were oversubscribed for the second consecutive week, with the overall subscription rate coming in at 184.4%, albeit lower than the subscription rate of 296.6%% recorded the previous week. Investors’ preference for the shorter 91-day paper waned, with the paper receiving bids worth Kshs 2.5 bn against the offered Kshs 4.0 bn, translating to an undersubscription rate of 63.2%, a reversal from the oversubscription rate of 250.0% recorded the previous week. The subscription rates for the 182-day and 364-day papers decreased to 236.2% and 181.1% respectively, from the 240.0% and 371.8% recorded the previous week. The government accepted a total of Kshs 25.1 bn worth of bids out of Kshs 44.3 bn bids received, translating to an acceptance rate of 56.8%. The yields on the government papers were on a downward trajectory with the yields on the 364-day paper decreasing the most by 16.4 bps to 10.6% from 10.8% recorded the previous week, while the yields on the 182-day and 91-day papers decreased by 10.9 bps and 14.6 bps respectively to 9.4% and 9.0% respectively from 9.5% and 9.1% respectively recorded the previous week;
The charts below show the yield performance of the 91-day, 182-day and 364-day papers from February 2024 to February 2025:
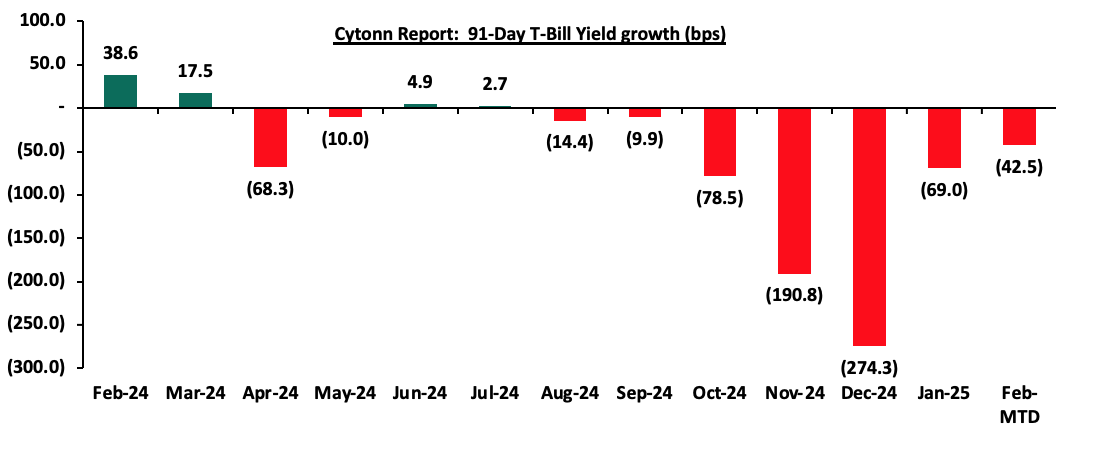
The chart below shows the yield growth for the 91-day T-bill:
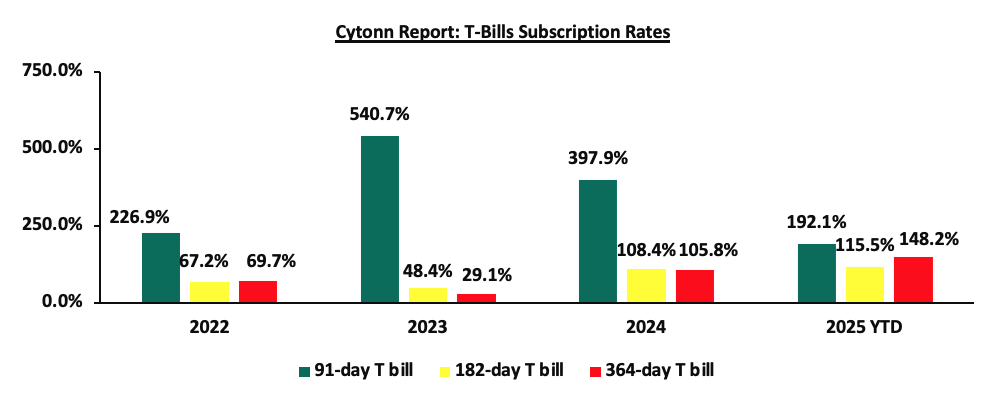
The chart below compares the overall average T-bill subscription rates obtained in 2022,2023, 2024 and 2025 Year-to-date (YTD):
In the primary bond market, the Central Bank of Kenya released the auction results for the re-opened bonds IFB1/2022/014 and IFB1/2023/017 with tenor to maturity of 11.8 years and 15.1 years respectively, and a fixed coupon rate of 13.9% and 14.4% respectively. The bonds were oversubscribed with the overall subscription rate coming in at 277.0%, receiving bids worth Kshs 193.9 bn against the offered Kshs 70.0 bn. The government accepted bids worth Kshs 130.8 bn, translating to an acceptance rate of 67.5%. The weighted average yield for the accepted bids for the IFB1/2022/014 and IFB1/2023/017 came in at 14.0% and 14.3% respectively, which was slightly above our expectation of within a range of 12.85%-13.55% and 12.95%-13.65% for the IFB1/2022/14 and IFB1/2023/17 respectively. Notably, the 14.0% on the IFB1/2022/014 was slightly higher than the 13.9% rate recorded in the last auction in November 2022, while the 14.3% yield on the IFB1/2023/017 was lower than the 17.7% rate recorded on the last auction in August 2024. With the Inflation rate at 3.3% as of January 2024, the real return of the IFB1/2022/014 and IFB1/2023/017 is 10.7% and 11.0% respectively. Given the bonds are tax free, compared to 10.0% withholding tax for other long-term bonds, the effective yield is 15.5% and 15.9% for the IFB1/2022/014 and IFB1/2023/017 respectively.
Money Market Performance:
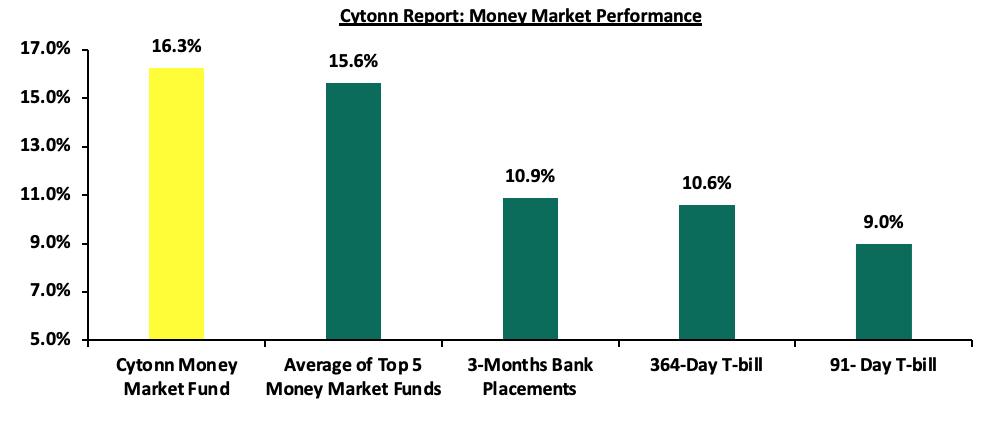
In the money markets, 3-month bank placements ended the week at 10.9% (based on what we have been offered by various banks), and the yields on the government papers were on a downward trajectory with the yields on the 364-day and 91-day papers decreasing by 16.4 bps and 14.6 bps to 10.6% and 9.0% respectively, from 10.8% and 9.1% recorded the previous week. The yield on the Cytonn Money Market Fund remained unchanged from the 16.3% recorded the previous week, while the average yields on the Top 5 Money Market Funds decreased by 7.8 bps to close the week at 15.6%, from 15.7% recorded the previous week.
The table below shows the Money Market Fund Yields for Kenyan Fund Managers as published on 14th February 2025:
|
Cytonn Report: Money Market Fund Yield for Fund Managers as published on 14th February 2025 |
||
|
Rank |
Fund Manager |
Effective Annual Rate |
|
1 |
Cytonn Money Market Fund (Dial *809# or download the Cytonn app) |
16.3% |
|
2 |
Gulfcap Money Market Fund |
16.3% |
|
3 |
Ndovu Money Market Fund |
15.5% |
|
4 |
Mali Money Market Fund |
15.2% |
|
5 |
Lofty-Corban Money Market Fund |
15.2% |
|
6 |
Kuza Money Market fund |
14.9% |
|
7 |
Etica Money Market Fund |
14.8% |
|
8 |
Genghis Money Market Fund |
13.8% |
|
9 |
Orient Kasha Money Market Fund |
13.5% |
|
10 |
Dry Associates Money Market Fund |
13.4% |
|
11 |
Arvocap Money Market Fund |
13.3% |
|
12 |
British-American Money Market Fund |
13.0% |
|
13 |
GenAfrica Money Market Fund |
12.8% |
|
14 |
Jubilee Money Market Fund |
12.7% |
|
15 |
Sanlam Money Market Fund |
12.7% |
|
16 |
Madison Money Market Fund |
12.6% |
|
17 |
Enwealth Money Market Fund |
12.5% |
|
18 |
Old Mutual Money Market Fund |
12.4% |
|
19 |
Co-op Money Market Fund |
12.0% |
|
20 |
CIC Money Market Fund |
12.0% |
|
21 |
Nabo Africa Money Market Fund |
11.9% |
|
22 |
ICEA Lion Money Market Fund |
11.9% |
|
23 |
Absa Shilling Money Market Fund |
11.9% |
|
24 |
Apollo Money Market Fund |
11.3% |
|
25 |
Faulu Money Market Fund |
11.1% |
|
26 |
KCB Money Market Fund |
11.0% |
|
27 |
AA Kenya Shillings Fund |
10.6% |
|
28 |
Mayfair Money Market Fund |
9.9% |
|
29 |
Ziidi Money Market Fund |
9.7% |
|
30 |
Stanbic Money Market Fund |
9.1% |
|
31 |
Equity Money Market Fund |
6.8% |
Source: Business Daily
Liquidity:
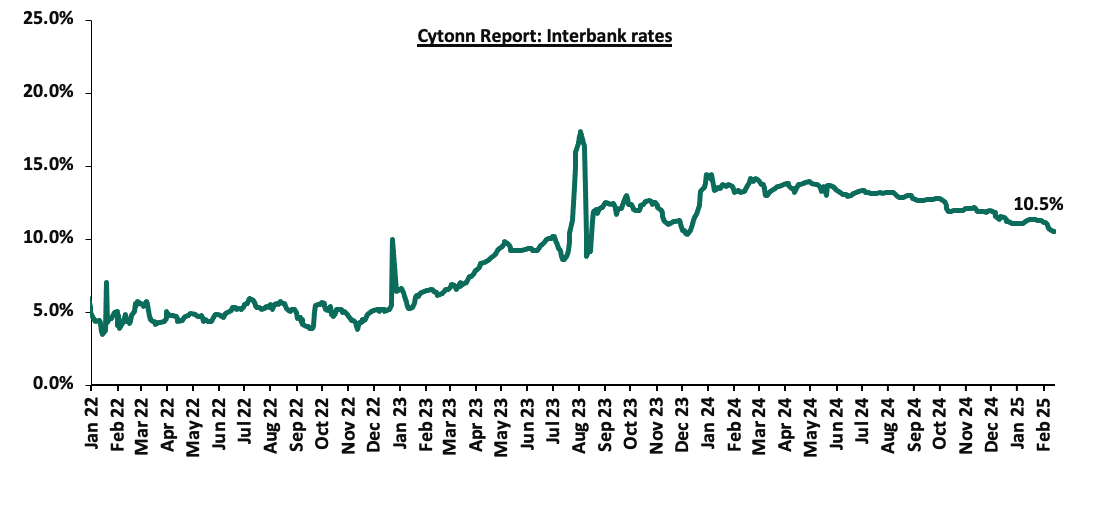
During the week, liquidity in the money markets eased, with the average interbank rate decreasing by 35.7 bps, to 10.5% from 10.9% recorded the previous week, partly attributable to tax remittances that were offset by government payments. The average interbank volumes traded increased by 7.6% to Kshs 15.4 bn from Kshs 14.3 bn recorded the previous week. The chart below shows the interbank rates in the market over the years:
Kenya Eurobonds:
During the week, the yields on Kenya’s Eurobonds were on an upward trajectory, with the yield on the 13-year Eurobond issued in 2021 increasing the most by 18.5 bps to 9.9% from 9.7% recorded the previous week. The table below shows the summary performance of the Kenyan Eurobonds as of 13th February 2025;
|
Cytonn Report: Kenya Eurobonds Performance |
|||||||||
|
|
2018 |
2019 |
2021 |
2024 |
|||||
|
Tenor |
10-year issue |
30-year issue |
7-year issue |
12-year issue |
13-year issue |
7-year issue |
|||
|
Amount Issued (USD) |
1.0 bn |
1.0 bn |
0.9 bn |
1.2 bn |
1.0 bn |
1.5 bn |
|||
|
Years to Maturity |
3.0 |
23.0 |
2.3 |
7.3 |
9.4 |
6.0 |
|||
|
Yields at Issue |
7.3% |
8.3% |
7.0% |
7.9% |
6.2% |
10.4% |
|||
|
02-Jan-25 |
9.1% |
10.3% |
8.5% |
10.1% |
10.1% |
10.1% |
|||
|
03-Feb-25 |
9.1% |
10.3% |
8.5% |
10.1% |
10.1% |
10.1% |
|||
|
06-Feb-25 |
8.6% |
10.1% |
8.2% |
9.7% |
9.7% |
9.7% |
|||
|
07-Feb-25 |
8.7% |
10.1% |
8.3% |
9.8% |
9.8% |
9.8% |
|||
|
10-Feb-25 |
8.6% |
10.1% |
8.1% |
9.7% |
9.7% |
9.7% |
|||
|
11-Feb-25 |
8.7% |
10.2% |
8.2% |
9.8% |
9.8% |
9.8% |
|||
|
12-Feb-25 |
8.8% |
10.2% |
8.2% |
9.9% |
9.9% |
9.9% |
|||
|
13-Feb-25 |
8.7% |
10.2% |
8.2% |
9.8% |
9.9% |
9.9% |
|||
|
Weekly Change |
0.1% |
0.1% |
0.0% |
0.1% |
0.2% |
0.2% |
|||
|
MTD Change |
(0.4%) |
(0.1%) |
(0.3%) |
(0.3%) |
(0.2%) |
(0.2%) |
|||
|
YTD Change |
(0.4%) |
(0.1%) |
(0.3%) |
(0.2%) |
(0.2%) |
(0.2%) |
|||
Source: Central Bank of Kenya (CBK) and National Treasury
Kenya Shilling:
During the week, the Kenyan Shilling depreciated marginally against the US Dollar by 1.0 bp, to close the week at Kshs 129.2, relatively unchanged from the previous week. On a year-to-date basis, the shilling has appreciated by 6.3 bps against the dollar, relative to the 17.4% appreciation recorded in 2024.
We expect the shilling to be supported by:
- Diaspora remittances standing at a cumulative USD 4,960.2 mn in the twelve months to January 2025, 16.6% higher than the USD 4,252.9 mn recorded over the same period in 2024, which has continued to cushion the shilling against further depreciation. In the January 2025 diaspora remittances figures, North America remained the largest source of remittances to Kenya accounting for 56.9% in the period,
- The tourism inflow receipts which came in at USD 352 bn in 2023, a 31.5% increase from USD 268.1 bn inflow receipts recorded in 2022, and owing to tourist arrivals that improved by 14.6% to 2,394,376 in 2024 from 2,089,259 in 2023, and,
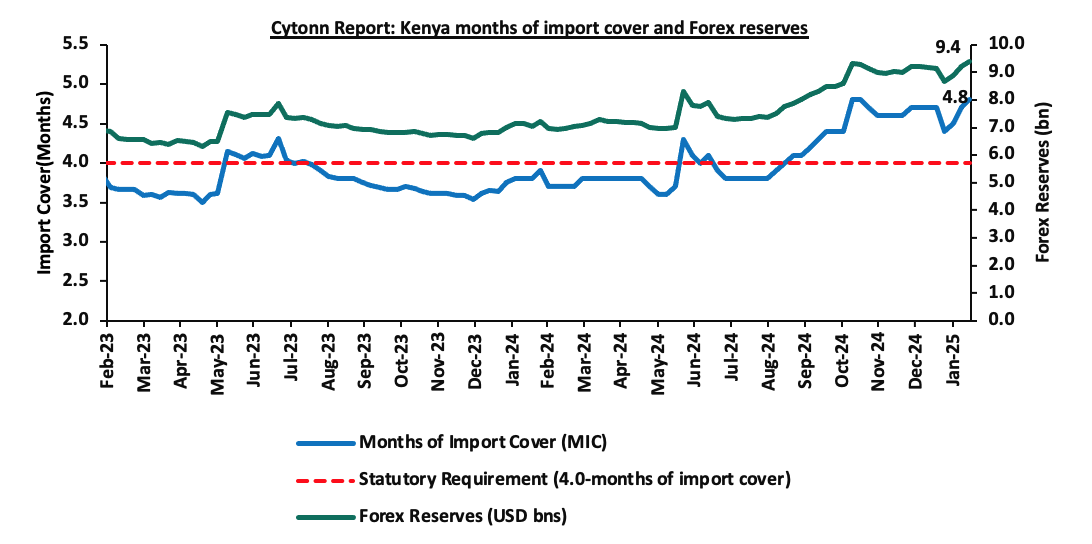
- Improved forex reserves currently at USD 9.4 bn (equivalent to 4.8-months of import cover), which is above the statutory requirement of maintaining at least 4.0-months of import cover and above the EAC region’s convergence criteria of 4.5-months of import cover.
The shilling is however expected to remain under pressure in 2025 as a result of:
- An ever-present current account deficit which came at 4.0% of GDP in Q3’2024, and,
- The need for government debt servicing, continues to put pressure on forex reserves given that 67.2% of Kenya’s external debt is US Dollar-denominated as of June 2024.
Key to note, Kenya’s forex reserves increased by 1.7% during the week, to USD 9.4 bn from the USD 9.2 bn recorded in the previous week, equivalent to 4.8 months of import cover compared to 4.7 months of import cover recorded last week, and above the statutory requirement of maintaining at least 4.0-months of import cover. The chart below summarizes the evolution of Kenya's months of import cover over the years:
The chart below summarizes the evolution of Kenya's months of import cover over the years:
Weekly Highlights
- Fuel Prices effective 15th February 2025 to 14th March 2025
During the week, The Energy and Petroleum Regulatory Authority (EPRA) released th monthly statement on the maximum retail fuel prices in Kenya, effective from 15th February 2025 to 14th March 2025. Notably, the maximum allowed prices for Super Petrol, Diesel, and Kerosene remained unchanged at Kshs 176.6, Kshs 167.1, and Kshs 151.4 per litre respectively.
Other key take-outs from the performance include;
- The average landing costs per cubic meter for Kerosene, Diesel and Super Petrol increased by 4.9%, 4.2% and 2.8% respectively to USD 681.4, USD 671.1 and USD 628.8 respectively in January 2025, from USD 649.6, USD 644.1 and USD 611.7 respectively recorded in December 2024.
- The Kenyan Shilling remained stable against the US Dollar, depreciating slightly by 2.3 bps to remain relatively unchanged from the monthly average of Kshs 129.6 recorded in December 2024.
We note that fuel prices in the country have decreased in recent months largely due to the government's efforts to stabilize pump prices through the petroleum pump price stabilization mechanism which expended Kshs 9.9 bn in the FY’2023/24 to cushion the increases applied to the petroleum pump prices, coupled with the appreciation of the Kenyan Shilling against the dollar and other major currencies, as well as a decrease in international fuel prices. However, despite an increase in international fuel prices and landing costs in January, the government through the price stabilization mechanism subsidized prices by Kshs 2.4, Kshs 5.6 and Kshs 8.7 per litre for Petrol, Diesel and Kerosene respectively, following an earlier Kshs 2.2 and Kshs 4.2 per litre for Diesel and Kerosene in January. Going forward, we expect that fuel prices will stabilize in the coming months as a result of the government's efforts to mitigate the cost of petroleum through the pump price stabilization mechanism and a stable exchange rate. As such, we expect the business environment in the country to improve as fuel is a major input cost.
Rates in the Fixed Income market have been on a downward trend due to high liquidity in the money market which allowed the government to front load most of its borrowing. The government is 173.4% ahead of its prorated net domestic borrowing target of Kshs 259.2 bn, and 73.5% ahead of the total FY’2024/25 net domestic borrowing target of Kshs 408.4 bn, having a net borrowing position of Kshs 708.6 bn. However, we expect a continued downward readjustment of the yield curve in the short and medium term, with the government looking to increase its external borrowing to maintain the fiscal surplus, hence alleviating pressure in the domestic market. As such, we expect the yield curve to normalize in the short to medium-term and hence investors are expected to shift towards the long-term papers to lock in the high returns.
Market Performance
During the week, the equities market was on an upward trajectory, with NSE 25 and NSE 20 gaining the most by 1.3% each, while NASI and NSE 10 gained by 1.1% each, taking the YTD performance to gains of 8.0%, 4.6%, 2.8% and 2.1% for NSE 20, NASI, NSE 25 and NSE 10, respectively. The equities market performance was driven by gains recorded by large-cap stocks such DTB Kenya, Stanbic and Standard Chartered Bank Kenya of 7.2%, 4.5%, and 3.8% respectively. The gains were however, weighed down by losses recorded by large-cap stocks such as Bamburi, Equity and BAT of 1.3%, 0.7%, and 0.2% respectively.
During the week, equities turnover decreased by 27.9% to USD 15.2 mn, from USD 21.1 mn recorded the previous week, taking the YTD total turnover to USD 110.3 mn. Foreign investors remained net sellers for the fourth consecutive week, with a net selling position of USD 1.1 mn, from a net selling position of USD 7.4 mn recorded the previous week, taking the YTD foreign net selling position to USD 16.6 mn, compared to a net selling position of USD 16.9 mn in 2024,
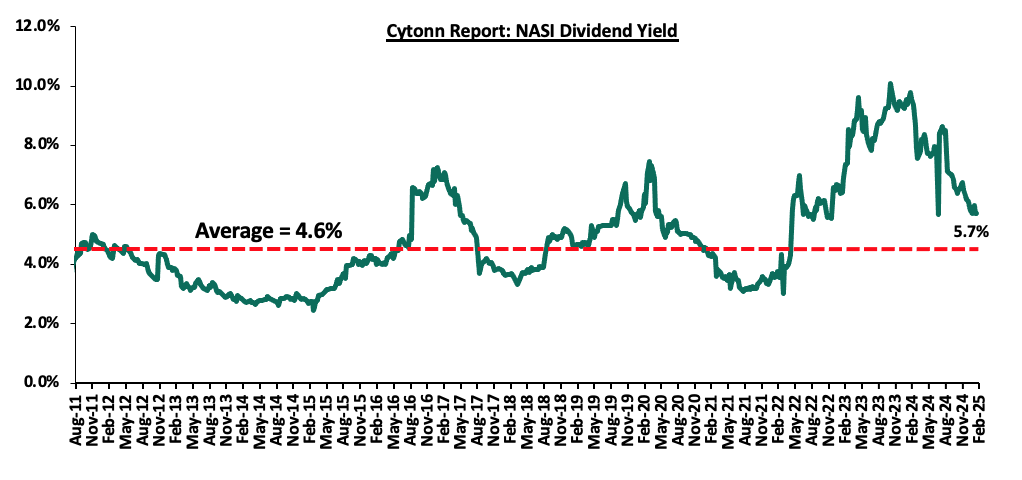
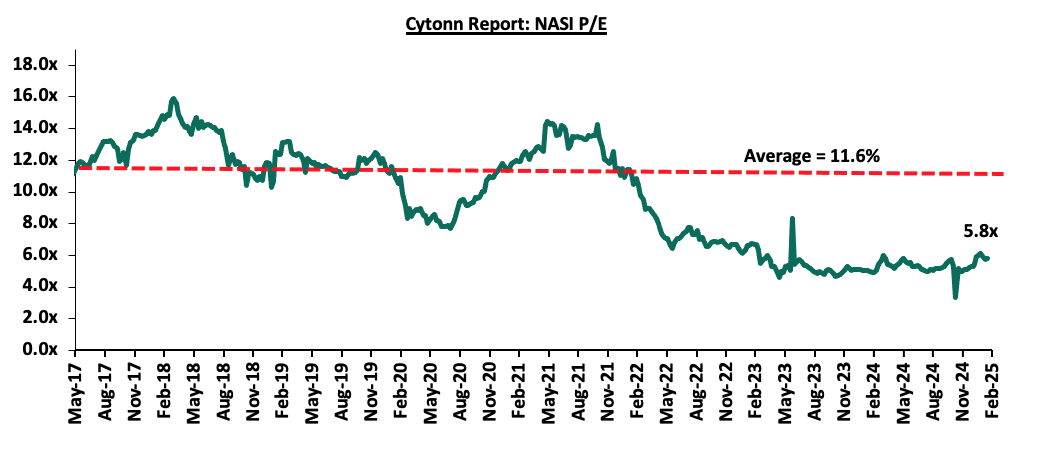
The market is currently trading at a price-to-earnings ratio (P/E) of 5.8x, 50.2% below the historical average of 11.6x. The dividend yield stands at 5.7%, 1.1% points above the historical average of 4.6%. Key to note, NASI’s PEG ratio currently stands at 0.7x, an indication that the market is undervalued relative to its future growth. A PEG ratio greater than 1.0x indicates the market is overvalued while a PEG ratio less than 1.0x indicates that the market is undervalued. The charts below indicate the historical P/E and dividend yields of the market;
Universe of Coverage:
|
Cytonn Report: Equities Universe of Coverage |
||||||||||
|
Company |
Price as at 07/02/2025 |
Price as at 14/02/2026 |
w/w change |
YTD Change |
Year Open 2025 |
Target Price* |
Dividend Yield*** |
Upside/ Downside** |
P/TBv Multiple |
Recommendation |
|
Jubilee Holdings |
200.0 |
200.0 |
0.0% |
14.4% |
174.8 |
260.7 |
7.2% |
37.5% |
0.3x |
Buy |
|
Equity Group |
48.0 |
47.7 |
(0.7%) |
(0.7%) |
48.0 |
60.2 |
8.4% |
34.7% |
0.9x |
Buy |
|
Co-op Bank |
16.1 |
16.5 |
2.8% |
(5.4%) |
17.5 |
18.8 |
9.1% |
23.0% |
0.8x |
Buy |
|
NCBA |
48.2 |
49.8 |
3.3% |
(2.4%) |
51.0 |
53.2 |
9.5% |
16.4% |
0.9x |
Accumulate |
|
ABSA Bank |
18.3 |
18.5 |
1.4% |
(1.9%) |
18.9 |
19.1 |
8.4% |
11.6% |
1.5x |
Accumulate |
|
KCB Group |
45.1 |
45.2 |
0.3% |
6.6% |
42.4 |
50.3 |
0.0% |
11.3% |
0.7x |
Accumulate |
|
Standard Chartered Bank |
279.5 |
290.0 |
3.8% |
1.7% |
285.3 |
291.2 |
10.0% |
10.4% |
1.9x |
Accumulate |
|
Stanbic Holdings |
143.5 |
150.0 |
4.5% |
7.3% |
139.8 |
145.3 |
10.2% |
7.1% |
1.0x |
Hold |
|
Britam |
7.0 |
7.1 |
1.7% |
22.3% |
5.8 |
7.5 |
0.0% |
5.3% |
1.0x |
Hold |
|
CIC Group |
2.8 |
2.9 |
2.5% |
33.2% |
2.1 |
2.8 |
4.6% |
2.8% |
0.9x |
Lighten |
|
Diamond Trust Bank |
69.8 |
74.8 |
7.2% |
12.0% |
66.8 |
71.1 |
6.7% |
1.8% |
0.3x |
Lighten |
|
I&M Group |
35.5 |
36.1 |
1.5% |
0.1% |
36.0 |
32.3 |
7.1% |
(3.3%) |
0.7x |
Sell |
|
*Target Price as per Cytonn Analyst estimates **Upside/ (Downside) is adjusted for Dividend Yield ***Dividend Yield is calculated using FY’2023 Dividends |
||||||||||
We are “Bullish” on the Equities markets in the short term due to current cheap valuations, lower yields on short-term government papers and expected global and local economic recovery, and, “Neutral” in the long term due to the persistent foreign investor outflows.
With the market currently trading at a discount to its future growth (PEG Ratio at 0.7x), we believe that investors should reposition towards value stocks with strong earnings growth and that are trading at discounts to their intrinsic value. We expect the current high foreign investors sell-offs to continue weighing down the economic outlook in the short term.
- Retail Sector
During the week, Naivas, a leading supermarket chain in Kenya, launched a new store at Tatu City in Ruiru, marking its 110th store in the country. The new store aims to enhance convenience and accessibility for customers around Tatu City and its environs and has created direct employment opportunities, contributing to the companies growing workforce across Kenya. The following table outlines the current store counts of major local and international supermarket chains operating in Kenya and international supermarket chains operating in Kenya;
|
Cytonn Report: Main Local and International Retail Supermarket Chains |
|||||
|
# |
Name of retailer |
Category |
Branches as at FY’2024 |
Branches opened in FY’2025 |
Current Branches |
|
1 |
Naivas |
Hybrid* |
109 |
1 |
110 |
|
2 |
Quick Mart |
Hybrid** |
60 |
0 |
60 |
|
3 |
Magunas |
Local |
32 |
0 |
32 |
|
4 |
Chandarana |
Local |
29 |
0 |
29 |
|
5 |
Carrefour |
International |
26 |
2 |
28 |
|
6 |
Khetia's |
Local |
25 |
0 |
25 |
|
7 |
Cleanshelf |
Local |
16 |
0 |
16 |
|
8 |
Muhindi Mweusi |
Local |
14 |
0 |
14 |
|
9 |
Jaza Stores |
Local |
14 |
0 |
14 |
|
10 |
Kipchimatt |
Local |
13 |
0 |
13 |
|
11 |
Eastmatt |
Local |
11 |
0 |
11 |
|
13 |
Powerstar |
Local |
10 |
0 |
10 |
|
15 |
Mathai's |
Local |
9 |
0 |
9 |
|
14 |
China Square |
International |
5 |
2 |
7 |
|
15 |
Kassmart |
Local |
5 |
0 |
5 |
|
16 |
Leestar |
Local |
5 |
0 |
5 |
|
18 |
Kamindi Supermarket |
Local |
3 |
0 |
3 |
|
19 |
Onn the Way |
Local |
3 |
0 |
3 |
|
20 |
County Supermarket |
Local |
3 |
0 |
3 |
|
21 |
Panda Mart |
International |
1 |
0 |
1 |
|
22 |
Gilanis |
Hybrid |
1 |
0 |
1 |
|
23 |
Safe Ways |
International |
1 |
0 |
1 |
|
24 |
New Spring Valley |
Local |
1 |
0 |
1 |
|
Total |
396 |
5 |
401 |
||
|
*51% of Naivas Supermarket owned by IBL Group (Mauritius), Proparco (France), and DEG (Germany), while 49% owned by Gakiwawa Family (Kenya) |
|||||
|
**More than 50% of Quickmart Supermarket owned by Adenia Partners (Mauritius), while Less than 50% owned by Kinuthia Family (Kenya) |
|||||
Source: Retail Trade Association of Kenya (RETRAK) and Cytonn Research
We expect that this move will enhance convenience for residents by providing easier access to commodities while also creating direct and indirect job opportunities that boost the local economy. Going forward into 2025, we expect to witness more retailers rolling out their expansion activities for the year, driven by increased investments from both local and international investors, the availability of retail space, a growing consumer base, and evolving consumer preferences in the country.
- Real Estate Investments Trusts (REITs)
On the Unquoted Securities Platform, Acorn D-REIT and I-REIT traded at Kshs 25.4 and Kshs 22.2 per unit, respectively, as per the last updated data on 14th February 2025. The performance represented a 27.0% and 11.0% gain for the D-REIT and I-REIT, respectively, from the Kshs 20.0 inception price. The volumes traded for the D-REIT and I-REIT came in at Kshs 12.8 mn and Kshs 35.6 mn shares, respectively, with a turnover of Kshs 323.5 mn and Kshs 791.5 mn, respectively, since inception in February 2021. Additionally, ILAM Fahari I-REIT traded at Kshs 11.0 per share as of 14th February 2025, representing a 45.0% loss from the Kshs 20.0 inception price. The volume traded to date came in at 138,600 shares for the I-REIT, with a turnover of Kshs 1.5 mn since inception in November 2015.
REITs offer various benefits, such as tax exemptions, diversified portfolios, and stable long-term profits. However, the ongoing decline in the performance of Kenyan REITs and the restructuring of their business portfolios are hindering significant previous investments. Additional general challenges include:
- Insufficient understanding of the investment instrument among investors leading to a slower uptake of REIT products,
- Lengthy approval processes for REIT creation,
- High minimum capital requirements of Kshs 100.0 mn for REIT trustees compared to Kshs 10.0 mn for pension funds Trustees, essentially limiting the licensed REIT Trustee to banks only
- The rigidity of choice between either a D-REIT or and I-REIT forces managers to form two REITs, rather than having one Hybrid REIT that can allocate between development and income earning properties
- Limiting the type of legal entity that can form a REIT to only a trust company, as opposed to allowing other entities such as partnerships, and companies,
- We need to give time before REITS are required to list – they would be allowed to stay private for a few years before the requirement to list given that not all companies maybe comfortable with listing on day one, and,
- Minimum subscription amounts or offer parcels set at Kshs 0.1 mn for D-REITs and Kshs 5.0 mn for restricted I-REITs. The significant capital requirements still make REITs relatively inaccessible to smaller retail investors compared to other investment vehicles like unit trusts or government bonds, all of which continue to limit the performance of Kenyan REITs.
We expect Kenya’s Real Estate sector to remain on a growth trend, supported by: i) demand for housing sustained by positive demographics, such as urbanization and population growth rates of 3.8% p.a and 2.0% p.a, respectively, against the global average of 1.7% p.a and 0.9% p.a, respectively, as at 2023,, ii) activities by the government under the Affordable Housing Program (AHP) iii) heightened activities by private players in the residential sector iv) increased investment by local and international investors in the retail sector. However, challenges such as rising construction costs, strain on infrastructure development (including drainage systems), high capital requirements for REITs, and existing oversupply in select Real Estate sectors will continue to hinder the sector’s optimal performance by limiting developments and investments.
Infrastructure development remains one of the key objectives of the Kenyan government as it seeks to achieve its vision 2030. Good infrastructure reduces costs of doing business, attracts foreign investment, opens up remote areas to investment and boosts the trade competitiveness of the country. Recognizing this, the government continues to actively support infrastructure expansion through financing strategies such as Public-Private Partnerships (PPPs), infrastructure bonds, debt financing, and substantial budgetary allocations, with a primary focus on road networks.
According to the Kenya National Highways Authority (KeNHA) 2023-2027 Strategic Plan, the authority aims to construct 2,349 km of roads, including 1,183 km of new roads, capacity enhancements of 674 km, and rehabilitation of 492 km. Additionally, KeNHA plans to maintain 75,891 km of national trunk roads and design 5,575 km of road networks during this period. The implementation of this strategic plan requires Ksh 708.7 bn, with Ksh 99.3 bn sourced through PPPs, Ksh 1.7 bn from climate funding, and Ksh 8.2 bn from own-source revenue. The graph below illustrates the government's infrastructure expenditure as a percentage of total development spending from FY’2020/21 to FY’ 2024/25, emphasizing the sustained priority on infrastructure, which consistently accounts for more than 50% of the total development budget.
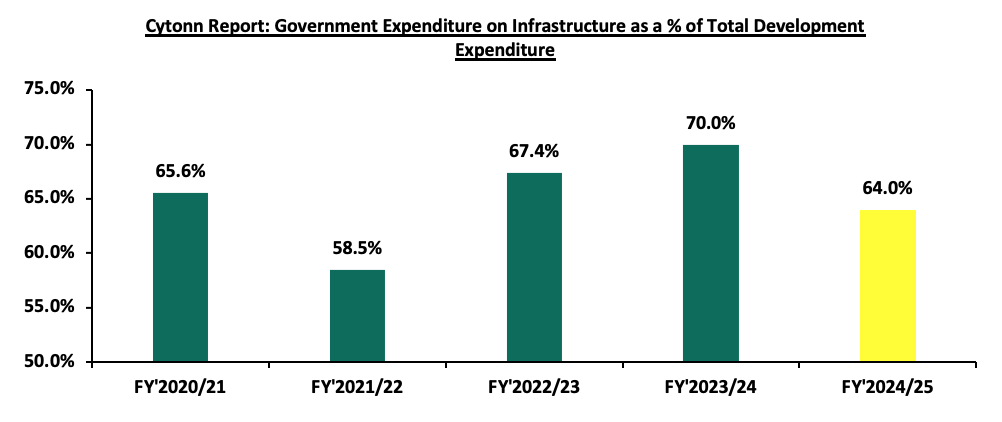
Source: National Treasury of Kenya
Despite these efforts, infrastructure funding gaps remain a major challenge in the achievement of the Kenyan government development goals a situation also being experienced in the rest of African countries. According to the African Development Bank Group , Africa as continent has an infrastructure funding gap of USD 402.2 bn with transport infrastructure accounting for the largest share at 72.9% equivalent to USD 293.2 bn. Narrowing down to Kenya, the country is estimated to be facing a USD 2.1 bn annual infrastructure financing gap creating a need for mobilization of more resources to meet the gap.
Given this, the government has been exploring diverse infrastructure funding strategies recently partnering with a US-based infrastructure investment firm Everstrong Capital-who aim to secure funds from local financial institutions such as pensions and banks amounting to approximately Kshs 129.0bn for financing the construction of the 440.0 kilometer Nairobi-Mombasa Expressway at an estimated cost of USD 3.5 bn (Ksh 455.0 bn). In this note, we aim to analyze this initiative by specifically looking into:
- Overview of Everstrong Capital
- About Usahihi Expressway
- What is the Probability of raising USD 1 bn (Ksh 129.2bn) from Local Pension Funds?
- Conclusion and Recommendations for the Project
Section I: Overview of Everstrong Capital
Everstrong Capital is an American infrastructure fund manager founded in 2015 by Philip Dyk, with its offices in United States, South Africa and Kenya. The firm specializes in late-stage development opportunities with a primary focus on Sub- Saharan Africa, aiming to make investments that positively impact human lives, families, communities and regions. Everstrong Capital concentrates on developing and investing in sustainable infrastructure across several key sectors including energy, power, transportation, communication, healthcare and housing.
Impact and achievement:
Everstrong Capital has invested in numerous projects across Sub-Saharan Africa, particularly in the transportation, communication, social infrastructure, energy and power sectors. Some of the notable achievements include;
- The Everstrong Kenya Infrastructure Fund, in February 2022, acquired a majority stake in Seal Towers Ltd- a provider of cell towers, tower infrastructure and related services. The strategic investment aims to support a tower expansion plan, and also enhance connectivity to underserved areas in Kenya.
- In 2018, Everstrong Capital became an investor in Gulf power, a company that plays a role in meeting Kenya’s energy demand. Gulf power operates an 80-megawatt power-generation facility near Athiriver, which commenced commercial operations in 2014, generating electricity using heavy fuel oil (HFO) and Light fuel oil (LFO). Gulf Power has a 20-year power purchase agreement (PPA) with Kenya Power & Lighting Company.
- Everstrong EV Africa is a subsidiary of Everstrong capital developing and investing in electric vehicle verticals in Kenya and across Sub-Saharan Africa with specific focus is on electric motorcycle and bus manufacturing, charging, finance and operation.
- Everstrong is also sponsoring a pan-Africa energy platform Milele Energy (which rebranded to Osprey renewables ) that provides capital and development expertise in power projects within sub-Saharan Africa. Recently, Milele Energy through Gemcorp capital seeded USD 150.0 mn purchasing a significant stake at the Kenya’s Lake Turkana Wind power Project.
- Milele Energy’s Salone power project secured a 20-year power purchase agreement (PPA) with the government of Sierra Leone. The 83.5MW gas power plant received USD 217 mn in loan approval and USD 54mn in political risk insurance from the US International Development Finance Corporation (US DFC). Once operational, the project is expected to supply 24% of the country’s electricity demand, lower energy costs, and support Sierra Leone’s transition to renewables.
Section II: About Usahihi Expressway
The Usahihi Expressway is a 440-Kilometre dual carriageway connecting Nairobi to Mombasa estimated to cost approximately USD 3.5 bn (Ksh 455.0 bn), leaving developer with a balance of USD 2.5 bn to raise from external markets. Additionally, Everstrong is providing USD 100.0 mn for land acquisition along the path the road will pass. The project is expected to be developed under a Public-Private Partnership (PPP) with a Build Operate- Transfer (BOT) model with a 30-year concession period. Designed with four to six lanes, it includes modern amenities, electric vehicle charging stations powered by renewable energy, and wildlife overpasses to preserve migration routes. The expressway aims to cut travel time between Nairobi and Mombasa from 10 hours to 4.5 hours, benefiting businesses, travelers, and freight operators. In contrast, the Nairobi Expressway, which cost approximately USD 681.7 mn (Ksh 88.0 bn), was developed under a PPP model but with full private sector financing led by the China Road and Bridge Corporation (CRBC) under an Operate-Maintain-Transfer (OMT) model. Unlike the Usahihi Expressway, which is expected to involve multiple private investors, including pension funds and local banks, the Nairobi Expressway was largely financed by a single foreign entity, limiting local investment participation.
Funding structure;
Everstrong Capital, in partnership with CPF Capital Advisory Limited, is aiming to secure Ksh 129.0 bn (USD 1.0 bn) as initial funding for the project through local pension funds, investment banks, and insurance companies, leveraging Kenya’s capital markets to sustain the project’s financial needs. The project will be continuously funded and operated under a concession model, allowing investors to recoup their investment through toll revenue over 30 years.
Section III: Feasibility of Raising the Kshs 129.2 bn from Local Pension Funds in Kenya
- Growth of Retirement Benefits Schemes
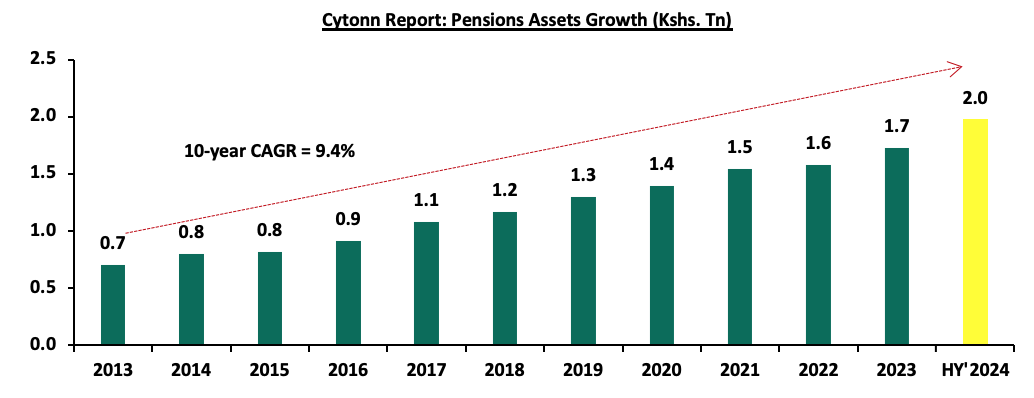
According to the latest Retirement Benefits Authority (RBA) Industry Report for June 2024, assets under management for retirement benefits schemes increased by 14.7% to Kshs 2.0 tn in June 2024 from the Kshs 1.7 tn recorded in December 2023. The growth of the assets was attributed to the improved market and economic conditions during the period as evidenced by improved business conditions, eased inflationary pressures and stability of the exchange rate. The Purchasing Manager’s Index (PMI) for HY’2024 came in at 50.0, up from 48.7 recorded in HY’2023. Additionally, the average inflation rate in HY’2024 came in at 5.6% compared to 8.5% recorded in a similar period in 2023. Notably, on a year-on -year basis, assets under management increased by 16.1% from the Kshs 1.7 tn recorded in June 2023, partly attributable to the enhanced contributions to the mandatory scheme, NSSF, which began in earnest in February 2023 following the court of appeal ruling.
The graph below shows the growth of Assets under Management of the retirement benefits schemes over the last 10 years:
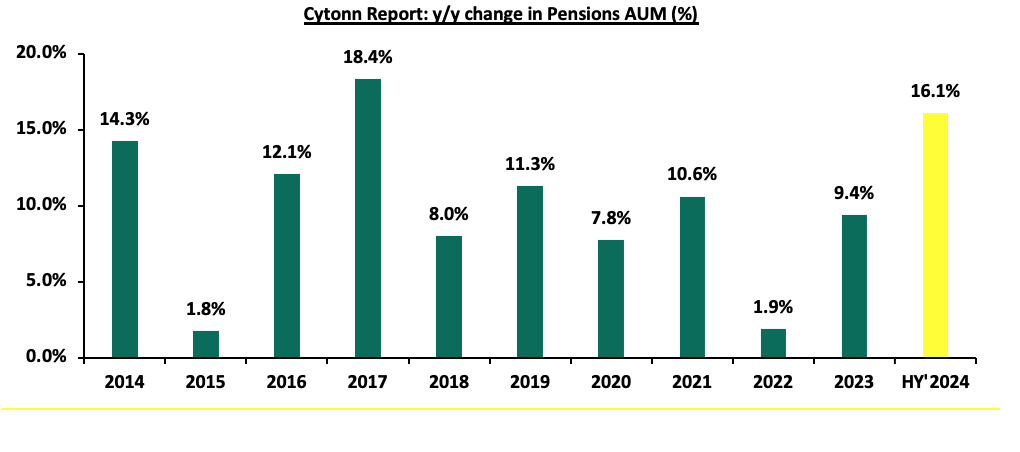
The chart below shows the y/y changes in the assets under management for the schemes over the years.
- Retirement Benefits Schemes Allocations in Various Investment Opportunities
Retirement Benefits Schemes strategically allocate funds across various asset classes available in the market to safeguard members' contributions while striving to generate attractive returns. These schemes have access to a diverse range of investment opportunities, including traditional asset classes such as equities and fixed income securities. Additionally, they can explore alternative investments such as real estate, private equity, infrastructure, and other non-traditional assets, which may offer higher returns and diversification benefits. The choice of investments is guided by the scheme's Investment Policy Statement (IPS), regulatory guidelines, and the need to align with the risk tolerance and long-term goals of the members. The table below represents how the retirement benefits schemes have invested their funds in the past:
|
Cytonn Report: Kenyan Pension Funds’ Assets Allocation |
||||||||||||||
|
Asset Class |
2014 |
2015 |
2016 |
2017 |
2018 |
2019 |
2020 |
2021 |
2022 |
2023 |
HY’2024 |
Average |
Limit |
|
|
Government Securities |
31.0% |
29.8% |
38.3% |
36.5% |
39.4% |
42.0% |
44.7% |
45.7% |
45.8% |
47.5% |
51.1% |
41.1% |
90.0% |
|
|
Immovable Property |
17.0% |
18.5% |
19.5% |
21.0% |
19.7% |
18.5% |
18.0% |
16.4% |
15.8% |
14.0% |
11.9% |
17.3% |
30.0% |
|
|
Quoted Equities |
26.0% |
23.0% |
17.4% |
19.5% |
17.3% |
17.6% |
15.6% |
16.5% |
13.7% |
8.4% |
8.8% |
16.7% |
70.0% |
|
|
Guaranteed Funds |
11.0% |
12.2% |
14.2% |
13.2% |
14.4% |
15.5% |
16.5% |
16.8% |
18.9% |
20.8% |
20.5% |
15.8% |
100.0% |
|
|
Fixed Deposits |
5.0% |
6.8% |
2.7% |
3.0% |
3.1% |
3.0% |
2.8% |
1.8% |
2.7% |
4.8% |
2.7% |
3.5% |
30.0% |
|
|
Listed Corporate Bonds |
6.0% |
5.9% |
5.1% |
3.9% |
3.5% |
1.4% |
0.4% |
0.4% |
0.5% |
0.4% |
0.4% |
2.5% |
20.0% |
|
|
Offshore |
2.0% |
0.9% |
0.8% |
1.2% |
1.1% |
0.5% |
0.8% |
1.3% |
0.9% |
1.6% |
2.0% |
1.2% |
15.0% |
|
|
Cash |
1.0% |
1.4% |
1.4% |
1.2% |
1.1% |
1.2% |
0.9% |
0.6% |
1.1% |
1.5% |
1.2% |
1.1% |
5.0% |
|
|
Unquoted Equities |
1.0% |
0.4% |
0.4% |
0.4% |
0.3% |
0.3% |
0.2% |
0.2% |
0.3% |
0.2% |
0.2% |
0.4% |
5.0% |
|
|
REITs |
0.0% |
0.0% |
0.1% |
0.1% |
0.1% |
0.0% |
0.0% |
0.0% |
0.0% |
0.6% |
0.6% |
0.1% |
30.0% |
|
|
Private Equity |
0.0% |
0.0% |
0.0% |
0.0% |
0.1% |
0.1% |
0.1% |
0.2% |
0.2% |
0.3% |
0.4% |
0.1% |
10.0% |
|
|
Others e.g. unlisted commercial papers |
0.0% |
0.0% |
0.0% |
0.0% |
0.0% |
0.0% |
0.0% |
0.1% |
0.2% |
- |
0.0% |
0.0% |
10.0% |
|
|
Commercial Paper, non-listed bonds by private companies |
- |
- |
- |
0.0% |
0.0% |
0.0% |
0.0% |
0.0% |
0.0% |
0.0% |
0.2% |
0.0% |
10.0% |
|
|
Total |
100.0% |
100.0% |
100.0% |
100.0% |
100.0% |
100.0% |
100.0% |
100.0% |
100.0% |
100.0% |
100.0% |
100.0% |
100.0% |
|
Source: Retirement Benefits Authority
Retirement benefits schemes have for a long time skewed their investments towards traditional assets, mostly, government securities and the equities market, averaging 57.8% as of 30th June 2024 for the two asset classes, leaving only 42.2% for the other asset classes. However, as pension schemes seek higher returns, diversification, and inflation hedging, there has been a growing shift towards alternative investments that include immovable property, private equity as well as Real Estate Investments Trusts (REITs). It is vital to note, that in HY’2024 the second largest increase in allocation was recorded in investments in private equity by 63.3% to Kshs 8.8 bn from Kshs 5.4 bn recorded in HY’2023 and investments in Real Estate Investments Trusts increased by 4.5% to Kshs 11.1 bn in HY’2024 from Kshs 10.6 bn in HY’2023. However, allocation to immovable property decreased by 4.1% to Kshs 236.3 bn in HY’2024 from Kshs 246.3 bn in HY’2023.
The graph below shows pension funds allocation to the various asset classes, as of HY’2024;
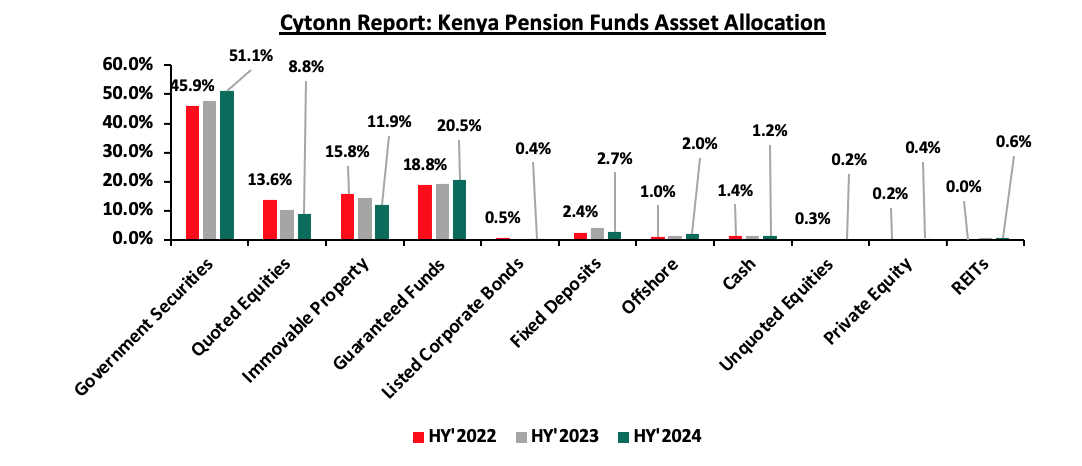
Source: RBA Industry Report
- Funding Feasibility
The shift towards alternative investments, as shown in the analysis above, presents a strong opportunity for Everstrong Capital to secure funding from local pension schemes. According to the Retirement Benefits Authority Investment Regulations and Policies, pension schemes can invest up to 10.0% of their total assets under management in debt instruments for the financing of infrastructure or affordable housing projects approved under the Public Private Partnerships Act. Kenya's pension schemes are increasingly investing in infrastructure projects to diversify their portfolios, achieve stable long-term returns, and contribute to national development. A significant initiative in this direction is the Kenya Pension Funds Investment Consortium (KEPFIC), established in 2018. KEPFIC is a collective of prominent Kenyan retirement benefit funds that have united to make long-term investments in infrastructure and alternative assets within the region. As of the latest report, KEPFIC has mobilized over USD 113.0 mn into projects such as roads, student housing, and affordable housing, involving 88 local pension funds. The table below shows the breakdown:
|
Cytonn Report: KEPFIC Investment Mobilization |
|||
|
Opportunity |
Investment Need (USD mn) |
KEPFIC Mobilization (USD mn) |
% Achieved |
|
KMRC Affordable Housing Bond |
14.0 |
52.1 |
372.1% |
|
Lot 3 Road Annuity Project Bond |
20.0 |
50.0 |
250.0% |
|
Acorn Student Accommodation REITs |
50.0 |
11.0 |
22.0% |
|
Total |
84.0 |
113.1 |
134.7% |
Source: kepfic.co.ke
Pensions funds exceeded the total investment for the three projects, mobilizing USD 113.1 mn out the required USD 84.0 mn, translating to 134.7%. This indicates a strong appetite for infrastructure and real estate projects by pension schemes in Kenya and their growing role in infrastructure financing. Notably, the road annuity project received 250.0% of the needed funds, demonstrating a preference for projects with stable and attractive returns. Everstrong Capital intends to secure the funding through a Public -Private Partnership (PPP) model backed by local pension schemes, investment banks and insurance companies in Kenya. Based on the analysis, Everstrong Capital has a strong opportunity to raise a significant portion of the required Kshs 129.2 bn from local pension schemes, given the increasing appetite for infrastructure investments. The success of Kenya Pension Funds Investment Consortium (KEPFIC) in mobilizing USD 113.1 bn for infrastructure and real estate investments further highlights the ability of pension schemes to fund long-term projects. Additionally, the Lot 3 Road Annuity Project Bond secured 250.0% of its required funding, highlighting the strong appeal of well-structured road projects under PPP models for pension funds. This bond has an eight-year tenor and offers returns benchmarked against the government’s 8-year securities interest rate, which currently stands at 12.2%. Repayments will be made quarterly after the project is completed. However, the Kshs 129.2 bn target represents 6.5% of the total pension industry AUM; Kshs 1,978.8 bn as of June 2024, which is a substantial amount. While pension funds have the capacity under regulatory limits, mobilizing the full amount from this single source may be challenging. Given past trends, our expectation would be for pension schemes to contribute between 30.0% and 50.0% of the required funding target of Kshs 129.2 bn, which is approximately Kshs 38.8 bn to Kshs 64.6 bn.
Pension funds have an alternative investment option in infrastructure bonds issued by the Kenyan government. Infrastructure bonds (IFBs) are a preferred investment for pension funds due to their low risk, government backing, and tax-exempt status. These bonds offer fixed returns and are attractive for investors seeking stability and predictable cash flows. Currently, IFBs in Kenya provide competitive yields, with current yields to maturity of ranging between 11.2% and 15.7% and tenors of up to 25.0 years.
The Usahihi Expressway is expected to generate revenue primarily through toll collections over the 30-year concession period. Toll roads historically provide stable, inflation-hedged cash flows, making them attractive to long-term institutional investors like pension funds. Consequently, pension funds looking for higher return potential may consider the Usahihi Expressway as an alternative. Unlike IFBs, which offer fixed returns, toll roads generate cash flows that grow over time, as toll rates can be adjusted for inflation and traffic volumes are expected to increase. This allows for potentially higher long-term returns compared to the fixed yields of IFBs. Additionally, infrastructure projects like this enhance portfolio diversification and provide exposure to real assets with long-term economic value.
- Conclusion and Recommendations for the Project based on our analysis
Based on our analysis, Usahihi Expressway project, backed by Everstrong Capital, has a viable opportunity to secure partial funding from local pension funds, given the increasing appetite for infrastructure investments. However, raising the full Kshs 129.0 bn from pensions schemes alone may be challenging, our expectation would be pension schemes to contribute between 30.0% and 50.0% of the amount while the rest can be supplemented by the local banks, saccos, high net worth investors and unit trust. To bridge the funding gap, the Usahihi Expressway project can explore alternative financing options such as green financing strategies e.g. a green bond or climate finance which would attract investors focused on sustainable projects and enhance the project's environmental credibility while diversifying its funding sources.
Disclaimer: The views expressed in this publication are those of the writers where particulars are not warranted. This publication, which is in compliance with Section 2 of the Capital Markets Authority Act Cap 485A, is meant for general information only and is not a warranty, representation, advice, or solicitation of any nature. Readers are advised in all circumstances to seek the advice of a registered investment advisor.

- Talk to us
- Kenya
- P.O Box 20695 - 00200, Nairobi, Kenya
- Cell +254709101200
- Tel +254709101200
- WhatsApp +254741676635
- United States
- +254709101200
- DOWNLOAD OUR APP
-


- Kenya
- 8th Floor, Pinetree Plaza, Kaburu Drive, Ngong Road, Nairobi, Kenya
- USA
- Suite 1150, 1775 Eye Street NW, USA, Washington DC 20006, USA
- Investments
- High Yield
- Private Equity
- Real Estate
- Real Estate
- RiverRun Estates
- Cytonn Towers
- The Ridge
- Taraji Heights
- The Alma