Foreign Direct Investments (FDIs) in Kenya, & Cytonn Weekly #12/2024
By Research Team, Mar 24, 2024
Executive Summary
Fixed Income
During the week, T-bills were oversubscribed, with the overall oversubscription rate coming in at 102.8%, a reversal from the undersubscription rate of 93.5% recorded the previous week. Investors’ preference for the shorter 91-day paper persisted, with the paper receiving bids worth Kshs 11.6 bn against the offered Kshs 4.0 bn, translating to an oversubscription rate of 291.2%, lower than the oversubscription rate of 351.4% recorded the previous week. The subscription rates for the 182-day paper and 364-day paper increased to 40.9% and 89.4% respectively, from 36.0% and 47.7% respectively recorded the previous week. The government accepted a total of Kshs 20.7 bn worth of bids out of Kshs 24.7 bn of bids received, translating to an acceptance rate of 83.7%. The yields on the government papers continued to rise, with the yields on the 364-day, 182-day, and 91-day papers increasing marginally by 0.01 bps, 2.4 bps, and 3.3 bps to 17.0%, 16.9%, and 16.7%, respectively;
Additionally, during the week, The Central Bank of Kenya released the auction results for the re-opened bond FXD1/2023/005 with a tenor to maturity of 4.4 years, and a coupon rate of 16.8%, and the new FXD1/2024/010 with a tenor to maturity of 10.0 years, and a fixed coupon rate of 16.0%. The bonds were oversubscribed with the overall subscription rate coming in at 149.3%, receiving bids worth Kshs 59.7 bn against the offered Kshs 40.0 bn. The government accepted bids worth Kshs 22.6 bn, translating to an acceptance rate of 37.8%. The weighted average yield of accepted bids for the FXD1/2023/005 and the FXD1/2024/010 came in at 18.4% and 16.5% respectively, which was in line with our expectation of within a bidding range of 16.3% - 16.6% for the FXD1/2024/010 but slightly below our projection of within a bidding range of 18.5% - 18.8% for the FXD1/2023/005. Notably, the FXD1/2023/005 registered a decline of 40.0 bps from the 18.8% registered in January when it was last re-opened. With the Inflation rate at 6.3% as of February 2024, the real return of the FXD1/2023/005 and the FXD1/2024/010 is 12.1% and 10.2% respectively;
Also, we are projecting the y/y inflation rate for March 2024 to come in at the range of 5.7%-6.1% mainly on the back of reduced fuel prices, the upward revision of the Central Bank Rate to 13.00% from 12.50%, strengthening of the Kenyan Shilling against the US Dollar, and reduction in electricity prices;
Equities
During the week, the equities market was on an upward trajectory, with NASI gaining the most by 5.7%, while NSE 10, NSE 25, and NSE 20 gained by 5.5%, 5.1%, and 3.0% respectively, taking the YTD performance to gains of 20.6%, 19.0%, 17.1% and 11.8% for NSE 10, NSE 25, NASI and NSE 20 respectively. The equities market performance was driven by gains recorded by large-cap stocks such as Safaricom, KCB Group, Equity Group, Coop Bank, and Stanbic of 10.2%, 6.5%,6.5%, 6.0%, and 4.2% respectively;
During the week, three of the listed banks released their FY’2023 results. KCB Group released its FY’2023 financial results, with its Core Earnings per Share (EPS) decreasing by 8.3% to Kshs 11.7, from Kshs 12.7 in FY’2022. ABSA Bank Kenya released its FY’2023 financial results, with its Core Earnings per Share (EPS) increasing by 12.2% to Kshs 3.0, from Kshs 2.7 in FY’2022 and Cooperative Bank Kenya released its FY’2023 financial results, with its Core Earnings per Share (EPS) increasing by 5.2% to Kshs 4.0, from Kshs 3.8 in FY’2022;
During the week, KCB Group Plc (KCB) announced that it had entered into a share purchase agreement on March 20, 2024 that would allow Access Bank Plc to acquire 100% shareholding in National Bank of Kenya Limited (NBK) from KCB;
Real Estate
During the week, the Affordable Housing Bill 2023 was assented to law by President William Ruto on March 19, 2024. Following the assent, the Bill shall become known as the Affordable Housing Act 2024. This enactment follows a rigorous legislative process, spurred by a High Court ruling that declared the previous housing levy unconstitutional, citing administrative and discriminatory flaws;
In the infrastructure sector, President William Ruto launched several projects in Bomet and Kericho Counties aimed at enhancing connectivity and transportation. In Bomet County, construction works commenced for the rehabilitation and upgrading of 10-Km of Bomet Town Roads. Additionally, President William Ruto launched the construction works for the upgrading and maintenance of Longisa-Sigor and Kyongong-Sigor Roads in Bomet County. In neighbouring Kericho County, the President initiated the construction works for the upgrading of Kapsuser-Sosiot (9.2 Km) and Kapsuser-Kipsolu (3.8 Km) roads;
On the Unquoted Securities Platform, Acorn D-REIT and I-REIT traded at Kshs 24.4 and Kshs 21.7 per unit, respectively, as of 22nd March 2024. The performance represented a 22.0% and 8.3% gain for the D-REIT and I-REIT, respectively, from the Kshs 20.0 inception price;
Focus of the Week
In an increasingly interconnected global economy, Foreign Direct Investments (FDIs) serve as a pivotal conduit for economic growth, innovation, and integration, and have emerged as a key indicator of a country’s economic attractiveness and competitiveness. According to the United Nations Conference on Trade and Development (UNCTAD) World Investments Report 2023, global Foreign Direct Investments (FDIs) declined by 12.0% in 2022 to USD 1.3 tn, from USD 1.6 tn in 2021. The slowdown was mainly on the back of the Ukrainian war, high food and energy prices, as well as debt pressures due to tighter financing conditions, rising interest rates, and uncertainty in the capital markets. On the contrary, Foreign Direct Investment (FDI) inflows in Kenya recorded enormous growth, having grown by 63.9% to USD 759.0 mn in 2022 from USD 463.0 mn in 2021 after a five-year dip leading to 2021;
Investment Updates:
- Weekly Rates:
- Cytonn Money Market Fund closed the week at a yield of 17.07% p.a. To invest, dial *809# or download the Cytonn App from Google Play store here or from the Appstore here;
- We continue to offer Wealth Management Training every Monday, from 10:00 am to 12:00 pm. The training aims to grow financial literacy among the general public. To register for any of our Wealth Management Trainings, click here;
- If interested in our Private Wealth Management Training for your employees or investment group, please get in touch with us through wmt@cytonn.com;
- Cytonn Insurance Agency acts as an intermediary for those looking to secure their assets and loved ones’ future through insurance namely; Motor, Medical, Life, Property, WIBA, Credit and Fire and Burglary insurance covers. For assistance, get in touch with us through insuranceagency@cytonn.com;
- Cytonn Asset Managers Limited (CAML) continues to offer pension products to meet the needs of both individual clients who want to save for their retirement during their working years and Institutional clients that want to contribute on behalf of their employees to help them build their retirement pot. To more about our pension schemes, kindly get in touch with us through pensions@cytonn.com;
Real Estate Updates:
- For more information on Cytonn’s real estate developments, email us at sales@cytonn.com;
- Phase 3 of The Alma is now ready for occupation and the show house is open daily. To join the waiting list to rent, please email properties@cytonn.com;
- For Third Party Real Estate Consultancy Services, email us at rdo@cytonn.com;
- For recent news about the group, see our news section here;
Hospitality Updates:
- We currently have promotions for Staycations. Visit cysuites.com/offers for details or email us at sales@cysuites.com;
Money Markets, T-Bills Primary Auction:
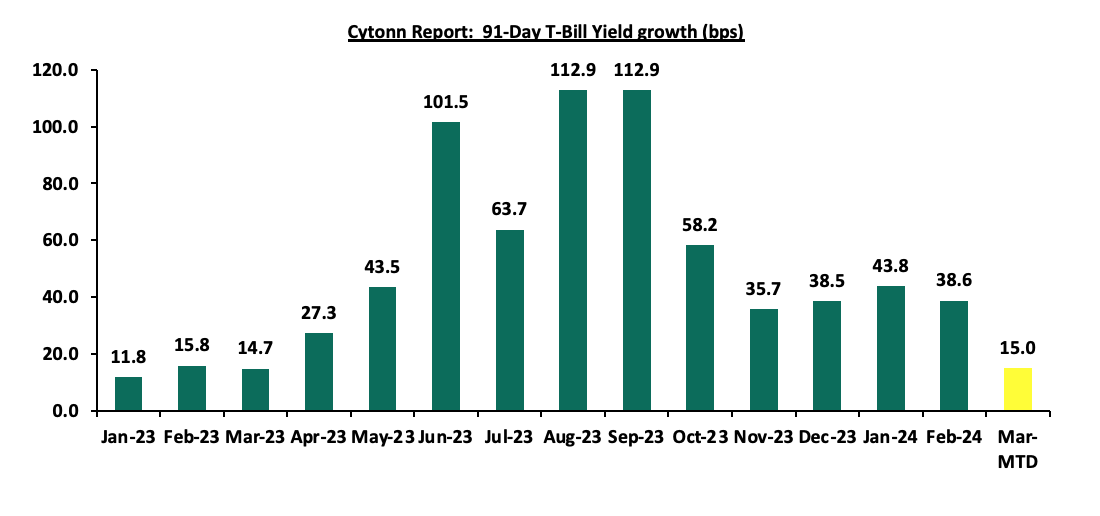
During the week, T-bills were oversubscribed, with the overall oversubscription rate coming in at 102.8%, a reversal from the undersubscription rate of 93.5% recorded the previous week. Investors’ preference for the shorter 91-day paper persisted, with the paper receiving bids worth Kshs 11.6 bn against the offered Kshs 4.0 bn, translating to an oversubscription rate of 291.2%, lower than the oversubscription rate of 351.4% recorded the previous week. The subscription rates for the 182-day paper and 364-day paper increased to 40.9% and 89.4% respectively, from 36.0% and 47.7% respectively recorded the previous week. The government accepted a total of Kshs 20.7 bn worth of bids out of Kshs 24.7 bn of bids received, translating to an acceptance rate of 83.7%. The yields on the government papers continued to rise, with the yields on the 364-day, 182-day, and 91-day papers increasing marginally by 0.01 bps, 2.4 bps, and 3.3 bps to 17.0%, 16.9%, and 16.7%, respectively. The chart below shows the yield growth rate for the 91-day paper over the period:
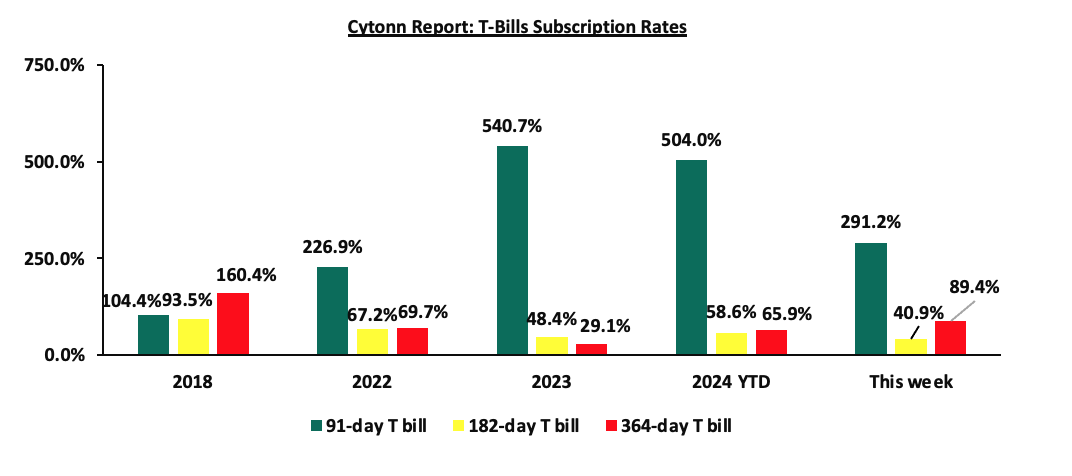
The chart below compares the overall average T-bill subscription rates obtained in 2018, 2022, 2023, 2024 Year-to-date (YTD) and this week:
Additionally, during the week, The Central Bank of Kenya released the auction results for the re-opened bond FXD1/2023/005 with a tenor to maturity of 4.4 years, and a coupon rate of 16.8% and the new FXD1/2024/010 with a tenor to maturity of 10.0 years, and a fixed coupon rate of 16.0%. The bonds were oversubscribed with the overall subscription rate coming in at 149.3%, receiving bids worth Kshs 59.7 bn against the offered Kshs 40.0 bn. The government accepted bids worth Kshs 22.6 bn, translating to an acceptance rate of 37.8%. The weighted average yield of accepted bids for the FXD1/2023/005 and the FXD1/2024/010 came in at 18.4% and 16.5% respectively, which was in line with our expectation of within a bidding range of 16.3% - 16.6% for the FXD1/2024/010 but slightly below our projection of within a bidding range of 18.5% - 18.8% for the FXD1/2023/005. Notably, the FXD1/2023/005 registered a decline of 40.0 bps from the 18.8% registered in January when it was last re-opened. With the Inflation rate at 6.3% as of February 2024, the real return of the FXD1/2023/005 and the FXD1/2024/010 is 12.1% and 10.2% respectively.
Money Market Performance:
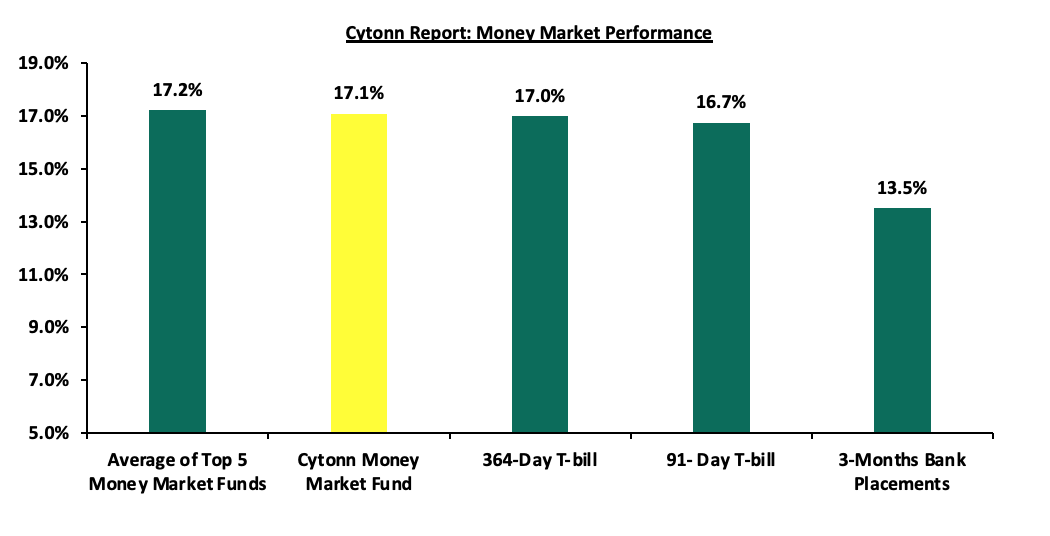
In the money markets, 3-month bank placements ended the week at 13.5% (based on what we have been offered by various banks), and the yields on the 364-day and 91-day papers increased marginally by 0.01 bps and 3.3 bps to 17.0% and 16.7%, respectively. The yields of the Cytonn Money Market Fund increased by 8.0 bps to 17.1% from the 17.0% recorded the previous week, while the average yields on the Top 5 Money Market Funds increased marginally by 5.4 bps to remained relatively unchanged from the 17.2% recorded the previous week.
The table below shows the Money Market Fund Yields for Kenyan Fund Managers as published on 22nd March 2024:
|
Cytonn Report: Money Market Fund Yield for Fund Managers as published on 22nd March 2024 |
||
|
Rank |
Fund Manager |
Effective Annual Rate |
|
1 |
Etica Money Market Fund |
17.9% |
|
2 |
Lofty-Corban Money Market Fund |
17.8% |
|
3 |
Cytonn Money Market Fund (Dial *809# or download the Cytonn App) |
17.1% |
|
4 |
GenAfrica Money Market Fund |
16.7% |
|
5 |
Nabo Africa Money Market Fund |
16.6% |
|
6 |
Madison Money Market Fund |
16.3% |
|
7 |
Kuza Money Market fund |
16.1% |
|
8 |
Enwealth Money Market Fund |
16.0% |
|
9 |
Apollo Money Market Fund |
15.9% |
|
10 |
KCB Money Market Fund |
15.5% |
|
11 |
Co-op Money Market Fund |
15.2% |
|
12 |
GenCap Hela Imara Money Market Fund |
15.2% |
|
13 |
Jubilee Money Market Fund |
15.2% |
|
14 |
Mali Money Market Fund |
15.0% |
|
15 |
AA Kenya Shillings Fund |
14.9% |
|
16 |
Sanlam Money Market Fund |
14.9% |
|
17 |
Absa Shilling Money Market Fund |
14.7% |
|
18 |
Mayfair Money Market Fund |
14.5% |
|
19 |
Equity Money Market Fund |
13.8% |
|
20 |
Orient Kasha Money Market Fund |
13.7% |
|
21 |
Old Mutual Money Market Fund |
13.7% |
|
22 |
Dry Associates Money Market Fund |
13.6% |
|
23 |
CIC Money Market Fund |
12.7% |
|
24 |
ICEA Lion Money Market Fund |
12.3% |
|
25 |
British-American Money Market Fund |
10.1% |
Source: Business Daily
Liquidity:
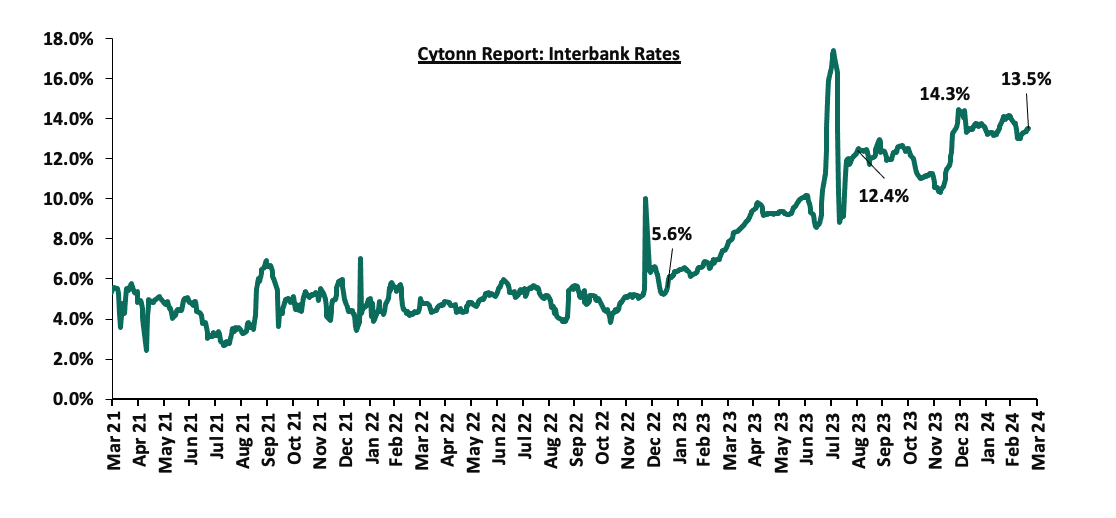
During the week, liquidity in the money markets tightened, with the average interbank rate increasing by 27.3 bps to 13.5% from 13.2% recorded the previous week, partly attributable to tax remittances that offset government payments. The average interbank volumes traded increased by 25.6% to Kshs 37.5 bn from Kshs 29.9 bn recorded the previous week. The chart below shows the interbank rates in the market over the years:
Kenya Eurobonds:
During the week, the yields on Kenya’s Eurobonds were on a downward trajectory, with the yields on the 7-year Eurobond issued in 2019 decreasing the most by 0.5% points to 8.4% from 8.9% recorded the previous week, indicating sustained positive perception by foreign investors on the country’s debt risk, after the USD 2.0 bn Eurobond buyback. The table below shows the summary of the performance of the Kenyan Eurobonds as of 21st March 2024;
|
Cytonn Report: Kenya Eurobonds Performance |
||||||
|
|
2018 |
2019 |
2021 |
2024 |
||
|
Tenor |
10-year issue |
30-year issue |
7-year issue |
12-year issue |
12-year issue |
6-year issue |
|
Amount Issued (USD) |
1.0 bn |
1.0 bn |
0.9 bn |
1.2 bn |
1.0 bn |
1.5 bn |
|
Years to Maturity |
4.0 |
24.0 |
3.2 |
8.2 |
10.3 |
6.0 |
|
Yields at Issue |
7.3% |
8.3% |
7.0% |
7.9% |
6.2% |
10.4% |
|
01-Jan-24 |
9.8% |
10.2% |
10.1% |
9.9% |
9.5% |
|
|
01-Mar-24 |
9.5% |
10.3% |
9.2% |
9.9% |
9.8% |
9.8% |
|
14-Mar-24 |
9.1% |
10.1% |
8.9% |
9.6% |
9.6% |
9.5% |
|
15-Mar-24 |
9.2% |
10.2% |
9.0% |
9.8% |
9.7% |
9.6% |
|
18-Mar-24 |
9.3% |
10.3% |
9.1% |
9.8% |
9.8% |
9.8% |
|
19-Mar-24 |
9.2% |
10.2% |
9.0% |
9.8% |
9.7% |
9.7% |
|
20-Mar-24 |
9.1% |
10.1% |
8.8% |
9.6% |
9.6% |
9.6% |
|
21-Mar-24 |
8.7% |
9.9% |
8.4% |
9.3% |
9.3% |
9.3% |
|
Weekly Change |
(0.4%) |
(0.2%) |
(0.5%) |
(0.3%) |
(0.3%) |
(0.3%) |
|
MTD Change |
(0.7%) |
(0.5%) |
(0.8%) |
(0.6%) |
(0.5%) |
(0.5%) |
|
YTD Change |
(1.1%) |
(0.3%) |
(1.7%) |
(0.6%) |
(0.2%) |
- |
Source: Central Bank of Kenya (CBK) and National Treasury
Kenya Shilling:
During the week, the Kenya Shilling gained against the US Dollar by 1.6%, to close at Kshs 132.9, from Kshs 135.1 recorded the previous week. On a year-to-date basis, the shilling has appreciated by 15.3% against the dollar, a contrast to the 26.8% depreciation recorded in 2023.
We expect the shilling to be supported by:
- Diaspora remittances standing at a cumulative USD 4,329.7 mn in the 12 months to February 2024, 7.5% higher than the USD 4,026.2 mn recorded over the same period in 2023, which has continued to cushion the shilling against further depreciation. In the February 2024 diaspora remittances figures, North America remained the largest source of remittances to Kenya accounting for 56.0% in the period, and,
- The tourism inflow receipts which came in at USD 333.9 mn in 2023, a 24.6% increase from USD 268.1 mn inflow receipts recorded in 2022, and owing to tourist arrivals that improved by 30.7% to 192,000 in the 12 months to December 2023, from 161,000 recorded during a similar period in 2022.
The shilling is however expected to remain under pressure in 2024 as a result of:
- An ever-present current account deficit which came at 3.5% of GDP in Q3’2023 from 6.4% recorded in a similar period in 2022,
- The need for government debt servicing, continues to put pressure on forex reserves given that 67.5% of Kenya’s external debt was US Dollar denominated as of September 2023, and,
- Dwindling forex reserves, currently at USD 7.0 bn (equivalent to 3.7 months of import cover), which is below the statutory requirement of maintaining at least 4.0 months of import cover.
Key to note, Kenya’s forex reserves increased marginally by 0.7% during the week to remain relatively unchanged from the USD 7.0 bn recorded the previous week, equivalent to 3.7 months of import cover, which remained relatively unchanged from the previous week, and remained below the statutory requirement of maintaining at least 4.0 months of import cover. The chart below summarizes the evolution of Kenya's months of import cover over the years:
Weekly Highlights
- March 2024 Inflation Projection
We are projecting the y/y inflation rate for March 2024 to come in at the range of 5.7%-6.1% mainly on the back of:
- Reduced Fuel Prices – The prices for Super Petrol, Diesel, and Kerosene decreased by Kshs 7.2, Kshs 5.1 and Kshs 4.5 respectively to retail at Kshs 199.2, Kshs 190.4, and Kshs 188.7 per litre, from Kshs 206.4, Kshs 195.5, and Kshs 193.2 per litre respectively according to the latest EPRA report, following the government's efforts to stabilize pump prices through the petroleum pump price stabilization mechanism which has so far expended Kshs 9.9 bn in the FY’2023/24 to cushion the increases applied to the petroleum pump prices. This decline in fuel prices is likely to contribute to the easing of inflationary pressures as it provides a stabilizing effect on consumer purchasing power as well as business operational costs,
- The upward revision of the Central Bank Rate (CBR) to 13.00% from 12.50% – Earlier this year, the monetary policy committee noted that there was a need to tighten the monetary policy following the sustained depreciation of the Kenyan shilling as well as the heightened inflationary pressures which came in at 6.9% in the month of January, 0.3% points increase from the 6.6% in December and remaining within the upper bound of the inflation target range of 2.5% to 7.5%. In line with this, the committee increased the CBR by 50 bps to 13.00% from 12.50%. The ongoing transmission of the policy tightening, coupled with the prudent monetary stance, is expected to guide the economy toward a more sustainable inflation rate,
- Strengthening of the Kenya Shilling against the US Dollar – The Kenya Shilling has gained against the dollar for the last seven consecutive weeks, having recorded a 15.3% year-to-date gain to Kshs 132.9 as of 22nd March 2024 from the Kshs 157.0 recorded at the beginning of the year. This can be attributed to the recent buyback of the USD 2.0 bn Eurobond, alleviating the debt risk on the country, inflows from foreign loans, coupled with the increase in the CBR to 13.00%. This gain in the exchange rate is expected to ease inflation further on the back of reduced import and input prices, and,
- Reduction in electricity prices – In March, EPRA announced a Kshs 1.0 decrease per unit in electricity consumer prices on reduced uptake of expensive thermal power, with the Fuel Energy Cost decreasing to Kshs 3.6 from Kshs 4.1, however, the foreign exchange rate fluctuation increased to Kshs 3.7 from Kshs 3.2 per unit despite strengthening of the Shilling. With electricity being one of the major inputs of inflation, this decline is expected to reduce production costs for businesses as well as reduce electricity costs for households thus easing inflation.
Going forward, we expect inflationary pressures to ease in the short term while remaining in the CBK’s target range of 2.5%-7.5% aided by the strengthening of the Kenya shilling against the US Dollar, which has continued to support a reduction in fuel prices. Additionally, the upward revision of the CBR to 13.00% in the latest MPC meeting, from 12.50%, is meant to continue reducing money supply, in turn easing inflation as well as supporting the exchange rate. We also expect the measures taken by the government to subsidize major inputs of agricultural production such as fertilizers to lower the cost of farm inputs and support the easing of inflation in the long term.
Rates in the Fixed Income market have been on an upward trend given the continued high demand for cash by the government and the occasional liquidity tightness in the money market. The government is 10.4% ahead of its prorated net domestic borrowing target of Kshs 347.0 bn, having a net borrowing position of Kshs 383.0 bn out of the domestic net borrowing target of Kshs 471.4 bn for the FY’2023/2024. Therefore, we expect a continued soft upward readjustment of the yield curve in the short and medium term, with the government looking to maintain the fiscal surplus through the domestic market. Owing to this, our view is that investors should be biased towards short-term fixed-income securities to reduce duration risk.
Market Performance:
During the week, the equities market was on an upward trajectory, with NASI gaining the most by 5.7%, while NSE 10, NSE 25, and NSE 20 gained by 5.5%, 5.1%, and 3.0% respectively, taking the YTD performance to gains of 20.6%, 19.0%, 17.1% and 11.8% for NSE 10, NSE 25, NASI and NSE 20 respectively. The equities market performance was driven by gains recorded by large-cap stocks such as Safaricom, KCB Group, and Equity Group of 10.2%, 6.5%, and 6.5% respectively.
During the week, equities turnover decreased by 3.7% to USD 19.1 mn from USD 19.8 mn recorded the previous week, taking the YTD total turnover to USD 94.6 mn. Foreign investors became net sellers with a net selling position of USD 0.9 mn, a reversal from the net buying position of USD 0.5 mn recorded the previous week, taking the YTD foreign net selling position to USD 8.9 mn.
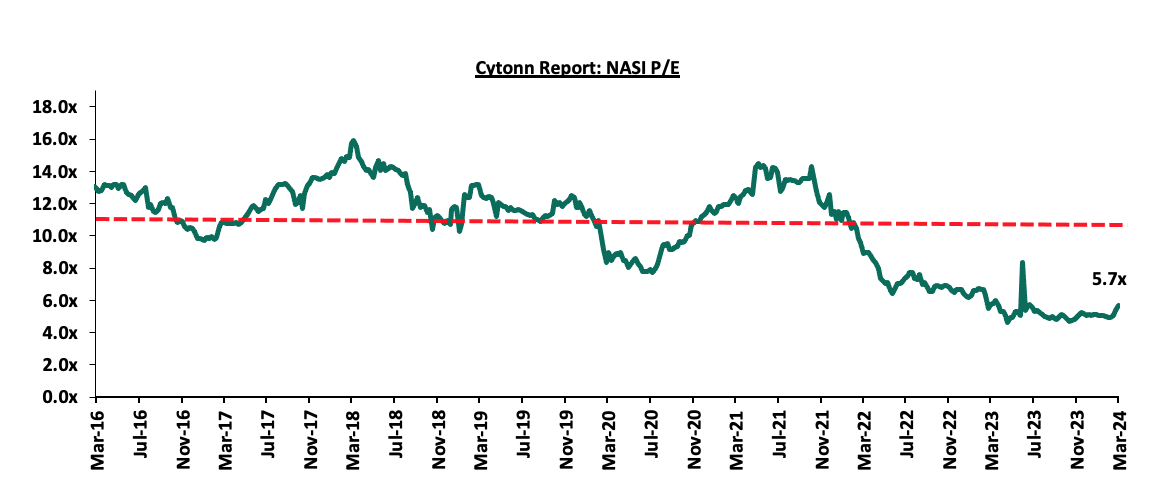
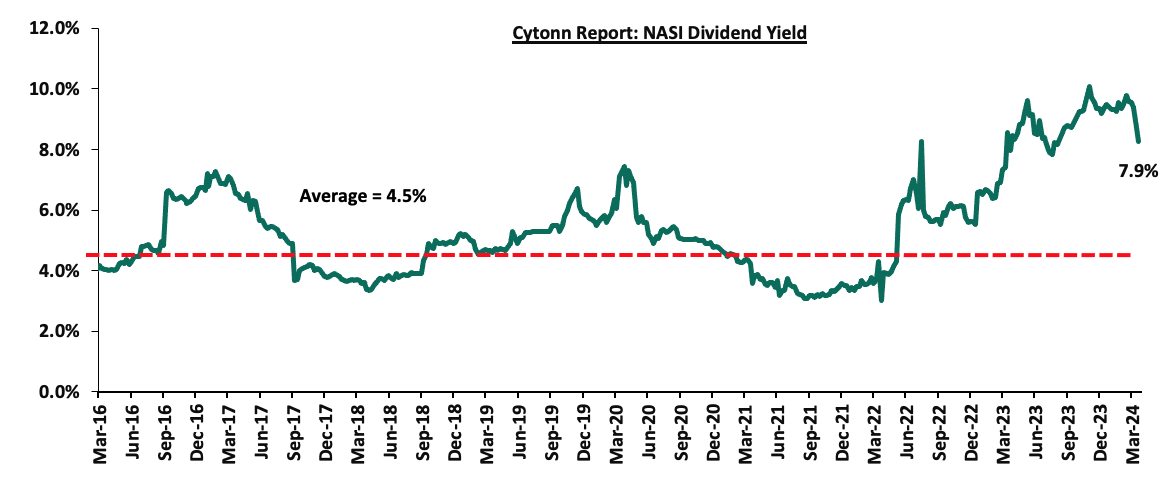
The market is currently trading at a price-to-earnings ratio (P/E) of 5.7x, 52.4% below the historical average of 12.0x. The dividend yield stands at 7.9%, 3.5% points above the historical average of 4.5%. Key to note, NASI’s PEG ratio currently stands at 0.7x, an indication that the market is undervalued relative to its future growth. A PEG ratio greater than 1.0x indicates the market is overvalued while a PEG ratio less than 1.0x indicates that the market is undervalued. The charts below indicate the historical P/E and dividend yields of the market;
Universe of Coverage:
|
Cytonn Report: Equities Universe of Coverage |
|||||||||||
|
Company |
Price as at 15/03/2024 |
Price as at 22/03/2024 |
w/w change |
m/m change |
YTD Change |
Year Open 2024 |
Target Price* |
Dividend Yield |
Upside/ Downside** |
P/TBv Multiple |
Recommendation |
|
Sanlam |
7.0 |
6.3 |
(9.7%) |
(7.4%) |
5.0% |
6.0 |
10.3 |
0.0% |
63.3% |
1.8x |
Buy |
|
Jubilee Holdings |
190.0 |
195.0 |
2.6% |
5.4% |
5.4% |
185.0 |
260.7 |
6.2% |
39.8% |
0.3x |
Buy |
|
ABSA Bank*** |
14.0 |
14.0 |
0.0% |
8.9% |
21.2% |
11.6 |
17.2 |
11.1% |
33.9% |
1.1x |
Buy |
|
Standard Chartered*** |
183.0 |
187.8 |
2.6% |
15.4% |
17.2% |
160.3 |
222.1 |
15.4% |
33.7% |
1.3x |
Buy |
|
I&M Group*** |
19.9 |
20.9 |
4.8% |
12.4% |
19.5% |
17.5 |
25.6 |
10.8% |
33.6% |
0.5x |
Buy |
|
Kenya Reinsurance |
1.9 |
2.0 |
5.2% |
3.0% |
9.7% |
1.9 |
2.5 |
9.9% |
33.5% |
0.2x |
Buy |
|
Stanbic Holdings |
118.0 |
123.0 |
4.2% |
13.6% |
16.0% |
106.0 |
145.3 |
12.5% |
30.6% |
0.9x |
Buy |
|
NCBA*** |
41.6 |
41.8 |
0.6% |
6.8% |
7.6% |
38.9 |
48.3 |
10.2% |
25.7% |
0.8x |
Buy |
|
Diamond Trust Bank*** |
49.3 |
51.0 |
3.4% |
4.6% |
14.0% |
44.8 |
58.5 |
9.8% |
24.5% |
0.2x |
Buy |
|
Equity Group*** |
42.6 |
45.4 |
6.5% |
12.1% |
32.6% |
34.2 |
52.3 |
8.8% |
24.1% |
1.0x |
Buy |
|
Liberty Holdings |
5.5 |
5.0 |
(8.7%) |
(8.7%) |
30.1% |
3.9 |
6.1 |
0.0% |
21.5% |
0.4x |
Buy |
|
Co-op Bank*** |
14.1 |
14.9 |
6.0% |
14.6% |
31.3% |
11.4 |
16.6 |
10.1% |
21.5% |
0.7x |
Buy |
|
KCB Group*** |
24.0 |
25.6 |
6.5% |
23.4% |
16.4% |
22.0 |
30.5 |
0.0% |
19.4% |
0.4x |
Accumulate |
|
CIC Group |
2.2 |
2.2 |
1.4% |
10.9% |
(2.6%) |
2.3 |
2.5 |
5.8% |
17.9% |
0.7x |
Accumulate |
|
Britam |
5.2 |
5.6 |
8.1% |
20.9% |
9.3% |
5.1 |
6.0 |
0.0% |
6.2% |
0.8x |
Hold |
|
HF Group |
4.2 |
4.4 |
4.8% |
10.0% |
27.5% |
3.5 |
3.9 |
0.0% |
(11.4%) |
0.2x |
Sell |
|
Target Price as per Cytonn Analysts’ estimates **Upside/ (Downside) is adjusted for Dividend Yield ***For Disclosure, these are stocks in which Cytonn and/or its affiliates are invested in |
|||||||||||
Weekly Highlights:
Earnings Release
- ABSA Bank Kenya FY’2023 Financial Performance
During the week, ABSA Bank Kenya released their FY’2023 financial results. Below is a summary of the performance.
|
Balance Sheet |
FY'2022 (Kshs bn) |
FY'2023 (Kshs bn) |
y/y change |
|
Net Loans and Advances |
283.6 |
335.7 |
18.4% |
|
Kenya Government Securities |
90.6 |
74.7 |
(17.5%) |
|
Total Assets |
477.2 |
519.8 |
8.9% |
|
Customer Deposits |
303.8 |
362.7 |
19.4% |
|
Deposits Per Branch |
3.7 |
4.4 |
20.9% |
|
Total Liabilities |
413.6 |
450.6 |
8.9% |
|
Shareholders' Funds |
63.6 |
69.2 |
8.8% |
|
Key Ratios |
FY'2022 |
FY'2023 |
% points change |
|
Loan to Deposit ratio |
93.4% |
92.5% |
(0.9%) |
|
Government Securities to Deposits ratio |
29.8% |
20.6% |
(9.2%) |
|
Return on Average Equity |
24.3% |
24.6% |
0.3% |
|
Return on Average Assets |
3.2% |
3.3% |
0.1% |
|
Dividend Yield |
11.0% |
11.1% |
1.1% |
|
Dividend Payout ratio |
50.3% |
51.4% |
1.1% |
|
Income Statement |
FY'2022 (Kshs bn) |
FY'2023 (Kshs bn) |
y/y change |
|
Net interest Income |
32.3 |
40.0 |
23.9% |
|
Net non-interest income |
13.7 |
14.5 |
6.3% |
|
Total Operating income |
46.0 |
54.6 |
18.7% |
|
Loan loss provision |
(6.5) |
(9.2) |
42.7% |
|
Total Operating expenses |
(25.1) |
(30.9) |
22.9% |
|
Profit before tax |
20.8 |
23.7 |
13.6% |
|
Profit after tax |
14.6 |
16.4 |
12.2% |
|
Core EPS |
2.7 |
3.0 |
12.2% |
|
Income Statement Ratios |
FY'2022 |
FY'2023 |
% points change |
|
Yield from interest-earning assets |
10.3% |
12.7% |
2.4% |
|
Cost of funding |
2.9% |
4.1% |
1.2% |
|
Net Interest Margin |
8.2% |
9.4% |
1.2% |
|
Net Interest Income as % of operating income |
70.3% |
73.4% |
3.1% |
|
Non-Funded Income as a % of operating income |
29.7% |
26.6% |
(3.1%) |
|
Cost to Income Ratio |
54.7% |
56.6% |
1.9% |
|
Cost to Income without LLP |
40.6% |
39.7% |
(0.9%) |
|
Cost to Assets |
3.9% |
4.2% |
0.3% |
|
Capital Adequacy Ratios |
FY'2022 |
FY'2023 |
% points change |
|
Core Capital/Total Liabilities |
18.4% |
16.7% |
(1.7%) |
|
Minimum Statutory ratio |
8.0% |
8.0% |
|
|
Excess |
10.4% |
8.7% |
(1.7%) |
|
Core Capital/Total Risk Weighted Assets |
14.6% |
13.6% |
(1.0%) |
|
Minimum Statutory ratio |
10.5% |
10.5% |
|
|
Excess |
4.1% |
3.1% |
(1.0%) |
|
Total Capital/Total Risk Weighted Assets |
18.6% |
18.1% |
(0.5%) |
|
Minimum Statutory ratio |
14.5% |
14.5% |
|
|
Excess |
4.1% |
3.6% |
(0.5%) |
|
Liquidity Ratio |
33.6% |
31.1% |
(2.5%) |
|
Minimum Statutory ratio |
20.0% |
20.0% |
|
|
Excess |
13.6% |
11.1% |
(2.5%) |
Key Take-Outs:
- Strong earnings growth - Core earnings per share increased by 12.2% to Kshs 3.0, from Kshs 2.7 in FY’2022, driven by the 18.7% growth in total operating income to Kshs 54.6 bn, from Kshs 46.0 bn in FY’2022,
- Declined asset quality – The bank’s Gross NPL ratio increased to 9.9% in FY’2023 from 7.5% in FY’2022, attributable to a 57.0% increase in Gross non-performing loans to Kshs 35.4 bn, from Kshs 22.5 bn in FY’2022, compared to the 19.0% increase in gross loans to Kshs 358.9 bn, from Kshs 301.7 bn recorded in FY’2022,
- Improved Lending – The bank’s loan book increased by 18.4% to Kshs 335.7 bn, from Kshs 283.6 bn in FY’2022, compared to the 17.5% decline in government securities to Kshs 74.7 bn, from Kshs 90.6 bn in FY’2022, emphasizing the bank's approach to boosting lending via digital transformation, concurrently with the effective management of its non-performing loan portfolio, and,
- Increased dividends – Dividends paid increased by 14.8% to Kshs 1.55 in FY’2023, from Kshs 1.35 in FY’2022 translating to a dividend yield of 11.1% and a dividend payout ratio of 51.4% in 2023 compared to a dividend yield of 11.0% and a dividend payout ratio of 50.3% in 2022.
For a more detailed analysis, please see the ABSA Bank’s FY’2023 Earnings Note
- KCB Group FY’2023 Financial Performance
During the week, KCB Group released their FY’2023 financial results. Below is a summary of the performance.
|
Balance Sheet Items |
FY'2022 |
FY'2023 |
y/y change |
|
Government Securities |
253.3 |
348.9 |
37.7% |
|
Net Loans and Advances |
863.3 |
1,095.9 |
27.0% |
|
Total Assets |
1,554.0 |
2,170.9 |
39.7% |
|
Customer Deposits |
1,135.4 |
1,690.9 |
48.9% |
|
Deposits per branch |
1.9 |
2.8 |
51.2% |
|
Total Liabilities |
1,347.8 |
1,934.5 |
43.5% |
|
Shareholders’ Funds |
200.2 |
228.3 |
14.0% |
|
Balance Sheet Ratios |
FY'2022 |
FY'2023 |
% points change |
|
Loan to Deposit Ratio |
76.0% |
64.8% |
(11.2%) |
|
Government Securities to Deposit Ratio |
22.3% |
20.6% |
(1.7%) |
|
Return on average equity |
22.0% |
17.5% |
(4.5%) |
|
Return on average assets |
3.0% |
2.0% |
(1.0%) |
|
Dividend Yield |
6.5% |
0.0% |
(6.5%) |
|
Dividend Payout ratio |
15.7% |
0.0% |
(15.7%) |
|
Income Statement |
FY'2022 |
FY'2023 |
y/y change |
|
Net Interest Income |
86.7 |
107.3 |
23.9% |
|
Net non-Interest Income |
43.3 |
57.9 |
33.9% |
|
Total Operating income |
129.9 |
165.2 |
27.2% |
|
Loan Loss provision |
(13.2) |
(33.6) |
154.7% |
|
Total Operating expenses |
(72.6) |
(116.8) |
60.9% |
|
Profit before tax |
57.3 |
48.5 |
(15.5%) |
|
Profit after tax |
40.8 |
37.5 |
(8.3%) |
|
Core EPS |
12.7 |
11.7 |
(8.3%) |
|
Income Statement Ratios |
FY'2022 |
FY'2023 |
% points change |
|
Yield from interest-earning assets |
10.1% |
10.3% |
0.2% |
|
Cost of funding |
2.9% |
4.0% |
1.1% |
|
Net Interest Spread |
7.3% |
6.4% |
(0.9%) |
|
Net Interest Margin |
7.5% |
6.6% |
(0.9%) |
|
Cost of Risk |
10.2% |
20.4% |
10.2% |
|
Net Interest Income as % of operating income |
66.7% |
65.0% |
(1.7%) |
|
Non-Funded Income as a % of operating income |
33.3% |
35.0% |
1.7% |
|
Cost to Income Ratio |
55.9% |
70.7% |
14.8% |
|
Capital Adequacy Ratios |
FY'2022 |
FY'2023 |
% points change |
|
Core Capital/Total Liabilities |
15.6% |
14.2% |
(1.4%) |
|
Minimum Statutory ratio |
8.0% |
8.0% |
0.0% |
|
Excess |
7.6% |
6.2% |
(1.4%) |
|
Core Capital/Total Risk Weighted Assets |
14.5% |
12.2% |
(2.3%) |
|
Minimum Statutory ratio |
10.5% |
10.5% |
0.0% |
|
Excess |
4.0% |
1.7% |
(2.3%) |
|
Total Capital/Total Risk Weighted Assets |
18.1% |
17.4% |
(0.7%) |
|
Minimum Statutory ratio |
14.5% |
14.5% |
0.0% |
|
Excess |
3.6% |
2.9% |
(0.7%) |
|
Liquidity Ratio |
40.5% |
43.5% |
3.0% |
|
Minimum Statutory ratio |
20.0% |
20.0% |
0.0% |
|
Excess |
20.5% |
23.5% |
3.0% |
Key Take-Outs:
- Decline in earnings - Core earnings per share (EPS) declined by 8.3% to Kshs 11.7, from Kshs 12.7 in FY’2022, driven by the 60.9% growth in total operating expenses to Kshs 116.8 bn, from Kshs 72.6 bn in FY’2022, which outpaced the 27.2% growth in total operating income to Kshs 165.2 bn, from Kshs 129.9 bn in FY’2022,
- Increased Provisioning – On the back of high credit risk occasioned by the deteriorated business environment, the bank increased its provisions holdings to cover for the anticipated losses in the future, with its provisions increasing by 52.0% to Kshs 107.3 bn from Kshs 70.6 bn recorded in FY’2022, and,
- Revenue Diversification – The Group’s Non-Funded income increased by 33.9% to Kshs 57.9 bn in FY’2023, from Kshs 43.3 bn in FY’2022, which resulted in a shift in revenue to 65:35 from 67:33 in FY’2022. The increase was mainly attributable to a faster 33.9% increase in non-funded income to Kshs 57.9 bn, from Kshs 33.9 bn in FY’2022, compared to the 23.9% increase in Funded income to kshs 107.3 bn, from Kshs 86.7 bn in FY’2022, and,
- Lack of dividend Payout – The Group’s board of directors declined to announce any dividends for the FY’2023 citing the group’s attempt to conserve capital. Notably, though the Group remains capitalized, the core capital to total risk-weighted assets declined by 2.3% points to 12.2% in FY’2023, from 14.5% in FY’2022 which is 1.7% above the statutory requirement of 10.5% compared to an excess of 4.0% points in FY’2022.
For a more detailed analysis, please see the KCB Group FY’2023 Earnings Note
- Cooperative Bank of Kenya FY’2023 Financial Performance
During the week, Cooperative Bank of Kenya released their FY’2023 financial results. Below is a summary of the performance
|
Balance Sheet |
FY'2022 (Kshs bn) |
FY'2023 (Kshs bn) |
y/y change |
|
Government Securities |
173.3 |
189.0 |
9.1% |
|
Net Loans and Advances |
339.4 |
374.2 |
10.3% |
|
Total Assets |
607.2 |
671.1 |
10.5% |
|
Customer Deposits |
423.8 |
451.6 |
6.6% |
|
Total Liabilities |
499.3 |
557.5 |
11.7% |
|
Shareholders Funds |
107.7 |
113.6 |
5.5% |
|
Key Ratios |
FY'2022 |
FY'2023 |
% points change |
|
Loan to Deposit Ratio |
80.1% |
82.9% |
2.8% |
|
Government Securities to Deposits Ratio |
40.9% |
41.9% |
1.0% |
|
Return on average equity |
21.2% |
21.0% |
(0.2%) |
|
Return on average assets |
3.7% |
3.6% |
(0.1%) |
|
Dividend Yield |
12.2% |
10.1% |
(2.1%) |
|
Dividend Payout Ratio |
39.9% |
38.0% |
(1.9%) |
|
Income Statement |
FY'2022 (Kshs bn) |
FY'2023 (Kshs bn) |
y/y change |
|
Net interest Income |
45.5 |
45.2 |
(0.6%) |
|
Net non-interest income |
25.7 |
26.5 |
2.8% |
|
Total Operating income |
71.3 |
71.7 |
0.6% |
|
Loan loss provision |
(8.68) |
(6.01) |
(30.8%) |
|
Total Operating expenses |
(42.2) |
(39.7) |
(6.1%) |
|
Profit before tax |
29.4 |
32.4 |
10.0% |
|
Profit after tax |
22.0 |
23.2 |
5.2% |
|
Core EPS |
3.8 |
4.0 |
5.2% |
|
Income Statement Ratios |
FY'2022 |
FY'2023 |
% points change |
|
Yield from interest-earning assets |
12.0% |
12.4% |
0.4% |
|
Cost of funding |
3.5% |
4.8% |
1.3% |
|
Net Interest Margin |
8.9% |
8.1% |
(0.8%) |
|
Net Interest Income as % of operating income |
63.9% |
63.1% |
(0.8%) |
|
Non-Funded Income as a % of operating income |
36.1% |
36.9% |
0.8% |
|
Cost to Income Ratio |
59.3% |
55.3% |
(3.9%) |
|
Cost to Income without LLP |
47.1% |
47.0% |
(0.1%) |
|
Cost to Assets |
5.5% |
5.0% |
(0.5%) |
|
Capital Adequacy Ratios |
FY'2022 |
FY'2023 |
% points change |
|
Core Capital/Total Liabilities |
21.9% |
23.4% |
1.5% |
|
Minimum Statutory ratio |
8.0% |
8.0% |
|
|
Excess |
13.9% |
15.4% |
1.5% |
|
Core Capital/Total Risk Weighted Assets |
16.9% |
18.2% |
1.3% |
|
Minimum Statutory ratio |
10.5% |
10.5% |
|
|
Excess |
6.4% |
7.7% |
1.3% |
|
Total Capital/Total Risk Weighted Assets |
18.0% |
22.5% |
4.5% |
|
Minimum Statutory ratio |
14.5% |
14.5% |
|
|
Excess |
3.5% |
8.0% |
4.5% |
|
Liquidity Ratio |
48.3% |
52.0% |
3.7% |
|
Minimum Statutory ratio |
20.0% |
20.0% |
|
|
Excess |
28.3% |
32.0% |
3.7% |
Key Take-Outs:
- Sustained earnings growth - Core earnings per share increased by 5.2% to Kshs 4.0, from Kshs 3.8 in FY’2022, driven by the 0.6% growth in total operating income to Kshs 71.7 bn, from Kshs 71.3 bn in FY’2022,
- Asset Growth – the bank’s total assets grew by 10.5% to Kshs 671.1 bn in FY’2023 from Kshs 607.2 bn in FY’2022, driven by a 10.3% expansion of the loan book to Kshs 374.2 bn from Kshs 339.4 bn in FY’2022,
- Declined asset quality – The bank’s Gross NPL ratio increasing to 16.2% in FY’2023 from 14.0% in FY’2022, attributable to 27.9% increase in Gross non-performing loans to Kshs 66.9 bn, from Kshs 52.3 bn in FY’2022, compared to the 10.4% increase in gross loans to Kshs 412.5 bn, from Kshs 373.5 bn recorded in FY’2022,
- Improved Efficiency – Cost to Income Ratio (CIR) decreased to 53.3% from 59.3% in FY’2022, owing to the 6.1% decrease in total operating expenses, compared to the 0.6% increase in total operating income. Notably, CIR without LLP decreased by 0.1% points to 47.0% from 47.1% recorded in FY’2022,
- Exposure to Government Securities – the bank registered a 9.1% increase in investment securities to Kshs 189.0 bn, from Kshs 173.3 bn in FY’2022, taking advantage of the high yield offered by the government on their securities during the year, and,
- Dividend Payment – Dividends paid remained unchanged at Kshs 1.5 in FY’2023, as were issued in FY’2022 translating to a dividend yield of 10.7% and a dividend payout ratio of 38.0% in 2023 compared to a dividend yield of 12.2% and a dividend payout ratio of 39.9% in 2022.
For a more detailed analysis, please see the Cooperative Bank of Kenya FY’2023 Earnings Note
Asset Quality:
The table below shows the asset quality of listed banks that have released their FY’2023 results using several metrics:
|
Cytonn Report: Listed Banks Asset Quality in FY’2023 |
||||||
|
|
FY'2023 NPL Ratio* |
FY'2022 NPL Ratio** |
% point change in NPL Ratio |
FY'2023 NPL Coverage* |
FY'2022 NPL Coverage** |
% point change in NPL Coverage |
|
Stanbic Bank |
9.5% |
11.2% |
(1.7%) |
70.4% |
63.1% |
7.4% |
|
Standard Chartered Bank Kenya |
9.7% |
14.2% |
(4.5%) |
81.6% |
87.1% |
(5.6%) |
|
ABSA Bank Kenya |
9.9% |
7.5% |
2.4% |
65.6% |
80.5% |
(14.9%) |
|
KCB |
17.0% |
17.0% |
(0.0%) |
62.5% |
52.4% |
10.1% |
|
Co-operative Bank of Kenya |
16.2% |
14.0% |
2.2% |
57.2% |
65.1% |
(8.0%) |
|
Mkt Weighted Average* |
12.9% |
11.7% |
1.2% |
66.5% |
67.4% |
(0.9%) |
|
*Market cap weighted as at 22/03/2024 |
||||||
|
**Market cap weighted as at 20/04/2023 |
||||||
Key take-outs from the table include;
- Asset quality for the listed banks that have released declined during FY’2023, with the market-weighted average NPL ratio increasing by 1.2% points to 12.9% from 11.7% in FY’2022, and,
- Market-weighted average NPL Coverage for the listed banks decreased by 0.9% points to 66.5% in FY’2023 from 67.4% recorded in FY’2022. The increase was attributable to KCB Group’s coverage ratio increasing by 10.1% to 62.5% from 52.4% in FY’2022, coupled with Stanbic Holding’s NPL coverage ratio increasing by 7.4% points to 70.4% from 63.1% in FY’2022. The performance was however weighed down by ABSA Bank’s NPL Coverage ratio decreasing by 14.9% to 65.6%, from 80.5% in FY’2022.
Summary Performance
The table below shows the performance of listed banks that have released their FY’2023 results using several metrics:
|
Cytonn Report: Listed Banks Performance in FY’2023 |
|||||||||||||
|
Bank |
Core EPS Growth |
Interest Income Growth |
Interest Expense Growth |
Net Interest Income Growth |
Net Interest Margin |
Non-Funded Income Growth |
NFI to Total Operating Income |
Deposit Growth |
Growth in Government Securities |
Loan to Deposit Ratio |
Return on Average Equity |
Dividend Yield |
Dividend payout ratio |
|
Stanbic |
34.2% |
48.0% |
71.7% |
35.4% |
7.9% |
19.3% |
37.9% |
17.3% |
(27.4%) |
78.7% |
18.6% |
12.5% |
49.9% |
|
SCBK |
16.4% |
27.0% |
(6.9%) |
32.0% |
8.3% |
5.5% |
29.7% |
22.9% |
(34.2%) |
47.6% |
23.5% |
15.4% |
79.2% |
|
ABSA Bank |
12.2% |
32.8% |
66.5% |
23.9% |
9.4% |
6.3% |
26.6% |
19.4% |
(17.5%) |
92.5% |
24.6% |
11.1% |
51.4% |
|
KCB |
(8.3%) |
42.8% |
95.6% |
23.9% |
6.6% |
33.9% |
35.0% |
48.9% |
37.7% |
64.8% |
17.5% |
0.0% |
0.0% |
|
Co-op Bank |
5.2% |
11.9% |
46.9% |
(0.6%) |
8.1% |
2.8% |
36.9% |
6.6% |
9.1% |
82.9% |
21.0% |
10.1% |
38.0% |
|
FY'23 Mkt Weighted Average* |
9.5% |
30.9% |
55.1% |
21.0% |
8.0% |
13.3% |
33.1% |
23.4% |
(3.0%) |
73.5% |
21.1% |
9.3% |
41.6% |
|
FY'22 Mkt Weighted Average* |
26.6% |
19.7% |
20.1% |
19.2% |
7.2% |
31.6% |
37.7% |
13.7% |
3.1% |
71.8% |
21.8% |
9.6% |
36.6% |
|
*Market cap weighted as at 22/03/2024 |
|||||||||||||
|
**Market cap weighted as at 20/04/2023 |
|||||||||||||
Key take-outs from the table include:
- The listed banks recorded a 9.5% growth in core Earnings per Share (EPS) in FY’2023, compared to the weighted average growth of 26.6% in FY’2022, an indication of declined performance attributable to the tough operating environment experienced during the year,
- Non-Funded Income grew by 13.3% compared to market-weighted average growth of 31.6% in FY’2022, despite the increased revenue diversification efforts by the banks, and,
- The Banks recorded a weighted average deposit growth of 23.4%, higher than the market-weighted average deposit growth of 13.7% in FY’2022.
- The Banks recorded a weighted average dividend yield of 9.3% in FY’2023, slightly lower than the weighted average dividend yield of 9.6% in FY’2022. Similarly, the bank’s weighted average dividend payout ratio increased to 41.6%, from a weighted average payout ratio of 36.6% in FY’2022.
- Access Bank to Acquire 100% shareholding of the National Bank of Kenya
During the week, KCB Group Plc (KCB) announced that it had entered into a share purchase agreement with Access Bank on March 20, 2024 that would allow Access Bank Plc to acquire 100% shareholding in National Bank of Kenya Limited (NBK) from KCB. Key to note, KCB bank had acquired the National Bank of Kenya back in 2019 in a rescue deal that was supervised by the Central Bank of Kenya.
This move follows the release of the FY’2023 results for the group, which revealed a decline in earnings. Core earnings per share (EPS) declined by 8.3% to Kshs 11.7, from Kshs 12.7 in FY’2022, driven by the 60.9% growth in total operating expenses to Kshs 116.8 bn, from Kshs 72.6 bn in FY’2022, which outpaced the 27.2% growth in total operating income to Kshs 165.2 bn, from Kshs 129.9 bn in FY’2022. The results also revealed a more aggressive approach towards dealing with credit risk, with its provisions increasing by 52.0% to Kshs 107.3 bn from Kshs 70.6 bn recorded in FY’2022.
In a surprise move, KCB group also announced that it would not be paying dividends for the financial year ending 31st December 2023 in an attempt to conserve capital. Notably, though the Group remained capitalized, the core capital to total risk-weighted assets declined by 2.3% points to 12.2% in FY’2023, from 14.5% in FY’2022 which is 1.7% above the statutory requirement of 10.5% compared to an excess of 4.0% points in FY’2022. NBK's core capital to risk-weighted asset ratio was 6.9% in Q3’2023, below the minimum requirement of 10.5%
In the signed deal, Access will pay multiples of 1.3x the book value of NBK, which stood at Kshs 10.6 bn as of end December 2023. This values the deal at about Kshs 13.3 bn with the actual figure to be announced when the transaction is completed. The 1.3x multiple stands just above the 1.2x 10-year average for bank acquisitions and is equal to last year Equity Group’s 1.3x multiple on the acquisition of Cogebanque Plc ltd.
The table below shows the summary of bank acquisitions from November 2013
|
Cytonn Report: Banking Sector Deals and Acquisitions |
||||||
|
Acquirer |
Bank Acquired |
Book Value at Acquisition (Kshs bn) |
Transaction Stake |
Transaction Value (Kshs bn) |
P/Bv Multiple |
Date |
|
Access Bank PLC (Nigeria)* |
National Bank of Kenya |
10.6 |
100.00% |
13.3 |
1.3x |
Mar-24 |
|
Equity Group |
Cogebanque PLC ltd |
5.7 |
91.13% |
6.7 |
1.3x |
Jun-23 |
|
Shorecap III |
Credit Bank Plc |
3 |
20.00% |
Undisclosed |
N/A |
Jun-23 |
|
Premier Bank Limited |
First Community Bank |
2.8 |
62.50% |
Undisclosed |
N/A |
Mar-23 |
|
KCB Group PLC |
Trust Merchant Bank (TMB) |
12.4 |
85.00% |
15.7 |
1.5x |
Dec-22 |
|
Equity Group |
Spire Bank |
Unknown |
Undisclosed |
Undisclosed |
N/A |
Sep-22* |
|
Access Bank PLC (Nigeria)* |
Sidian Bank |
4.9 |
83.40% |
4.3 |
1.1x |
June-22* |
|
KCB Group |
Banque Populaire du Rwanda |
5.3 |
100.00% |
5.6 |
1.1x |
Aug-21 |
|
I&M Holdings PLC |
Orient Bank Limited Uganda |
3.3 |
90.00% |
3.6 |
1.1x |
Apr-21 |
|
KCB Group** |
ABC Tanzania |
Unknown |
100.00% |
0.8 |
0.4x |
Nov-20* |
|
Co-operative Bank |
Jamii Bora Bank |
3.4 |
90.00% |
1 |
0.3x |
Aug-20 |
|
Commercial International Bank |
Mayfair Bank Limited |
1 |
51.00% |
Undisclosed |
N/A |
May-20* |
|
Access Bank PLC (Nigeria) |
Transnational Bank PLC. |
1.9 |
100.00% |
1.4 |
0.7x |
Feb-20* |
|
Equity Group ** |
Banque Commerciale Du Congo |
8.9 |
66.50% |
10.3 |
1.2x |
Nov-19* |
|
KCB Group |
National Bank of Kenya |
7 |
100.00% |
6.6 |
0.9x |
Sep-19 |
|
CBA Group |
NIC Group |
33.5 |
53%:47% |
23 |
0.7x |
Sep-19 |
|
Oiko Credit |
Credit Bank |
3 |
22.80% |
1 |
1.5x |
Aug-19 |
|
CBA Group** |
Jamii Bora Bank |
3.4 |
100.00% |
1.4 |
0.4x |
Jan-19 |
|
AfricInvest Azure |
Prime Bank |
21.2 |
24.20% |
5.1 |
1.0x |
Jan-18 |
|
KCB Group |
Imperial Bank |
Unknown |
Undisclosed |
Undisclosed |
N/A |
Dec-18 |
|
SBM Bank Kenya |
Chase Bank Ltd |
Unknown |
75.00% |
Undisclosed |
N/A |
Aug-18 |
|
DTBK |
Habib Bank Kenya |
2.4 |
100.00% |
1.8 |
0.8x |
Mar-17 |
|
SBM Holdings |
Fidelity Commercial Bank |
1.8 |
100.00% |
2.8 |
1.6x |
Nov-16 |
|
M Bank |
Oriental Commercial Bank |
1.8 |
51.00% |
1.3 |
1.4x |
Jun-16 |
|
I&M Holdings |
Giro Commercial Bank |
3 |
100.00% |
5 |
1.7x |
Jun-16 |
|
Mwalimu SACCO |
Equatorial Commercial Bank |
1.2 |
75.00% |
2.6 |
2.3x |
Mar-15 |
|
Centum |
K-Rep Bank |
2.1 |
66.00% |
2.5 |
1.8x |
Jul-14 |
|
GT Bank |
Fina Bank Group |
3.9 |
70.00% |
8.6 |
3.2x |
Nov-13 |
|
Average |
|
|
77.00% |
|
1.2x |
|
|
Average: 2013 to 2018 |
|
|
73.50% |
|
1.7x |
|
|
Average: 2019 to 2024 |
|
|
78.90% |
|
1.0x |
|
|
* Announcement Date ** Deals that were dropped |
||||||
The completion of the deal will be subject to approvals by the Central Bank of Kenya, the Central Bank of Nigeria, the COMESA Competition Commission, and a number of other regulators.
We are “Neutral” on the Equities markets in the short term due to the current tough operating environment and huge foreign investor outflows, and, “Bullish” in the long term due to current cheap valuations and expected global and local economic recovery. With the market currently being undervalued for its future growth (PEG Ratio at 0.7x), we believe that investors should reposition towards value stocks with strong earnings growth and that are trading at discounts to their intrinsic value. We expect the current high foreign investors’ sell-offs to continue weighing down the equities outlook in the short term.
- Statutory Review
During the week, the Affordable Housing Bill 2023 was assented to law by President William Ruto on March 19, 2024. Following the assent, the Bill shall become known as the Affordable Housing Act 2024. This enactment follows a rigorous legislative process, spurred by a High Court ruling that declared the previous housing levy unconstitutional, citing administrative and discriminatory flaws. In the wake of this ruling, the government embarked on creating a more robust and inclusive framework for addressing the nation's housing needs. The assent of the Affordable Housing Act 2024 represents a decisive step forward, signalling the government's unwavering commitment to fostering access to affordable housing for all Kenyan citizens.
The key provisions of this Act include:
- Affordable Housing Levy: Under this framework, a 1.5% levy is imposed on the gross salaries of employees, complemented by an equivalent contribution from employers. Additionally, non-salaried individuals are required to remit 1.5% of their gross income towards this levy. Commencing from March 19, 2024, this levy is envisioned to serve as a crucial financial mechanism, channelling resources towards a comprehensive array of affordable housing initiatives aimed at alleviating the housing deficit and enhancing housing accessibility for all segments of society,
- Levy Administration: The Kenya Revenue Authority (KRA) is tasked with collecting the levy, due by the ninth working day of the month following the accrual of income. An amendment to Section 7 of the Affordable Housing Bill 2023 replaced the previous provision regarding penalties for unpaid levies with a new clause specifying the procedures for the recovery of the levy. Initially, the Bill had specified a 3.0% penalty per month as a penalty for non-compliance. The revised section now states that the levy shall be considered a debt owed to the government and will be recoverable in accordance with the Tax Procedures Act, 2015. This change simplifies the process for the recovery of unpaid levies by aligning it with the existing framework outlined in the Tax Procedures Act, 2015. By categorizing the levy as a debt owed to the government, it ensures that standard procedures for debt recovery, as specified in the Tax Procedures Act, will apply. This includes mechanisms such as issuance of demand notices, imposition of penalties and interest for late payment, and potential legal actions for non-compliance,
- Affordable Housing Fund: Section 9 of the assented Affordable Housing Act introduces several changes to the sources of funding for the Fund. The revised section expands the sources of income by including voluntary contributions made under section 38 and specifies that all proceeds of sale, rent, and interest shall be paid into the Fund. The addition of voluntary contributions under section 38 broadens the base of potential funding sources for the Fund. This provision allows for contributions from individuals or entities who voluntarily choose to support the objectives of the Fund, thereby increasing the available resources for affordable housing initiatives. Additionally, the amendment to Section 10 of the Affordable Housing Act introduces several modifications to the functions and objectives of the Fund. The revised section expands the scope of activities and introduces new provisions to enhance the effectiveness of the Fund in achieving its goals. Firstly, the addition of "low monthly payment home loans, where applicable" under subsection (b) provides an alternative financing option for acquiring affordable housing units. This addition recognizes the varying financial capabilities of individuals and aims to make homeownership more accessible by offering flexible payment options. Secondly, the inclusion of "facilitate development of institutional housing units" under subsection (d) expands the Fund's mandate to support the development of institutional housing. This provision acknowledges the importance of addressing housing needs across different segments of society, including institutional housing for specific groups or organizations,
- Tax Reliefs and Incentives: For businesses, the Act allows for the tax-deductibility of expenditure related to the affordable housing levy. On the other hand, residents stand to benefit from affordable housing relief, which provides tax incentives for individuals contributing to the affordable housing fund. Under this relief, residents can claim a deduction capped at 15.0% of their annual contributions, providing financial incentives for individuals to participate in the affordable housing scheme. This relief not only reduces the tax burden for individuals but also serves as a mechanism to incentivize savings and investment in affordable housing initiatives,
- Regulatory Framework: The Act establishes regulations for eligibility for housing allocation, voluntary savings, and governance structures like the County Rural and Urban Affordable Housing Committee. The Act sets out eligibility criteria for the allocation of housing units, defining the parameters for individuals to qualify for affordable housing such as a national identity card or incorporation certificate in the case of a body corporate, a deposit, and also a KRA PIN together with a tax compliance certificate,
- Affordable Housing Agencies: The new Act recognizes the multifaceted nature of affordable housing and the need for collaboration among various stakeholders. As such, it designates six agencies to spearhead the implementation efforts:
- County Government: At the local level, county governments play a pivotal role in planning, allocating resources, and overseeing the execution of affordable housing projects tailored to the specific needs of their jurisdictions,
- National Housing Corporation: As a key player in the housing sector, the National Housing Corporation is entrusted with facilitating the development and management of affordable housing units, particularly for low and middle-income earners,
- Kenya Slum Upgrading, Low-Cost Housing and Infrastructure Trust Fund: Established under the Government Financial Management Regulations 2006, this trust fund is instrumental in financing slum upgrading initiatives, low-cost housing projects, and essential infrastructure development in underserved communities,
- State Department Responsible for Matters Relating to Affordable Housing: This department assumes a central role in formulating policies, regulations, and strategies aimed at promoting affordable housing and ensuring equitable access to housing opportunities for all Kenyans,
- National Social Security Fund: Leveraging its financial resources and expertise, the National Social Security Fund contributes to the provision of affordable housing through investments in housing projects and schemes targeting its members and the wider population, and,
- Private Sector Agencies: Recognizing the pivotal role of private sector participation in advancing affordable housing, the Act empowers the Affordable Housing Board to approve private sector agencies to support housing initiatives. These agencies bring innovation, expertise, and additional resources to augment government-led efforts in addressing housing challenges.
- Transition Provisions: Previous levy payments and ongoing projects are seamlessly transitioned under the Act, ensuring continuity and legal clarity.
Despite its enactment, the Act faces legal challenges with petitions highlighting concerns over public participation and overbearing obligations on citizens. Employers and taxpayers are urged to comply with the levy requirements, while the KRA provides guidance on deductions and remittances, emphasizing accountability and transparency. Notably, the Act's retrospective application raises debates on legal interpretation, especially regarding refunds and tax reliefs, requiring careful consideration and judicial scrutiny.
We expect ongoing adjustments and the introduction of new legal frameworks by both national and county governments to improve transparency, efficiency, and compliance in the Real Estate sector. These measures are aimed at bolstering Kenya's competitive edge in attracting Real Estate investments within the region. The recently enacted Affordable Housing Act 2024 is set to invigorate residential sector activities in several ways: i) the Act will provide critical funding for nationwide affordable housing projects, potentially addressing the country's substantial housing shortfall, currently estimated at 80.0%, ii) incentives outlined in the legislation will support private sector initiatives to construct affordable housing units priced within reach of Kenyan homeowners, iii) implementation of the Act is expected to create employment opportunities, boost incomes in the construction sector, and stimulate overall economic growth, and, iv) by offering housing options to low- and middle-income earners, the Act aims to reduce housing disparities and enhance social equity bridging the gap between different income brackets.
- Infrastructure Sector
During the week, President William Ruto launched several projects in Bomet and Kericho Counties aimed at enhancing connectivity and transportation. In Bomet County, construction works commenced for the rehabilitation and upgrading of 10-Km of Bomet Town Roads. This project, valued at Kshs 450.0 mn, will see the rehabilitation of 6-Km of roads and the upgrading of 4-Km. Funded by the exchequer and supervised by the Kenya Urban Roads Authority (KURA), the initiative aims to improve road infrastructure within the town, promoting smoother traffic flow and enhancing accessibility. Additionally, plans for the design of the Bomet University-Chebirir Road, spanning 3.5-Km, are underway.
Additionally, President William Ruto launched the construction works for the upgrading and maintenance of Longisa-Sigor and Kyongong-Sigor Roads in Bomet County. The 60-Km project, valued at Kshs 2.1 bn, involves upgrading the roads to Bitumen standards and subsequent maintenance for 36 months post-completion at a cost of Kshs 126.0 mn. Spearheaded by M/S China Civil Engineering Construction Corporation and supervised by Kenya Roads Authority (KeRRA), this endeavor aims to bolster connectivity and facilitate economic growth in the region.
In neighbouring Kericho County, the President initiated the construction works for the upgrading of Kapsuser-Sosiot (9.2-Km) and Kapsuser-Kipsolu (3.8-Km) Roads. Spanning a total of 13-Km, the project, funded by the government at a cost of Kshs 906.0 mn, seeks to improve road conditions and connectivity within the county. Implemented by M/S Amanta Construction Company under the supervision of Kenya Rural Roads Authority, the project is expected to enhance transportation efficiency and spur development in the area.
We expect these initiatives to catalyse socio-economic transformation by enhancing accessibility, streamlining trade routes, and fostering economic prosperity not only within the respective counties but also across neighbouring regions. Improved road infrastructure will expedite the movement of goods and people, reducing transportation costs and boosting productivity. Enhanced connectivity will attract investments, spur business activities, and create employment opportunities, thus driving overall economic growth and development. Additionally, the upgraded roads will promote tourism, attract investors, and facilitate the integration of local communities into the broader national and international markets, fostering sustainable socio-economic progress.
- Real Estate Investments Trusts (REITs)
In the Unquoted Securities Platform, Acorn D-REIT and I-REIT traded at Kshs 24.4 and Kshs 21.7 per unit, respectively, as of 22nd March 2024. The performance represented a 22.0% and 8.3% gain for the D-REIT and I-REIT, respectively, from the Kshs 20.0 inception price. The volumes traded for the D-REIT and I-REIT came in at 12.3 mn and 30.7 mn shares, respectively, with a turnover of Kshs 257.5 mn and Kshs 633.8 mn, respectively, since inception in February 2021.
REITs provide various benefits like tax exemptions, diversified portfolios, and stable long-term profits. However, the continuous deterioration in the performance of Kenyan REITs and the restructuring of their business portfolios is hampering major investments that had previously been made. The other general challenges include; i) inadequate comprehension of the investment instrument among investors, ii) prolonged approval processes for REITs creation, iii) high minimum capital requirements of Kshs 100.0 mn for trustees, and, iv) minimum investment amounts set at Kshs 5.0 mn, continue to limit the performance of the Kenyan REITs market.
We foresee the Real Estate sector in Kenya being bolstered by several key factors: i) expanded initiatives and the progression of affordable housing projects are poised to catalyze growth in the residential segment, ii) favourable demographics, including population growth and urbanization, are driving heightened demand for housing and Real Estate assets, and, iii) ongoing infrastructure enhancements are creating new investment avenues in burgeoning areas. However, challenges such as escalating construction costs, limited investor familiarity with Real Estate Investment Trusts (REITs), and existing oversupply in certain market segments may persist. These hurdles could constrain sectoral performance by impeding development and investment opportunities.
Foreign Direct Investments (FDIs) refer to investments made by a firm or individual in one country into business interests located in another country. Generally, FDI takes place when an investor establishes foreign business operations or acquires foreign business assets, including establishing ownership or controlling interest in a foreign company. FDIs are crucial for economic growth as they not only bring investment capital but also facilitate technology transfer, management skills, and international trade integration, which can lead to higher productivity, employment, and economic stability in the host country.
Despite the increase in Kenya’s FDI to USD 0.8 bn in 2022, from USD 0.5 bn in 2021, the country has been experiencing dwindling FDIs amongst her peers, hence our interest into delving in this topical. We shall do an in-depth analysis of the historical trend of FDIs in the country, compare it to other developed and peer economies, as well as give actionable initiatives to improve FDIs into the country. We shall cover the following:
- Overview of Foreign Direct Investments in Kenya,
- Economic Benefits of FDIs and Challenges to FDI Growth in Kenya,
- Recommendations, and,
- Conclusion and our Outlook.

Disclaimer: The views expressed in this publication are those of the writers where particulars are not warranted. This publication, which is in compliance with Section 2 of the Capital Markets Authority Act Cap 485A, is meant for general information only and is not a warranty, representation, advice or solicitation of any nature. Readers are advised in all circumstances to seek the advice of a registered investment advisor.

- Talk to us
- Kenya
- P.O Box 20695 - 00200, Nairobi, Kenya
- Cell +254709101200
- Tel +254709101200
- WhatsApp +254741676635
- United States
- +254709101200
- DOWNLOAD OUR APP
-


- Kenya
- 8th Floor, Pinetree Plaza, Kaburu Drive, Ngong Road, Nairobi, Kenya
- USA
- Suite 1150, 1775 Eye Street NW, USA, Washington DC 20006, USA
- Investments
- High Yield
- Private Equity
- Real Estate
- Real Estate
- RiverRun Estates
- Cytonn Towers
- The Ridge
- Taraji Heights
- The Alma