Investment Options in the Kenyan Market, & Cytonn Weekly #12/2021
By Cytonn Research, Mar 28, 2021
Executive Summary
Fixed Income
During the week, T-bills recorded an undersubscription, with the overall subscription rate coming in at 95.7%, a decline from the oversubscription of 115.0% recorded last week, partly attributable to the tightening liquidity in the money markets as evidenced by the interbank rate increasing during the week to 5.6%, from 5.4% recorded last week. Investors’ continued interest in the 364-day paper saw it record the highest subscription rate of 166.0%, an increase from 150.8% recorded the previous week, due to the paper’s attractive rate of 9.3%, which is higher than the rate for most bank placements. The yields on the 182-day and the 91-day bills closed the week at 7.9% and 7.1%, respectively. The Monetary Policy Committee (MPC) is set to meet on Monday, 29th March 2021 to review the outcome of its previous policy decisions and recent economic developments, and to decide on the direction of the Central Bank Rate (CBR), in our view, they shall hold the rate stable since the economy is still very fragile from the continued effects being brought about by the pandemic. We are projecting the inflation rate for March 2021 to range between 5.9% - 6.1%, from 5.8% in February, as a result of the rising fuel prices;
Equities
During the week, the equities market was on a downward trajectory, with NASI, NSE 20 and NSE 25 declining by 0.3%, 1.6% and 1.2%, respectively, taking their YTD performance to gains of 9.5%, 1.6% and 7.5% for NASI, NSE 20 and NSE 25, respectively. The equities market performance was driven by losses recorded by banking stocks such as Diamond Trust Bank (DTB-K), NCBA Group and ABSA Bank, which declined by 9.8%, 7.4% and 6.1%, respectively, following the results releases which indicated declines in their profitability. The losses were however mitigated by gains recorded by large-cap stocks such as Standard Chartered Bank which gained by 9.0%. The Central Bank of Kenya (CBK) announced the expiry of emergency measures on restructuring of loans for bank borrowers, effective 2nd March 2021. During the week, ABSA Bank, Standard Chartered Bank, and Diamond Trust Bank (DTB-K) released their FY’2020 financial results, which indicated profit declines of 44.2%, 33.9% and 51.5%, respectively;
Real Estate
During the week, Knight Frank, a real estate developer and property management company, released the Africa Residential Dashboard H2’2020 highlighting that prime residential sale prices in Nairobi decreased by 3.9% in H2’2020, compared to a 4.0% decline in H2’2019. Knight Frank, also released the Africa Offices Dashboard H2’2020 highlighting that in Kenya, the prime office rents in Nairobi declined by 13.0% in H2’2020 compared to H1’2020;
Focus of the Week
The Coronavirus pandemic continues to adversely impact the economy and the financial markets in general. As a result, investors have acknowledged the need to diversify their funds in various asset classes in order to mitigate major risks. Traditional investment products such as equities and fixed income securities as well as alternative investment products such as structured products and real estate have provided investors with a variety of avenues to channel their investments in the market, which, when properly analysed, can help maximize returns while minimizing risks. In today’s focus we look at the various assets that investors can put their cash into;
- Weekly Rates:
- Cytonn Money Market Fund closed the week at a yield of 10.88%. To invest, just dial *809#;
- Cytonn High Yield Fund closed the week at a yield of 14.47% p.a. To invest, email us at sales@cytonn.com and to withdraw the interest you just dial *809#;
- Solomon Kariuki, Assistant Investments and Research Analyst, Cytonn Investments was interviewed by Metropol TV as they discussed current matters affecting the economy. Watch Solomon here;
- For an exclusive tour of Cytonn’s real estate developments, visit: Sharp Investor's Tourand for more information, email us at sales@cytonn.com;
- We continue to offer Wealth Management Training daily, from 9:00 am to 11:00 am, through our Cytonn Foundation. The training aims to grow financial literacy among the general public. To register for any of our Wealth Management Training, click here;
- If interested in our Private Wealth Management Training for your employees or investment group, please get in touch with us through wmt@cytonn.com;
- We have 10 investment-ready projects, offering attractive development and buyer targeted returns. See further details here: Summary of Investment-ready Projects;
For recent news about the company, see our news section here.
Money Markets, T-Bills & T-Bonds Primary Auction:
During the week, T-bills recorded an undersubscription, with the overall subscription rate coming in at 95.7%, a decline from the oversubscription of 115.0% recorded last week, partly attributable to the tightening liquidity in the money markets as evidenced by the interbank rate increasing during the week to 5.6%, from 5.4% recorded last week. Investors’ continued interest in the 364-day paper saw it record the highest subscription rate at 166.0%, an increase from 150.8% recorded the previous week, as the paper has an attractive rate of 9.3%, which is higher than the rate for most bank placements. However, the subscription rate for the 91-day and 182-day papers declined to 82.6% and 30.7%, from 135.6% and 71.8%, respectively. The yields on all three papers rose; with the 364-day, 182-day and 91-day papers increasing by 4.6 bps, 0.6 bps and 1.6 bps to 9.3%, 7.9% and 7.1%, respectively. The government continued to reject expensive bids by accepting only Kshs 19.0 bn of the Kshs 23.0 bn bids received, translating to an acceptance rate of 82.9%.
In the Primary Bond market, the Central Bank of Kenya opened bidding for an infrastructure bond IFB1/2021/18, with a tenor of 18 years and the coupon is market determined. The government is seeking to raise Kshs 60.0 bn to fund Infrastructure projects in the FY’2020/21 budget estimates. The bond will be on offer from 26/03/2021 to 06/04/2021. Given the tax-free nature of the bond coupled with the government’s increased appetite for domestic borrowing to bridge the budget deficit, we anticipate an oversubscription and a high acceptance rate.
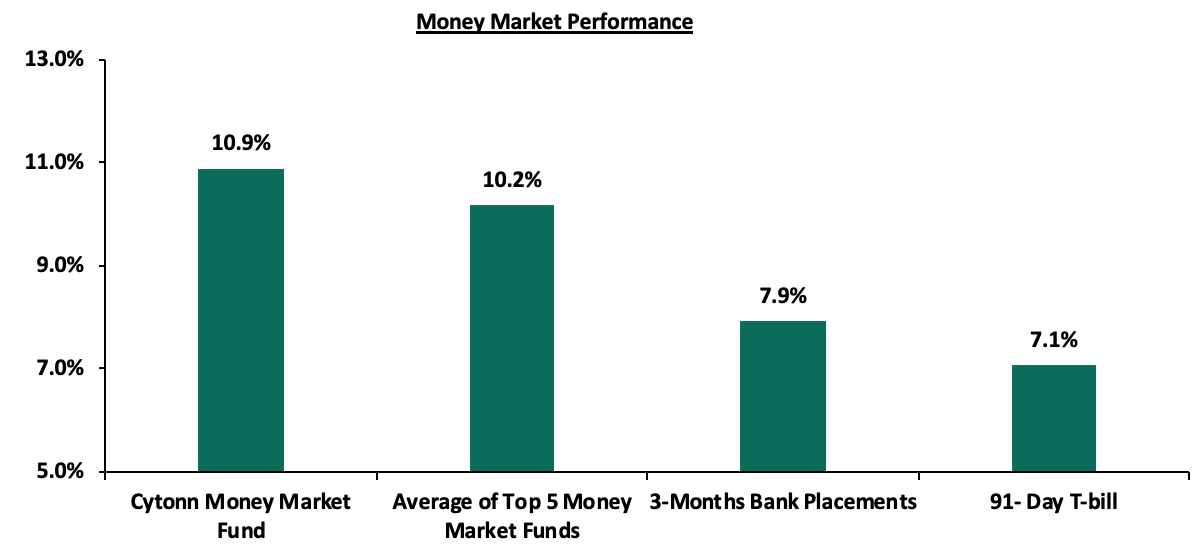
In the money markets, 3-month bank placements ended the week at 7.9% (based on what we have been offered by various banks), while the yield on the 91-day T-bill increased marginally by 1.6 bps to 7.1%. The average yield of the Top 5 Money Market Funds remained unchanged at 10.2% as was recorded last week. The yield on the Cytonn Money Market increased marginally during the week by 0.1% points to come in at 10.9%, from 10.8% recorded the previous week.
Liquidity:
During the week, liquidity in the money market declined as evidenced by the average interbank rate increasing to 5.6%, from 5.4% recorded the previous week, attributable to the preparation of the Quarter end tax remittances in the coming week. The average interbank volumes declined by 14.3% to Kshs 11.0 bn, from Kshs 12.9 bn recorded the previous week. According to the Central Bank of Kenya’s weekly bulletin released on 26th March 2021, commercial banks’ excess reserves came in at Kshs 15.3 bn in relation to the 4.25% Cash Reserve Ratio.
Eurobonds performance:
During the week, the yields on Eurobonds were on an upward trajectory, pointing to increased risk levels following a spike in the number of COVID-19 infections in Kenya coupled with the recent sovereign rating downgrade by Standard & Poor’s.
Below is the summary changes as per the Central Bank bulletin:
|
Kenya Eurobond Performance |
|||||||
|
|
2014 |
2018 |
2019 |
||||
|
Date |
10-year issue |
10-year issue |
30-year issue |
7-year issue |
12-year issue |
||
|
31-Dec-2020 |
3.9% |
5.2% |
7.0% |
4.9% |
5.9% |
||
|
26-Feb-2021 |
3.3% |
5.4% |
7.4% |
4.7% |
6.4% |
||
|
18-Mar-21 |
3.1% |
5.7% |
7.6% |
4.9% |
6.5% |
||
|
19-Mar-21 |
3.3% |
5.8% |
7.5% |
5.0% |
6.5% |
||
|
22-Mar-21 |
3.4% |
5.9% |
7.7% |
5.1% |
6.7% |
||
|
23-Mar-21 |
3.3% |
5.8% |
7.7% |
5.1% |
6.7% |
||
|
24-Mar-21 |
3.3% |
5.8% |
7.7% |
5.1% |
6.7% |
||
|
25-Mar-21 |
3.4% |
5.9% |
7.7% |
5.2% |
6.8% |
||
|
Weekly Change |
0.3% |
0.2% |
0.1% |
0.3% |
0.3% |
||
|
YTD Change |
(0.5%) |
0.7% |
0.7% |
0.3% |
0.9% |
||
Source: CBK Bulletin
Kenya Shilling:
During the week, the Kenyan shilling appreciated marginally by 0.1% against the US dollar to close at Kshs 109.8, from Kshs 109.9 recorded the previous week. This was mainly attributable to inflows from agricultural products and remittances which outweighed the slowing importer dollar demand. On a YTD basis, the shilling has depreciated by 0.6% against the dollar, in comparison to the 7.7% depreciation recorded in 2020. We expect continued pressure on the Kenyan shilling due to:
- A slowdown in foreign dollar currency inflows due to reduced dollar inflows from sectors such as tourism and horticulture,
- Continued uncertainty globally making people prefer holding dollars and other hard currencies, and,
- Expected dividends pay outs to foreign investors by corporates in the coming months.
However, in the short term, the shilling is expected to be supported by:
- The Forex reserves, currently at USD 7.3 bn (equivalent to 4.5-months of import cover), which is above the statutory requirement of maintaining at least 4.0-months of import cover, and the EAC region’s convergence criteria of 4.5-months of import cover. The Forex reserves have been declining and this may mean that the government of Kenya will struggle to support the local currency when it depreciates if the trend continues,
- The improving current account position which narrowed to 4.6% of GDP in the 12 months to February 2021 compared to 5.8% of GDP during a similar period in 2020, and,
- Improving diaspora remittances evidenced by an 18.9% y/y increase to USD 260.3 mn in February 2021, from USD 219.0 mn recorded over the same period in 2020.
Weekly Highlights
- March 2021 Inflation Projections
We are projecting the inflation rate for March 2021 to range between 5.9% - 6.1%, from 5.8% in February. We expect the y/y inflation rate to increase as a result of rising fuel prices. The m/m inflation is also expected to rise mainly due to:
- An increase in prices of kerosene and diesel by 5.9% and 5.6% to Kshs 97.9 and, Kshs 107.7 per litre, respectively effective until 14th April,
- An increase in electricity prices driven by a 35.6% rise in the fuel levy to Kshs 3.5 per kilowatt-hour (kWh) of electricity consumed in March from Kshs 2.6 per kWh in February. The increase in the fuel levy is linked to the increase in fuel prices as well as the usage of thermal power generation, and,
- The continued expectation of an increase in the global oil prices which is attributable to the expected rebound in economic growth and the continued reduction of supply by the Organization of the Petroleum Exporting Countries (OPEC), the oil prices have increased by 20.0% to USD 61.6 per barrel on a YTD basis.
Going forward, we expect inflation to be higher than 5.2% which was the average in 2020 but remain within the government target range of 2.5% - 7.5%.
- March MPC Meeting
The Monetary Policy Committee (MPC) is set to meet on Monday, 29th March 2021 to review the outcome of its previous policy decisions and recent economic developments, and to decide on the direction of the Central Bank Rate (CBR). In their previous meeting held on 27th January 2021, the MPC maintained the CBR at 7.0%, citing that the accommodative policy stance adopted in 2020, which saw a cumulative 125 bps cut, was having the intended effects on the economy.
We expect the MPC to maintain the Central Bank Rate (CBR) at 7.0%, with their decision mainly being supported by:
- Stable Inflation which is projected to remain within the 2.5%-7.5% target range despite the recent increases in fuel prices. Key to note, February’s inflation of 5.8% was an 11 month high, and,
- The need to support the economy by adopting an accommodative stance and pumping money into the economy. The current macro and business environment fundamentals might constrain the transmission of further accommodative cuts, despite the need to stimulate economic growth.
We believe that any additional rate cuts will not lead to a rise in Private sector credit growth as elevated credit risks persist in the current environment. The lowering of the government’s credit rating by Standard and Poor’s however poses the risk of upward pressure on Eurobond rates and the high demand for domestic debt could lead to high domestic rates.
For further analysis on the factors to be considered by the Monetary Policy Committee please see, March 2021 MPC Note.
Rates in the fixed income market have remained relatively stable but we have seen an upward trend in the short-term yields. The government is 6.2% behind its prorated borrowing target of Kshs 407.5 bn having borrowed Kshs 382.2 bn for the financial year 2021/2021. In our view, due to the current subdued economic performance brought about by the effects of the COVID-19 pandemic, the government will record a shortfall in revenue collection with the target having been set at Kshs 1.9 tn for FY’2020/2021, thus leading to a larger budget deficit than the projected 7.5% of GDP. The high deficit and the lower credit rating will mean that the government might be forced to borrow more from the domestic market which will ultimately create uncertainty in the interest rate environment. In our view, investors should be biased towards short-term to medium-term fixed income securities to reduce duration risk.
Market Performance:
During the week, the equities market was on a downward trajectory, with NASI, NSE 20 and NSE 25 declining by 0.3%, 1.6% and 1.2%, respectively, taking their YTD performance to gains of 9.5%, 1.6% and 7.5% for NASI, NSE 20 and NSE 25, respectively. The equities market performance was driven by losses recorded by banking stocks such as Diamond Trust Bank (DTB-K), NCBA Group and ABSA Bank, which declined by 9.8%, 7.4% and 6.1%, respectively, following the results releases which indicated declines in their profitability. The losses were however mitigated by gains recorded by large-cap stocks such as Standard Chartered Bank, which gained by 9.0%.
Equities turnover increased by 41.9% during the week to USD 21.9 mn, from USD 15.5 mn recorded the previous week, taking the YTD turnover to USD 265.2 mn. Foreign investors remained net buyers, with a net buying position of USD 4.4 mn, from a net buying position of USD 0.4 mn recorded the previous week, taking the YTD net selling position to USD 0.6 mn.
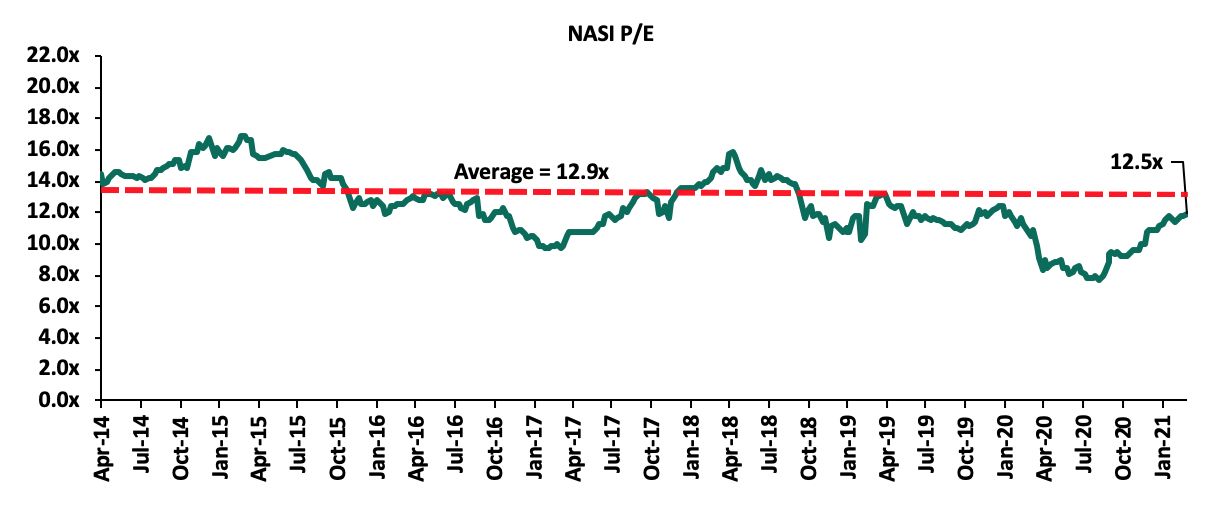
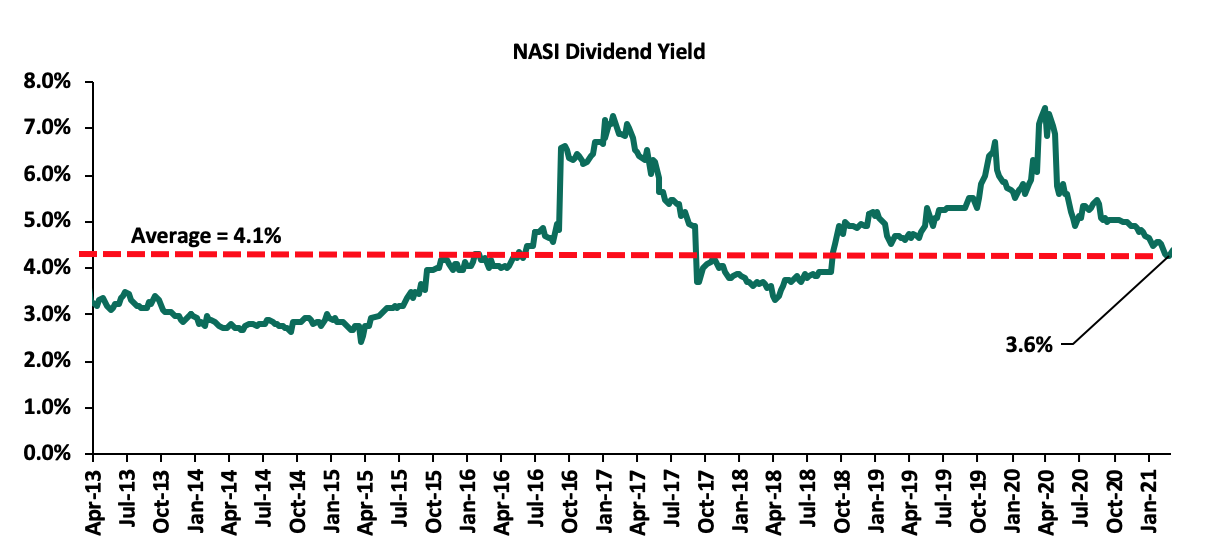
The market is currently trading at a price to earnings ratio (P/E) of 12.5x, 3.0% below the 11-year historical average of 12.9x. Key to note, the current P/E is at the highest it has been since 20th December 2019. The increase in the P/E ratio is attributable to the price rally witnessed this month in comparison to a general decline in Earnings Per Share (EPS). The average dividend yield is currently at 3.6%, 0.6% points below last week’s dividend yield which came in at 4.2%, and 0.5% points above the historical average of 4.1%.
With the market trading at valuations below the historical average, we believe that there are pockets of value in the market for investors with a higher risk tolerance. The current P/E valuation of 12.5x, is 62.7% above the most recent valuation trough of 7.7x experienced in the first week of August 2020. The charts below indicate the market’s historical P/E and dividend yield.
Weekly Highlight:
During the week, the Central Bank of Kenya (CBK) announced that the emergency measures on restructuring of loans for bank borrowers put in place in March 2020, expired on 2nd March 2021. The emergency measures were meant to cushion the borrowers from the adverse effects of the pandemic which would affect their ability to service loans such as the reduction in disposable income.
According to the Central Bank, the measures were highly effective, giving borrowers restructuring options which included moratorium on principle or interest and waivers on interest fees. The measures gave borrowers room to readjust their businesses and operations to the ‘new normal’ in addition to helping mitigate job losses. The banking sector also benefitted from the measures, presenting banks with the opportunity to re-evaluate their loan books, build additional capital and liquidity buffers and minimizing the effect of the pandemic on their Non-Performing Loan book. Cumulatively, as at the end of February 2021, loans amounting to Kshs 1.7 tn were restructured, accounting for 57.0% of the banking sector’s gross loans as at February 2021. Following the resumption of payments by most borrowers, outstanding restructured loans as at end of February stood at Kshs 569.3 bn, which was 19.0% of the sector’s total gross loans, a sign that the economy is on a recovery path.
Going forward, banks should continue engaging borrowers and accounts which are yet to resume servicing their loans by identifying the root causes of the issues leading to their non-payment and monitor the outcomes of measures employed by the borrowers in order to track their effectiveness and progress and step in when required. However, with stringent measures announced on the 26th March 2021 due to the third wave of infections, businesses and households might once again struggle to service their loans and as such, most loans might be categorized in stage 3. Stage 3 loan classification means that the loan’s credit risk has increased to the point where the loan is considered credit impaired or in default. The business disruptions that could result from the lockdown measures announced coupled with resultant supply chain disruptions will also lead to increased cost of risk for the banking sector.
Earnings Release:
During the week, ABSA Bank Kenya, Standard Chartered Bank Kenya, and Diamond Trust Bank (DTB-K) released their FY’2020 financial results. Below is a summary of their performance;
- ABSA Bank Kenya
|
ABSA FY’2020 Key Highlights |
|||
|
Balance Sheet |
|||
|
Balance Sheet Items |
FY’2019 (Kshs bn) |
FY’2020 (Kshs bn) |
y/y change |
|
Government Securities |
123.0 |
126.1 |
2.5% |
|
Net Loans and Advances |
194.9 |
208.9 |
7.2% |
|
Total Assets |
374.0 |
379.4 |
1.5% |
|
Customer Deposits |
237.7 |
253.6 |
6.7% |
|
Deposits per Branch |
2.7 |
3.0 |
11.8% |
|
Total Liabilities |
328.8 |
332.9 |
1.3% |
|
Shareholders’ Funds |
45.2 |
46.5 |
2.9% |
|
Income Statement |
|||
|
Income Statement Items |
FY’2019 (Kshs bn) |
FY’2020 (Kshs bn) |
y/y change |
|
Net Interest Income |
23.2 |
23.4 |
0.9% |
|
Net non-Interest Income |
10.6 |
11.1 |
5.2% |
|
Total Operating income |
33.8 |
34.5 |
2.2% |
|
Loan Loss provision |
(4.2) |
(9.0) |
114.9% |
|
Total Operating expenses |
(21.5) |
(25.7) |
19.5% |
|
Profit before tax |
12.3 |
8.8 |
(28.0%) |
|
Profit after tax |
7.5 |
4.2 |
(44.2%) |
|
Core EPS |
1.4 |
0.8 |
(44.2%) |
|
Key Ratios |
|||
|
Ratios |
FY’2019 |
FY’2020 |
% point change |
|
Yield on Interest Earning Assets |
10.4% |
9.5% |
(0.9%) |
|
Cost of Funding |
3.5% |
3.2% |
(0.3%) |
|
Net Interest Margin |
7.7% |
7.1% |
(0.6%) |
|
Non-Performing Loans (NPL) Ratio |
6.6% |
7.7% |
1.1% |
|
NPL Coverage |
77.0% |
71.1% |
(5.9%) |
|
Cost to Income with LLP |
63.6% |
74.4% |
10.8% |
|
Loan to Deposit Ratio |
82.0% |
82.3% |
0.3% |
|
Cost to Income Without LLP |
51.2% |
48.2% |
(3.0%) |
|
Return on Average Assets |
2.1% |
1.1% |
(1.0%) |
|
Return on Average Equity |
18.5% |
15.1% |
(3.4%) |
|
Equity to Assets Ratio |
12.8% |
12.2% |
(0.6%) |
|
Capital Adequacy Ratios |
|||
|
Ratios |
FY’2019 |
FY’2020 |
% point change |
|
Core Capital/Total Liabilities |
16.3% |
17.3% |
1.0% |
|
Minimum Statutory ratio |
8.0% |
8.0% |
0.0% |
|
Excess/Deficit |
8.3% |
9.3% |
1.0% |
|
Core Capital/Total Risk Weighted Assets |
13.9% |
14.7% |
0.8% |
|
Minimum Statutory ratio |
10.5% |
10.5% |
0.0% |
|
Excess/Deficit |
3.4% |
4.2% |
0.8% |
|
Total Capital/Total Risk Weighted Assets |
16.6% |
17.5% |
0.9% |
|
Minimum Statutory ratio |
14.5% |
14.5% |
0.0% |
|
Excess/Deficit |
2.1% |
3.0% |
0.9% |
Key take-outs from the earnings release include;
- Core earnings per share declined by 44.2% to Kshs 0.8, from Kshs 1.4 in FY’2019, more than our expectation of a 22.6% decline to Kshs 1.1. The decline in the core earnings per share was mainly driven by the 19.5% growth in total operating expenses to Kshs 25.7 bn, from Kshs 21.5 bn recorded in FY’2019, which grew faster than the 2.2% growth in total operating income to Kshs 34.5 bn, from Kshs 33.8 bn in FY’2019. The variance in core earnings per share growth against our expectations was mainly due to the slower 2.2% growth in Total operating Income against our expectations of a 5.3% growth,
- Net Interest income rose by 0.9% to Kshs 23.4 bn, from Kshs 23.2 bn in FY’2019. This was driven by a 10.7% growth in interest income from government securities to Kshs 9.0 bn, from Kshs 8.1 bn in FY’2019. The growth in interest income was however weighed down by a 1.1% decline in interest income from Loans and Advances to Kshs 22.3 bn, from Kshs 22.5 bn in FY’2019, as well as a 55.9% decline in interest income from placements to Kshs 0.2 bn, from Kshs 0.4 bn in FY’2019,
- The Yield on Interest-Earning Assets declined to 9.5%, from 10.4% in FY’2019, attributable to the faster 10.6% y/y increase in average interest earning assets to Kshs 331.1 bn, from Kshs 299.3 bn in FY’2019 which outpaced the 1.3% growth in trailing interest income. Trailing Interest Income refers to the performance of the interest income for the past 12 consecutive months,
- Interest expenses grew by 2.7% to Kshs 8.1 bn, from Kshs 7.9 bn in FY’2019, following a 51.2% rise in placement liabilities to Kshs 1.9 bn, from Kshs 1.3 bn in FY’2019. The increase in interest expenses was however mitigated by a 7.3% decline in interest expense on customer deposits to Kshs 6.0 bn, from Kshs 6.5 bn in FY’2019. Cost of funds, on the other hand, declined by 0.3% points to 3.2%, from 3.5% in FY’2019, owing to the faster 9.9% growth in average interest bearing liabilities, against a 2.7% increase in trailing interest expense. Trailing interest expense refers to the performance of the interest expense for the past 12 consecutive months,
- Total operating expenses rose by 19.5% to Kshs 25.7 bn, from Kshs 21.5 bn in FY’2019, largely driven by a 114.9% increase in Loan Loss Provisions (LLP) to Kshs 9.0 bn in FY’2020, from Kshs 4.2 bn in FY’2019. The increased provisioning levels is attributable to the bank adopting a cautious stance on the back of the expectations of increase in defaults due to the subdued operating environment. The rise in operating expenses was however mitigated by a 3.9% decline in staff costs to Kshs 9.8 bn in FY’2020, from Kshs 10.2 bn in FY’2019, coupled with a 3.4% decline in other operating expense to Kshs 6.9 bn, from Kshs 7.1 bn in FY’2019,
- The balance sheet recorded an expansion as total assets rose by 1.5% to Kshs 379.4 bn, from Kshs 374.0 bn in FY’2019. This growth was largely driven by a 7.2% growth in the loan book to Kshs 208.9 bn, from Kshs 194.9 bn in FY’2019, coupled with a 2.5% increase in government securities to Kshs 126.1 bn, from Kshs 123.0 bn in FY’2019,
- Total liabilities grew by 1.3% to Kshs 332.9 bn, from Kshs 328.8 bn in FY’2019, driven by a 6.7% increase in customer deposits to Kshs 253.6 bn, from Kshs 237.7 bn in FY’2019, coupled with a 13.5% increase in other liabilities to Kshs 75.2 bn, from Kshs 87.0 bn in FY’2019,
- Deposits per branch increased by 11.8% to Kshs 3.0 bn, from Kshs 2.7 bn in FY’2019, with the number of branches having reduced to 84 in FY’2020, from 88 in FY’2019,
- Gross Non-Performing Loans (NPLs) increased by 26.5% to Kshs 17.1 bn in FY’2020, from Kshs 13.5 bn in FY’2019. The NPL ratio thus deteriorated to 7.7% in FY’2020, from 6.6% in FY’2019, owing to the faster 26.5% growth in gross NPLs, which outpaced the 7.7% growth in gross loans (after adding back interest suspense). General Loan Loss Provisions rose by 24.5% to Kshs 9.7 bn, from Kshs 7.8 bn in FY’2019,
- The NPL coverage however declined to 71.1% in FY’2020, from 77.0% in FY’2019, owing to the slower 24.5% increase in General Loan Loss Provisions, which was outpaced by the 26.5% growth in gross non-performing loans. If the NPL Coverage remained at the 77.0% level recorded in FY’2019, we would have had an additional provisioning of Kshs 1.5 bn, which would have reduced the earnings per share to Kshs 0.5 from the Kshs 0.7 reported, and,
- ABSA Bank Kenya is currently sufficiently capitalized with a core capital to risk-weighted assets ratio of 14.7%, 4.2% points above the 10.5% statutory requirement. In addition, the total capital to risk-weighted assets ratio was 17.5%, exceeding the 14.5% statutory requirement by 3.0% points. Adjusting for IFRS 9, the core capital to risk weighted assets stood at 14.8%, while total capital to risk-weighted assets came in at 17.6%.
For a comprehensive analysis, please see our ABSA Bank FY’2020 Earnings Note.
- Standard Chartered Bank Kenya
|
Standard Chartered Bank FY’2020 Key Highlights |
|||
|
Balance Sheet |
|||
|
Balance Sheet Items |
FY’2019 (Kshs bn) |
FY’2020 (Kshs bn) |
y/y change |
|
Government Securities |
99.6 |
99.8 |
0.2% |
|
Net Loans and Advances |
128.7 |
121.5 |
(5.6%) |
|
Total Assets |
302.1 |
325.6 |
7.8% |
|
Customer Deposits |
228.4 |
256.5 |
12.3% |
|
Deposits per Branch |
6.3 |
7.1 |
12.3% |
|
Total Liabilities |
254.4 |
274.7 |
8.0% |
|
Shareholders’ Funds |
47.8 |
50.9 |
6.6% |
|
Income Statement |
|||
|
Income Statement Items |
FY’2019 (Kshs bn) |
FY’2020 (Kshs bn) |
y/y change |
|
Net Interest Income |
19.5 |
19.1 |
(1.8%) |
|
Net non-Interest Income |
9.2 |
8.3 |
(10.2%) |
|
Total Operating income |
28.7 |
27.4 |
(4.5%) |
|
Loan Loss provision |
0.6 |
3.9 |
578.0% |
|
Total Operating expenses |
16.5 |
20.0 |
21.1% |
|
Profit before tax |
12.2 |
7.4 |
(39.2%) |
|
Profit after tax |
8.2 |
5.4 |
(33.9%) |
|
Core EPS |
21.9 |
14.4 |
(33.9%) |
|
Key Ratios |
|||
|
Ratios |
FY’2019 |
FY’2020 |
% point change |
|
Yield on Interest Earning Assets |
9.6% |
9.0% |
(0.4%) |
|
Cost of Funding |
2.5% |
2.6% |
0.1% |
|
Net Interest Margin |
7.4% |
6.8% |
(0.6%) |
|
Non-Performing Loans (NPL) Ratio |
13.9% |
16.0% |
2.1% |
|
NPL Coverage |
78.7% |
80.6% |
1.9% |
|
Cost to Income with LLP |
57.6% |
73.0% |
15.4% |
|
Loan to Deposit Ratio |
56.3% |
47.4% |
(8.9%) |
|
Cost to Income Without LLP |
55.6% |
58.8% |
3.2% |
|
Return on Average Assets |
2.8% |
1.7% |
(1.1%) |
|
Return on Average Equity |
17.5% |
11.0% |
(6.5%) |
|
Equity to Assets Ratio |
16.1% |
15.7% |
(0.4%) |
|
Capital Adequacy Ratios |
|||
|
Ratios |
FY’2019 |
FY’2020 |
%point change |
|
Core Capital/Total Liabilities |
15.6% |
15.3% |
(0.3%) |
|
Minimum Statutory ratio |
8.0% |
8.0% |
0.0% |
|
Excess/Deficit |
7.6% |
7.3% |
(0.3%) |
|
Core Capital/Total Risk Weighted Assets |
14.7% |
15.9% |
1.2% |
|
Minimum Statutory ratio |
10.5% |
10.5% |
0.0% |
|
Excess/Deficit |
4.2% |
5.4% |
1.2% |
|
Total Capital/Total Risk Weighted Assets |
17.7% |
18.5% |
0.8% |
|
Minimum Statutory ratio |
14.5% |
14.5% |
0.0% |
|
Excess/Deficit |
3.2% |
4.0% |
0.8% |
Key take-outs from the earnings release include;
- The bank’s core earnings per share declined by 33.9% to Kshs 14.4, from Kshs 21.9 recorded in FY’2019, not in line with our projections of a 26.8% decline to Kshs 16.0. The variance was mainly attributable to the total operating income declining by 4.5% against our expectation of a 0.4% growth in FY’2020, coupled with the total operating expenses growing faster by 21.1% against our expectations of a 19.1% increase in FY’2020,
- Net Interest income declined by 1.8% to Kshs 19.1 bn, from Kshs 19.5 bn recorded in FY’2019, driven by an 8.2% decline in interest income on loans and advances to Kshs 12.3 bn, from Kshs 13.4 bn in FY’2019, coupled with a 9.7% decline in interest income from government securities to Kshs 9.6 bn, from Kshs 10.6 bn in FY’2019. The decline in interest income was however mitigated by a 33.4% growth in interest income from deposits and placements with banking institutions to Kshs 1.4 bn, from Kshs 1.1 bn in FY’2019
- The Yield on Interest-Earning Assets declined to 9.0%, from 9.6% in FY’2019, as the average interest-earning assets grew by 7.1% to Kshs 280.5 bn, from Kshs 261.9 bn in FY’2019, with the trailing interest income increasing marginally, by 0.2% to Kshs 25.3 from Kshs 25.3 in FY’2019. Trailing Interest Income refers to the performance of the interest income for the past 12 consecutive months,
- Interest expense declined by 20.4% to Kshs 4.6 bn, from Kshs 5.8 bn in FY’2019, following an 18.2% decline in interest expense on customer deposits to Kshs 4.2 bn, from Kshs 5.2 bn in FY’2019, coupled with a 45.8% decline in other interest expenses to Kshs 0.3 bn, from Kshs 0.6 bn in FY’2019. The decline in interest expense was, however, mitigated by a gain of 35.3% in interest expense on deposits and placements from banking institutions to Kshs 0.08 bn, from Kshs 0.06 bn recorded in FY’2019. Cost of funds, on the other hand, increased marginally by 0.1% points to 2.6%, from 2.5% in FY’2019, owing to the faster 8.5% growth in the trailing interest expense, which outpaced the 7.1% growth in average interest-bearing liabilities,
- Total operating expenses grew by 21.1% to Kshs 20.0 bn in FY’2020, from Kshs 16.5 bn in FY’2019, mainly attributable to a 578.0% increase in Loans Loss Provision (LLP) to Kshs 3.9 bn, from Kshs 0.6 bn recorded in FY’2019. The increased provision levels was on account of the poor operating environment brought about by COVID-19 which has adversely affected individuals and businesses’ ability to repay loans. Additionally, Staff Costs increased by 7.6% to Kshs 7.7 bn in FY’2020, from Kshs 7.1 bn recorded in FY’2019,
- The balance sheet recorded an expansion as total assets grew by 7.8% to Kshs 325.6 bn, from Kshs 302.1 bn in FY’2019. This growth was largely driven by a 77.8% increase in placements from banking institutions to Kshs 70.3 bn, from Kshs 39.5 bn in FY’2019, coupled with a marginal increase of 0.2% in investment in government and other securities to Kshs 99.8, from Kshs 99.6 bn recorded in FY’2019. The loan book however decreased by 5.6% to Kshs 121.5 bn, from Kshs 128.7 bn recorded in FY’2019, partly attributable to the elevated credit risk,
- Total liabilities rose by 8.0% to Kshs 274.7 bn, from Kshs 254.4 bn in FY’2019, driven by a 12.3% increase in customer deposits to Kshs 256.5 bn, from Kshs 228.4 bn in FY’2019. On the other hand, there was a decrease of 94.3% in placements held to Kshs 0.5 bn, from Kshs 8.0 bn in FY’2019,
- Deposits per branch rose by 12.3% to Kshs 7.1 bn, from Kshs 6.3 bn in FY’2019 with the number of branches remaining unchanged at 36,
- Gross Non-Performing Loans (NPLs) increased by 11.4% to Kshs 22.3 bn in FY’2020, from Kshs 20.1 bn recorded in FY’2019, taking the NPL ratio to 16.0% from 13.9% recorded in FY’2019. The asset quality deterioration is attributable to the 11.4% growth in Gross Non-Performing Loans (NPLs), coupled with a 3.4% decline in gross loans,
- General Loan Loss Provisions increased by 10.9% to Kshs 8.9 bn, from Kshs 8.0 bn in FY’2019. The NPL coverage thus increased to 80.6%, from 78.7% in FY’2019, as the provisions (after adding back interest suspense) increased by 14.0% in FY’2020 outpacing the 11.4% rise in the Gross Non-Performing Loans during the same period. The increase in the NPL Coverage to 80.6% in FY’2020, from 78.7% in FY’2019 suggests sufficient provisioning, and,
- Standard Chartered is currently sufficiently capitalized with a core capital to risk-weighted assets ratio of 15.9%, 5.4% points above the statutory requirement. In addition, the total capital to risk-weighted assets ratio was 18.5%, exceeding the statutory requirement by 4.0% points. Adjusting for IFRS 9, the core capital to risk-weighted assets stood at 15.9% while total capital to risk-weighted assets came in at 18.5%.
For a comprehensive analysis, please see our Standard Chartered Bank FY’2020 Earnings Note.
- Diamond Trust Bank (DTB-K)
|
Diamond Trust Bank (DTB-K) FY’2020 Key Highlights |
|||
|
Balance Sheet |
|||
|
Balance Sheet Items |
FY’2019 (Kshs bn) |
FY’2020 (Kshs bn) |
y/y change |
|
Government Securities |
132.5 |
148.4 |
12.0% |
|
Net Loans and Advances |
199.1 |
208.6 |
4.8% |
|
Total Assets |
386.2 |
425.1 |
10.5% |
|
Customer Deposits |
280.2 |
298.2 |
6.4% |
|
Deposits per Branch |
2.0 |
2.2 |
6.4% |
|
Total Liabilities |
321.7 |
356.7 |
10.9% |
|
Shareholders’ Funds |
58.9 |
62.0 |
5.3% |
|
Income Statement |
|||
|
Income Statement Items |
FY’2019 (Kshs bn) |
FY’2020 (Kshs bn) |
y/y change |
|
Net Interest Income |
18.7 |
18.1 |
(3.4%) |
|
Net non-Interest Income |
5.8 |
6.1 |
6.1% |
|
Total Operating income |
24.5 |
24.2 |
(1.1%) |
|
Loan Loss provision |
1.3 |
7.3 |
453.6% |
|
Total Operating expenses |
13.2 |
19.7 |
48.7% |
|
Profit before tax |
11.3 |
4.7 |
(58.6%) |
|
Profit after tax |
7.3 |
3.5 |
(51.5%) |
|
Core EPS |
26.0 |
12.6 |
(51.5%) |
|
Key Ratios |
|||
|
Ratios |
FY’2019 |
FY’2020 |
% point change |
|
Yield on Interest Earning Assets |
9.9% |
8.7% |
(1.2%) |
|
Cost of Funding |
4.5% |
3.9% |
(0.6%) |
|
Net Interest Margin |
5.6% |
5.0% |
(0.6%) |
|
Non-Performing Loans (NPL) Ratio |
7.7% |
10.4% |
2.7% |
|
NPL Coverage |
42.9% |
44.6% |
1.7% |
|
Cost to Income with LLP |
54.0% |
81.3% |
27.3% |
|
Loan to Deposit Ratio |
71.1% |
70.0% |
(1.1%) |
|
Cost to Income Without LLP |
48.6% |
51.0% |
2.4% |
|
Return on Average Assets |
1.3% |
0.6% |
(0.7%) |
|
Return on Average Equity |
12.9% |
5.8% |
(7.1%) |
|
Equity to Assets Ratio |
10.2% |
10.5% |
0.3% |
|
Capital Adequacy Ratios |
|||
|
Ratios |
FY’2019 |
FY’2020 |
%point change |
|
Core Capital/Total Liabilities |
22.3% |
22.8% |
0.5% |
|
Minimum Statutory ratio |
8.0% |
8.0% |
0.0% |
|
Excess/Deficit |
14.3% |
14.8% |
0.5% |
|
Core Capital/Total Risk Weighted Assets |
19.1% |
20.7% |
1.6% |
|
Minimum Statutory ratio |
10.5% |
10.5% |
0.0% |
|
Excess/Deficit |
8.6% |
10.2% |
1.6% |
|
Total Capital/Total Risk Weighted Assets |
20.9% |
22.5% |
1.6% |
|
Minimum Statutory ratio |
14.5% |
14.5% |
0.0% |
|
Excess/Deficit |
6.4% |
8.0% |
1.6% |
Key take-outs from the earnings release include;
- The bank’s core earnings per share declined by 51.5% to Kshs 12.6, from Kshs 26.0 in FY’2019, a faster decline than our expectation of a 36.6% decline to Kshs 16.5 per share. The variance was mainly attributable to the 453.6% increase in Loans Loss Provision ( LLP) to Kshs 7.3 bn, from Kshs 1.3 bn recorded in FY’2019, against our expectations of a 24.7% decline to Kshs 4.5 bn in FY’2019,
- Net Interest income declined by 3.4% to Kshs 18.1 bn, from Kshs 18.7 bn in FY’2019. This was driven by a 7.0% decline in interest income from loans and advances to Kshs 18.5 bn, from Kshs 20.0 bn in FY’2019, coupled with the 1.0% decline in Interest income from government securities to Kshs 12.4 bn from Kshs 12.5 bn in FY’2019. Interest income from deposit placements also declined by 57.5% to Kshs 169.2 mn, from Kshs 398.4 mn in FY’2019,
- The Yield on Interest-Earning Assets declined to 8.7% from 9.9% in FY’2019, attributable to the 10.9% increase in average interest-earning assets to Kshs 376.9 bn, from Kshs 339.9 bn in FY’2019, coupled with the 5.4% decline in trailing interest income,
- Interest expense declined by 8.0% to Kshs 13.0 bn, from Kshs 14.1 bn in FY’2019, following a 7.6% decline in interest expense on customer deposits to Kshs 11.2 bn, from Kshs 12.1 bn in FY’2019 coupled with an 11.4% decline in interest expense on placement liabilities to Kshs 563.4 mn, from Kshs 635.9 mn in FY’2019. Cost of funds declined to 3.9% from 4.5% in FY’2019, owing to the 8.0% decline in interest expenses coupled with 10.8% growth in interest-bearing liabilities, an indication that the bank managed to mobilize cheaper deposits,
- Total operating expenses rose by 48.7% to Kshs 19.7 bn, from Kshs 13.2 bn in FY’2019, largely driven by the 453.6% increase in Loan Loss Provisions (LLP) to Kshs 7.3 bn from Kshs 1.3 bn in FY’2019 on the back of the subdued operating environment seen during the year. Staff costs increased by 1.1% to Kshs 4.72 bn from Kshs 4.67 bn in FY’2019. Additionally, Other operating expenses increased by 5.4% to Kshs 7.6 bn from Kshs 7.2 bn recorded in FY’2019,
- The balance sheet recorded an expansion as Total Assets increased by 10.1% to Kshs 425.1 bn, from Kshs 386.2 bn recorded in FY’2019. This growth was largely driven by a 12.0% increase in government securities to Kshs 148.4 bn, from Kshs 132.5 bn in FY’2019, coupled with a 4.8% increase in net loans to Kshs 208.6 bn, from Kshs 199.1 bn in FY’2019. The increased allocation in government securities was mainly on the back of the lender’s cautious lending amid the elevated credit risk amid the pandemic,
- Total liabilities grew by 10.9% to Kshs 356.7 bn, from Kshs 321.7 bn in FY’2019, driven by a 74.3% increase in borrowings to Kshs 19.8 bn from Kshs 11.4 bn in FY’2019, attributable to the additional debts the bank acquired to finance its operations and boost liquidity, coupled with a 6.4% increase in customer deposits to Kshs 298.2 bn from Kshs 280.2 bn in FY’2019,
- Deposits per branch increased by 6.4% to Kshs 2.2 bn from Kshs 2.0 bn, as the number of branches remained unchanged at 137 in FY’2020. However, the number of branches is set to decline as the bank plans to shut down six branches by the end of October 2021 owing to its rising operational costs,
- Gross Non-Performing Loans (NPLs) rose by 43.1% to Kshs 22.8 bn in FY’2020, from Kshs 15.9 bn recorded in FY’2019. Consequently, the NPL ratio deteriorated to 10.4% from 7.7% recorded in FY’2019, due to the faster 43.1% growth in gross NPLs which outpaced the 6.4% growth in gross loans,
- General Loan Loss Provisions increased by 113.4% to Kshs 9.6 bn from Kshs 4.5 bn in FY’2019. Consequently, the NPL coverage (having added interest in suspense) increased to 44.6% in FY’2020, from 42.9% in FY’2019, owing to the faster 113.4% increase in general provisions, which outpaced the 43.1% growth in Gross NPLs, and,
- Diamond Trust Bank is currently sufficiently capitalized with a core capital to risk-weighted assets ratio of 20.7%, 10.2% points above the statutory requirement. In addition, the total capital to risk-weighted assets ratio was 22.5%, exceeding the 14.5% statutory requirement by 8.0% points. Adjusting for IFRS 9, the core capital to risk-weighted assets stood at 21.0%, while total capital to risk-weighted assets came in at 22.7%.
For a comprehensive analysis, please see our Diamond Trust Bank (DTB-K) FY’2020 Earnings Note.
Asset Quality
The table below is a summary of the asset quality for the companies that have released
|
|
FY'2019 NPL Ratio |
FY'2020 NPL Ratio |
FY'2019 NPL Coverage |
FY'2020 NPL Coverage |
% point change in NPL Ratio |
% point change in NPL Coverage |
|
Stanbic Bank |
9.6% |
11.8% |
57.1% |
60.6% |
2.2% |
3.5% |
|
KCB |
11.1% |
14.8% |
59.5% |
59.8% |
3.7% |
0.3% |
|
Standard Chartered Bank |
13.9% |
16.0% |
78.7% |
80.6% |
2.1% |
1.9% |
|
Co-operative Bank |
11.2% |
18.7% |
51.8% |
50.3% |
7.5% |
(1.5%) |
|
Diamond Trust Bank |
7.6% |
10.4% |
42.9% |
44.6% |
2.7% |
1.7% |
|
ABSA Bank Kenya |
6.6% |
7.7% |
77.0% |
71.1% |
1.1% |
(5.9%) |
|
Mkt Weighted Average |
10.5%** |
14.4%* |
57.6%** |
61.4%* |
3.9% |
3.8% |
|
*Market cap weighted as at 26/03/2021 |
||||||
|
**Market cap weighted as at 09/04/2020 |
||||||
Key take-outs from the table include;
- Asset quality for the 6 listed banks that have released their FY’2020 results deteriorated during the period of review, with the weighted average NPL ratio rising by 3.9% points to a market cap weighted average of 14.4%, from 10.5% in FY’2019. The deterioration in asset quality was as a result of the coronavirus-induced downturn in the economy which led to an uptick in the non-performing loans. Notably, for Diamond Trust Bank (DTB-K), The NPL ratio has been deteriorating q/q and this is the highest it has been for more than a decade,
- NPL Coverage for the 6 banks increased to a market cap weighted average of 61.4% in FY’2020, from 57.6% recorded in FY’2019, as the banks increased their provisioning levels to proactively manage risks given the tough economic conditions occasioned by the pandemic. We expect higher provisional requirements to subdue profitability in FY’2020 across the banking sector on account of the tough business environment, and,
- ABSA and Co-operative Bank recorded a decline in their NPL Coverage despite their NPL ratio rising, which could suggest modest provisioning. Given the current economic environment and elevated risk of loans defaults, we expected higher provisioning for the banks. Key to note, If Cooperative Bank’s NPL Coverage remained at the 51.8% level recorded in 2019, the bank would have had an additional provisioning of Kshs 0.9 bn, which would have reduced the earnings per share from the reported Kshs 2.1 to Kshs 1.8, while if ABSA’s NPL coverage remained at the 77.0%, level recorded in 2019, the bank would have had an additional provisioning of Kshs 1.5 bn, which would have reduced the earnings per share from the reported Kshs 0.8 to Kshs 0.5.
The table below highlights the performance of the banks that have released so far, showing the performance using several metrics, and the key take-outs of the performance;
|
Bank |
Core EPS Growth |
Interest Income Growth |
Interest Expense Growth |
Net Interest Income Growth |
Net Interest Margin |
Non-Funded Income Growth |
NFI to Total Operating Income |
Growth in Total Fees & Commissions |
Deposit Growth |
Growth in Government Securities |
Loan to Deposit Ratio |
Loan Growth |
Return on Average Equity |
|
Stanbic |
(18.6%) |
(3.4%) |
(1.6%) |
(4.1%) |
4.7% |
(8.7%) |
44.9% |
(18.7%) |
15.7% |
25.0% |
75.5% |
2.7% |
10.3% |
|
KCB |
(22.1%) |
19.4% |
14.2% |
21.0% |
8.5% |
1.0% |
29.5% |
(10.4%) |
11.7% |
26.6% |
77.6% |
10.3% |
14.4% |
|
SCBK |
(33.9%) |
(6.1%) |
(20.4%) |
(1.8%) |
6.8% |
(10.2%) |
30.0% |
(12.0%) |
12.3% |
0.2% |
47.4% |
(5.6%) |
11.0% |
|
Co-op |
(24.4%) |
11.9% |
1.3% |
16.1% |
8.5% |
1.9% |
32.5% |
0.7% |
13.8% |
37.4% |
75.7% |
7.5% |
12.5% |
|
DTB-K |
(51.5%) |
(5.4%) |
(8.0%) |
(3.4%) |
5.0% |
6.1% |
25.3% |
(7.8%) |
6.4% |
12.0% |
70.0% |
4.8% |
5.8% |
|
ABSA |
(44.2%) |
1.3% |
2.7% |
0.9% |
7.1% |
5.2% |
32.3% |
(9.9%) |
6.7% |
2.5% |
82.3% |
7.2% |
15.1% |
|
FY'20 Mkt Weighted Average* |
(28.4%) |
8.5% |
2.5% |
10.6% |
7.6% |
(0.4%) |
31.8% |
(8.7%) |
11.7% |
21.2% |
73.1% |
6.1% |
12.8% |
|
FY'19Mkt Weighted Average** |
8.9% |
3.2% |
3.4% |
3.4% |
7.3% |
17.4% |
37.4% |
18.4% |
12.7% |
19.4% |
75.0% |
12.8% |
18.4% |
|
*Market cap weighted as at 26/03/2021 |
|||||||||||||
|
**Market cap weighted as at 09/04/2020 |
|||||||||||||
Key takeaways from the table above include:
- For the six listed banks that have released, they have recorded a 28.4% weighted average decline in core Earnings Per Share (EPS), compared to a weighted average growth of 8.9% in FY’2019 for the entire listed banking sector,
- The Banks have recorded a weighted average deposit growth of 11.7%, slower than the 12.7% growth recorded in FY’2019,
- Interest expense grew at a slower pace, by 2.5%, compared to a 3.4% growth in FY’2019 while cost of funds declined, coming in at a weighted average of 2.9% in FY’2020, from 3.2% in FY’2019, owing to the faster growth in average interest-bearing liabilities, an indication that the listed banks were able to mobilize cheaper deposits,
- Average loan growth came in at 6.1%, lower than the 12.8% growth recorded in FY’2019. The loan growth was also slower than the 21.2% growth in government securities, an indication of the banks’ preference of investing in Government securities as opposed to lending due to the elevated credit risk occasioned by the pandemic. The faster growth in government securities could also be attributed to cautious lending by banks in a bid to reduce cost of risk as well as mitigate further deterioration of the asset quality,
- Interest income grew by 8.5%, compared to a growth of 3.2% recorded in FY’2019. Despite the growth in interest income, the Yield on Interest Earning Assets (YIEA) declined to 10.0%, from the 10.4% recorded in FY’2019, an indication of the increased allocation to lower-yielding government securities by the sector during the period. The decline in the YIEA can also be attributed to the reduced lending rates for customers by the sector, in line with the Central Bank Rate cuts. Consequently, the Net Interest Margin (NIM) now stands at 7.6%, 0.3% points higher than the 7.3% recorded in FY’2019 for the whole listed banking sector, and,
- Non-Funded Income growth declined by 0.4% compared to the 17.4% growth recorded in FY’2019. This can be attributable to i) a slower growth in the fees and commission which declined by 8.7% compared to a growth of 18.4% in FY’2019 and ii) the waiver on fees on mobile transactions below Kshs 1,000 coupled with the free bank-mobile money transfer. However, with the expiry of the waiver on bank charges on 2nd March 2021, we expect NFI growth to recover in the medium-long term due to the increased adoption of digital channels. According to Central Bank Annual Report 2019/2020, 67.0% of banking transactions were conducted on mobile phones after the onset of the pandemic, compared to 55.0% of transactions before the pandemic. Moreover, more than 1.6 mn additional customers are now using mobile-money channels compared to the period before the pandemic began.
Universe of Coverage:
|
Company |
Price at 19/3/2021 |
Price at 26/3/2021 |
w/w change |
YTD Change |
Year Open 2021 |
Target Price* |
Dividend Yield |
Upside/ Downside** |
Recommendation |
|
Diamond Trust Bank*** |
73.8 |
66.5 |
(9.8%) |
(13.4%) |
76.8 |
105.1 |
0.0% |
58.0% |
Buy |
|
I&M Holdings*** |
43.2 |
43.2 |
(0.1%) |
(3.8%) |
44.9 |
60.1 |
6.3% |
45.5% |
Buy |
|
Kenya Reinsurance |
2.7 |
2.6 |
(1.9%) |
12.6% |
2.3 |
3.3 |
4.2% |
31.2% |
Buy |
|
Equity Group*** |
41.7 |
41.0 |
(1.6%) |
13.1% |
36.3 |
43.0 |
22.0% |
26.8% |
Buy |
|
NCBA*** |
25.0 |
23.1 |
(7.4%) |
(13.2%) |
26.6 |
25.4 |
16.5% |
26.4% |
Buy |
|
Britam |
7.3 |
7.1 |
(3.0%) |
1.4% |
7.0 |
8.6 |
0.0% |
21.1% |
Buy |
|
Liberty Holdings |
8.8 |
8.2 |
(6.4%) |
6.5% |
7.7 |
9.8 |
0.0% |
19.5% |
Accumulate |
|
ABSA Bank*** |
9.4 |
8.9 |
(6.1%) |
(6.9%) |
9.5 |
10.5 |
0.0% |
18.5% |
Accumulate |
|
Jubilee Holdings |
285.0 |
267.8 |
(6.1%) |
(2.9%) |
275.8 |
313.8 |
0.0% |
17.2% |
Accumulate |
|
Sanlam |
11.7 |
12.0 |
3.0% |
(7.7%) |
13.0 |
14.0 |
0.0% |
16.7% |
Accumulate |
|
KCB Group*** |
41.4 |
41.1 |
(0.6%) |
7.0% |
38.4 |
46.0 |
2.4% |
14.4% |
Accumulate |
|
Co-op Bank*** |
13.9 |
13.6 |
(2.2%) |
8.4% |
12.6 |
14.5 |
7.4% |
14.0% |
Accumulate |
|
Standard Chartered*** |
133.0 |
145.0 |
9.0% |
0.3% |
144.5 |
153.2 |
7.2% |
12.9% |
Accumulate |
|
Stanbic Holdings |
85.3 |
83.5 |
(2.1%) |
(1.8%) |
85.0 |
84.9 |
4.6% |
6.2% |
Hold |
|
CIC Group |
2.3 |
2.3 |
(1.7%) |
6.6% |
2.1 |
2.1 |
0.0% |
(6.7%) |
Sell |
|
HF Group |
3.4 |
4.6 |
33.9% |
45.9% |
3.1 |
3.0 |
0.0% |
(34.5%) |
Sell |
|
*Target Price as per Cytonn Analyst estimates as at Q3’2020. We are currently reviewing our target prices for the Banking Sector coverage **Upside/ (Downside) is adjusted for Dividend Yield ***For Disclosure, these are stocks in which Cytonn and/or its affiliates are invested in |
|||||||||
We are “Neutral” on the Equities markets in the short term. We expect the recent discovery of a new strain of COVID-19 coupled with the introduction of strict lockdown measures in major economies to continue dampening the economic outlook. However, we maintain our bias towards a “Bullish” equities markets in the medium to long term. We believe there exist pockets of value in the market, with a bias on financial services stocks given the resilience exhibited in the sector. The sector is currently trading at historically cheaper valuations and as such, presents attractive opportunities for investors.
- Industry Reports
During the week, Knight Frank, a real estate developer and property management company, released the Africa Residential Dashboard H2’2020, a report that highlights the rental performance of prime residential markets across Africa. The key take outs from the report are;
- There was a significant decline in both occupancies and rental yields across most of the African cities with the Johannesburg and Cape-town being worst hit having recorded 30.0% decline in rents,
- In Kampala, occupancies registered a 15.0% drop year-on-year in H2’2020 compared to H2’2019 but the rental yields remained at around 8.0% to 10.0%,
- Prime residential sale prices in Nairobi decreased by 3.9% in H2’2020, compared to a 4.0% decrease in H2’2019 attributed to an increase in concessions over the second half of 2020 from developers and sellers due to flexibility and willingness to negotiate lower prices with potential buyers, and,
- Prime residential rents declined by 10.3% between January 2020, and, December 2020 compared to a 2.8% decline during the same period under review in 2019 attributed to the continued oversupply of rental properties and less disposable income due to the unfavourable economic climate.
The above findings are in tandem with the Cytonn Annual Markets Review-2020 which highlighted that the residential sector recorded a decline in performance in FY’2020 with average total returns coming in at 4.7%, down from 6.1% recorded in FY’2019. The rental yields also recorded 0.1% points marginal drop to 4.9% as a results of reduced rental rates amid a tough economic environment while average annual uptake stagnated at 19.3%, as buyers held on to money amid market uncertainty. We expect the residential market to continue experiencing constrained transaction volumes with the ongoing pandemic and this is expected to affect prices and rental rates.
Knight Frank also released the Africa Offices Dashboard H2’2020, a report that outlines the rental performance and trends of prime offices markets across Africa. The key take outs from the Africa Office Dashboard report are as follows;
- Lagos recorded the largest year on year declines in the rental yields by 25.0% as people vacated grade one offices,
- The prime office rents in Nairobi declined by 13.0% in H2’2020 compared to H1’2020 attributed to landlords giving concessions and discounts amid decline in occupancy rates,
- The average occupancy rates across commercial office was approximately 72.0% in the H2’2020,
- The absorption of Grade A and B office space increased by 13.0% in the H2’2020 compared to the H1’2020, attributed to the easing of lockdown measures and the gradual re-opening of the economy, and,
- Nairobi still has some of the low rents per Square meter compared to other cities in the continent.
The above findings are also in line with our Cytonn Annual Markets Review-2020 which highlighted that the asking rents for the commercial office sector declined by 3.2% to an average of Kshs 93.0 per SQFT in 2020 from Kshs 96.0 per SQFT in 2019, while the average asking price declined by 2.9% to Kshs 12,280 per SQFT in 2020 from Kshs 12,638 per SQFT in 2019. The decline in rates is attributable to discounts or concessions offered by landlords in a bid to cushion their clients amid a tough financial environment. The average occupancy rate also recorded a 2.6% decline to 77.7% in FY’2020 from 80.3% in FY’2019. This was attributed to reduced demand of commercial spaces brought about by the ongoing COVID-19 pandemic as some businesses restructured their operations hence scaling down while other organizations adopted work from home strategies. We expect the oversupply in the commercial office sector to increase in 2021 based on the above factors from the current 6.3mn SQFT and the resultant effect will be reduced prices, rental, and occupancy rates.
The COVID-19 pandemic has drastically affected all economies world over, leading to a 4.4% contraction in the world GDP for the FY’2020. This effects spread to the investment markets which saw major stocks markets across the world such as FTSE 100 decline. The Nairobi Securities Exchange was not spared with the NASI declining by 8.6% in 2020. This performance was mainly driven by a decline in the prices of large cap stocks such as Bamburi, Diamond Trust Bank, Equity Group and KCB Group which declined by 52.7%, 31.7%, 31.2% and 29.4%, respectively but the performance was cushioned by the 8.7% gains recorded by Safaricom. Key to note, Safaricom continues to be a key part of Kenyan equities portfolios, accounting for 51.1% of Nairobi Stock Exchange (NSE’s) market capitalization as at 26th Mach 2021. In light of these developments, we saw the need to revisit the topic on investment options in the Kenyan market to shed some light on the available investment options amid this operating environment as an update to the previously done topic where we covered;
Investment options in the Kenyan Market – In July 28, 2019, we wrote about the investment options in the Kenyan market and concluded that the market continues to be an attractive investment destination following the diverse investment product offering.
We shall then focus on the investment options in the Kenyan market, where we shall discuss the following:
- Overview of Investment,
- Categories of Investment products in the Kenyan Market,
- Considerations when choosing an investment option, and,
- Conclusion and recommendation to investors.
Section I: Overview of investments
An investment is the acquisition of an asset or instrument with the goal of generating income or increasing value over time. Investments involve the purchase of goods that are not consumed today but are used in the future to create wealth. There can be either direct investments or indirect investments depending on the sophistication of the investor. When looking at what investments one needs to take, below are the key considerations:
- Risk – Investment risk is a measure of the degree of uncertainty of achieving the returns as per the expectations of the investor. Investments risks include among others: Interest Rate risk which is the risk associated with changes in interest rates, liquidity risk which is the uncertainty surrounding the buying or selling of an asset in a given size over a given period without affecting the price of the asset, etc. There is general principle that the higher the risk the higher the return and so before investing one should understand their risk tolerance levels,
- Return - This is compensation received for making an investment. The return may be received in the form of yield, dividend, and/or capital appreciation. One should understand the potential return and the timing of receiving the said returns and ensure that they are in line with their investments objectives, and,
- Liquidity - This is the level of ease with which an investment can easily be converted to cash without taking a significant discount in value. Liquidity plays an important role in balancing an investor’s portfolio with trade-offs between risk and return.
The table below shows the various characteristics of each asset class in terms of risk, return and Liquidity:
|
Asset Class |
Returns |
Volatility |
Liquidity |
Suitability |
Examples |
|
Equities |
Dividends and Capital appreciation |
High Volatility |
Relatively Liquid |
For long term Investors |
NSE listed stocks e.g. Safaricom |
|
Fixed Income |
Interest Income |
Low Volatility |
Moderately Liquid |
Short to medium term investment requirements |
Deposits, Bonds and Commercial Papers |
|
Property |
Rental Income and Capital Appreciation |
Relatively Stable |
Illiquid |
Long term Investors with a semi fixed horizon |
Project developments & REIT’s |
|
Private Equity |
Dividends and Capital Appreciation |
Relatively Stable |
Illiquid |
Long term |
Investments into a private company |
|
Derivatives |
Discount Rate |
High Volatility |
Relatively Liquid |
Short term |
NSE NEXT Derivatives |
|
Exchange Traded Funds |
Dividends and Capital Appreciation |
High Volatility |
Relatively liquid |
Long term |
Barclays ETF |
|
REITS |
Interest income |
High volatility |
Relatively Liquid |
Long term |
Stanlib Fahari I-REIT |
Section II: Categories of investment products in the Kenyan markets
There are different ways of categories investments either Traditional Investments and Alternative Investments or Direct or Indirect Investments. Traditional investments involve putting capital into well-known assets that are sometimes referred to as public-market investments. Traditional Investments includes Equities, Fixed Income and Mutual Funds/Units Funds. Alternative Investments on the other hand are outside the conventional investment types. The most common alternative investments today are Real Estate, Private Equity and Exchange traded funds. In Real Estate, investors invest in property and land while Private Equity involves buying shares in companies that are not listed on a public exchange or buying shares of public companies with the intent to make them private. Below in detail are the various types of investments in both the traditional and alternative investments category;
- Traditional Investments
This category of investments are well known and easy to understand as updated information is easily available to investors. The main categories of traditional investment products include:
- Equities – Equities represent ownership interest in a company and is considered to be relatively liquid and highly volatile. The returns from equities are in two forms i) Capital appreciation -this is when you sale the security at a higher price than the original purchase price and ii) Dividends which is when listed companies offer cash compensation to equities investors. Investments in equities are largely for medium to long term investments as they come with some level of volatility,
- Fixed Income Securities – These are debt instruments that offer a return in the form of fixed periodic interest payments and principal redemption upon maturity or expiration of the securities’ tenor. Investors earn a fixed amount of income in the form of coupon payments on their bond portfolios at regular intervals. Usually the yields on the securities increase with the increase in the tenor of investments. The following are some of the types of fixed income securities:
-
- Treasury Bills – These are low risk short-term instruments issued and fully guaranteed by the government. They can have tenors of 91, 182 or 364-days and the interest rates vary from week to week. Key to note, T-Bills are offered at a discount in that, when investing in a T-Bill, investors pay less than the face value, however, after the maturity of the T-Bill, the investor receives the full-face value,
- Treasury Bonds – Treasury Bonds (T-Bonds) are long-term investment instruments that pay periodic coupons, in the case of Kenya, semi-annually (every 6 months) throughout the bond’s maturity. Treasury bonds are available in both the primary market and the secondary market through the Nairobi Securities Exchange (NSE). Bond Investors have 2 main motives, (I) investing for trading purposes and (ii) investing with the aim of holding them to maturity. Investors with the aim of holding the bonds to maturity earn their returns from the semi-annual interest and get the face value of the bond upon maturity. Investors with a trading motive on the other hand earn their returns from the fair value gains made from the yield curve movements and also coupons for the period they hold the bond,
- Commercial Papers – These are short-term unsecured debt instruments issued by companies or corporates, as a form of raising short-term debt. In most cases, the issuer is required to maintain the pre-specified interest payment throughout the period. In addition, commercial papers have higher yields as compared to other fixed income securities due to the elevated risk. Notably, Investors must be willing to buy the unsecured Commercial Paper based on the company’s reputation and review of the company’s financial position, and,
- Corporate Bonds – These are long-term debt instruments issued by the private sector with approval from the Capital Markets Authority (CMA) and are priced at a premium to Treasury Bonds. Corporate Bonds are issued by companies in order to finance their operations and most firms issue bonds since the bond market offers lower interest rates. The yield offered is normally higher than the government bonds due to the high risk involved.
Individuals and companies can invest in Treasury bonds through a commercial or investment bank in Kenya, but it is cheaper to invest directly through the Central Bank and reduce extra fees if one has a bank account with a local commercial bank. An investor is required as a pre-requisite to trading, to register their CDS account information and the names of a stockbroker(s) who will serve as their agents with CBK. For more information on government securities and how to invest in them, click here.
- Alternative Investments
Alternative investments are the asset classes that fall outside the conventional category of investments such as publicly-traded equities and fixed income securities. We have seen a lot of growth in the alternative markets with the regulators even coming up with regulations that shall help govern this market. The alternative markets are slightly complicated and most the time the regulations provides that only sophisticated investors can play in this market. The clientele of this investment category is mainly institutional investors and high-net-worth individuals. The main types of alternative investment products in the Kenyan market include:
- Private Equity - Private equity funds invest and acquire equity ownership in private companies, typically those in high-growth stages or those of public companies that go private, with a strategy to exit at the opportune moment. Traditionally, people have invested together in companies but we have seen more formalised investments. Some of the key successful investments by private equity firms would include: Equity bank, Family bank, Java and Nairobi Women’s among others. Investment in Private equity might be capital intensive and might not be easily available to retail investors,
- Derivatives Market – A derivative is a financial instrument that derives its value from one or more underlying assets which can be based on different types of assets such as commodities, equities, bonds, interest rates, exchange rates, or real estates. They are legal contracts in which two parties agree to pay off each other depending on the value of an underlying asset at a certain point in time. Additionally, derivatives can either be traded over-the-counter (OTC) or on an exchange. An Over the Counter transaction involves trades done directly between two parties without any supervision of an exchange as opposed to trading on an exchange characterized by standards and rules upon which the parties venture. The main types of derivatives contracts include: forward contracts, options contracts, futures, swaps and warrants which involve buying and selling of assets under a specified set of rules.
The Nairobi Securities Exchange derivatives market (NEXT) which was launched on 4th July 2019 and has provided a platform for the trading of two futures contracts, in particular: Equity Index Futures and Single Stock Futures. For more information see our topical on Understanding the Derivatives Market, - Real Estate – This involves the purchase of land or buildings, ownership, management, rental and/or sale of property for income generation. The real estate market is divided various categories namely; the residential sector, the industrial sector, the commercial and retail sector, and mixed-use developments. The investments in Real estate can be either directly which will involve actual ownership in the brick and mortar or through ownership in Real Estate trust or shares in a real estate company. Real Estate Investment Trusts (REITs), are pooled investments typically designed to enable the investors to profit from investing in large-scale real estate enterprises and offer investors a liquid interest in real estate and mortgage-backed securities. There are three main types of REITs which include:
- Income REITs (I-REITs) – this is a REIT which invest in completed yielding buildings with the aim of benefiting from both Capital appreciation and Rental income. As such, income returns are predictable and generally less volatile,
- Development REITs (D-REITs) – This is a REIT whose main purposes is the acquisition and development of Real Estate projects . eligible real estate for development and construction projects,
- Islamic REITs – This is an Islamic REIT that invests primarily in income-producing Shariah-compliant real estate. In this case, a fund manager is required to conduct a compliance test before investing in real estate to ensure it is Shariah-compliant and that no non-permissible practices are carried out on the land, or if they are, they are done on a limited basis, and,
- Property funds - Property funds are investments in commercial property, for example, offices, factories, warehouses and retail space. Investors make lump-sum investments, which are pooled together and used to purchase a range of assets, invested either directly through commercial property or indirectly, by buying shares in property companies or other property funds. For more information, please read our article on Real Estate Investment Trusts in Kenya.
- Exchange Traded Funds (ETFs) - This are publicly traded investment products that monitor the performance of a diversified portfolio of stocks, bonds, and commodities. An ETF can also track a single commodity such as oil or a precious metal like gold. This funds give investors the chance to buy units that track whole indices as easily as buying shares listed on the Exchange. An example of an ETF is the Barclays NewGold ETF which was launched on 30th June 2017 and listed on the Johannesburg Stocks Exchange the fund enables investors to invest in an instrument that monitors the price of Gold Bullion. Price movement of the ETF are determined by the price movement of gold and each gold security corresponds to approximately 0.01 troy ounces of gold bullion. Consequently, the allocated gold held as collateral must be of South African origin, which means it must comply with Reserve Bank of South Africa regulations. ETFs provide liquidity, diversification and potentially high returns to investors,
Advantages and Disadvantages of Traditional and Alternative Investments
Some of the advantages of traditional investment products include:
- Information Availability – Companies listed on the Exchange are required by regulation to publish information on a regular basis. The management of the said companies are also readily available to meet with the analysts and explain to them the performance of the companies,
- Standardized, well known and easy to understand structures,
- High Liquidity – Majority of the traditional investment classes have a ready market for the sale of assets and thus can be easily converted to cash, and,
- Regulation - Traditional investment products operate under the supervision of the regulatory bodies such as the CMA and the Retirement Benefits Authority (RBA) among others, who layout procedures to follow when making a transaction or allocation of funds for the mutual funds which presents a form of safety to any investment made.
The main disadvantages of traditional investment products include:
- Lower returns relative to alternative markets – The real returns from traditional investments, when inflation is taken into account, tends to be lower than alternative investments which are less volatile,
- High Correlation of Returns – This is the relation of movement in prices of assets in the market. Traditional investment products such as equities are known to have similar movements in the market, especially when there is a movement in the large-cap stocks, this affects the performance of other equities in the market, and,
- The volatility of Returns – traditional investment products such as stocks and bonds are highly sensitive to market changes such as inflation and interest changes and thus performance is pegged on the prevailing market conditions. Furthermore, when the returns are adjusted for price changes as a result of inflation, the real return may not be as high as expected.
The main advantages of alternative investment products include:
- Potential for High Returns- Alternative investments offer the potential for higher returns when compared to traditional investment products in the long term. Structured products are intended to provide investors with highly focused investments that are customized to their risk profiles, return expectations, and market expectations. High returns can also be achieved through consolidation, in which economies of scale are achieved by the accumulation of client funds, which are then invested, by professionals with business expertise and experience,
- Low Correlation of with the market – Alternative investment products typically have their value that is independent on factors that affect prices of conventional asset classes they can mitigate shocks from financial meltdowns using their contrarian strategies, and,
- Alternative Source of Funding for Businesses – Alternative investments have enabled businesses to raise capital on more favourable terms for both parties. This has been made possible by banks or institutions that deal with alternative investments by bringing real estate opportunities to the market through venture capital funds. As a result, investors get diversified avenues that reduce the overall portfolio risk and at the same time provide them with capital.
The main disadvantages of alternative investment products include:
- Operating in a Less Regulated Environment - Alternative investments, in contrast to conventional investment products, are subject to less strict oversight, which increases the risk of investments made,
- Lengthy Process to Carry out a Transaction– Most alternative investment offerings are tailored to the needs of their customers hence the process of initiating a contract, conducting due diligence on the transaction, structuring the deal, and eventually completing the transaction takes time,
- Limited Availability of Information - The majority of alternative investments entail private transactions and thus there is little information on the details of deals carried out subject to the information released by the parties involved,
- Low Liquidity - Alternative investment products are mostly designed for long-term investors, making it impossible to sell them until they reach maturity unless there is already a willing buyer in the market, and,
- Restricted to highly sophisticated Investors which makes them eligible for certain benefits and opportunities unavailable to other classes of investors who would also wish to invest in alternative investments.
Direct and Indirect Investments
Investors can either invest in the above products either by directly buying into them or indirectly by investing through collective investment schemes. When doing direct investments one needs to understand what they want and buy that through a broker. This will involve opening a CDSC account and selecting the broker they want. On the other hand, indirect investments is done through funds and there are two main ways that investors can invest in pooled funds;
- Mutual Funds/Unit Trust Funds - This is a collective investment scheme that pools money together from many investors and is managed by a professional fund manager who invests the pooled funds with a view of paying a return in accordance with specific shared investment objectives that have been established for the scheme. The funds in the mutual fund give returns in the form of dividends, interest income and/or capital gains depending on the asset class the funds are invested in. The following are the main types of Unit Trust Funds:
- Money Market Fund – This fund mainly invests in short-term debt securities with high credit quality such as bank deposits, treasury bills, and commercial paper. The fund offers high-income yield, liquidity as well as capital stability. In the current market, one can invest in select Money Market Funds with as little as Kshs 1,000,
- Equity Fund – this fund buys shares in publicly traded common stocks. The fund aims to offer superior returns over the medium to longer-term by maximizing capital gains and dividend income. Equity funds employ the rationale of investing in various undervalued equity securities, which not only presents significant growth potential, thereby optimizing an investor’s real return, but also limits downside risk should any individual securities enter any bearish phase. Investors can investment in select Equity Funds with as little as Kshs 5,000,
- Fixed Income Fund – This fund invests in interest-bearing securities which include treasury bills, treasury bonds, preference shares, corporate bonds, loan stock, approved securities, notes and liquid assets consistent with the portfolio’s investment objective. Fixed income funds give returns to investors at minimal risks,
- Balanced Fund – This fund invests in a diversified portfolio that contains an equities component, a fixed-income securities component and sometimes a money market component to offer investors a reasonable level of current income and long-term capital growth. The equity component seeks to deliver long term returns, while the debt component provides stability to the portfolio. This diversification limits the portfolio from downside risks if either equity or debt enters a bearish phase. Investors interested investing in Balanced Funds can do so with as little as Kshs 5,000 with select Fund Managers, and,
- Sector specific funds- A sector fund is an investment fund that invests solely in businesses that operate in a particular industry or sector of the economy. This funds have higher volatility because they concentrate on a single sector of the economy and hence lack diversification. However, sector funds may offer diversification through multiple holdings in a portfolio but, due to their targeted sector exposure, overall sector funds may have idiosyncratic risks that affect the entire portfolio. If one industry performs badly, the rest of the economy suffers.
For more information, please read our topical on Investing in Unit Trust Funds.
- Pension Funds – This refers to an investment fund into which individuals contribute their investments with the aim of saving for retirement. The investments are guided by the provisions of the Retirement Benefits Act and the specific characterises of the fund as set out in the Investment Policy statement. Pension funds can be categorized into two in terms of returns; guaranteed funds, which provide a guaranteed minimum rate of return, and segregated funds, which offer market-based returns. Alternatively, they can be categorized by mode of contribution, where we have individual retirement benefit schemes, where individuals can contribute directly into the fund towards saving for their retirement, and umbrella retirement benefit schemes, that pool the contributions of multiple employers and their employees. For more information, see our topical on Retirement Benefit Schemes in Kenya.
Section III: Considerations when choosing an investment option
Investors may invest in single assets or a portfolio of assets, depending on the intended outcome. Below are some of the factors that an investor should consider when making an investment decision;
- Returns - These are the incomes made from an investment. A rational investor seeks out a venture that offers maximum returns for a given level of risk. The returns available and the investor's preference for producing a stream of income or capital appreciation in their portfolio should be basic determinants of an investment option. The aim is to ensure that the returns earned are higher than inflation and there is compensation for any additional risk undertaken,
- Risk Tolerance - This is the uncertainty that the investment will not generate the expected return on investments. Risks affecting investment asset classes differ from one asset to another with the riskiest ones yielding the highest returns. As such, an investor needs to understand his/her risk appetite before investing and you should not invest in that which you do not understand,
- Liquidity -This refers to how quickly one can convert an asset to cash. Key to note, liquidity varies from one asset to another. For investors who would prefer high liquidity, it is important to consider investing in short-term liquid assets such as treasury bills and equities,
- Time Horizon - This is the length of time that an investor intends to hold an investment. The Investment Horizon is largely dictated by the use of the investments. Investments with a short term horizon should not be invested in risky or volatile Asset classes like equites. Key to note, younger people have a longer time horizon and can, therefore, make riskier investment decisions as they have time to recover if they end up making losses,
- Investment Capital – One's investment capital determines their investment choice, since certain investments need more capital, making it more difficult for investors with less capital to invest. Further, any trading strategy relies heavily on the distribution and utilization of investment capital. To counter the possible losses that may arise from market fluctuations, an investor can choose to diversify their portfolio across a variety of asset classes and products. In the current market, one can invest in equities directly or through Collective Investment Schemes like Equity fund with as little as Kshs 1,000, or in government papers through Collective Investment Schemes like Money Market Funds with as little as Kshs 100 in select equities, and,
- Investors Investment Knowledge and Level of Sophistication – A sophisticated investor is a high-net-worth investor who is considered to have a depth of experience and market knowledge that makes them eligible for certain benefits and opportunities unavailable to other classes of investor, such as pre-IPO securities. Such investors do not need to liquidate investment assets in the short term, and can even sustain a loss of their investment without damage to their overall net worth. As such, an investor should first asses his/her capital sufficiency, experience, net worth and liquidity needs before investing.
Section V: Conclusion and Recommendations to investors
When making Investments it is always advisable to work with a financial Advisor to ensure you have got the right objectives in place and select the best portfolio for oneself. In the Kenyan market, a wide range of investment products based on one’s investment goals, risk appetite, liquidity status, and desired return have been availed to investors. For an investor to thrive in the investment market, one is required to apply informed investment strategies on the selected investment options. As such, it is important that before investing, you know your risk tolerance. It is also important to ensure diversification in ones portfolio as it proves to be the most crucial component of attaining long-term financial goals at minimal risks therefore setting up a safety net for your investment portfolio. However, amidst the risks that emanate from the COVID-19, there lies a variety of opportunities for investors as outlined below;
- Equity Investors: For investors with a long-term horizon, selective entry into the equities market given the current attractive valuations would be recommendable as it presents an opportunity for potential upsides for companies with strong financial fundamentals. Investors keen on the capital markets can also consider investing in the Nairobi Securities Exchange Derivatives Markets (NEXT) which provides an opportunity for investors to protect their portfolios against volatile stock prices,
- Fixed Income Investors: Given the low volatility of the fixed income securities and the moderate liquidity aspect of these securities, such as the Treasury Bills and the Treasury bonds, investors keen on investing in fixed income securities should be biased towards short-term fixed income securities in order to reduce the duration risk, and,
- Real Estate Investors: Real Estates are a good investment option as they provide investors the opportunity to participate in real estate projects and a platform to get high yields on the longer term. An investor can choose to invest in REITs which are still at the initial stages with only one being listed, the Fahari I-REIT. One of the main drawbacks REITs market is minimal investor knowledge on the instrument. There are however pockets of value for investors in this sector owing to the increased government support, and public sector sensitization of the REITs.
Investors who are keen on investing in the capital market but have no crucial information on how to go about it, can invest through Collective Investments Schemes such as the Money Market Fund, Balanced Funds, Equity Funds etc. Collective Investments Schemes allow investors to re-align their investments with their risk appetite by pooling money together and investing in safe havens. With the help of a professional fund manager, investors can tap into the expertise of fund managers who have crucial information of the market and can screen for better investment opportunities. Additionally, CIS will ensure investors maintain a diversified portfolio as well as gain access to investment products inaccessible to an individual investor such as government and corporate bonds, which are restricted to institutional investors.
Disclaimer: The views expressed in this publication are those of the writers where particulars are not warranted. This publication, which is in compliance with Section 2 of the Capital Markets Authority Act Cap 485A, is meant for general information only and is not a warranty, representation, advice or solicitation of any nature. Readers are advised in all circumstances to seek the advice of a registered investment advisor.

- Talk to us
- Kenya
- P.O Box 20695 - 00200, Nairobi, Kenya
- Cell +254709101200
- Tel +254709101200
- WhatsApp +254741676635
- United States
- +254709101200
- DOWNLOAD OUR APP
-


- Kenya
- 8th Floor, Pinetree Plaza, Kaburu Drive, Ngong Road, Nairobi, Kenya
- USA
- Suite 1150, 1775 Eye Street NW, USA, Washington DC 20006, USA
- Investments
- High Yield
- Private Equity
- Real Estate
- Real Estate
- RiverRun Estates
- Cytonn Towers
- The Ridge
- Taraji Heights
- The Alma