Investment Risk Analysis, & Cytonn Weekly #34/2023
By Cytonn Research, Aug 27, 2023
Executive Summary
Fixed Income
During the week, T-bills were undersubscribed for the first time in three weeks, with the overall subscription rate coming in at 95.8%, lower than the oversubscription rate of 186.2% recorded the previous week. Investors’ preference for the shorter 91-day paper persisted, with the paper receiving bids worth Kshs 18.2 bn against the offered Kshs 4.0 bn, translating to an oversubscription rate of 455.4%, albeit lower than the 955.7% recorded the previous week. The subscription rate for the 364-day and 182-day papers decreased to 22.0% and 25.8%, from 25.9% and 38.6% recorded the previous week. The government accepted a total of Kshs 20.4 bn worth of bids out of Kshs 23.0 bn of bids received, translating to an acceptance rate of 88.7%. The yields on the government papers continued to rise, with the yields on the 364-day, 182-day, and 91-day papers increasing by 26.8 bps, 21.5 bps and 25.8 bps to 14.0%, 13.5% and 13.7% respectively;
In the primary market, the Central Bank of Kenya released the auction results for the tap-sale of the newly issued bond FXD1/2023/002 with a tenor to maturity of 2 years and the re-opened bond FXD1/2023/005 with a 4.9-year tenor to maturity. The bonds recorded an oversubscription rate of 112.4%, receiving bids worth Kshs 23.6 bn against the offered Kshs 21.0 bn. The government accepted bids worth Kshs 23.5 bn, translating to an acceptance rate of 99.6%. The allocated average yield of accepted bids is 17.0% and 18.0% for FXD1/2023/002 and FXD1/2023/005, respectively. The coupon rate for the FXD1/2023/002 was set at 17.0% and FXD1/2023/005 at 16.8%, respectively;
We are projecting the y/y inflation rate for August 2023 to come in at the range of 6.8% - 7.2% mainly on the back of easing food prices as well as the tight monetary policy stance in the country;
Equities
During the week, the equities market was on a downward trajectory, with NASI, NSE 20, and NSE 25 declining by 1.9%, 0.7%, and 2.1%, respectively, taking the YTD performance to losses of 22.0%, 9.1%, and 18.3% for NASI, NSE 20, and NSE 25, respectively. The equities market performance was mainly driven by losses recorded by large-cap stocks such as KCB Group, ABSA Bank and Safaricom of 13.5%, 6.7 and 3.1%, respectively. The losses were, however, mitigated by gains recorded by stocks such as EABL, Standard Chartered and Bamburi of 7.2%, 6.0% and 3.4% respectively;
During the week, 5 listed banks Standard Chartered Bank, NCBA Group, Diamond Trust Bank-Kenya, and I&M Holdings released their H1’2023 financial results, with their Core Earnings Per Share EPS increasing by 27.7%, 20.3%, 16.0% and 2.2% respectively, while Kenya Commercial Bank Group recording an 18.3% decline in core earnings per share;
Real Estate
During the week, property firm Knight Frank released its Kenya Market Update H1’2023 Report highlighting that high-end Real Estate properties remained resilient despite economic shocks attributed to prime rental rates and occupancies surpassing market averages;
In the retail sector, chain store Naivas Supermarket opened its 98th outlet located at Shell petrol station, along Waiyaki Way, Nairobi. The retailer’s decision to open up the store forms part of its expansion strategy dubbed ‘Road To 100’;
In the regulated Real Estate funds, under the Real Estate Investment Trusts (REITs) segment, Fahari I-REIT closed the week trading at an average price of Kshs 6.0 per share in the Nairobi Securities Exchange, representing a 1.0% decline from the Kshs 6.1 recorded the previous week. On the Unquoted Securities Platform as at 25 August 2023, Acorn D-REIT and I-REIT closed the week trading at Kshs 23.9 and Kshs 21.6 per unit, a 19.4% and 8.0% gain for the D-REIT and I-REIT, respectively, from the Kshs 20.0 inception price. In addition, Cytonn High Yield Fund (CHYF) closed the week with an annualized yield of 13.6%, remaining relatively unchanged from what was recorded the previous week;
Focus of the Week
Due to the state of the market and the unique characteristics of individual firms, all investments carry a certain amount of risk. Investment risk tends to rise during periods of high uncertainty and fall during periods of low uncertainty. The current state of the Kenyan economy is characterized by heightened inflationary pressures, sustained currency depreciation, and growing anxiety over the public debt of the government. In order to ensure that investment returns are closely matched to risk expectations, this week we turn our attention to investment risk, where we analyse the various ways investment risk can be managed;
Investment Updates:
- Weekly Rates:
- Cytonn Money Market Fund closed the week at a yield of 12.09% p.a To invest, dial *809# or download the Cytonn App from Google Playstore here or from the Appstore here;
- Cytonn High Yield Fund closed the week at a yield of 13.56% p.a. To invest, email us at sales@cytonn.com and to withdraw the interest, dial *809# or download the Cytonn App from Google Playstore here or from the Appstore here;
- We continue to offer Wealth Management Training every Wednesday, from 9:00 am to 11:00 am. The training aims to grow financial literacy among the general public. To register for any of our Wealth Management Trainings, click here;
- If interested in our Private Wealth Management Training for your employees or investment group, please get in touch with us through wmt@cytonn.com;
- Cytonn Insurance Agency acts as an intermediary for those looking to secure their assets and loved ones’ future through insurance namely; Motor, Medical, Life, Property, WIBA, Credit and Fire and Burglary insurance covers. For assistance, get in touch with us through insuranceagency@cytonn.com;
- Cytonn Asset Managers Limited (CAML) continues to offer pension products to meet the needs of both individual clients who want to save for their retirement during their working years and Institutional clients that want to contribute on behalf of their employees to help them build their retirement pot. To more about our pension schemes, kindly get in touch with us through pensions@cytonn.com;
Real Estate Updates:
- For more information on Cytonn’s real estate developments, email us at sales@cytonn.com;
- Phase 3 of The Alma is now ready for occupation and the show house is open daily. To join the waiting list to rent, please email properties@cytonn.com;
- For Third Party Real Estate Consultancy Services, email us at rdo@cytonn.com;
- For recent news about the group, see our news section here;
Hospitality Updates:
- We currently have promotions for Staycations. Visit cysuites.com/offers for details or email us at sales@cysuites.com;
Money Markets, T-Bills Primary Auction:
During the week, T-bills were undersubscribed for the first time in three weeks, with the overall subscription rate coming in at 95.8%, lower than the oversubscription rate of 186.2% recorded the previous week. Investors’ preference for the shorter 91-day paper persisted, with the paper receiving bids worth Kshs 18.2 bn against the offered Kshs 4.0 bn, translating to an oversubscription rate of 455.4%, albeit lower than the 955.7% recorded the previous week. The subscription rate for the 364-day and 182-day papers decreased to 22.0% and 25.8%, from 25.9% and 38.6% recorded the previous week. The government accepted a total of Kshs 20.4 bn worth of bids out of Kshs 23.0 bn of bids received, translating to an acceptance rate of 88.7%. The yields on the government papers continued to rise, with the yields on the 364-day, 182-day, and 91-day papers increasing by 26.8 bps, 21.5 bps and 25.8 bps to 14.0%, 13.5% and 13.7% respectively.
So far in the current FY’2023/24, government securities totalling Kshs 337.0 bn have been advertised. The government has accepted bids worth Kshs 364.3 bn, of which 239.7 bn and 124.6 bn were treasury bills and bonds, respectively. Total redemptions so far in FY’2023/24 equal to Kshs 292.5 bn, with treasury bills accounting for all redemptions. As a result, the government has a domestic borrowing surplus of Kshs 71.8 billion in FY’2023/24.
The chart below compares the overall average T- bills subscription rates obtained in 2017, 2022 and 2023 Year to Date (YTD):
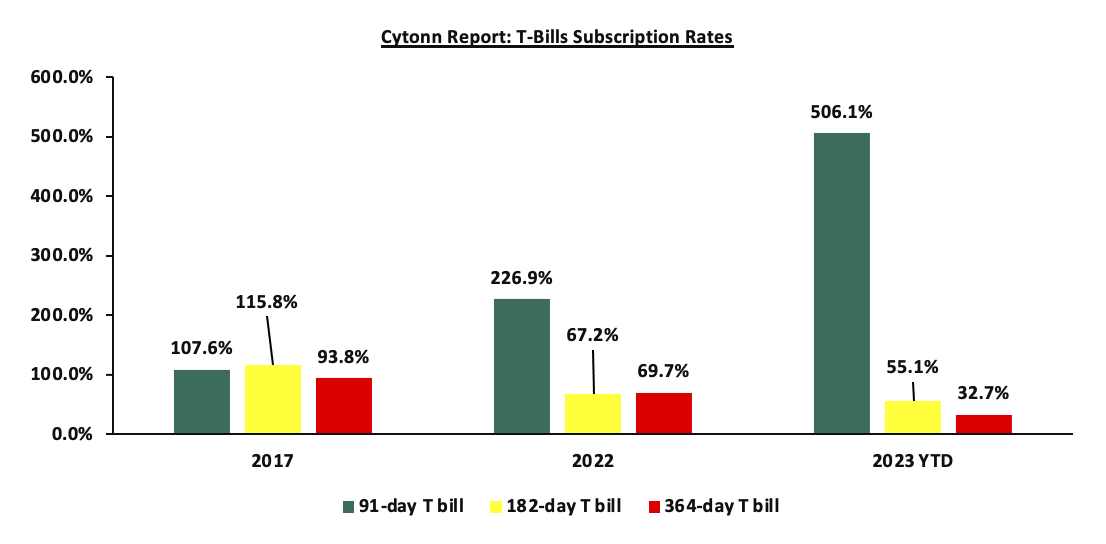
Source: Central Bank of Kenya (CBK)
In the primary market, the Central Bank of Kenya released the auction results for the tap-sale of the newly issued bond FXD1/2023/002 with a tenor to maturity of 2 years and the re-opened bond FXD1/2023/005 with a 4.9-year tenor to maturity. The bonds recorded an oversubscription rate of 112.4%, receiving bids worth Kshs 23.6 bn against the offered Kshs 21.0 bn. The government accepted bids worth Kshs 23.5 bn, translating to an acceptance rate of 99.6%. The allocated average yield of accepted bids is 17.0% and 18.0% for FXD1/2023/002 and FXD1/2023/005, respectively. The coupon rate for the FXD1/2023/002 was set at 17.0% and FXD1/2023/005 at 16.8%, respectively.
Money Market Performance:
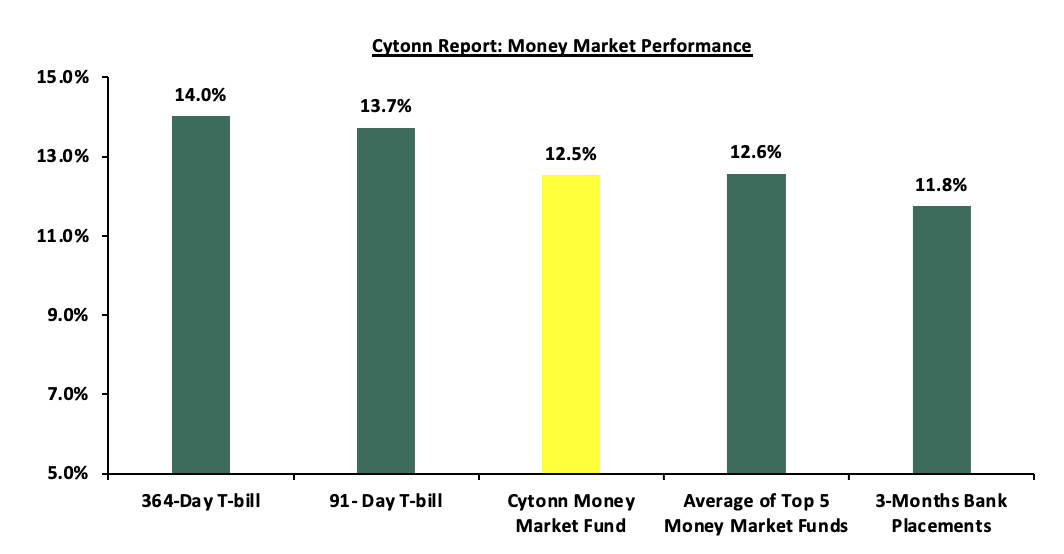
In the money markets, 3-month bank placements ended the week at 11.8% (based on what we have been offered by various banks), while the yields on the 364-day and 91-day T-bills increased by 26.8 bps and 25.8 bps to 14.0% and 13.7%, respectively. The yield of Cytonn Money Market Fund increased by 14.0 bps to 12.5%, from 12.4% recorded the previous week while the average yields on the Top 5 Money Market Funds increased by 11.2 bps to 12.6% from 12.5% recorded the previous week.
The table below shows the Money Market Fund Yields for Kenyan Fund Managers as published on 25th August 2023:
|
Cytonn Report: Money Market Fund Yield for Fund Managers as published on 25th August 2023 |
||
|
Rank |
Fund Manager |
Effective Annual |
|
1 |
GenAfrica Money Market Fund |
13.0% |
|
2 |
Enwealth Money Market Fund |
12.6% |
|
3 |
Cytonn Money Market Fund |
12.5% |
|
4 |
Lofty-Corban Money Market Fund |
12.4% |
|
5 |
Etica Money Market Fund |
12.4% |
|
6 |
Madison Money Market Fund |
12.2% |
|
7 |
Jubilee Money Market Fund |
12.1% |
|
8 |
Kuza Money Market fund |
12.0% |
|
9 |
Co-op Money Market Fund |
11.6% |
|
10 |
Apollo Money Market Fund |
11.6% |
|
11 |
GenCap Hela Imara Money Market Fund |
11.4% |
|
12 |
Old Mutual Money Market Fund |
11.4% |
|
13 |
Sanlam Money Market Fund |
11.4% |
|
14 |
ICEA Lion Money Market Fund |
11.3% |
|
15 |
Absa Shilling Money Market Fund |
11.3% |
|
16 |
AA Kenya Shillings Fund |
11.2% |
|
17 |
Nabo Africa Money Market Fund |
11.0% |
|
18 |
Dry Associates Money Market Fund |
10.9% |
|
19 |
KCB Money Market Fund |
10.8% |
|
20 |
NCBA Money Market Fund |
10.8% |
|
21 |
CIC Money Market Fund |
10.5% |
|
22 |
Orient Kasha Money Market Fund |
10.2% |
|
23 |
British-American Money Market Fund |
9.5% |
|
24 |
Mali Money Market Fund |
9.3% |
|
25 |
Equity Money Market Fund |
9.0% |
Source: Business Daily
Liquidity
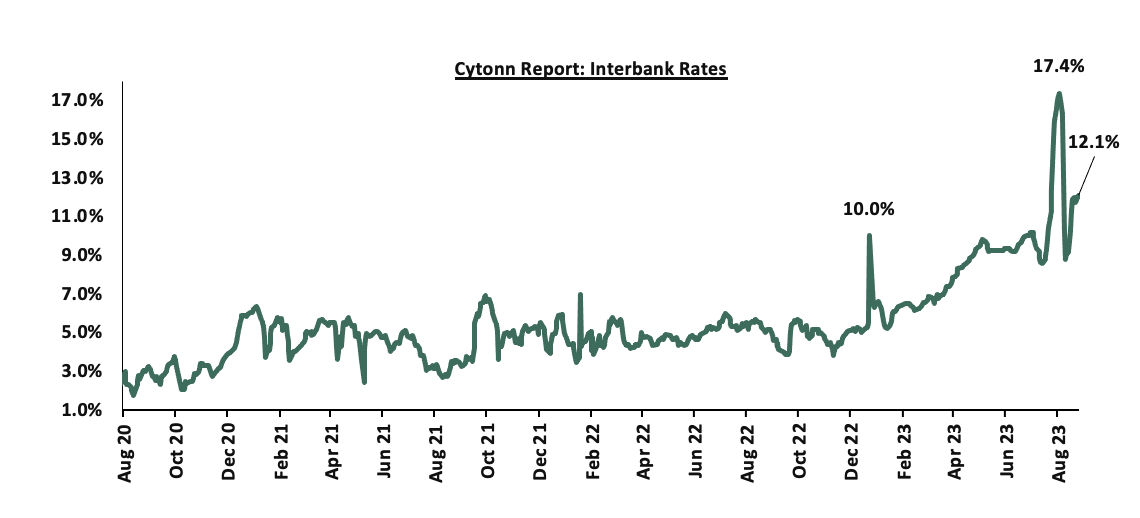
During the week, liquidity in the money markets decreased, with the average interbank rate increasing to 11.9% from 10.3% recorded the previous week, partly attributable to increased tax remittances which offset government’s payments. The average interbank volumes traded increased by 26.1% to Kshs 28.2 bn, from Kshs 22.4 bn recorded the previous week. The chart below shows the interbank rates in the market over the years:
Kenya Eurobonds:
During the week, the yields on Eurobonds were on a downward trajectory, with the yield on the 10-year Eurobond issued in 2014 having decreased the most by 1.2% points to 13.0% from 14.2%, recorded the previous week. The table below shows the summary of the performance of the Kenyan Eurobonds as of 24th Aug 2023;
|
Cytonn Report: Kenya Eurobonds Performance |
||||||
|
|
2014 |
2018 |
2019 |
2021 |
||
|
Date |
10-year issue |
10-year issue |
30-year issue |
7-year issue |
12-year issue |
12-year issue |
|
Amount Issued (USD) |
2.0 bn |
1.0 bn |
1.0 bn |
0.9 bn |
1.2 bn |
1.0 bn |
|
Years to Maturity |
0.8 |
4.5 |
24.5 |
3.7 |
8.7 |
10.8 |
|
Yields at Issue |
6.9% |
7.3% |
8.3% |
7.0% |
8.0% |
6.3% |
|
02-Jan-23 |
12.9% |
10.5% |
10.9% |
10.9% |
10.8% |
9.9% |
|
01-Aug-23 |
12.5% |
10.8% |
10.8% |
11.3% |
10.8% |
10.3% |
|
17-Aug-23 |
14.2% |
11.7% |
11.4% |
12.3% |
11.5% |
11.0% |
|
18-Aug-23 |
14.2% |
11.8% |
11.4% |
12.3% |
11.5% |
11.1% |
|
21-Aug-23 |
14.2% |
11.8% |
11.5% |
12.3% |
11.5% |
11.1% |
|
22-Aug-23 |
14.1% |
11.8% |
11.4% |
12.3% |
11.5% |
11.1% |
|
23-Aug-23 |
13.2% |
11.6% |
11.3% |
12.0% |
11.4% |
10.9% |
|
24-Aug-23 |
13.0% |
11.5% |
11.2% |
11.9% |
11.3% |
10.8% |
|
Weekly Change |
(1.2%) |
(0.2%) |
(0.2%) |
(0.4%) |
(0.2%) |
(0.2%) |
|
MTD Change |
0.5% |
0.7% |
0.4% |
0.6% |
0.5% |
0.5% |
|
YTD Change |
0.1% |
1.0% |
0.3% |
1.0% |
0.5% |
0.9% |
Source: Source: Central Bank of Kenya (CBK) and National Treasury
Kenya Shilling:
During the week, the Kenya Shilling depreciated by 0.5% against the US dollar to close the week at Kshs 144.9 from Kshs 144.2 recorded the previous week. On a year to date basis, the shilling has depreciated by 17.4% against the dollar, adding to the 9.0% depreciation recorded in 2022. We expect the shilling to remain under pressure in 2023 as a result of:
- An ever-present current account deficit, which came at 2.3% of GDP in Q1’2023 from 4.2% recorded in a similar period last year, and,
- The need for government debt servicing, continues to put pressure on forex reserves given that 66.8% of Kenya’s external debt is US Dollar denominated as of April 2023, and,
The shilling is however expected to be supported by:
- Diaspora remittances standing at a cumulative USD 2,411.9 mn in 2023 as of July 2023, 2.0% higher than the USD 2,364.0 mn recorded over the same period in 2022, and,
- The tourism inflow receipts which came in at Kshs 268.1 bn in 2022, a significant 82.9% increase from Kshs 146.5 bn inflow receipts recorded in 2021.
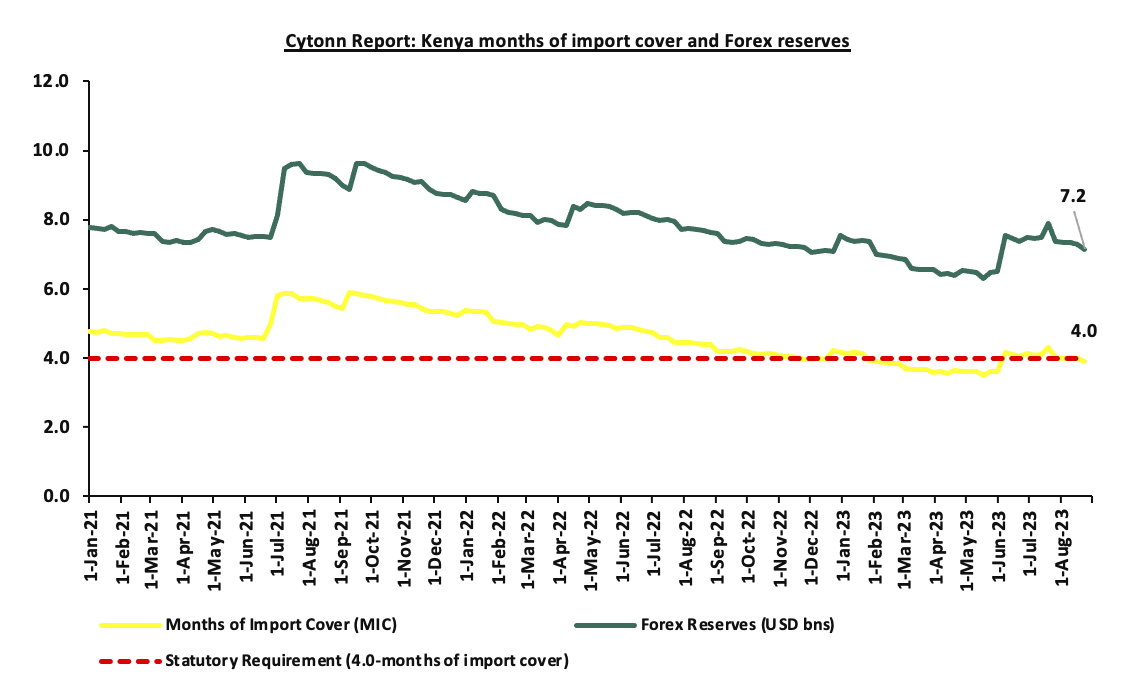
- Adequate forex reserves currently at USD 7.2 bn (equivalent to 4.0-months of import cover), which is within the statutory requirement of maintaining at least 4.0-months of import cover.
The chart below summarizes the evolution of Kenya months of import cover over the years:
Weekly Highlight:
We are projecting the y/y inflation rate for August 2023 to come in at the range of 6.8% – 7.2% mainly on the back of:
- Unchanged Fuel Prices – Fuel prices for the period between 15th August and 14th September 2023 remained unchanged at Kshs 194.7 per litre for Super Petrol, Kshs 179.7 per litre for Diesel and Kshs 169.5 per litre for Kerosene respectively,
- Tight monetary policy stance – Earlier this month, the monetary policy committee noted that, the impact of its move to tighten the monetary policy in June 2023 to anchor inflationary expectations was still transmitting in the economy and decided to maintain the rate at 10.5%. The committee's projections indicate that if the current trends persists, inflation is likely to ease further. The ongoing transmission of the earlier policy tightening, coupled with the prudent monetary stance, is expected to guide the economy toward a more sustainable inflation rate,
- Easing food prices – Food prices have been reducing marginally in the recent past with the food inflation easing to 8.6% in the month of July 2023, from 10.3% in June 2023, as a result of the long rains and an improved supply of select non-vegetable food items. This trend is expected is to continue in coming few months on the back of increased subsidization of key agricultural inputs such as fertilizers, which would see an increase in food production.
Going forward, we expect the measures taken by the government to subsidize major inputs of agricultural production, such as fertilizers, to lower the cost of farm inputs and support the easing of inflation in the long term.
Rates in the Fixed Income market have been on an upward trend given the continued high demand for cash by the government and the occasional liquidity tightness in the money market. The government is 12.6% behind its prorated net domestic borrowing target of Kshs 82.2 bn, having a net borrowing position of Kshs 71.8 bn of the domestic net borrowing target of Kshs 586.5 bn for the FY’2023/2024. Therefore, we expect a continued upward readjustment of the yield curve in the short and medium term, with the government looking to bridge the fiscal deficit through the domestic market. Owing to this, our view is that investors should be biased towards short-term fixed-income securities to reduce duration risk.
Market Performance:
During the week, the equities market was on a downward trajectory, with NASI, NSE 20, and NSE 25 declining by 1.9%, 0.7%, and 2.1%, respectively, taking the YTD performance to losses of 22.0%, 9.1%, and 18.3% for NASI, NSE 20, and NSE 25, respectively. The equities market performance was mainly driven by losses recorded by large-cap stocks such as KCB Group, ABSA Bank and Safaricom of 13.5%, 6.7 and 3.1%, respectively. The losses were, however, mitigated by gains recorded by stocks such as EABL, Standard Chartered and Bamburi of 7.2%, 6.0% and 3.4% respectively;
During the week, equities turnover decreased by 72.9% to USD 3.2 mn from USD 11.7 mn recorded the previous week, taking the YTD total turnover to USD 533.2 mn. Foreign investors remained net buyers for the fourth consecutive week with a net buying position of USD 0.1 mn, from a net buying position of USD 0.7 mn recorded the previous week, taking the YTD foreign net selling position to USD 271.6 mn.
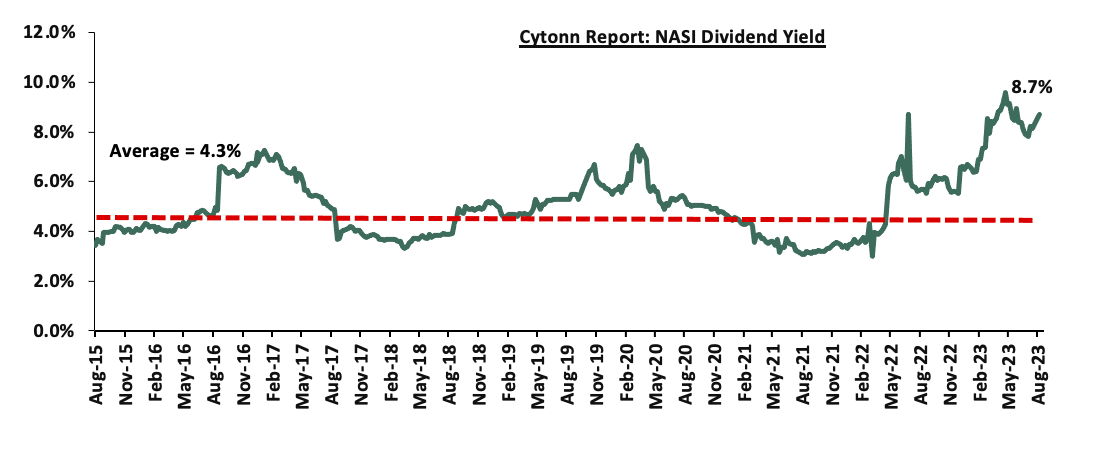
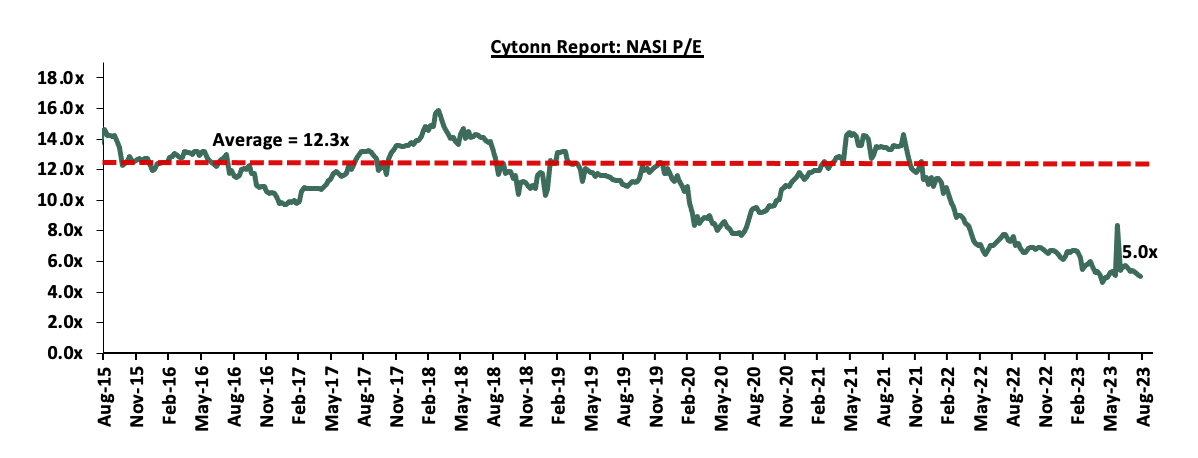
The market is currently trading at a price to earnings ratio (P/E) of 5.0x, 59.3% below the historical average of 12.3x. The dividend yield stands at 8.7%, 4.4% points above the historical average of 4.3%. Key to note, NASI’s PEG ratio currently stands at 0.6x, an indication that the market is undervalued relative to its future growth. A PEG ratio greater than 1.0x indicates the market is overvalued while a PEG ratio less than 1.0x indicates that the market is undervalued. The charts below indicate the historical P/E and dividend yields of the market;
Weekly Highlight
- Earnings Release
- KCB Group H1’2023 Financial Performance
During the week, KCB Group released their H1’2023 financial results. Below is a summary of the performance.
|
Balance Sheet Items |
H1'2022 |
H1'2023 |
y/y change |
|
Government Securities |
246.3 |
320.3 |
30.1% |
|
Net Loans and Advances |
730.3 |
964.8 |
32.1% |
|
Total Assets |
1,210.1 |
1,864.6 |
54.1% |
|
Customer Deposits |
908.6 |
1,471.2 |
61.9% |
|
Deposits per branch |
1.8 |
2.4 |
32.3% |
|
Total Liabilities |
1,028.4 |
1,646.6 |
60.1% |
|
Shareholders’ Funds |
179.1 |
211.2 |
17.9% |
|
Balance Sheet Ratios |
H1'2022 |
H1'2023 |
% y/y change |
|
Loan to Deposit Ratio |
80.4% |
65.6% |
(14.8%) |
|
Government Securities to Deposit ratio |
27.1% |
21.8% |
(5.3%) |
|
Return on average equity |
23.2% |
19.1% |
(4.1%) |
|
Return on average assets |
3.5% |
2.4% |
(1.0%) |
|
Income Statement |
H1'2022 |
H1'2023 |
y/y change |
|
Net Interest Income |
40.6 |
45.5 |
12.1% |
|
Net non-Interest Income |
19.2 |
27.6 |
43.4% |
|
Total Operating income |
59.8 |
73.1 |
22.2% |
|
Loan Loss provision |
(4.3) |
(10.2) |
136.0% |
|
Total Operating expenses |
(31.6) |
(50.6) |
60.0% |
|
Profit before tax |
28.2 |
22.5 |
(20.3%) |
|
Profit after tax |
19.6 |
16.1 |
(18.3%) |
|
Core EPS |
6.11 |
5.00 |
(18.3%) |
|
Income Statement Ratios |
H1'2022 |
H1'2023 |
y/y change |
|
Yield from interest-earning assets |
11.3% |
9.8% |
(1.5%) |
|
Cost of funding |
3.0% |
3.3% |
0.2% |
|
Net Interest Spread |
8.3% |
6.6% |
(1.7%) |
|
Net Interest Margin |
8.5% |
6.7% |
(1.7%) |
|
Cost of Risk |
7.2% |
13.9% |
6.7% |
|
Net Interest Income as % of operating income |
67.9% |
62.3% |
(5.6%) |
|
Non-Funded Income as a % of operating income |
32.1% |
37.7% |
5.6% |
|
Cost to Income Ratio |
52.9% |
69.3% |
16.4% |
|
Capital Adequacy Ratios |
H1'2022 |
H1'2023 |
% points change |
|
Core Capital/Total Liabilities |
17.3% |
14.4% |
(2.9%) |
|
Minimum Statutory ratio |
8.0% |
8.0% |
0.0% |
|
Excess |
9.3% |
6.4% |
(2.9%) |
|
Core Capital/Total Risk Weighted Assets |
17.7% |
15.0% |
(2.7%) |
|
Minimum Statutory ratio |
10.5% |
10.5% |
|
|
Excess |
7.2% |
4.5% |
(2.7%) |
|
Total Capital/Total Risk Weighted Assets |
21.6% |
18.4% |
(3.2%) |
|
Minimum Statutory ratio |
14.5% |
14.5% |
0.0% |
|
Excess |
7.1% |
3.9% |
(3.2%) |
|
Liquidity Ratio |
39.0% |
52.1% |
13.1% |
|
Minimum Statutory ratio |
20.0% |
20.0% |
0.0% |
|
Excess |
19.0% |
32.1% |
13.1% |
Key Take-Outs:
- Decline in earnings - Core earnings per share (EPS) declined by 18.3% to Kshs 5.0, from Kshs 6.1 in H1’2022, driven by the 60.0% growth in total operating income to Kshs 50.6 bn, from Kshs 31.6 bn in H1’2022, which outpaced the 22.2% growth in total operating income to kshs 73.1 bn, from kshs 59.8 bn in H1’2022,
- Increased Provisioning – On the back of high credit risk occasioned by the deteriorated business environment, the bank increased its provisions holdings to cover for the anticipated losses in the future, with its provisions increasing by 15.7% to Kshs 75.3 bn from Kshs 65.1 bn recorded in H1’2022,
- Improved Lending – The Group’s loan book increased by 32.1% to kshs 964.8 bn, from kshs 730.3 bn in H1’2022, which outpaced the 30.1% growth in government securities to kshs 320.3 bn, from kshs 246.3 bn in H12022, highlighting the Group’s strategy to increase lending while at the same time managing its non performing loan book, and,
- Revenue Diversification – The Group’s Non-Funded income increased by 43.4% to Kshs 27.6 bn in H1’2023, from Kshs 19.2 bn in H1’2022, which resulted to a shift in revenue mix to 62:38 in H1’2023 from 68:32 in H1’2022. The increase was mainly attributable to a faster 43.4% increase in non-funded income to Kshs 27.6 bn, from Kshs 19.2 bn in H1’2022, compared to the 12.1% increase in Funded income to kshs 45.5 bn, from kshs 40.6 bn in H1’2022.
For a more detailed analysis, please see the KCB Group H1’2023 Earnings Note
- NCBA Group H1’2023 Financial Performance
During the week, NCBA Group released their H1’2023 financial results. Below is a summary of the performance.
|
Balance Sheet |
H1'2022 |
H1'2023 |
y/y change |
|
Net Loans and Advances |
250.5 |
292.4 |
16.7% |
|
Government Securities |
203.4 |
202.3 |
(0.5%) |
|
Total Assets |
604.3 |
660.3 |
9.3% |
|
Customer Deposits |
468.5 |
516.6 |
10.3% |
|
Deposits Per Branch |
4.5 |
6.0 |
33.4% |
|
Total Liabilities |
524.0 |
572.0 |
9.2% |
|
Shareholders' Funds |
80.2 |
88.3 |
10.1% |
|
Balance Sheet Ratios |
H1'2022 |
H1'2023 |
% points change |
|
Loan to Deposit Ratio |
53.5% |
56.6% |
3.1% |
|
Government Securities to Deposit ratio |
43.4% |
39.2% |
(4.2%) |
|
Return on average equity |
17.3% |
18.2% |
0.9% |
|
Return on average assets |
2.3% |
2.4% |
0.1% |
|
Income Statement |
H1'2022 |
H1'2023 |
y/y change |
|
Net Interest Income |
14.8 |
17.2 |
16.3% |
|
Net non-Interest Income |
14.2 |
13.8 |
(2.6%) |
|
Total Operating income |
29.0 |
31.0 |
7.0% |
|
Loan Loss provision |
5.6 |
4.4 |
(21.0%) |
|
Total Operating expenses |
17.1 |
18.7 |
9.3% |
|
Profit before tax |
11.2 |
12.4 |
10.5% |
|
Profit after tax |
7.8 |
9.3 |
20.3% |
|
Core EPS |
4.7 |
5.7 |
20.3% |
|
Dividend Per Share |
2.00 |
1.75 |
(12.5%) |
|
Dividend payout ratio |
42.4% |
30.8% |
(11.6%) |
|
Income Statement Ratios |
H1'2022 |
H1'2023 |
% points change |
|
Yield from interest-earning assets |
10.0% |
10.5% |
0.4% |
|
Cost of funding |
4.3% |
4.7% |
0.4% |
|
Net Interest Spread |
5.7% |
5.7% |
0.0% |
|
Net Interest Margin |
5.8% |
6.0% |
0.2% |
|
Capital Adequacy Ratios |
H1'2022 |
H1'2023 |
% points change |
|
Core Capital/Total Liabilities |
19.4% |
16.7% |
(2.7%) |
|
Minimum Statutory ratio |
8.0% |
8.0% |
|
|
Excess |
11.4% |
8.7% |
(2.6%) |
|
Core Capital/Total Risk Weighted Assets |
19.8% |
17.9% |
(1.9%) |
|
Minimum Statutory ratio |
10.5% |
10.5% |
|
|
Excess |
9.3% |
7.4% |
(1.9%) |
|
Total Capital/Total Risk Weighted Assets |
19.8% |
18.0% |
(1.8%) |
|
Minimum Statutory ratio |
14.5% |
14.5% |
|
|
Excess |
5.3% |
3.5% |
(1.8%) |
|
Liquidity Ratio |
64.3% |
54.7% |
(9.6%) |
|
Minimum Statutory ratio |
20.0% |
20.0% |
|
|
Excess |
44.3% |
34.7% |
(9.6%) |
Key Take-Outs:
- Strong earnings growth - Core earnings per share (EPS) grew by 20.3% to Kshs 5.7, from Kshs 4.7 in H1’2022, driven by the 7.0% growth in total operating income to Kshs 31.0 bn, from Kshs 29.0 bn in H1’2022.
- Improved asset quality – The bank’s gross NPL ratio decreased to 13.4% in H1’2023 from 13.6% in H1’2022, attributable to the 15.9% increase in gross loans to Kshs 317.0 bn, from Kshs 273.6 bn recorded in H1’2022, which outpaced the 14.6% increase in Gross non-performing loans to Kshs 42.6 bn, from Kshs 37.2 bn in H1’2022.
- For a more detailed analysis, please see the NCBA Group H1’2023 Earnings Note
- I&M Holdings H1’2023 Financial Performance
During the week, I&M Holdings released their H1’2023 financial results. Below is a summary of the performance.
|
Balance Sheet Items |
H1'2022 |
H1'2023 |
y/y change |
|
Government Securities |
82.1 |
75.9 |
(7.6%) |
|
Net Loans and Advances |
231.1 |
269.7 |
16.7% |
|
Total Assets |
439.7 |
503.5 |
14.5% |
|
Customer Deposits |
313.2 |
356.8 |
13.9% |
|
Deposits per branch |
3.5 |
4.3 |
22.1% |
|
Total Liabilities |
368.2 |
419.4 |
13.9% |
|
Shareholders’ Funds |
66.5 |
78.2 |
17.5% |
|
Balance Sheet Ratios |
H1'2022 |
H1'2023 |
% y/y change |
|
Loan to Deposit Ratio |
73.8% |
75.6% |
1.8% |
|
Government Securities to Deposit ratio |
26.2% |
21.3% |
(4.9%) |
|
Return on average equity |
13.3% |
15.0% |
1.8% |
|
Return on average assets |
2.1% |
2.5% |
0.4% |
|
Income Statement |
H1'2022 |
H1'2023 |
y/y change |
|
Net Interest Income |
10.5 |
12.2 |
16.1% |
|
Net non-Interest Income |
5.1 |
6.9 |
36.7% |
|
Total Operating income |
15.6 |
19.1 |
22.8% |
|
Loan Loss provision |
(1.3) |
(3.2) |
144.5% |
|
Total Operating expenses |
(8.6) |
(12.5) |
45.9% |
|
Profit before tax |
7.19 |
7.04 |
(2.1%) |
|
Profit after tax |
4.93 |
5.03 |
2.2% |
|
Core EPS |
2.98 |
3.04 |
2.2% |
|
Income Statement Ratios |
H1'2022 |
H1'2023 |
y/y change |
|
Yield from interest-earning assets |
10.2% |
10.4% |
0.2% |
|
Cost of funding |
4.1% |
4.3% |
0.2% |
|
Net Interest Margin |
6.4% |
6.2% |
(0.2%) |
|
Net Interest Income as % of operating income |
67.5% |
63.9% |
(3.6%) |
|
Non-Funded Income as a % of operating income |
32.5% |
36.1% |
3.6% |
|
Cost to Income Ratio |
55.2% |
65.6% |
10.4% |
|
CIR without LLP |
46.8% |
48.8% |
2.0% |
|
Cost to Assets |
1.7% |
1.9% |
0.2% |
|
Capital Adequacy Ratios |
H1'2022 |
H1'2023 |
% points change |
|
Core Capital/Total Liabilities |
19.9% |
18.8% |
(1.1%) |
|
Minimum Statutory ratio |
8.0% |
8.0% |
0.0% |
|
Excess |
11.9% |
10.8% |
(1.1%) |
|
Core Capital/Total Risk Weighted Assets |
15.0% |
14.0% |
(1.1%) |
|
Minimum Statutory ratio |
10.5% |
10.5% |
0.0% |
|
Excess |
4.5% |
3.5% |
(1.1%) |
|
Total Capital/Total Risk Weighted Assets |
19.8% |
18.8% |
(1.0%) |
|
Minimum Statutory ratio |
14.5% |
14.5% |
0.0% |
|
Excess |
5.3% |
4.3% |
(1.0%) |
|
Liquidity Ratio |
48.8% |
46.7% |
(2.1%) |
|
Minimum Statutory ratio |
20.0% |
20.0% |
0.0% |
|
Excess |
28.8% |
26.7% |
(2.1%) |
Key Take-Outs:
- Strong earnings growth - Core earnings per share (EPS) grew by 2.2% to Kshs 3.04, from Kshs 2.98 in H1’2022, driven by 22.8% increase in total operating income to Kshs 19.1 bn in H1’2023 from Kshs 15.6 bn in H1’2022. The performance was however weighed down by the 45.9% increase in total operating exopenses to kshs 12.5 bn, from kshs 8.6 bn in H1’2022.
- Increased Provisioning – The group’s provisioning increased by 3.9% to Kshs 14.3 bn in H1’2023, from Kshs 13.8 bn in H1’2022 aimed at mitigating increased credit risk on the back of the deteriorated business environment. This is evidenced by the the 57.5% growth in Gross Non-Performing Loans (NPLs) to Kshs 36.7 bn in H1’2023, from Kshs 23.3 bn recorded in H1’2022,
- Revenue Diversification – The Group’s Non-Funded income increased by 36.7% to Kshs 6.9 bn in H1’2023, from Kshs 5.1 bn in H1’2022, which resulted to a shift in revenue mix to 64:36 in H1’2023 from 68:32 in H1’2022. The increase was mainly attributable to a faster 36.7% increase in non-funded income to Kshs 6.9 bn, from Kshs 5.1 bn in H1’2022, compared to the 16.1% increase in Funded income to kshs 12.2 bn, from kshs 10.5 bn in H1’2022.
For a more detailed analysis, please see the I&M Holdings H1’2023 Earnings Note
- Standard Chartered Bank H1’2023 Financial Performance
During the week, Standard Chartered Bank released their H1’2023 financial results. Below is a summary of the performance.
|
Balance Sheet Items |
H1'2022 |
H1'2023 |
y/y change |
|
Net loans |
128.5 |
145.4 |
13.2% |
|
Government Securities |
103.6 |
70.7 |
(31.7%) |
|
Total Assets |
364.3 |
361.7 |
(0.7%) |
|
Customer Deposits |
286.9 |
283.7 |
(1.1%) |
|
Deposits per Branch |
8.0 |
8.9 |
11.2% |
|
Total Liabilities |
307.9 |
304.5 |
(1.1%) |
|
Shareholder's Funds |
56.4 |
57.1 |
1.2% |
|
Balance Sheet Ratios |
H1'2022 |
H1'2023 |
% y/y change |
|
Loan to Deposit Ratio |
44.8% |
51.3% |
6.5% |
|
Government Securities to Deposit ratio |
36.1% |
24.9% |
(11.2%) |
|
Return on average equity |
17.7% |
23.9% |
6.2% |
|
Return on average assets |
2.7% |
3.7% |
1.0% |
|
Income Statement |
H1'2022 |
H1'2023 |
y/y change |
|
Net Interest Income |
10.0 |
13.9 |
38.3% |
|
Net non-Interest Income |
5.5 |
7.0 |
26.8% |
|
Total Operating income |
15.6 |
20.9 |
34.2% |
|
Loan Loss provision |
0.1 |
2.0 |
1781.5% |
|
Total Operating expenses |
8.0 |
11.2 |
40.7% |
|
Profit before tax |
7.6 |
9.6 |
27.4% |
|
Profit after tax |
5.4 |
6.9 |
27.7% |
|
Core EPS |
14.3 |
18.3 |
27.7% |
|
Income Statement Ratios |
H1'2022 |
H1'2023 |
y/y change |
|
Yield from interest-earning assets |
7.3% |
9.1% |
1.8% |
|
Cost of funding |
1.08% |
1.14% |
0.06% |
|
Net Interest Spread |
6.3% |
7.9% |
1.6% |
|
Net Interest Margin |
6.4% |
8.0% |
1.6% |
|
Cost of Risk |
0.7% |
9.7% |
9.0% |
|
Net Interest Income as % of operating income |
64.4% |
66.3% |
1.9% |
|
Non-Funded Income as a % of operating income |
35.6% |
33.7% |
(1.9)% |
|
Cost to Income Ratio |
51.3% |
53.8% |
2.5% |
|
Cost to Income Ratio without LLP |
50.6% |
44.1% |
(6.5%) |
|
Cost to Assets |
2.2% |
2.5% |
0.3% |
|
Capital Adequacy Ratios |
H1'2022 |
H1'2023 |
% points change |
|
Core Capital/Total Liabilities |
14.6% |
17.0% |
2.5% |
|
Minimum Statutory ratio |
8.0% |
8.0% |
0.0% |
|
Excess |
6.6% |
9.0% |
2.5% |
|
Core Capital/Total Risk Weighted Assets |
15.4% |
16.9% |
1.4% |
|
Minimum Statutory ratio |
10.5% |
10.5% |
0.0% |
|
Excess |
4.9% |
6.4% |
1.4% |
|
Total Capital/Total Risk Weighted Assets |
17.7% |
17.3% |
(0.5%) |
|
Minimum Statutory ratio |
14.5% |
14.5% |
0.0% |
|
Excess |
3.2% |
2.8% |
(0.5%) |
|
Liquidity Ratio |
73.6% |
73.8% |
0.1% |
|
Minimum Statutory ratio |
20.0% |
20.0% |
0.0% |
|
Excess |
53.6% |
53.8% |
0.1% |
Key Take-Outs:
- Strong earnings growth - Core earnings per share (EPS) grew by 27.7% to Kshs 18.3, from Kshs 14.3 in H1’2022, driven by the 34.2% growth in total operating income to Kshs 20.9 bn, from Kshs 15.6 bn in H1’2022. The performance was however weighed down by the 40.7% increase in the total operating expenses to Kshs 11.2 bn in H1’2023, from Kshs 8.0 bn in H1’2022,
- Improvement in Asset Quality - The group’s asset quality improved significantly, with the NPL ratio improving to 14.4% in H1’2023, from 15.4% recorded in H1’2022. The improvement in asset quality was attributable to the 12.2% growth in gross loans, which outpaced the 4.6% increase in gross non-performing loans to kshs 23.8 bn, from kshs 22.7 bn in H1’2022.
- Increased Provisioning - H1’2023 was characterized by increased provisioning, attributable to the high credit risks brought about by the deteriorated business environment. As such, Standard Chartered Bank Kenya increased its loan loss provisions to kshs 2.0 bn in H1’2023, up from Kshs 0.1 bn provisioning recorded in H1’2022. Additionally, General Provisions (LLP) increased by 6.4% to Kshs 10.5 bn, from Kshs 9.9 bn recorded in H1’2022.
For a more detailed analysis, please see the Standard Chartered Bank H1’2023 Earnings Note.
- Diamond Trust Bank H1’2023 Financial Performance
During the week, Diamond Trust Bank released their H1’2023 financial results. Below is a summary of the results.
|
Balance Sheet Items |
H1'2022 |
H1'2023 |
y/y change |
|
Government Securities |
130.6 |
136.1 |
4.2% |
|
Net Loans and Advances |
233.6 |
281.2 |
20.4% |
|
Total Assets |
485.0 |
579.2 |
19.4% |
|
Customer Deposits |
346.5 |
418.0 |
20.6% |
|
Deposit Per Branch |
2.7 |
3.2 |
19.7% |
|
Total Liabilities |
408.4 |
496.6 |
21.6% |
|
Shareholders Funds |
68.9 |
72.4 |
5.2% |
|
Balance Sheet Ratios |
H1'2022 |
H1'2023 |
y/y change |
|
Loan to Deposit Ratio |
67.4% |
67.3% |
(0.2%) |
|
Government Securities to Deposit ratio |
37.7% |
32.6% |
(5.1%) |
|
Return on average equity |
7.8% |
10.2% |
2.4% |
|
Return on average assets |
1.1% |
1.4% |
0.3% |
|
Income Statement |
H1'2022 |
H1'2023 |
y/y change |
|
Net Interest Income |
11.1 |
13.1 |
17.8% |
|
Non-Interest Income |
3.9 |
5.5 |
42.2% |
|
Total Operating income |
15.0 |
18.7 |
24.1% |
|
Loan Loss provision |
2.4 |
3.3 |
34.0% |
|
Total Operating expenses |
9.4 |
12.7 |
35.6% |
|
Profit before tax |
5.6 |
6.0 |
7.3% |
|
Profit after tax |
3.9 |
4.4 |
10.5% |
|
Core EPS |
14.1 |
15.6 |
10.5% |
|
Income Statement Ratios |
H1'2022 |
H1'2023 |
% point change |
|
Yield from interest-earning assets |
8.8% |
9.9% |
1.1% |
|
Cost of funding |
2.1% |
2.7% |
0.6% |
|
Net Interest Spread |
6.8% |
7.2% |
0.4% |
|
Net Interest Income as % of operating income |
74.0% |
70.3% |
(3.7%) |
|
Non-Funded Income as a % of operating income |
26.0% |
29.7% |
3.7% |
|
Cost to Income |
62.3% |
68.1% |
5.8% |
|
CIR without provisions |
46.2% |
50.6% |
4.4% |
|
Cost to Assets |
4.6% |
4.8% |
0.2% |
|
Net Interest Margin |
5.2% |
5.3% |
0.1% |
|
Capital Adequacy Ratios |
H1'2022 |
H1'2023 |
% points change |
|
Core Capital/Total deposit Liabilities |
21.7% |
21.6% |
(0.1%) |
|
Minimum Statutory ratio |
8.0% |
8.0% |
|
|
Excess |
13.7% |
13.6% |
(0.1%) |
|
Core Capital/Total Risk Weighted Assets |
20.0% |
18.5% |
(1.5%) |
|
Minimum Statutory ratio |
10.5% |
10.5% |
|
|
Excess |
9.5% |
8.0% |
(1.5%) |
|
Total Capital/Total Risk Weighted Assets |
21.2% |
19.3% |
(1.9%) |
|
Minimum Statutory ratio |
14.5% |
14.5% |
|
|
Excess |
6.7% |
4.8% |
(1.9%) |
|
Liquidity Ratio |
58.9% |
52.2% |
(6.7%) |
|
Minimum Statutory ratio |
20.0% |
20.0% |
|
|
Excess |
38.9% |
32.2% |
(6.7%) |
Key Take-Outs:
- Earnings growth - Core earnings per share (EPS) grew by 10.5% to Kshs 15.6, from Kshs 14.1 in H1’2022, driven by the 24.1% growth in total operating income to Kshs 18.7 bn, from Kshs 15.0 bn in H1’2022.
- Asset quality growth- The bank’s asset quality improved as evidenced by the NPL ratio decreasing to 12.3% in H1’2023 from 12.8% in H1’2022, attributable to 15.0% increase in Gross non-performing loans to Kshs 36.5 bn, from Kshs 31.8 bn in H1’2022, compared to the higher 20.4% increase in gross loans to Kshs 298.1 bn, from Kshs 247.7 bn recorded in H1’2022
For a more detailed analysis, please see the DTB bank H1’2023 Earnings Note.
Asset Quality:
|
Cytonn Report: Listed Bank Asset Quality |
||||||
|
|
H1'2023 NPL Ratio* |
H1'2022 NPL Ratio** |
% point change in NPL Ratio |
H1'2023 NPL Coverage* |
H1'2022 NPL Coverage** |
% point change in NPL Coverage |
|
Stanbic Bank |
8.1% |
9.4% |
(1.3%) |
57.4% |
56.0% |
1.4% |
|
Equity Group |
11.2% |
8.8% |
2.4% |
54.5% |
64.1% |
(9.6%) |
|
Diamond Trust Bank |
12.3% |
12.8% |
(0.5%) |
46.4% |
44.2% |
2.2% |
|
I&M Holdings |
12.7% |
9.3% |
3.4% |
49.8% |
77.5% |
(27.7%) |
|
NCBA Group |
13.4% |
13.6% |
(0.2%) |
57.8% |
62.0% |
(4.2%) |
|
Standard Chartered Bank |
14.4% |
15.4% |
(1.0%) |
84.8% |
83.9% |
0.9% |
|
Co-operative Bank |
14.6% |
14.1% |
0.5% |
60.7% |
65.8% |
(5.1%) |
|
KCB |
17.2% |
21.4% |
(4.2%) |
51.1% |
45.8% |
5.3% |
|
Mkt Weighted Average |
13.1% |
13.0% |
0.1% |
58.6% |
62.3% |
(3.7%) |
|
*Market cap weighted as at 25/08/2023 **Market cap weighted as at 09/09/2022 |
||||||
Key take-outs from the table include:
- Asset quality for the listed banks that have released deteriorated during the H1’2023, with market weighted average NPL increasing by 0.1% points to 13.1% from a 13.0% in H1’2022. The deterioration in asset quality was mainly driven by a deterioration in I&M holdings, Equity group and Co-operative bank asset quality with their NPL ratio increasing by 3.4% points, 2.4% points and 0.5% to 12.7%, 11.2% and 14.6%, respectively in H1’2022,
- I&M Holdings had the highest NPL ratio jump by 3.4% points to 12.7% from 9.3% points in H1’2022, attributable to 57.5% increase in Gross non-performing loans to Kshs 36.6 bn in H1’2023 from Kshs 23.3 bn in H1’2022, which outpaced the 15.6% increase in gross loans to Kshs 288.0 bn from Kshs 249.1 bn recorded in H1’2022,
- Market weighted average NPL Coverage for the listed banks that have released decreased by 3.7% points to 58.6% in H1’2023, from 62.3% recorded in H1’2022, majorly on the back of decreased NPL coverage recorded by I&M Holdings, Equity Group and Co-operative Bank of Kenya by 27.7%, 9.6% and 5.1% respectively in H1’2022. However, KCB Group, Diamond Trust Bank and Stanbic bank NPL coverage increased by 5.3% points, 2.2% points and 1.4% points to 51.1%, 46.4% and 57.4% respectively in H1’2023.
Summary Performance
The table below shows performance of listed banks using several metrics:
|
Cytonn Report: Listed Banks Performance in H1’2023 |
|||||||||||||
|
Bank |
Core EPS Growth |
Interest Income Growth |
Interest Expense Growth |
Net Interest Income Growth |
Net Interest Margin |
Non-Funded Income Growth |
NFI to Total Operating Income |
Growth in Total Fees & Commissions |
Deposit Growth |
Growth in Government Securities |
Loan to Deposit Ratio |
Loan Growth |
Return on Average Equity |
|
Stanbic Bank |
47.0% |
46.3% |
51.5% |
44.4% |
7.1% |
29.7% |
42.5% |
22.5% |
10.5% |
10.1% |
98.6% |
15.3% |
18.5% |
|
SCB-K |
27.7% |
33.4% |
0.9% |
38.3% |
8.0% |
26.8% |
33.7% |
11.7% |
(1.1%) |
(31.7%) |
51.3% |
13.2% |
23.9% |
|
NCBA Group |
20.3% |
21.7% |
29.7% |
16.3% |
6.0% |
(2.6%) |
44.5% |
10.0% |
10.3% |
(0.5%) |
56.6% |
16.7% |
18.2% |
|
DTB |
10.6% |
32.4% |
53.7% |
17.8% |
5.3% |
42.2% |
29.7% |
36.7% |
20.6% |
4.2% |
67.3% |
20.4% |
10.2% |
|
Equity Group |
7.8% |
27.0% |
54.3% |
16.5% |
7.2% |
41.2% |
44.0% |
38.3% |
21.0% |
17.6% |
69.5% |
25.6% |
29.1% |
|
Co-op Bank |
5.9% |
12.0% |
38.9% |
2.3% |
8.2% |
4.0% |
39.1% |
8.4% |
22.7% |
2.9% |
78.8% |
10.7% |
22.2% |
|
I&M Holdings |
2.2% |
22.1% |
31.2% |
16.1% |
6.2% |
36.7% |
36.1% |
12.1% |
13.9% |
(7.6%) |
75.6% |
16.7% |
15.0% |
|
KCB |
(18.3%) |
28.6% |
76.6% |
12.1% |
6.7% |
43.4% |
37.7% |
56.1% |
61.9% |
30.1% |
65.6% |
32.1% |
19.1% |
|
H1'23 Mkt Weighted Average* |
10.9% |
27.2% |
44.7% |
19.4% |
7.1% |
28.6% |
40.3% |
27.7% |
22.1% |
7.0% |
69.1% |
20.6% |
22.4% |
|
H1'22 Mkt Weighted Average** |
34.0% |
18.0% |
18.6% |
17.7% |
7.3% |
24.4% |
37.1% |
17.9% |
11.3% |
11.6% |
72.7% |
17.7% |
21.9% |
|
*Market cap weighted as at 25/08/2023 **Market cap weighted as at 09/09/2022 |
|||||||||||||
Key take-outs from the table include:
- The listed banks that have released there H1’2023 earnings recorded a 10.5% growth in core Earnings per Share (EPS) in H1’2023, compared to the weighted average growth of 34.0% in H1’2022, an indication of sustained performance despite the tough operating environment experienced in H1’2023,
- Non-Funded Income grew by 28.6% compared to market weighted average growth of 24.4% in H1’2022, an indication of increased revenue diversification efforts by the banks, and,
- The Banks recorded a deposit growth of 22.1%, higher than the market weighted average deposit growth of 11.3% in H1’2022,
Universe of coverage:
|
Company |
Price as at 18/08/2024 |
Price as at 25/08/2023 |
w/w change |
YTD Change |
Target Price* |
Dividend Yield |
Upside/ Downside** |
P/TBv Multiple |
Recommendation |
|
KCB Group*** |
27.5 |
23.8 |
(13.5%) |
(37.9%) |
41.3 |
8.4% |
81.8% |
0.4x |
Buy |
|
Jubilee Holdings |
170.0 |
172.3 |
1.3% |
(13.3%) |
260.7 |
7.0% |
58.3% |
0.3x |
Buy |
|
Liberty Holdings |
3.9 |
3.8 |
(1.0%) |
(24.2%) |
5.9 |
0.0% |
55.0% |
0.3x |
Buy |
|
Kenya Reinsurance |
1.8 |
1.8 |
1.1% |
(2.1%) |
2.5 |
10.9% |
48.1% |
0.1x |
Buy |
|
ABSA Bank*** |
11.9 |
11.1 |
(6.7%) |
(9.0%) |
14.7 |
12.2% |
44.3% |
0.9x |
Buy |
|
Co-op Bank*** |
11.5 |
11.4 |
(0.4%) |
(5.8%) |
15.0 |
13.2% |
44.3% |
0.5x |
Buy |
|
Equity Group*** |
40.6 |
39.5 |
(2.7%) |
(12.3%) |
51.2 |
10.1% |
39.7% |
0.9x |
Buy |
|
NCBA*** |
38.7 |
38.3 |
(1.0%) |
(1.7%) |
48.9 |
11.1% |
38.6% |
0.8x |
Buy |
|
Sanlam |
8.0 |
7.8 |
(2.5%) |
(18.6%) |
10.3 |
0.0% |
31.9% |
2.2x |
Buy |
|
Standard Chartered*** |
150.3 |
159.3 |
6.0% |
9.8% |
183.9 |
13.8% |
29.3% |
1.1x |
Buy |
|
CIC Group |
2.0 |
2.1 |
4.0% |
8.4% |
2.5 |
6.3% |
27.1% |
0.7x |
Buy |
|
Diamond Trust Bank*** |
47.1 |
48.2 |
2.3% |
(3.4%) |
54.6 |
10.4% |
23.7% |
0.2x |
Buy |
|
Stanbic Holdings |
117.0 |
114.0 |
(2.6%) |
11.8% |
127.9 |
11.1% |
23.2% |
0.8x |
Buy |
|
Britam |
5.0 |
5.0 |
0.8% |
(3.8%) |
6.0 |
0.0% |
19.4% |
0.7x |
Accumulate |
|
I&M Group*** |
18.5 |
18.2 |
(1.4%) |
6.7% |
19.5 |
12.4% |
19.3% |
0.4x |
Accumulate |
|
HF Group |
5.0 |
5.0 |
(0.4%) |
58.1% |
5.8 |
0.0% |
16.7% |
0.2x |
Accumulate |
We are “Neutral” on the Equities markets in the short term due to the current tough operating environment and huge foreign investor outflows, and, “Bullish” in the long term due to current cheap valuations and expected global and local economic recovery.
With the market currently being undervalued to its future growth (PEG Ratio at 0.6x), we believe that investors should reposition towards value stocks with strong earnings growth and that are trading at discounts to their intrinsic value. We expect the current high foreign investors sell-offs to continue weighing down the equities outlook in the short term.
- Industry Report
During the week, property firm Knight Frank released its Kenya Market Update H1’2023 Report highlighting that high-end Real Estate properties remained resilient despite economic shocks attributed to prime rental rates and occupancies surpassing market averages. The following were the key-take outs from the report;
- The average prices of prime residential units in Nairobi increased by 4.7% in H1’2023 from H1’2022, whereas average asking rents also registered a 6.2% y/y increase. The increases were attributed to the sustained depreciation of the Kenyan Shilling, and, a marginal increase in demand for residential units during the period,
- In the commercial office sector, monthly rents for Grade A offices remained unchanged from FY’2022 at Kshs 174.0 (USD 1.2) per SQFT, with a majority of landlords leaning towards dollar denominated rentals. This was mainly attributed to the continuous devaluation of the Kenyan Shilling in relation to the dollar, and need to align revenues and cost currencies as majority of commercial debts are dollar denominated. However, average occupancy levels decreased significantly by 3.9% in H1’2023 to 71.5% from 75.4% attributable to a surge in Grade A offices, coupled with non-renewal of leases. Notable commercial office developments completed during the period include; i) Principal Place, ii) The Rock, iii) The Cube, and, iv) The Piano among others. Notably, developments in the pipeline during the period under review reduced compared to previous periods. Major developments expected to be delivered in 2023 include; i) CCI Headquarters in Tatu City, and, ii) Olympic Plaza in Upperhill delivering approximately 323,168 SQFT,
- The average asking rents for prime industrial properties came in at Kshs 70 per SQFT per month in H1’2023, similar to FY’2022. The performance was supported by i) mergers and acquisition strategies of key sector players such as Brown Investments Plc, Toyota Tsusho Corporation, DT Dobie and CFAO Motors, ii) construction and expansion strategies by major manufacturing firms including Taifa Gas and KenGen, iii) increased demand for high quality modern warehousing facilities and, iv) government’s amplified emphasis on fostering industrial growth through initiatives such as Export Processing Zones (EPZs) and Special Economic Zones (SEZs), and,
- Data and health centers are gaining traction as a new asset class of choice with firms such as Mauritanian based Grit Real Estate announcing commitment plans to construct a state-of-the-art data center and Kshs 14.0 bn health care equipment production plant at Tatu City, which is to be completed in 2024. Additionally, according to the report, Affordable Housing and Purpose-Built Student Accommodation (PBSA) segment dominated by Acorn Holding’s Qwetu and Qejani residences present alternative areas of investments in the Kenyan property market. This in line with increased activities aimed to facilitate the provision of affordable housing and a growing student population respectively.
We expect Kenya’s property market to continue registering increased development activities propelled by; i) rapid growth in the construction industry driven by increased demand for modern warehousing facilities, ii) government’s continued focus on the implementation of the affordable housing agenda, iii) increased activities in alternative Real Estate market segments such as student accommodation, data and health centers, and iv) increased demand for Real Estate facilitated by rising population. However, rising construction costs underpinned by the continued depreciation of the Kenyan Shilling against leading currencies, which consequently led to an increased import bill of construction materials, and, oversupply of space in select Real Estate sectors are expected to continue weighing down optimum performance of the sector.
- Retail Sector
During the week, chain store Naivas Supermarket opened its 98th outlet located at Shell petrol station, along Waiyaki Way, Nairobi. The retailer’s decision to open up the store forms part of its expansion strategy dubbed ‘Road To 100’, and was driven by;
- Naivas’ ambition to enhance shopping accessibility for its shoppers by offering convenience, thus catering to evolving consumer inclinations,
- Naivas’ ongoing aggressive drive to broaden its presence and boost its market share in a bid to stamp market dominance against rival retailers such as Quickmart, and Carrefour, and,
- The strategic location at Shell petrol station along Waiyaki Way aiming to capitalize on booth foot and vehicular traffic into the petrol station.
The table below shows the number of stores currently operated by key local and international retail supermarket chains in Kenya;
|
Cytonn Report: Main Local and International Retail Supermarket Chains |
|||||||||
|
Name of retailer |
Category |
Branches as at FY’2018 |
Branches as at FY’2019 |
Branches as at FY’2020 |
Branches as at FY’2021 |
Branches as at FY’2022 |
Branches opened in 2023 |
Closed branches |
Current branches |
|
Naivas |
International* |
46 |
61 |
69 |
79 |
91 |
7 |
0 |
98 |
|
Quick Mart |
Hybrid** |
10 |
29 |
37 |
48 |
55 |
4 |
0 |
59 |
|
Chandarana |
Local |
14 |
19 |
20 |
23 |
26 |
0 |
0 |
26 |
|
Carrefour |
International |
6 |
7 |
9 |
16 |
19 |
1 |
0 |
20 |
|
Cleanshelf |
Local |
9 |
10 |
11 |
12 |
12 |
1 |
0 |
13 |
|
Tuskys |
Local |
53 |
64 |
64 |
6 |
6 |
0 |
59 |
5 |
|
Game Stores |
International |
2 |
2 |
3 |
3 |
0 |
0 |
3 |
0 |
|
Uchumi |
Local |
37 |
37 |
37 |
2 |
2 |
0 |
35 |
2 |
|
Choppies |
International |
13 |
15 |
15 |
0 |
0 |
0 |
15 |
0 |
|
Shoprite |
International |
2 |
4 |
4 |
0 |
0 |
0 |
4 |
0 |
|
Nakumatt |
Local |
65 |
65 |
65 |
0 |
0 |
0 |
65 |
0 |
|
Total |
|
257 |
313 |
334 |
189 |
211 |
13 |
181 |
223 |
|
*51% owned by IBL Group (Mauritius), Proparco (France), and DEG (Germany), while 49% owned by Gakiwawa Family (Kenya) |
|||||||||
|
**More than 50% owned by Adenia Partners (Mauritius), while Less than 50% owned by Kinuthia Family (Kenya) |
|||||||||
Source: Cytonn Research
We expect to continue witnessing increased activities in the Kenyan retail sector driven by; i) the ongoing expansionary efforts by both local and international retailers, ii) increasing capital investments by foreign entities in the Kenyan retail market, and, iii) government’s continued focus to deliver on infrastructural developments opening up new areas of investments and opportunities for retail investments. However, the existing oversupply currently estimated at 3.3 mn SQFT in the Nairobi Metropolitan Area (NMA) and 2.1 mn SQFT in the larger Kenyan retail sector (excluding NMA) is expected to continue subduing the optimal performance of the sector. Furthermore, we anticipate the sector's optimal performance will be further impacted by the tough economic conditions exacerbated by rising inflation, which will in turn diminish consumers' purchasing power.
- Regulated Real Estate Funds
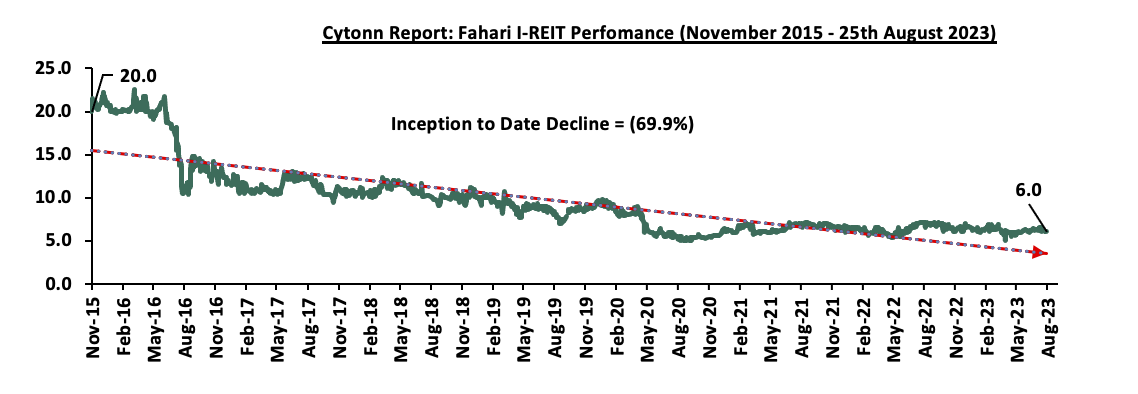
In the Nairobi Securities Exchange, ILAM Fahari I-REIT closed the week trading at an average price of Kshs 6.0 per share. The performance represented a 1.0% decline from Kshs 6.1 per share recorded the previous week, taking it to a 11.2% Year-to-Date (YTD) decline from Kshs 6.8 per share recorded on 3 January 2023. In addition, the performance represented a 69.9% Inception-to-Date (ITD) loss from the Kshs 20.0 price. The dividend yield currently stands at 10.8%. The graph below shows Fahari I-REIT’s performance from November 2015 to 25 August 2023;
In the Unquoted Securities Platform, Acorn D-REIT and I-REIT traded at Kshs 23.9 and Kshs 21.6 per unit, respectively, as at 25 August 2023. The performance represented a 19.4% and 8.0% gain for the D-REIT and I-REIT, respectively, from the Kshs 20.0 inception price. The volumes traded for the D-REIT and I-REIT came in at 12.3 mn and 30.4 mn shares, respectively, with a turnover of Kshs 257.5 mn and Kshs 624.6 mn, respectively, since inception in February 2021.
REITs provide various benefits like tax exemptions, diversified portfolios, and stable long-term profits. However, factors such as; i) inadequate comprehension of the investment instrument among investors, ii) prolonged approval processes for REITs creation, iii) high minimum capital requirements of Kshs 100.0 mn for trustees, and, iv) minimum investment amounts set at Kshs 5.0 mn, continue to limit the performance of the Kenyan REITs market.
- Cytonn High Yield Fund (CHYF)
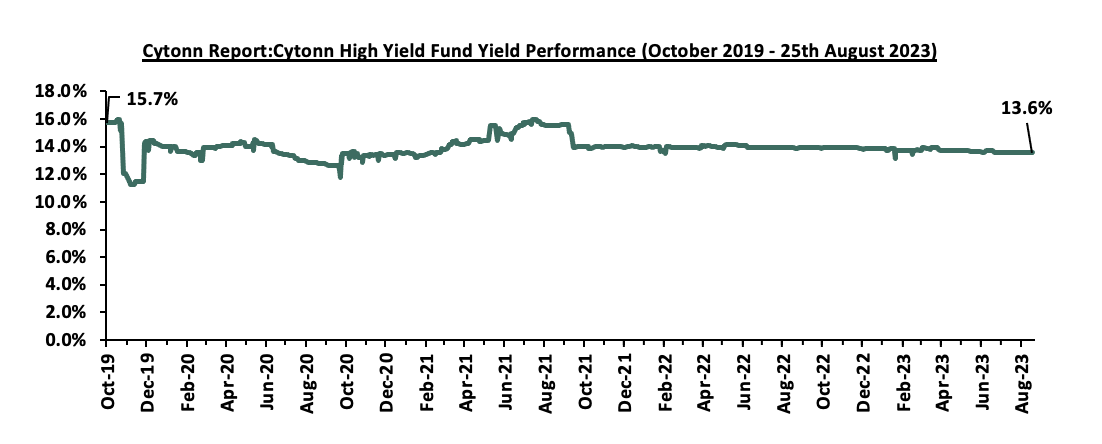
Cytonn High Yield Fund (CHYF) closed the week with an annualized yield of 13.6%, remaining relatively unchanged from the previous week. The performance also represented a 0.3% points Year-to-Date (YTD) decline from 13.9% yield recorded on 1 January 2023, and 2.1% points Inception-to-Date (ITD) decline from the 15.7% yield. The graph below shows Cytonn High Yield Fund’s performance from October 2019 to 25 August 2023;
Notably, the CHYF has outperformed other regulated Real Estate funds with an annualized yield of 13.6%, as compared to Fahari I-REIT, and Acorn I-REIT with yields of 10.8% and 2.8% respectively. As such, the higher yields offered by CHYF makes the fund one of the best alternative investment resource in the Real Estate sector. The graph below shows the yield performance of the Regulated Real Estate Funds:
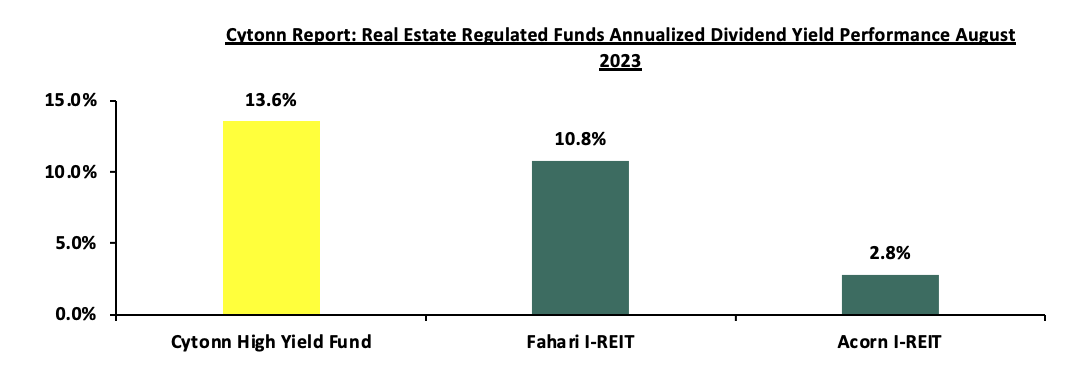
Source: Cytonn Research
We expect the performance of Kenya’s Real Estate sector to remain on an upward trajectory, supported by factors such as; i) growing demand for high quality modern warehousing facilities, ii) positive demographic trends facilitating increased housing demand, iii) continued focus by the government and private sector to provide affordable housing, iv) infrastructure developments opening up areas for investments, iv) rapid expansion of retail investors, and, v) increased foreign capital investments into the Kenyan retail industry. However, the oversupply of physical space in select sectors, including commercial office and retail sectors leading to slower uptake of new spaces, rising construction costs stemming from inflationary pressures, and limited investor knowledge and interest in REITs, which is expected to impede the sector's optimal performance.
Due to the state of the market and the unique characteristics of individual firms, all investments carry a certain amount of risk. Investment risk tends to rise during periods of high uncertainty and fall during periods of low uncertainty. The current state of the Kenyan economy is characterized by heightened inflationary pressures, sustained currency depreciation, and growing anxiety over the public debt of the government. In order to ensure that investment returns are closely matched to risk expectations, this week we turn our attention to investment risk, where we analyse the various ways investment risk can be managed.
We shall cover the topic as follows:
- Introduction
- Types of Investments Risk
- Risk Management
- Investments Products in Kenya Market
- Conclusion
Section 1: Introduction
Investment risk analysis refers to the systematic process of evaluating the potential risks associated with various investment opportunities. It involves assessing the likelihood of different outcomes and potential losses to make well-informed investment decisions. Understanding and analyzing investment risks is crucial for investors seeking to achieve their financial goals while managing uncertainties. Effective risk analysis provides insights into potential pitfalls, enabling investors to make proactive adjustments to their portfolios. The primary objectives of investment risk analysis include;
- Minimizing the possibility of significant financial losses
- Optimizing the risk-return trade-off
- Aligning investment strategies with an individual's risk tolerance, and
- Enhancing the overall decision-making process.
Investing involves a delicate balance between potential returns and associated risks. Successful investors understand that a comprehensive risk analysis is essential for making informed investment decisions. By examining a range of factors that can impact the performance of investments, individuals and institutions can strategize to maximize returns while safeguarding against unnecessary losses. Some of the factors to consider before making an investment include;
- Level of risk – Risk refers to the uncertainty that your investment's actual performance might deviate from your expectations. As such, different asset classes, such as stocks, bonds, real estate, and commodities, carry distinct risk profiles. The equities asset class, for instance, tends to have higher volatility compared to fixed income asset class.
- Expected return - Expected return is a critical metric in investment analysis that quantifies the potential gains an investor could earn from an investment over a specific period. It serves as a guide to estimate the average outcome, accounting for both positive and negative scenarios. By understanding the expected return, investors can make more informed decisions that align with their financial goals and risk tolerance.
- Liquidity - Liquidity refers to the ease with which an investment can be quickly converted into cash without significantly affecting its market price. Liquidity is a crucial consideration for investors, as it impacts your ability to access funds, respond to changing market conditions, and manage unexpected financial needs.
- Investment horizon - Investment horizon refers to the length of time an investor plans to hold an investment before needing to access the funds or achieve a specific financial goal. It is a fundamental consideration that influences the choice of investment vehicles, risk tolerance, and overall investment strategy. Understanding your investment horizon is essential for aligning your investments with your financial objectives
It is important to note that investing in any country involves risks, and the situation can change due to various factors including the expected economic growth both globally and locally, level of inflation, currency prospects, political developments and social stability.
Section 2: Types of Investment Risks
We will focus on the broad categories of investment risks, a) Systematic and, b) Unsystematic risks depending on their stemming sources.
- Systematic Risks - These are market related risk which an investor cannot mitigate through diversification of the portfolio. Systematic risks are mainly caused by factors that are external to an individual or organization and are inter-related to macro-economic indicators such as inflation, Gross Domestic Product (GDP), exchange rate variability and interest rates. The various types of systematic risks include:
-
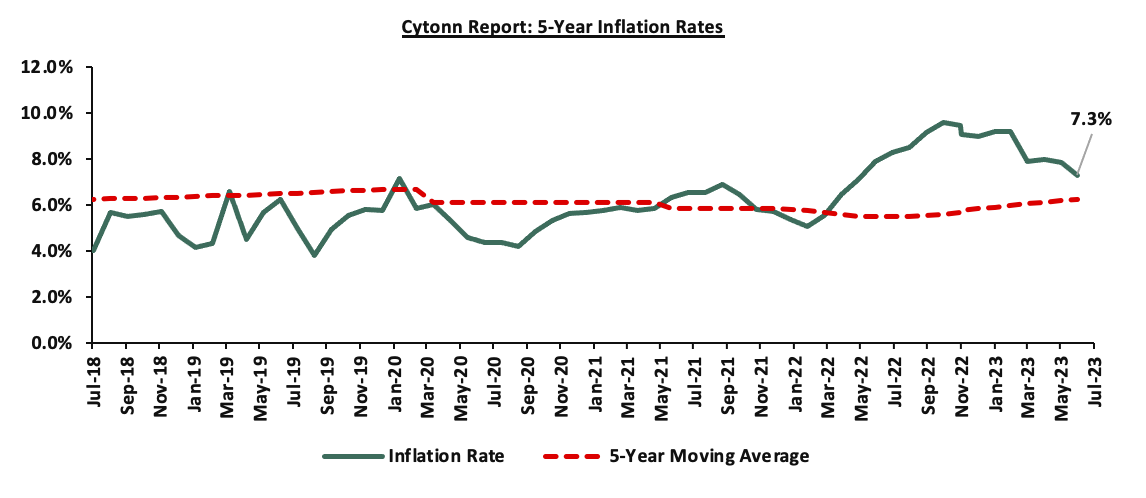
- Inflation/Purchasing Power Risk – Inflation refers to persistent and sustained increase in general price levels, which consequently reduces the purchasing power of money. Inflation risk is, thus, the potential of reduction in the actual worth of an investment and its return owing to inflation. It mostly affects fixed income securities, as their income is fixed on nominal terms: The chart below shows inflation rates in Kenya over the years:
-
- Interest Rate Risk – The risk arises as a result of changing interest rates in the market. Any change in the interest rate as a result of market forces alters the return on investments, mostly fixed income securities as bond prices for instance, are inversely related to the prevailing market interest rates, and,
- Exchange Rate Risk – This is the risk arising from the fluctuation in the value of foreign currency with respect to the local currency. Exchange rate risk affects only the securities of companies or individuals with foreign exchange transactions or exposures, which affects the actual worth of such an investment. The table below shows the performance of the Kenya shillings against major currencies, with the shilling having depreciated against all the selected currencies:
-
Cytonn Report: Performance of the Kenya Shilling Against Select Currencies
Currencies
January 2023 (vs KES)
Current
YTD change
USD
123.4
144.9
(17.4%)
EUR
131.7
156.9
(19.2%)
GBP
148.7
183.1
(23.1%)
JPY
0.95
1.0
(4.3%)
TSHS
0.05
0.06
(9.4%)
USHS
0.033
0.039
(18.2%)
- Unsystematic risks- refer to risks unique to a particular company, individual, or industry and can be reduced to a certain extent by diversification. Unsystematic risks mostly arise from the management, location, or financial obligations of the investor. The various subdivisions of unsystematic risks include;
-
- Liquidity Risk – this is the possibility of not being able to convert an investment into ready cash when a need arises or the difficulty of finding a buyer in the market when one needs to liquidate their investment,
- Financial Risks – refers to the uncertainty in the expected returns as a result of changes in the financial structure of a company. Only risk-free assets give returns equal to their expected returns. An example of this risk is when a firm has no capacity to meet its business obligations and is therefore unable to pay dividends or even interest,
- Political Risk– This refers to risks arising from changes in legislation, trade barriers, or any other political decision that could have a negative impact on the projected rate of return from an investment,
- Business Risk- This is the uncertainty in the returns of an investment due to volatility in a firm’s operating income,
- Legal Risk – Refers to the potential of a loss emanating from insufficient knowledge or misunderstanding of how the law applies to your investment, and,
- Investment Manager Risk – It is the risk linked with the ineffectiveness and inefficiency of an investment manager's ability to manage risks prudently.
Section 3: Risk Management
The process of identifying the risks that an organization faces, measuring the company's risk tolerance, changing and monitoring these risks to an organization's capital and earnings is referred to as risk management. Some of these risks are primarily caused by financial uncertainties, strategic management flaws, natural disasters and accidents, and legal responsibilities. Notably, the technique does not strive to eliminate all hazards, because an investor must incur a risk in order to receive a return above the risk-free rate. As a result, the best strategic risk management method should correlate the risks taken with the tolerance of the firm. As a result, by purchasing insurance, arranging hedging agreements, and implementing organizational changes, a company can raise its exposure to risks it can manage in order to increase returns while minimizing its exposure to hazards it cannot manage. In essence, the optimal risk management model is a collection of hazards that generate the maximum returns for the firm while remaining within its risk tolerance level.
- Strategies in Risk Management
Investors ought to assess and work with the optimal mix of risks for the organization or an individual, which means an investor will take more of some risks while decreasing others and eliminating others altogether. Some of the strategies employed by investors in risk management include:
-
- Diversification- Investors choice to diversify an investment portfolio across assets that are not perfectly correlated the portfolio risk is less than the weighted average of the individual securities in the portfolio. Risks that are eliminated by diversification are called unsystematic risks (firm-specific risks) and they include liquidity risk and financial risk, while systematic risks cannot be diversified away (market risks) and they include interest rate risks, inflation, and exchange rate risk
- Risk transfer- an individual or an organization can choose to shift the risk of losses to another party through strategies like insurance and even reinsurance for insurance companies.
- Risk avoidance- An investor can choose to avoid a certain risk altogether especially for external risks. For example, an investor can choose to avoid investing in a certain country out of political unrest or even to step back from starting a new product line from the associated risk
- Self-insurance- This involves creating back up plans and strategies to address unforeseen risks which means the investor is proactive. One can set up reserve funds to settle the uncertainties as they arise. This happens when an investor has chosen to bear the risks when they arise.
- Metrics in Measuring Investment Risks Exposure
Investors need to measure risk exposure to make informed decisions about their investments and manage potential losses. By assessing risk, investors can evaluate the potential impact of adverse events on their portfolio. Various methods are used to help investors understand the volatility, market correlation, potential loss levels and resilience of their investments in different scenarios, which include:
-
- Standard Deviation- This method quantifies the dispersion of returns around the average historical return by measuring the volatility of asset prices and interest rates. A higher standard deviation indicates greater volatility, meaning the investment option has a higher risk, compared to one with a lower standard deviation. This method is most appropriate in measuring systematic risk (market risk) like risks associated with economic conditions and geopolitical events.
- Beta- This method quantifies the sensitivity of an investment’s returns to overall market movements where the market is used as the beta benchmark, and the market beta is always one. If a security beta is greater than one, then it is more volatile than the market (higher risk), while a lower than one beta indicates lower risk compared to the market. A security with a beta of one has the same volatility profile as the broad market. Notably, this method considers the risk reduction benefits of diversification and is more appropriate for securities held in a well-diversified portfolio.
- Value at Risk (VaR)- This is a statistical measure of the maximum amount of money an investor would expect to lose on an investment portfolio with a given probability under normal market conditions. This measure considers the distribution of historical returns, volatility and correlations between different assets to estimate potential losses which informs investors on their exposure to market fluctuations and make informed decisions about risk tolerance and portfolio allocation, through setting risk limits, and determining capital reserves.
- Duration- The duration measure is used to assess the sensitivity of a fixed-income investment like bonds, to changes in interest rates by providing insights into the potential impact of interest rates changes on bond value. This measure help investors gauge the interest rate risk linked to their bond investment. A longer duration bond points towards greater sensitivity to changes in interest rates and implies higher price volatility, while shorter duration bonds have a lower price volatility to interest rate changes.
- Sharpe Ratio- This measure considers the risk-adjusted return, by subtracting the risk-free rate from the total return then dividing by the standard deviation (historical risk), to provide a single metric that quantifies how well an investment compensates for the amount of risk taken. A higher Sharpe ratio indicates a better risk-adjusted return since it implies the investment generated a higher return compared to its volatility. This measure is appropriate when evaluating different investment options as it allows investors know which options generate higher returns for any given level of risk.
- Advantages of Risk Management
-
- Protection of capital - Effective risk management strategies can prevent significant losses stemming from normal business operations and the business environment like market volatility, thus helping in protection of investor’s capital from losses
- Optimized Resource Allocations and Improved Return on Investment- By identifying potential opportunities and strategic risk management measures, investors are able to achieve better returns in the long-run, as well as better resource allocation which limits unnecessary costs.
- Stability and Continuity- Through identification of potential risks and working on mitigating them, an organization can reduce the chances of major losses by preparing for and addressing potential crises and disruptions
- Enhanced Decision Making- Through identification and analyzing of risks, investors can make informed decisions that take potential losses into account.
However, despite the vast advantages of the risk management process, there are some cons associated with Risk management which include;
- Ambiguity in figuring how much risk to take- It can be difficult to settle on the right amount of risk to take for investors and its important to strike the right balance between taking too much risk and not taking enough risk. Little risk translates to little returns while too much risk exposes the investor to catastrophic losses.
- Costly- A comprehensive risk management model requires financial investment and resource allocation which can be strenuous especially for smaller investors or companies.
Section IV: Investment Products in Kenya Market
There are various investment products available in Kenyan market and their variation mainly depend on return and risk they carry. An investor needs to decide on different channels based on their risk appetite, the returns expected and the liquidity requirement. Investment products available are broadly categorized into two categories:
- Traditional Investments
- Alternative Investments
- Traditional Investments
Traditional investments involve putting capital into well-known assets that are sometimes referred to as public-market investments. The main categories of traditional investment products under this category include:
- Equities- Equities are ownership stake in a company. They are traditional investments that are relatively liquid yet highly volatile making them very risky. They provide returns in the form of dividends and capital growth, making them attractive investment option for long-term investors. To invest in Kenya’s equity market, one need to open a Central Depository and Settlement (CDS) account, which is an electronic account that holds your shares and bonds, and allows for the process of transferring of shares at the Securities Exchange through a licensed stockbroker,
- Fixed Income- These securities which contractually provide an investor with a predetermined return in the form of interest and principal payments. They are also moderately liquid and have low volatility, hence considered less risky. They are suitable for medium to long-term investors. They include fixed deposits, Treasury bills and bonds, and commercial papers,
- Mutual Funds- A Collective Investment Scheme that presents investors with an opportunity to participate in the various asset classes by pooling money together from many investors. The funds are managed by a professional fund manager who invests the pooled funds in a portfolio of securities to achieve objectives of the trust. The funds in the mutual funds earn income in the form of dividends, interest income and capital gains depending on the asset class the funds are invested in. The following are the main types of funds:
-
- Money Market Fund- This fund mainly invests in short-term debt securities with high credit quality such as bank deposits, treasury bills, and commercial paper. The fund is best suited for investors who require a low-risk investment that offers capital stability, liquidity and a high-income yield. The fund is a good safe haven for investors who wish to switch from a higher risk portfolio to a low risk, high-interest portfolio, especially during times of high stock market volatility,
The table below shows the Money Market Fund Yields for Kenyan Fund Managers as published on 25th August 2023
|
Cytonn Report: Money Market Fund Yield for Fund Managers as published on 25th August 2023 |
||
|
Rank |
Fund Manager |
Effective Annual |
|
1 |
GenAfrica Money Market Fund |
13.0% |
|
2 |
Enwealth Money Market Fund |
12.6% |
|
3 |
Cytonn Money Market Fund |
12.5% |
|
4 |
Lofty-Corban Money Market Fund |
12.4% |
|
5 |
Etica Money Market Fund |
12.4% |
|
6 |
Madison Money Market Fund |
12.2% |
|
7 |
Jubilee Money Market Fund |
12.1% |
|
8 |
Kuza Money Market fund |
12.0% |
|
9 |
Co-op Money Market Fund |
11.6% |
|
10 |
Apollo Money Market Fund |
11.6% |
|
11 |
GenCap Hela Imara Money Market Fund |
11.4% |
|
12 |
Old Mutual Money Market Fund |
11.4% |
|
13 |
Sanlam Money Market Fund |
11.4% |
|
14 |
ICEA Lion Money Market Fund |
11.3% |
|
15 |
Absa Shilling Money Market Fund |
11.3% |
|
16 |
AA Kenya Shillings Fund |
11.2% |
|
17 |
Nabo Africa Money Market Fund |
11.0% |
|
18 |
Dry Associates Money Market Fund |
10.9% |
|
19 |
KCB Money Market Fund |
10.8% |
|
20 |
NCBA Money Market Fund |
10.8% |
|
21 |
CIC Money Market Fund |
10.5% |
|
22 |
Orient Kasha Money Market Fund |
10.2% |
|
23 |
British-American Money Market Fund |
9.5% |
|
24 |
Mali Money Market Fund |
9.3% |
|
25 |
Equity Money Market Fund |
9.0% |
- Fixed Income Fund – This fund invests in interest-bearing securities, which include treasury bills, treasury bonds, preference shares, corporate bonds, loan stock, approved securities, notes and liquid assets consistent with the portfolio’s investment objective. The fund is suitable for investors who are seeking a regular income from their investment, including those who intend to secure a safe haven for their investments in times of stock market instability,
- Equity Fund- This type of fund aims to offer superior returns over the medium to longer-term by maximizing capital gains through investing in listed securities. This fund is suited for investors seeking medium to long-term capital growth in their portfolios and want to gain exposure to equity investments. The fund has a medium to high-risk profile. Due to the volatile nature of the stock markets, risk is usually reduced through holding a diversified portfolio of shares across different sectors,
- Balanced Fund – This fund invests in a diversified spread of equities and fixed income securities with the objective to offer investors a reasonable level of current income and long-term capital growth. The fund is suited to investors who seek to invest in a balanced portfolio offering exposure to all sectors of the market. It is also suitable for pension schemes, treasury portfolios of institutional clients, co-operatives and high net worth individuals amongst others. The fund is a medium risk fund and has a medium risk profile, and,
- High Yield Fund – This type of fund invests in securities that generally pay above average interests and dividends, with the fund’s objective being delivery of high returns to investors. The fund has a high-risk profile and is suited for long-term investors who are looking for growth of their portfolio’s over-time.
- Alternative Investments
Alternative investments are those that fall outside the conventional investment types such as publicly-traded stocks, bonds, and cash. The most common alternative investments today are:
- Real Estate - This involves investment in property and land. Real Estate is considered an alternative investment that is illiquid, relatively stable and uncorrelated to traditional investments. They are suitable for long-term investment plans, which makes them a risky investment. Real Estate can yield high returns, and is useful for diversification and as a hedge against inflation since its value increases over time. Real Estate offers returns in the form of rental yield and price appreciation, and,
- Private Equity - It generally involves buying shares in companies that are not listed on a public exchange or buying shares of public companies with the intent to make them private. Private equity can involve many strategies that may help provide money to companies at different stages of their development. The most widely used strategies are venture capital, buyouts and distressed investing.
In determining the appropriate investment option, one should consider:
- Liquidity needs and time horizon for investment- The liquidity varies from one asset to another. An individual must evaluate the target for the investment chosen and the length of time they for which they require illiquid assets,
- The rate of return- A rational investor seeks out a venture that would provide maximum return for a given level of risk,
- The cost of the investment- One should harbour the same sentiments in purchasing an investment as they do in buying groceries. The price of the investment is a key element. Over time, the returns received should exceed the cost of the investment, and,
- The regulatory and legal constraints placed on the venture- Awareness of the tax treatments that the selected investment options are subject to assists one in evaluating their longstanding returns.
Section V: Conclusion and Outlook
Investment risk analysis is an integral part of the investment process, as it helps investors navigate the complex landscape of opportunities and risks associated with them, thus enhancing the potential for successful outcomes while managing the exposure to risk. This analysis revolves around the fundamental concept of Risk-Reward Trade off where higher return potential often comes in a high-risk package. However, investors should always strike the right balance of risk that aligns with their risk tolerance and financial goals to ensure optimal return on investment and optimal resource allocation.
Disclaimer: The views expressed in this publication are those of the writers where particulars are not warranted. This publication, which is in compliance with Section 2 of the Capital Markets Authority Act Cap 485A, is meant for general information only and is not a warranty, representation, advice or solicitation of any nature. Readers are advised in all circumstances to seek the advice of a registered investment advisor.

- Talk to us
- Kenya
- P.O Box 20695 - 00200, Nairobi, Kenya
- Cell +254709101200
- Tel +254709101200
- WhatsApp +254741676635
- United States
- +254709101200
- DOWNLOAD OUR APP
-


- Kenya
- 8th Floor, Pinetree Plaza, Kaburu Drive, Ngong Road, Nairobi, Kenya
- USA
- Suite 1150, 1775 Eye Street NW, USA, Washington DC 20006, USA
- Investments
- High Yield
- Private Equity
- Real Estate
- Real Estate
- RiverRun Estates
- Cytonn Towers
- The Ridge
- Taraji Heights
- The Alma