Joint Venture Agreements (JVs) in Real Estate, & Cytonn Weekly #20/2024
By Research Team, May 19, 2024
Executive Summary
Fixed Income
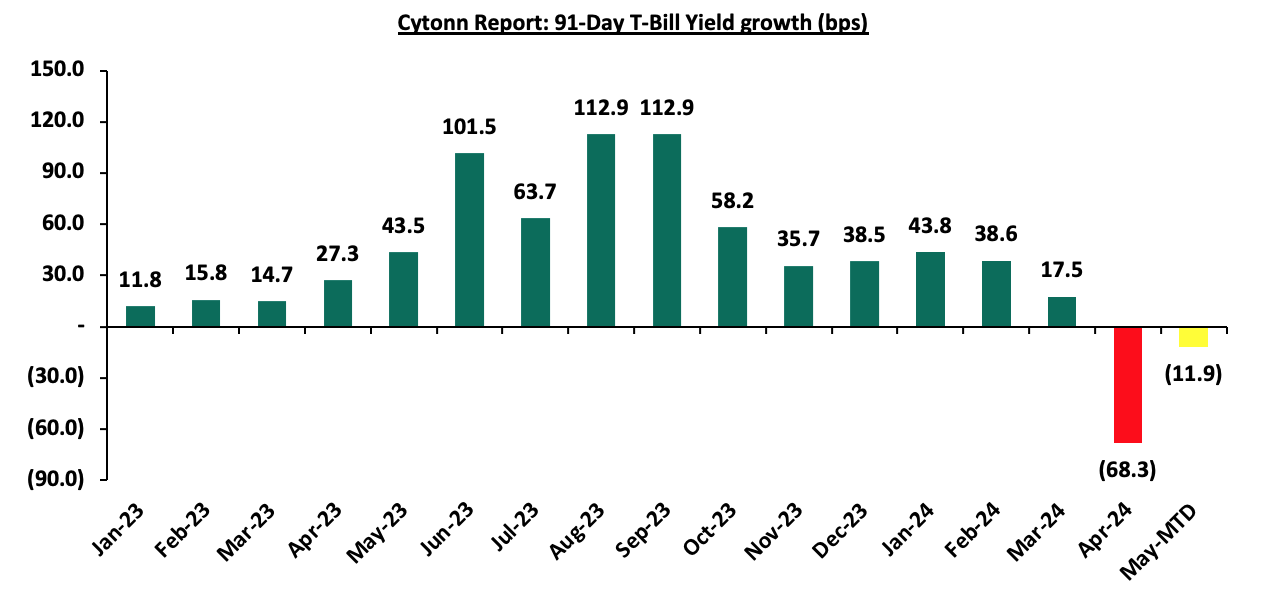
During the week, T-bills were oversubscribed for the third consecutive week, with the overall oversubscription rate coming in at 194.8%, lower than the oversubscription rate of 223.6% recorded the previous week. Investors’ preference for the shorter 91-day paper persisted, with the paper receiving bids worth Kshs 13.0 bn against the offered Kshs 4.0 bn, translating to an oversubscription rate of 325.4%, lower than the oversubscription rate of 431.3% recorded the previous week. The subscription rate for the 182-day decreased to 180.4% from 222.9% recorded the previous week, while the subscription rate for the 364-day paper increased to 156.8% from 134.4% recorded the previous week. The government accepted a total of Kshs 46.1 bn worth of bids out of Kshs 46.7 bn bids received, translating to an acceptance rate of 98.6%. The yields on the government papers were on an upward trajectory, with the yields on the 91-day, 182-day, and 364-day papers increasing by 3.3 bps, 1.6 bps, and 2.3 bps to 15.94%, 16.52%, and 16.53% from 15.90%, 16.50% and 16.51% respectively recorded the previous week;
During the week, the Energy and Petroleum Regulatory Authority (EPRA) released their monthly statement on the maximum retail fuel prices in Kenya, effective from 15th May 2024 to 14th June 2024. Notably, the maximum allowed price for Super Petrol, Diesel and Kerosene decreased by Kshs 1.0, Kshs 1.2, and Kshs 1.3 each respectively, and will retail at Kshs 192.8, Kshs 179.2, and Kshs 168.7 per litre respectively from the April 2024 prices of Kshs 193.8, Kshs 180.4 and Kshs 170.0 respectively;
Also, during the week, the National Treasury gazetted the revenue and net expenditures for the tenth month of FY’2023/2024, ending 30th April 2024, highlighting that the total revenue collected as at the end of April 2024 amounted to Kshs 1,830.0 bn, equivalent to 71.0% of the revised estimates of Kshs 2,576.8 bn for FY’2023/2024, is 85.2% of the prorated estimates of Kshs 2,147.3 bn and 1.1% increment from the Kshs 1,812.2 bn recorded same time last year;
Equities
During the week, the equities market was on an upward trajectory, with NSE 10 gaining the most by 4.1%, while NASI, NSE 25, and NSE 20 gained by 3.8%, 3.6%, and 2.7% respectively, taking the YTD performance to gains of 24.2%, 21.2%, 20.2% and 13.0% for NSE 10, NSE 25, NASI and NSE 20 respectively. The equities market performance was driven by gains recorded by large-cap stocks such as Equity Group, KCB Group, and Safaricom of 7.0%, 6.0%, and 5.5% respectively. The performance was, however, weighed down by losses recorded by large-cap stocks such as EABL, BAT, and Stanbic Bank of 1.6%, 0.6%, and 0.2% respectively;
During the week, Co-operative Bank released their Q1’2024 Financial results, recording a 7.7% increase in Profit After Tax (PAT) to Kshs 6.6 bn, from Kshs 6.1 bn recorded in Q1’2023. The performance was mainly driven by an 8.6% increase in Net-Interest Income to Kshs 11.7 bn in Q1’2024, from Kshs 10.8 bn recorded in Q1’2023, but was weighed down by a marginal 0.3% decrease in Non-Interest Income to remain relatively unchanged at Kshs 7.1 bn recorded in Q1’2023;
Also, during the week, Equity Group released their Q1’2024 Financial results, recording a 25.2% increase in Profit After Tax (PAT) to Kshs 16.0 bn, from Kshs 12.8 bn recorded in Q1’2023. The performance was mainly driven by a 28.4% increase in net interest income to Kshs 27.8 bn in Q1’2024, from Kshs 21.7 bn recorded in Q1’2023, coupled with a 21.0% increase in net non-interest income to Kshs 22.2 bn, from Kshs 18.4 bn recorded in Q1’2023;
Additionally, during the week, CIC Group released their FY’2023 results. This was the second time the company was releasing their results under the new IFRS 17 reporting system. CIC’s Profit After Tax (PAT) increased by 817.6% to Kshs 1.4 bn, from Kshs 0.2 bn recorded in FY’2022. The performance was mainly driven by a 242.3% increase in insurance service results previously disclosed as net earned premiums to Kshs 0.8 bn, compared to a negative of Kshs 0.6 bn in FY’2022, coupled with a 24.4% increase in net investment income to Kshs 2.2 bn, from Kshs 1.8 bn in FY’2022;
Real Estate
During the week, the National Treasury tabled the Finance Bill 2024, which addresses several key areas impacting taxation, housing, and infrastructure financing. The aim of the bill is to introduce amendments and proposals aimed at refining the taxation system, several of which tie in enhancing infrastructure financing and advancing housing initiatives in Kenya;
During the week, Gateway Real Estate Africa, a subsidiary of London-listed Grit Real Estate Income Group, unveiled a significant development in Kenya's real estate landscape. The project, named Eneo, is a state-of-the-art Business Process Outsourcing (BPO) facility located within the Tatu City Special Economic Zone (SEZ);
On the Unquoted Securities Platform, Acorn D-REIT and I-REIT traded at Kshs 24.5 and Kshs 22.0 per unit, respectively, as of 9th May 2024. The performance represented a 22.5% and 10.0% gain for the D-REIT and I-REIT, respectively, from the Kshs 20.0 inception price;
Focus of the Week
This week, we will explore Joint Venture Agreements in Real Estate, focusing on the processes involved in a joint venture between a landowner and a developer, the key considerations, and the benefits derived from such partnerships;
Investment Updates:
- Weekly Rates:
- Cytonn Money Market Fund closed the week at a yield of 17.07% p.a. To invest, dial *809# or download the Cytonn App from Google Play store here or from the Appstore here;
- We continue to offer Wealth Management Training every Monday and Thursday, from 7.00 pm to 8:00 pm. The training aims to grow financial literacy among the general public. To register for any of our Wealth Management Trainings, click here;
- If interested in our Private Wealth Management Training for your employees or investment group, please get in touch with us through wmt@cytonn.com;
- Cytonn Insurance Agency acts as an intermediary for those looking to secure their assets and loved ones’ future through insurance namely; Motor, Medical, Life, Property, WIBA, Credit and Fire and Burglary insurance covers. For assistance, get in touch with us through insuranceagency@cytonn.com;
- Cytonn Asset Managers Limited (CAML) continues to offer pension products to meet the needs of both individual clients who want to save for their retirement during their working years and Institutional clients that want to contribute on behalf of their employees to help them build their retirement pot. To more about our pension schemes, kindly get in touch with us through pensions@cytonn.com;
Real Estate Updates:
- For more information on Cytonn’s Real Estate developments, email us at sales@cytonn.com;
- Phase 3 of The Alma is now ready for occupation and the show house is open daily. To join the waiting list to rent, please email properties@cytonn.com;
- For Third Party Real Estate Consultancy Services, email us at rdo@cytonn.com;
- For recent news about the group, see our news section here;
Hospitality Updates:
- We currently have promotions for Staycations. Visit cysuites.com/offers for details or email us at sales@cysuites.com;
Money Markets, T-Bills Primary Auction:
During the week, T-bills were oversubscribed for the third consecutive week, with the overall oversubscription rate coming in at 194.8%, lower than the oversubscription rate of 223.6% recorded the previous week. Investors’ preference for the shorter 91-day paper persisted, with the paper receiving bids worth Kshs 13.0 bn against the offered Kshs 4.0 bn, translating to an oversubscription rate of 325.4%, lower than the oversubscription rate of 431.3% recorded the previous week. The subscription rate for the 182-day decreased to 180.4% from 222.9% recorded the previous week, while the subscription rate for the 364-day paper increased to 156.8% from 134.4% recorded the previous week. The government accepted a total of Kshs 46.1 bn worth of bids out of Kshs 46.7 bn bids received, translating to an acceptance rate of 98.6%. The yields on the government papers were on an upward trajectory, with the yields on the 91-day, 182-day, and 364-day papers increasing by 3.3 bps, 1.6 bps, and 2.3 bps to 15.94%, 16.52%, and 16.53% from 15.90%, 16.50% and 16.51% respectively recorded the previous week. The chart below shows the yield growth rate for the 91-day paper over the period:
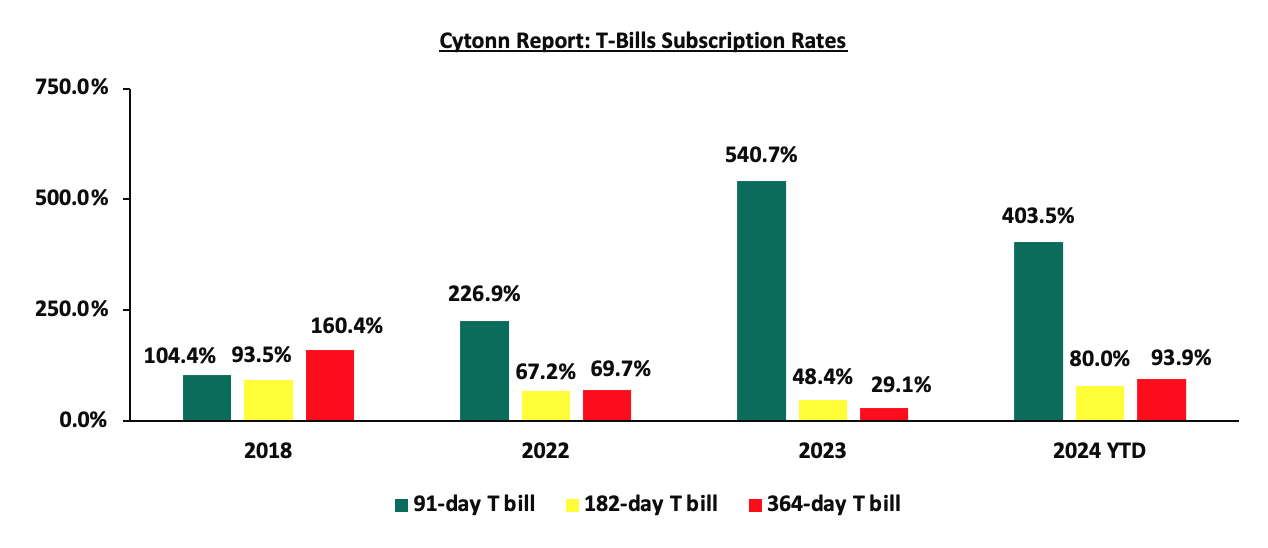
The chart below compares the overall average T-bill subscription rates obtained in 2018, 2022, 2023, and 2024 Year-to-date (YTD):
Money Market Performance:
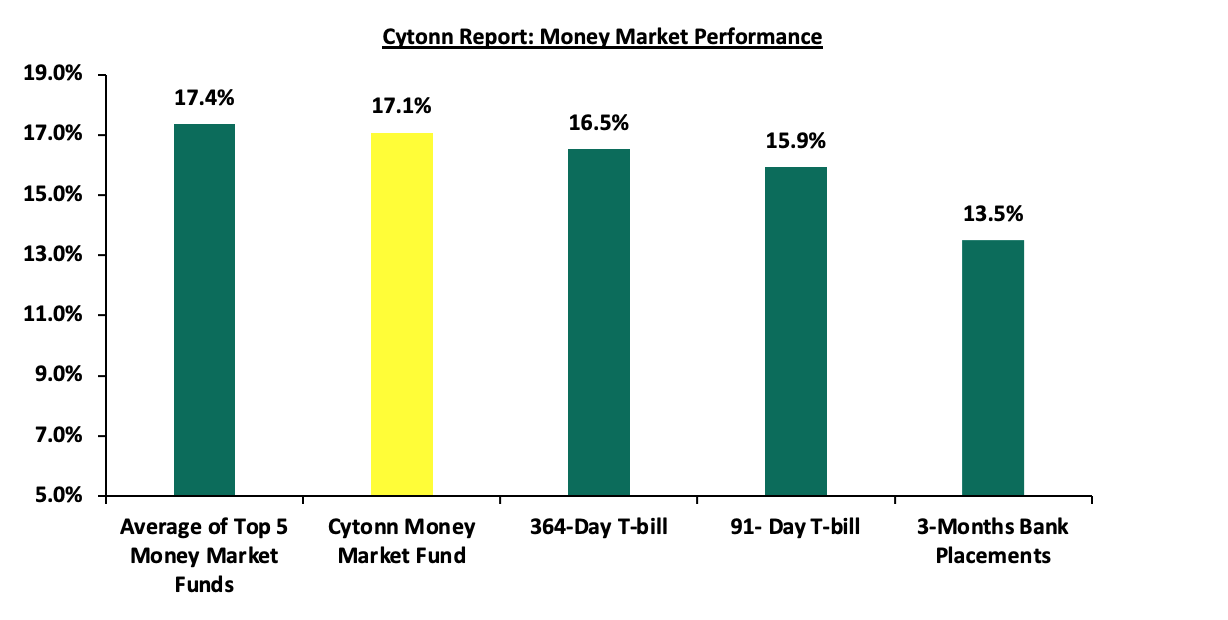
In the money markets, 3-month bank placements ended the week at 13.5% (based on what we have been offered by various banks), and the yields on the government papers were on an upward trajectory, with the yields on the 91-day and 364-day papers increasing by 3.3 bps and 2.3 bps to remain relatively unchanged at 15.9% and 16.5% recorded the previous week. The yields on the Cytonn Money Market Fund decreased marginally by 1.0 bps to remain relatively unchanged at 17.1% recorded the previous week, while the average yields on the Top 5 Money Market Funds increased by 4.2 bps to 17.4% from the 17.3% recorded the previous week.
The table below shows the Money Market Fund Yields for Kenyan Fund Managers as published on 17th May 2024:
|
Cytonn Report: Money Market Fund Yield for Fund Managers as published on 17th May 2024 |
||
|
Rank |
Fund Manager |
Effective Annual Rate |
|
1 |
Lofty-Corban Money Market Fund |
18.3% |
|
2 |
Etica Money Market Fund |
18.1% |
|
3 |
Cytonn Money Market Fund (Dial *809# or download the Cytonn app) |
17.1% |
|
4 |
GenAfrica Money Market Fund |
16.8% |
|
5 |
Nabo Africa Money Market Fund |
16.5% |
|
6 |
Kuza Money Market fund |
16.1% |
|
7 |
Enwealth Money Market Fund |
16.1% |
|
8 |
Apollo Money Market Fund |
15.9% |
|
9 |
GenCap Hela Imara Money Market Fund |
15.6% |
|
10 |
Madison Money Market Fund |
15.5% |
|
11 |
Jubilee Money Market Fund |
15.5% |
|
12 |
Co-op Money Market Fund |
15.3% |
|
13 |
Mali Money Market Fund |
15.3% |
|
14 |
Absa Shilling Money Market Fund |
15.2% |
|
15 |
KCB Money Market Fund |
15.2% |
|
16 |
Sanlam Money Market Fund |
15.1% |
|
17 |
AA Kenya Shillings Fund |
15.0% |
|
18 |
Mayfair Money Market Fund |
14.9% |
|
19 |
Dry Associates Money Market Fund |
14.0% |
|
20 |
Old Mutual Money Market Fund |
13.4% |
|
21 |
Orient Kasha Money Market Fund |
13.4% |
|
22 |
CIC Money Market Fund |
13.2% |
|
23 |
Equity Money Market Fund |
12.6% |
|
24 |
ICEA Lion Money Market Fund |
12.2% |
|
25 |
British-American Money Market Fund |
10.1% |
Source: Business Daily
Liquidity:
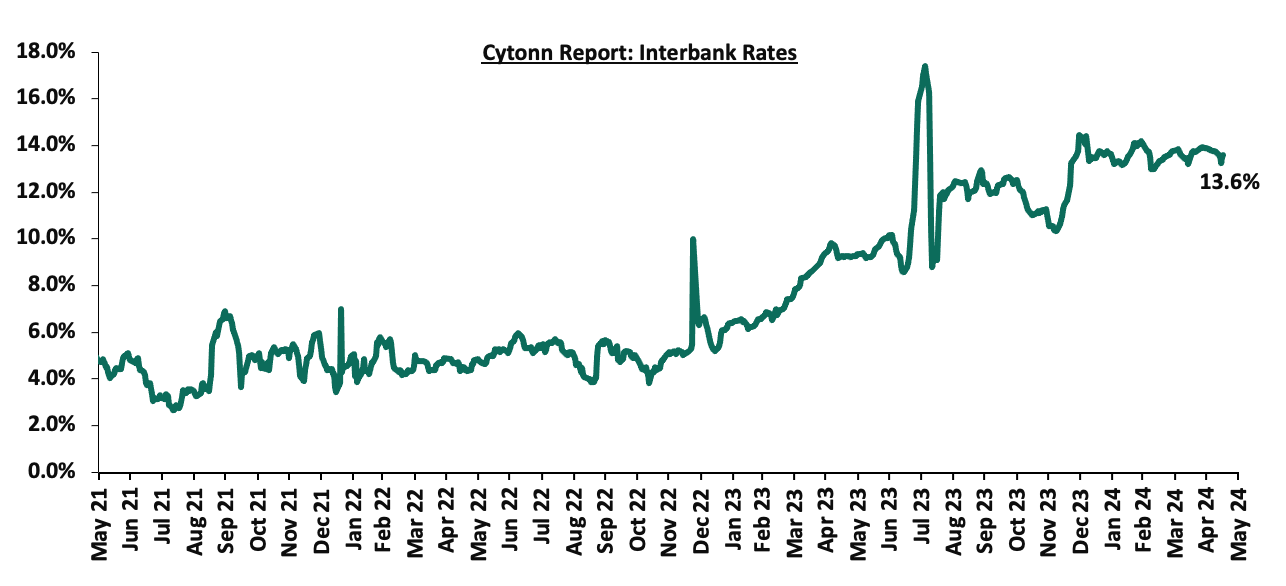
During the week, liquidity in the money markets eased, with the average interbank rate decreasing by 28.1 bps, to 13.5%, from 13.8% recorded the previous week, partly attributable to government payments that offset tax remittances. The average interbank volumes traded increased by 17.7% to Kshs 18.4 bn from Kshs 15.6 bn recorded the previous week. The chart below shows the interbank rates in the market over the years:
Kenya Eurobonds:
During the week, the yields on Eurobonds were on a downward trajectory, with the yields on the 7-year Eurobond issued in 2019 decreasing the most by 34.0 bps to 8.4% from 8.7% recorded the previous week. The table below shows the summary of the performance of the Kenyan Eurobonds as of 16th May 2024;
|
Cytonn Report: Kenya Eurobonds Performance |
||||||
|
|
2018 |
2019 |
2021 |
2024 |
||
|
Tenor |
10-year issue |
30-year issue |
7-year issue |
12-year issue |
13-year issue |
7-year issue |
|
Amount Issued (USD) |
1.0 bn |
1.0 bn |
0.9 bn |
1.2 bn |
1.0 bn |
1.5 bn |
|
Years to Maturity |
3.8 |
23.8 |
3.0 |
8.0 |
10.1 |
6.8 |
|
Yields at Issue |
7.3% |
8.3% |
7.0% |
7.9% |
6.2% |
10.4% |
|
01-Jan-24 |
9.8% |
10.2% |
10.1% |
9.9% |
9.5% |
|
|
01-May-24 |
9.3% |
10.2% |
9.3% |
10.0% |
10.0% |
10.0% |
|
09-May-24 |
8.8% |
9.8% |
8.7% |
9.5% |
9.5% |
9.5% |
|
13-May-24 |
8.8% |
9.9% |
8.7% |
9.5% |
9.5% |
9.5% |
|
14-May-24 |
8.9% |
9.9% |
8.8% |
9.5% |
9.5% |
9.5% |
|
15-May-24 |
8.7% |
9.8% |
8.5% |
9.3% |
9.4% |
9.4% |
|
16-May-24 |
8.7% |
9.7% |
8.4% |
9.3% |
9.3% |
9.3% |
|
Weekly Change |
(0.2%) |
(0.1%) |
(0.3%) |
(0.2%) |
(0.2%) |
(0.2%) |
|
MTD Change |
(0.7%) |
(0.4%) |
(0.9%) |
(0.7%) |
(0.6%) |
(0.7%) |
|
YTD Change |
(1.2%) |
(0.5%) |
(1.7%) |
(0.6%) |
(0.2%) |
- |
Source: Central Bank of Kenya (CBK) and National Treasury
Kenya Shilling:
During the week, the Kenya Shilling gained against the US Dollar by 0.4%, to close at Kshs 130.7, from Kshs 131.3 recorded the previous week. On a year-to-date basis, the shilling has appreciated by 16.7% against the dollar, a contrast to the 26.8% depreciation recorded in 2023.
We expect the shilling to be supported by:
- Diaspora remittances standing at a cumulative USD 4,457.0 mn in the 12 months to April 2024, 11.9% higher than the USD 3,985.0 mn recorded over the same period in 2023, which has continued to cushion the shilling against further depreciation. In the April 2024 diaspora remittances figures, The United States of America remained the largest source of remittances to Kenya accounting for 49.0% in the period, and,
- The tourism inflow receipts which came in at USD 352.5 bn in 2023, a 31.5% increase from USD 268.1 bn inflow receipts recorded in 2022, and owing to tourist arrivals that improved by 27.6% to 182,000 in the 12 months to January 2024, from 151,000 recorded during a similar period in 2023.
The shilling is however expected to remain under pressure in 2024 as a result of:
- An ever-present current account deficit which came at 3.5% of GDP in Q3’2023 from 6.4% recorded in a similar period in 2022,
- The need for government debt servicing, continues to put pressure on forex reserves given that 67.5% of Kenya’s external debt was US Dollar denominated as of September 2023, and,
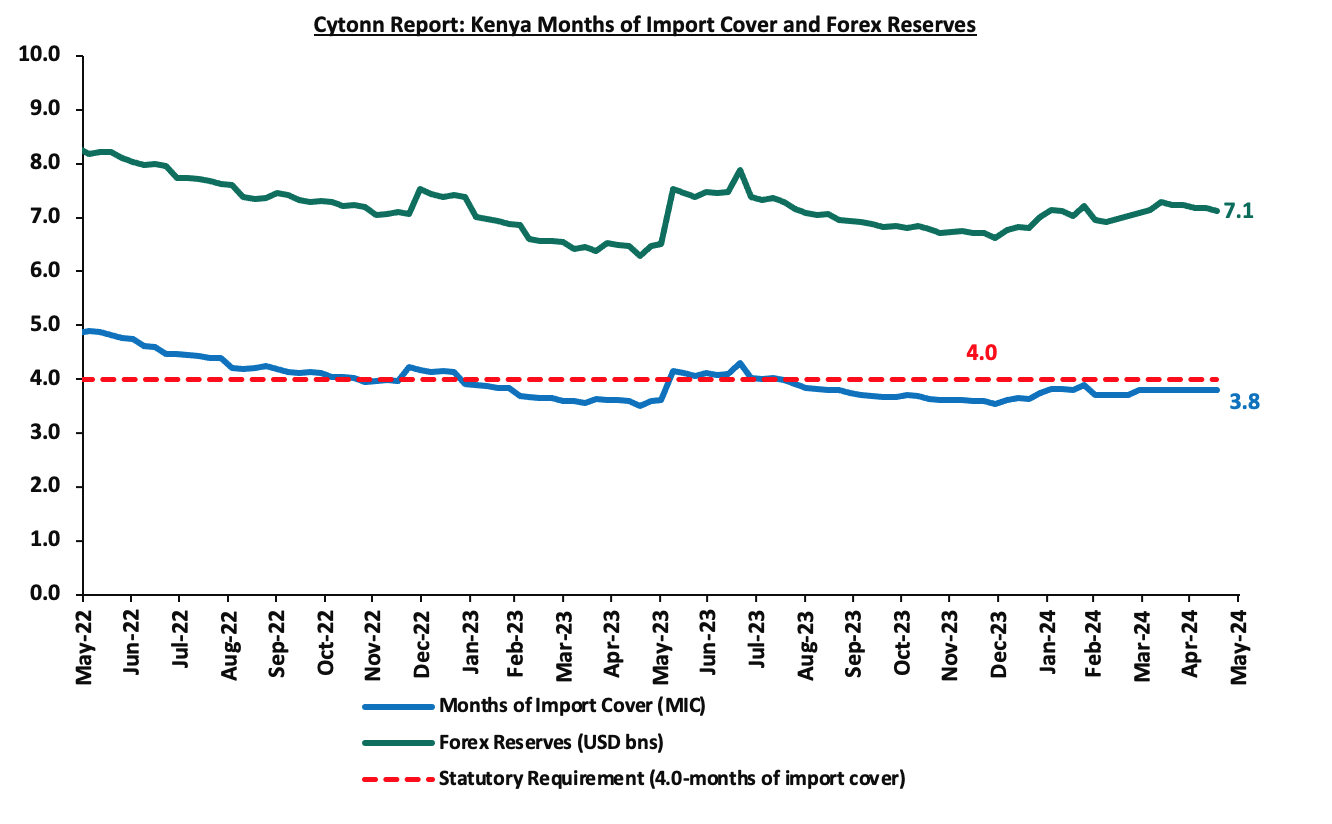
- Dwindling forex reserves, currently at USD 7.1 mn (equivalent to 3.8 months of import cover), which is below the statutory requirement of maintaining at least 4.0 months of import cover.
Key to note, Kenya’s forex reserves decreased by 0.7% during the week to USD 7.1 bn from USD 7.2 bn recorded the previous week, equivalent to 3.8 months of import cover same as the previous week, and remained below the statutory requirement of maintaining at least 4.0-months of import cover.
The chart below summarizes the evolution of Kenya's months of import cover over the years:
Weekly Highlights
- Fuel Prices effective 15th May 2024 to 14th June 2024
During the week, the Energy and Petroleum Regulatory Authority (EPRA) released their monthly statement on the maximum retail fuel prices in Kenya, effective from 15th May 2024 to 14th June 2024. Notably, the maximum allowed price for Super Petrol, Diesel and Kerosene decreased by Kshs 1.0, Kshs 1.2, and Kshs 1.3 each respectively, and will retail at Kshs 192.8, Kshs 179.2, and Kshs 168.7 per litre respectively from the April 2024 prices of Kshs 193.8, Kshs 180.4 and Kshs 170.0 respectively.
Other key take-outs from the performance include;
- The average landing costs per cubic meter for Super Petrol and Kerosene increased by 3.8% and 0.5% respectively to USD 765.9 and USD 729.0 respectively, from USD 737.7 and USD 725.3 recorded in March 2024, while Diesel decreased marginally by 0.5% to USD 719.2 in April 2024 from USD 722.5 in March 2024 and,
- The Kenyan shilling depreciated against the US Dollar by 0.8% to Kshs. 134.6 in April 2024, compared to the mean monthly exchange rate of Kshs 133.5 recorded in March 2024.
We note that fuel prices in the country have decreased largely attributed to the government's efforts to stabilize pump prices through the petroleum pump price stabilization mechanism which has so far expended Kshs 9.9 bn in the FY2023/24 to cushion the increases applied to the petroleum pump prices, coupled with the ongoing appreciation of the Kenyan Shilling against the dollar and other major currencies. Nevertheless, fuel prices in the country still remain under pressure from the high taxation of petroleum products as provided in the Finance Act 2023. We expect that fuel prices will drop in the coming months as a result of the government's efforts to mitigate the cost of petroleum through the pump price stabilization mechanism and strengthening of the Kenyan Shilling against the United States Dollar, having gained by 16.7% against the dollar on a year-to-date basis coupled with a reduction in international fuel prices. As such, we expect the business environment in the country to improve as fuel is a major input cost, as well as further ease in inflationary pressures, with the inflation rate expected to remain within the CBK’s preferred target range of 2.5%-7.5%. However, there remains a threat of an increase in fuel prices in the country resulting from increasing international prices on the back of geopolitical tensions.
- April 2024 Exchequer Highlight
The National Treasury gazetted the revenue and net expenditures for the tenth month of FY’2023/2024, ending 30th April 2024. Below is a summary of the performance:
|
FY'2023/2024 Budget Outturn - As at 30th April 2024 |
||||||
|
Amounts in Kshs billions unless stated otherwise |
||||||
|
Item |
12-months Original Estimates |
Revised Estimates |
Actual Receipts/Release |
Percentage Achieved of the Revised Estimates |
Prorated |
% achieved of the Prorated |
|
Opening Balance |
|
|
2.6 |
|
|
|
|
Tax Revenue |
2,495.8 |
2,495.8 |
1,745.8 |
69.9% |
2,079.9 |
83.9% |
|
Non-Tax Revenue |
75.3 |
80.9 |
81.7 |
100.9% |
67.4 |
121.1% |
|
Total Revenue |
2,571.2 |
2,576.8 |
1,830.0 |
71.0% |
2,147.3 |
85.2% |
|
External Loans & Grants |
870.2 |
849.8 |
520.8 |
61.3% |
708.1 |
73.5% |
|
Domestic Borrowings |
688.2 |
851.9 |
686.6 |
80.6% |
709.9 |
96.7% |
|
Other Domestic Financing |
3.2 |
3.2 |
3.5 |
111.1% |
2.7 |
133.3% |
|
Total Financing |
1,561.6 |
1,704.9 |
1,211.0 |
71.0% |
1,420.7 |
85.2% |
|
Recurrent Exchequer issues |
1,302.8 |
1,360.1 |
1,050.3 |
77.2% |
1,133.4 |
92.7% |
|
CFS Exchequer Issues |
1,963.7 |
2,078.8 |
1,456.5 |
70.1% |
1,732.4 |
84.1% |
|
Development Expenditure & Net Lending |
480.8 |
457.2 |
235.1 |
51.4% |
381.0 |
61.7% |
|
County Governments + Contingencies |
385.4 |
385.4 |
256.3 |
66.5% |
321.2 |
79.8% |
|
Total Expenditure |
4,132.7 |
4,281.6 |
2,998.2 |
70.0% |
3,568.0 |
84.0% |
|
Fiscal Deficit excluding Grants |
1,561.6 |
1,704.9 |
1,168.2 |
68.5% |
1,420.7 |
82.2% |
|
Total Borrowing |
1,558.4 |
1,701.7 |
1,207.4 |
71.0% |
1,418.1 |
85.1% |
Amounts in Kshs bns unless stated otherwise
The Key take-outs from the release include;
- Total revenue collected as at the end of April 2024 amounted to Kshs 1,830.0 bn, equivalent to 71.0% of the revised estimates of Kshs 2,576.8 bn for FY’2023/2024 and is 85.2% of the prorated estimates of Kshs 2,147.3 bn. Cumulatively, tax revenues amounted to Kshs 1,745.8 bn, equivalent to 69.9% of the revised estimates of Kshs 2,495.8 bn and 83.9% of the prorated estimates of Kshs 2,079.9 bn,
- Total financing amounted to Kshs 1,211.0 bn, equivalent to 71.0% of the revised estimates of Kshs 1,704.9 bn and is equivalent to 85.2% of the prorated estimates of Kshs 1,420.7 bn. Additionally, domestic borrowing amounted to Kshs 686.6 bn, equivalent to 80.6% of the revised estimates of Kshs 851.9 bn and is 96.7% of the prorated estimates of Kshs 709.9 bn,
- The total expenditure amounted to Kshs 2,988.2 bn, equivalent to 70.0% of the revised estimates of Kshs 4,281.6 bn, and is 84.0% of the prorated target expenditure estimates of Kshs 3,568.0 bn. Additionally, the net disbursements to recurrent expenditures came in at Kshs 1,050.3 bn, equivalent to 77.2% of the revised estimates of Kshs 1,360.1 and 92.7% of the prorated estimates of Kshs 1,133.4 bn,
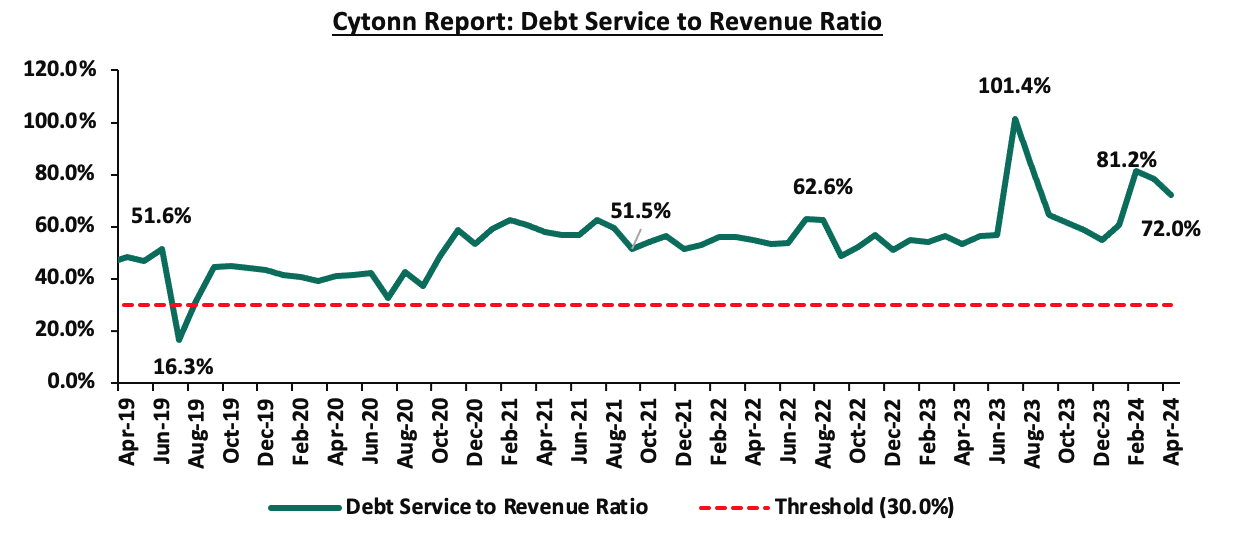
- Consolidated Fund Services (CFS) Exchequer issues came in at Kshs 1,456.5 bn, equivalent to 70.1% of the revised estimates of Kshs 2,078.8 bn, and are 84.1% of the prorated amount of Kshs 1,732.4 bn. The cumulative public debt servicing cost amounted to Kshs 1,317 bn which is 70.6% of the revised estimates of Kshs 1,866.0 bn, and is 84.7% of the prorated estimates of Kshs 1,555.0 bn. Additionally, the Kshs 1,317.5 bn debt servicing cost is equivalent to 72.0% of the actual revenues collected as at the end of April 2024. The chart below shows the debt serving to revenue ratio;
- Total Borrowings as at the end of April 2024 amounted to Kshs 1,207.4 bn, equivalent to 71.0% of the revised estimates of Kshs 1,701.7 bn for FY’2023/2024 and are 85.1% of the prorated estimates of Kshs 1,418.1 bn. The cumulative domestic borrowing of Kshs 851.9 bn comprises of Net Domestic Borrowing Kshs 471.4 bn and Internal Debt Redemptions (Rollovers) Kshs 380.5 bn.
The government has been unable to meet its prorated revenue targets for the ten months of the FY’2023/2024, attaining 85.2% of the revenue targets in April 2024, mainly on the back of the tough economic situation exacerbated by the elevated inflationary pressures that despite decreasing by 0.7% points in April to 5.0% from the 5.7% recorded in March, cost of living remains elevated in the country, which continues to impede revenue collection despite an improvement in business environment with the PMI coming in at 50.1 in April from the 49.7 recorded in March 2024. In light of this, the government is yet to fully benefit from the strategies put in place to improve revenue collection such as expanding the revenue base and sealing tax leakages, and suspension of tax relief payments. The coming months' revenue collection performance will largely depend on how quickly the country's business climate stabilizes. This stabilization is expected to be aided by the ongoing appreciation of the Shilling, which gained by 1.9% against the dollar in the month of April, and a further ease in inflationary pressures in the country.
Rates in the Fixed Income market have been on an upward trend given the continued high demand for cash by the government and the occasional liquidity tightness in the money market. The government is 21.2% ahead of its prorated net domestic borrowing target of Kshs 362.3 bn, and 7.9% ahead of the total domestic net borrowing target of Kshs 407.0 bn for FY’2023/2024, having a net borrowing position of Kshs 439.0 bn. However, we expect a downward readjustment of the yield curve in the short and medium term, with the government looking to increase its external borrowing to maintain the fiscal surplus, hence alleviating pressure in the domestic market. As such, we expect the yield curve to normalize in the medium to long-term and hence investors are expected to shift towards the long-term papers to lock in the high returns.
Market Performance:
During the week, the equities market was on an upward trajectory, with NSE 10 gaining the most by 4.1%, while NASI, NSE 25, and NSE 20 gained by 3.8%, 3.6%, and 2.7% respectively, taking the YTD performance to gains of 24.2%, 21.2%, 20.2% and 13.0% for NSE 10, NSE 25, NASI and NSE 20 respectively. The equities market performance was driven by gains recorded by large-cap stocks such as Equity Group, KCB Group, and Safaricom of 7.0%, 6.0%, and 5.5% respectively. The performance was, however, weighed down by losses recorded by large-cap stocks such as EABL, BAT, and Stanbic Bank of 1.6%, 0.6%, and 0.2% respectively.
During the week, equities turnover decreased by 21.6% to USD 6.7 mn from USD 8.6 mn recorded the previous week, taking the YTD total turnover to USD 202.6 mn. Foreign investors became net sellers for the first time in six weeks with a net selling position of USD 0.1 mn, from a net buying position of USD 0.7 mn recorded the previous week, taking the YTD foreign net selling position to USD 7.9 mn.
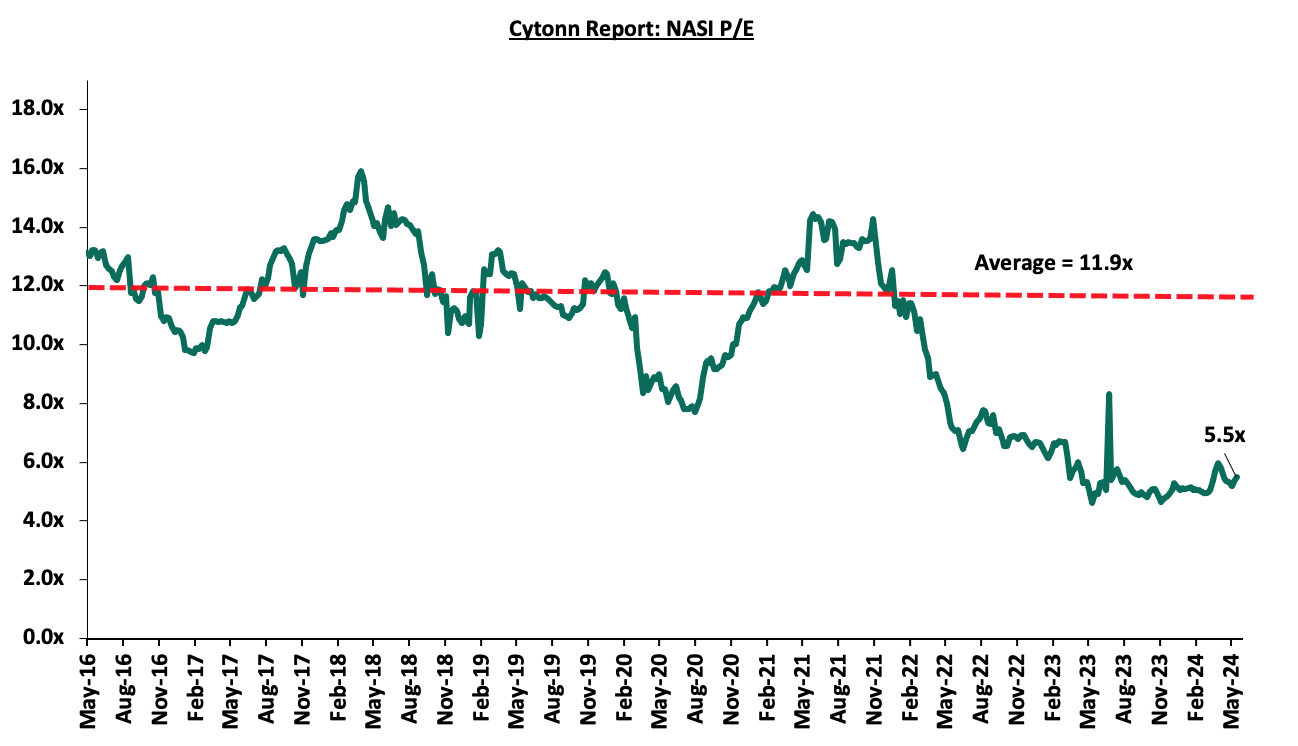
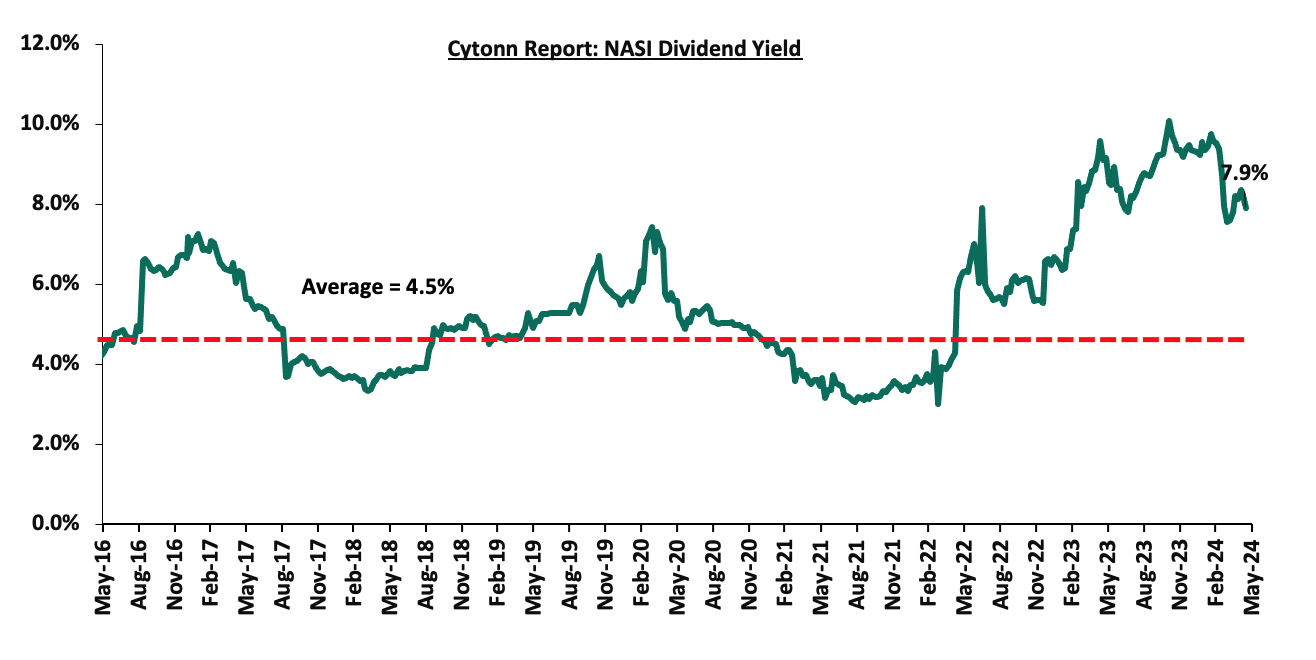
The market is currently trading at a price-to-earnings ratio (P/E) of 5.5x, 54.0% below the historical average of 11.9x. The dividend yield stands at 7.9%, 3.4% points above the historical average of 4.5%. Key to note, NASI’s PEG ratio currently stands at 0.7x, an indication that the market is undervalued relative to its future growth. A PEG ratio greater than 1.0x indicates the market is overvalued while a PEG ratio less than 1.0x indicates that the market is undervalued. The charts below indicate the historical P/E and dividend yields of the market:
Universe of Coverage:
|
Cytonn Report: Equities Universe of Coverage |
|||||||||
|
Company |
Price as at 09/05/2024 |
Price as at 17/05/2024 |
w/w change |
YTD Change |
Target Price* |
Dividend Yield |
Upside/ Downside** |
P/TBv Multiple |
Recommendation |
|
NCBA*** |
38.2 |
38.3 |
0.3% |
(1.4%) |
55.2 |
12.4% |
56.5% |
0.7x |
Buy |
|
Jubilee Holdings |
178.0 |
176.0 |
(1.1%) |
(4.9%) |
260.7 |
6.8% |
54.9% |
0.3x |
Buy |
|
Co-op Bank*** |
12.1 |
12.8 |
5.8% |
12.3% |
17.2 |
11.8% |
46.7% |
0.6x |
Buy |
|
ABSA Bank*** |
12.4 |
13.0 |
4.9% |
12.1% |
17.3 |
12.0% |
45.6% |
1.0x |
Buy |
|
Equity Group*** |
41.9 |
44.9 |
7.0% |
31.1% |
60.2 |
8.9% |
43.1% |
0.9x |
Buy |
|
Diamond Trust Bank*** |
50.0 |
50.0 |
0.0% |
11.7% |
65.2 |
10.0% |
40.4% |
0.2x |
Buy |
|
I&M Group*** |
17.6 |
18.1 |
2.8% |
3.7% |
22.5 |
14.1% |
38.4% |
0.4x |
Buy |
|
Sanlam |
6.5 |
6.4 |
(1.5%) |
6.3% |
8.8 |
0.0% |
38.1% |
1.8x |
Buy |
|
Standard Chartered*** |
176.3 |
185.0 |
5.0% |
15.4% |
225.2 |
15.7% |
37.4% |
1.2x |
Buy |
|
Kenya Reinsurance |
2.0 |
2.0 |
2.6% |
8.1% |
2.5 |
10.0% |
35.5% |
0.2x |
Buy |
|
CIC Group |
2.1 |
2.3 |
5.1% |
(1.7%) |
2.8 |
5.8% |
30.2% |
0.7x |
Buy |
|
Stanbic Holdings |
125.0 |
124.8 |
(0.2%) |
17.7% |
145.3 |
12.3% |
28.8% |
0.8x |
Buy |
|
KCB Group*** |
30.1 |
31.9 |
6.0% |
45.1% |
40.2 |
0.0% |
26.2% |
0.5x |
Buy |
|
Liberty Holdings |
5.4 |
5.5 |
2.6% |
42.5% |
6.1 |
6.8% |
17.7% |
0.4x |
Accumulate |
|
Britam |
5.3 |
5.6 |
5.3% |
8.9% |
6.5 |
0.0% |
16.1% |
0.8x |
Accumulate |
|
HF Group |
4.4 |
4.3 |
(1.1%) |
25.5% |
4.6 |
0.0% |
6.9% |
0.2x |
Hold |
Weekly Highlights
Earnings Release
- Cooperative Bank of Kenya Q1’2024 Financial Performance
During the week, Co-op Bank Kenya released their Q1’2024 financial results. Below is a summary of the performance.
|
Balance Sheet Items |
Q1'2023 |
Q1'2024 |
y/y change |
|
Government Securities |
179.2 |
200.2 |
11.7% |
|
Net Loans and Advances |
360.1 |
378.1 |
5.0% |
|
Total Assets |
631.1 |
714.7 |
13.2% |
|
Customer Deposits |
419.8 |
481.8 |
14.8% |
|
Total Liabilities |
518.2 |
589.0 |
13.7% |
|
Shareholders Funds |
112.6 |
127.1 |
12.9% |
|
Balance Sheet Ratios |
Q1'2023 |
Q1'2024 |
% points change |
|
Loan to Deposit Ratio |
85.8% |
78.5% |
(7.3%) |
|
Government Securities to Deposits Ratio |
42.7% |
41.6% |
(1.1%) |
|
Return on average equity |
20.7% |
19.7% |
(1.0%) |
|
Return on average assets |
3.6% |
3.5% |
(0.1%) |
|
Income Statement |
Q1'2023 |
Q1'2024 |
y/y change |
|
Net Interest Income |
10.8 |
11.7 |
8.6% |
|
Non-Interest Income |
7.1 |
7.1 |
(0.3%) |
|
Total Operating income |
17.9 |
18.8 |
5.1% |
|
Loan Loss provision |
(1.5) |
(1.6) |
3.9% |
|
Total Operating expenses |
(9.8) |
(9.9) |
0.5% |
|
Profit before tax |
8.1 |
9.0 |
10.6% |
|
Profit after tax |
6.1 |
6.6 |
7.7% |
|
Core EPS |
1.0 |
1.1 |
7.7% |
|
Income Statement Ratios |
Q1'2023 |
Q1'2024 |
% points Change |
|
Yield from interest-earning assets |
11.7% |
12.3% |
0.6% |
|
Cost of funding |
3.7% |
5.1% |
1.4% |
|
Net Interest Spread |
8.1% |
7.3% |
(0.8%) |
|
Net Interest Income as % of operating income |
60.3% |
62.3% |
2.0% |
|
Non-Funded Income as a % of operating income |
39.7% |
37.7% |
(2.0%) |
|
Cost to Income |
54.9% |
52.5% |
(2.4%) |
|
CIR without provisions |
46.3% |
44.1% |
(2.3%) |
|
Cost to Assets |
1.3% |
1.2% |
(0.1%) |
|
Net Interest Margin |
8.5% |
7.8% |
(0.7%) |
|
Capital Adequacy Ratios |
Q1'2023 |
Q1'2024 |
% points change |
|
Core Capital/Total deposit Liabilities |
22.7% |
22.3% |
(0.4%) |
|
Minimum Statutory ratio |
8.0% |
8.0% |
|
|
Excess |
14.7% |
14.3% |
(0.4%) |
|
Core Capital/Total Risk Weighted Assets |
16.3% |
18.2% |
1.9% |
|
Minimum Statutory ratio |
10.5% |
10.5% |
|
|
Excess |
5.8% |
7.7% |
1.9% |
|
Total Capital/Total Risk Weighted Assets |
17.2% |
21.6% |
4.4% |
|
Minimum Statutory ratio |
14.5% |
14.5% |
|
|
Excess |
2.7% |
7.1% |
4.4% |
|
Liquidity Ratio |
50.6% |
52.0% |
1.4% |
|
Minimum Statutory ratio |
20.0% |
20.0% |
|
|
Excess |
30.6% |
32.0% |
1.4% |
Key Take-Outs:
- Increased earnings - Core earnings per share (EPS) grew by 7.7% to Kshs 1.1, from Kshs 1.0 in Q1’2023, driven by the 24.2% growth in funded income to Kshs 12.5 bn from Kshs 10.0 bn in Q1’2023,
- Declined asset quality – The bank’s gross NPL ratio increased to 15.9% in Q1’2024, from 14.1% in Q1’2023, 19.4% increase in Gross non-performing loans to Kshs 66.5 bn, from Kshs 55.7 bn in Q1’2023, compared to the 5.7% increase in gross loans to Kshs 417.1 bn, from Kshs 394.7 bn recorded in Q1’2023, and,
- Expanded Balanced sheet - The balance sheet recorded an expansion as total assets grew by 13.2% to Kshs 714.7 bn, from Kshs 631.1 bn in Q1’2024, driven by a 5.0% increase in net loans and advances to Kshs 378.1 bn, from Kshs 360.1 bn in Q1’2023, coupled with an 11.7% increase in investment in government securities to Kshs 200.2 bn, from Kshs 179.2 bn in Q1’2023.
For a more detailed analysis, please see the Co-op Bank’s Q1’2024 Earnings Note
- Equity Group Q1’2024 Financial Performance
During the week, Equity Bank Kenya released their Q1’2024 financial results. Below is a summary of the performance.
|
Balance Sheet Items |
Q1'2023 |
Q1'2024 |
y/y change |
|
Government Securities |
216.0 |
250.9 |
16.2% |
|
Net Loans and Advances |
756.3 |
779.2 |
3.0% |
|
Total Assets |
1537.7 |
1685.9 |
9.6% |
|
Customer Deposits |
1111.2 |
1236.3 |
11.3% |
|
Deposits per branch |
3.3 |
3.5 |
5.9% |
|
Total Liabilities |
1347.0 |
1467.1 |
8.9% |
|
Shareholders’ Funds |
183.8 |
210.9 |
14.8% |
|
Balance Sheet Ratios |
Q1'2023 |
Q1'2024 |
% points change |
|
Loan to Deposit Ratio |
68.1% |
63.0% |
(5.1%) |
|
Government Securities to Deposits |
28.6% |
32.2% |
3.6% |
|
Return on average equity |
26.8% |
23.8% |
(3.0%) |
|
Return on average assets |
3.4% |
2.9% |
(0.5%) |
|
Income Statement |
Q1'2023 |
Q1'2024 |
y/y change |
|
Net Interest Income |
21.7 |
27.8 |
28.4% |
|
Net non-Interest Income |
18.4 |
22.2 |
21.0% |
|
Total Operating income |
40.1 |
50.1 |
25.0% |
|
Loan Loss provision |
(3.5) |
(6.1) |
74.5% |
|
Total Operating expenses |
(23.2) |
(29.7) |
27.9% |
|
Profit before tax |
16.9 |
20.4 |
20.9% |
|
Profit after tax |
12.8 |
16.0 |
25.2% |
|
Core EPS |
3.4 |
4.2 |
25.2% |
|
Income Statement Ratios |
Q1'2023 |
Q1'2024 |
% points change |
|
Yield from interest-earning assets |
10.5% |
12.3% |
1.9% |
|
Cost of funding |
3.2% |
4.2% |
1.0% |
|
Cost of risk |
8.7% |
12.1% |
3.4% |
|
Net Interest Margin |
7.4% |
8.2% |
0.8% |
|
Net Interest Income as % of operating income |
54.1% |
55.6% |
1.5% |
|
Non-Funded Income as a % of operating income |
45.9% |
44.4% |
(1.5%) |
|
Cost to Income Ratio |
57.9% |
59.2% |
1.4% |
|
CIR without LLP |
49.2% |
47.1% |
(2.1%) |
|
Cost to Assets |
1.4% |
1.5% |
0.1% |
|
Capital Adequacy Ratios |
Q1'2023 |
Q1'2024 |
% Points Change |
|
Core Capital/Total Liabilities |
17.7% |
17.1% |
(0.6%) |
|
Minimum Statutory ratio |
8.0% |
8.0% |
0.0% |
|
Excess |
9.7% |
9.1% |
(0.6%) |
|
Core Capital/Total Risk Weighted Assets |
15.5% |
15.9% |
0.4% |
|
Minimum Statutory ratio |
10.5% |
10.5% |
0.0% |
|
Excess |
5.0% |
5.4% |
0.4% |
|
Total Capital/Total Risk Weighted Assets |
19.8% |
19.3% |
(0.5%) |
|
Minimum Statutory ratio |
14.5% |
14.5% |
0.0% |
|
Excess |
5.3% |
4.8% |
(0.5%) |
|
Liquidity Ratio |
51.5% |
52.1% |
0.6% |
|
Minimum Statutory ratio |
20.0% |
20.0% |
0.0% |
|
Excess |
31.5% |
32.1% |
0.6% |
Key Take-Outs:
- Increase in Earnings - Core earnings per share increased by 25.2% to Kshs 4.2 from Kshs 3.4 in Q1’2024, mainly driven by the 25.0% growth in total operating income to Kshs 50.1 bn, from Kshs 40.1 bn in Q1’2023. However, the performance was weighed down by a 27.9% growth in total operating expenses to Kshs 29.7 bn, from Kshs 23.2 bn in Q1’2023, and,
- Increased Provisioning – On the back of high credit risk still attached to the country despite improvement in the business environment in Q1’2024, the bank increased its provisions holdings to cover for the anticipated losses in the future, with its general provisions increasing significantly by 44.6% to Kshs 49.7 bn from Kshs 34.4 bn recorded in Q1’2023.
For a more detailed analysis, please see the Equity Group’s Q1’2024 Earnings Note
Asset Quality:
The table below shows the asset quality of listed banks that have released their Q1’2024 results using several metrics:
|
Cytonn Report: Listed Banks Asset Quality in Q1’2024 |
||||||
|
|
Q1'2024 NPL Ratio* |
Q1'2023 NPL Ratio** |
% point change in NPL Ratio |
Q1'2024 NPL Coverage* |
Q1'2023 NPL Coverage** |
% point change in NPL Coverage |
|
Stanbic Bank |
8.9% |
11.7% |
(2.9%) |
72.3% |
66.7% |
5.6% |
|
Equity Group |
14.2% |
10.0% |
4.2% |
58.3% |
62.0% |
(3.8%) |
|
Co-operative Bank of Kenya |
15.9% |
14.1% |
1.8% |
58.6% |
62.2% |
(3.6%) |
|
Mkt Weighted Average* |
13.7% |
12.6% |
1.1% |
60.7% |
63.7% |
(3.0%) |
|
*Market cap weighted as at 17/05/2024 |
||||||
|
**Market cap weighted as at 15/06/2023 |
||||||
Key take-outs from the table include;
- Asset quality for the listed banks that have released declined during Q1’2024, with market-weighted average NPL ratio increasing by 1.1% points to 13.7% from 12.6% in Q1’2023, and,
- Market-weighted average NPL Coverage for the listed banks decreased by 3.0% points to 60.7% in Q1’2024 from 63.7% recorded in Q1’2023. The decrease was attributable to Equity Group’s coverage ratio decreasing by 3.8% to 58.3% from 62.0% in Q1’2023, coupled with Co-operative Bank’s NPL coverage ratio decreasing by 3.6% points to 58.6% from 62.2% in Q1’2023. The performance was however supported by Stanbic Bank’s NPL Coverage ratio increasing by 5.6% to 72.3% from 66.7% in Q1’2023.
Summary Performance
The table below shows the performance of listed banks that have released their Q1’2024 results using several metrics:
|
Cytonn Report: Listed Banks Performance in Q1’2024 |
||||||||||||
|
Bank |
Core EPS Growth |
Interest Income Growth |
Interest Expense Growth |
Net Interest Income Growth |
Net Interest Margin |
Non-Funded Income Growth |
NFI to Total Operating Income |
Deposit Growth |
Growth in Government Securities |
Loan to Deposit Ratio |
Loan Growth |
Return on Average Equity |
|
Stanbic Holdings |
2.8% |
53.9% |
130.2% |
19.6% |
8.4% |
(34.0%) |
36.9% |
22.2% |
(28.4%) |
71.9% |
11.1% |
20.8% |
|
Equity Group |
25.2% |
32.7% |
41.4% |
28.4% |
8.2% |
21.0% |
44.4% |
11.3% |
16.2% |
63.0% |
3.0% |
23.8% |
|
Co-operative Bank of Kenya |
7.7% |
24.7% |
60.8% |
8.6% |
7.8% |
(0.3%) |
37.7% |
14.8% |
11.7% |
78.5% |
5.0% |
19.7% |
|
Q1'24 Mkt Weighted Average* |
17.0% |
34.2% |
61.2% |
21.9% |
8.1% |
6.3% |
41.4% |
14.0% |
7.5% |
68.5% |
4.9% |
22.3% |
|
Q1'23 Mkt Weighted Average** |
25.0% |
26.2% |
40.2% |
20.1% |
7.3% |
48.1% |
41.3% |
19.0% |
(1.2%) |
73.1% |
19.6% |
22.1% |
Key take-outs from the table include:
- The listed banks recorded a 17.0% growth in core Earnings per Share (EPS) in Q1’2024, compared to the weighted average growth of 25.0% in Q1’2024, an indication of declined performance attributable to the tough operating environment during the quarter,
- Non-Funded Income grew by 6.3% compared to market-weighted average growth of 48.1% in Q1’2023, despite the increased revenue diversification efforts by the banks, and,
- The Banks recorded a weighted average deposit growth of 14.0%, lower than the market-weighted average deposit growth of 19.0% in Q1’2023.
- CIC Group Ltd FY’2023 Financial Results.
During the week, CIC Group released their FY’2023 results. This was the second time the company was releasing their results under the new IFRS 17 reporting system. CIC’s Profit After Tax (PAT) increased by 817.6% to Kshs 1.4 bn, from Kshs 0.2 bn recorded in FY’2022. The performance was mainly driven by a 242.3% increase in insurance service results previously disclosed as net earned premiums to Kshs 0.8 bn, compared to a negative of Kshs 0.6 bn in FY’2022, coupled with a 24.4% increase in net investment income to Kshs 2.2 bn, from Kshs 1.8 bn in FY’2022. The 242.3% increase in insurance service result was due to a 22.5% increase in Insurance revenue to Kshs 25.4 bn, from Kshs 20.7 bn in FY’2022, but was weighed down by the 21.2% increase in Insurance Expenses to Kshs 22.5 bn in FY’2023, from Kshs 18.6 bn in FY’2022
|
Cytonn Report: CIC Group Income Statement |
|||
|
Item (All figures in Bns) |
FY'2022 |
FY'2023 |
y/y change |
|
Insurance Revenue |
20.7 |
25.4 |
22.5% |
|
Insurance service expenses |
(18.6) |
(22.5) |
21.2% |
|
Net expenses from reinsurance contracts held |
(2.7) |
(2.1) |
(23.1%) |
|
Net Insurance income |
(0.6) |
0.8 |
242.3% |
|
Investment Income |
2.6 |
2.9 |
14.4% |
|
Net Financial result |
1.8 |
2.2 |
24.4% |
|
Other Income |
0.2 |
0.4 |
65.1% |
|
Operating Profit |
1.3 |
3.1 |
143.4% |
|
Profit Before Tax |
0.8 |
2.5 |
209.0% |
|
Profit After Tax |
0.2 |
1.4 |
817.6% |
|
Cytonn Report: CIC Group Balance Sheet |
|||
|
Item (All figures in Bns) |
FY'2022 |
FY'2023 |
y/y change |
|
Investment assets |
7.8 |
7.8 |
0.9% |
|
Property & Equipment and Intangibles |
1.3 |
1.4 |
13.5% |
|
Total Assets |
43.5 |
50.3 |
15.7% |
|
Insurance Contract Liabilities |
29.0 |
34.2 |
17.9% |
|
Provisions & other payables |
2.4 |
3.2 |
37.0% |
|
Total liabilities |
36.1 |
42.7 |
18.2% |
|
Shareholder funds |
7.4 |
7.7 |
3.9% |
|
Minority Interest |
(0.03) |
(0.08) |
151.3% |
|
Total Equity |
7.4 |
7.6 |
3.3% |
key take-outs from the results include:
- Core Earnings Per share increased by 817.6% to Kshs 0.6 from Kshs 0.1 in FY’2022, driven by the 22.5% increase in Insurance revenue to Kshs 25.4 bn, from Kshs 20.7 bn in FY’2022, coupled with 24.4% increase in net financial result to Kshs 2.2 bn from Kshs 1.8 bn in FY’2022, which outpaced the 21.2% increase in insurance services expenses to Kshs 22.5 bn from Kshs 18.6 bn in FY’2022,
- Net financial result increased by 24.4% to Kshs 2.2 bn in FY’2023, from Kshs 1.8 bn in FY’2022. This was majorly attributable to the 14.4% increase in investment return to 2.9 bn from Kshs 2.6 bn in FY’2022, coupled with the 17.5% increase in net finance income from reinsurance contracts to Kshs 0.2 bn from Kshs 0.1 bn in FY’2022,
- Insurance revenue increased by 22.5% to Kshs 25.4 bn in FY’2023 from Kshs 20.7 bn in FY’2022, while insurance expenses increased by 21.2% to Kshs 22.5 bn from Kshs 18.6 bn in FY2022, and the net expenses from reinsurance contracts held decreased by 23.1% to Kshs 2.1 bn, from Kshs 2.7 bn in FY’2022. This translated to a Net insurance service result increase of 242.3% to Kshs 0.8 bn from Kshs 0.6 bn in FY’2022,
- The balance sheet recorded an expansion as total assets increased by 15.7% to Kshs 50.3 bn in FY’2023 from Kshs 43.5 bn in FY’2022 mainly driven by 13.5% increase property & equipment and intangibles to Kshs 1.4 bn from Kshs 1.3 bn in FY’2022, coupled with 21.8% increase in financial investment assets to Kshs 34.2 bn from Kshs 28.0 bn in FY’2022, and.
- Total liabilities increased by 18.2% to Kshs 42.7 bn from Kshs 36.1 bn in FY’2022, majorly on the back of Insurance contract liabilities 17.9% increase to Kshs 34.2 bn from Kshs 29.0 bn in FY’2022, coupled with the 37.0% increase in provisions and other payables to Kshs 3.2 bn from Kshs 2.4 bn in FY’2022.
Other highlights from the release include:
- Declaration of dividends – The Group’s board of directors declared the first and final dividend of Kshs 0.13 for the FY’2023, translating to a dividend yield of 5.8% and a dividend payout of 23.6%.
Key to note, the Group also restated its FY’2022 financial results to align with the new reporting standards (IFRS 17). The new standard demands that insurers measure insurance contracts using updated estimates and assumptions that reflect the timing of cashflows and any uncertainty relating to insurance contracts. Going forward, the Group’s earnings will be boosted by its improved performance in both the life and general insurance segments. This is indicated by CIC Life Assurance posting Kshs 872.9 mn net profit compared to a net loss of Kshs 278.7 mn in FY’2022, while the General Insurance net profit came in at Kshs 911.1 mn, from Kshs 359.6 mn in FY’2022.
We are “Neutral” on the Equities markets in the short term due to the current tough operating environment and huge foreign investor outflows, and, “Bullish” in the long term due to current cheap valuations and expected global and local economic recovery. With the market currently being undervalued for its future growth (PEG Ratio at 0.6x), we believe that investors should reposition towards value stocks with strong earnings growth and that are trading at discounts to their intrinsic value. We expect the current high foreign investors’ sell-offs to continue weighing down the equities outlook in the short term.
- Statutory Review
The National Treasury tabled the Finance Bill 2024, which addresses several key areas impacting taxation, housing, and infrastructure financing. The aim of the bill is to introduce amendments and proposals aimed at refining the taxation system, several of which tie in enhancing infrastructure financing and advancing housing initiatives in Kenya.
Key highlights from the bill include:
- Taxation on Infrastructure Bonds: One notable proposal is the introduction of withholding tax on interest earned from infrastructure bonds (IFBs) with tenures of at least 3 years. Currently, interest income from IFBs is tax-free, making them an attractive investment option. However, if the bill passes through Parliament, future infrastructure bonds will attract a withholding tax rate of 5% on interest income. While the proposed tax rate remains relatively lower compared to regular bonds, the introduction of withholding tax could reduce the attractiveness of IFBs to investors. Additionally, the government's delay in issuing sovereign green bonds, coupled with the potential taxation of IFBs, may lead investors to shift their focus to green bonds once they are launched. Currently, the only listed issuer of green bonds on the Nairobi Securities Exchange (NSE) has been Acorn Holdings, which issued a 5-year green bond in 2019 with a coupon of 25%. Despite these challenges, recent IFB issuances by the Central Bank of Kenya (CBK) have seen significant oversubscription, indicating continued investor interest in these instruments. However, the imposition of withholding tax may impact investor sentiment and demand for IFBs in the future,
- Housing Levy Contributions Relief: The bill suggests a relief of 15% on housing levy contributions, expanding the number of rebates available to employees. The relief is entitled to those saving for a purchase under an approved affordable housing scheme. Employees earning a gross salary will benefit from the relief, which will marginally reduce their taxable pay. For instance, an employee contributing to the housing levy stands to earn a relief of up to Ksh 108,000 p.a, depending on their salary bracket. The table below illustrates how the relief on housing levy contributions is calculated based on different gross monthly salaries, showcasing the impact of the proposed 15% relief on employees' taxable income;
|
Gross Monthly Salary (Ksh) |
Housing Levy Contribution (1.5%) |
Annual Contribution (Ksh) |
Relief (15% of Contribution) |
|
50,000 |
750 |
9,000 |
1,350 |
|
|
|
|
|
|
75,000 |
1,125 |
13,500 |
2,025 |
|
100,000 |
1,500 |
18,000 |
2,700 |
|
500,000 |
7,500 |
90,000 |
13,500 |
|
1,000,000 |
15,000 |
180,000 |
27,000 |
|
2,000,000 |
30,000 |
360,000 |
54,000 |
|
3,000,000 |
45,000 |
540,000 |
81,000 |
|
4,000,000 |
60,000 |
720,000 |
108,000 |
|
5,000,000 |
75,000 |
900,000 |
108,000 |
The affordable housing levy, legislated through the 2024 Affordable Housing Act, aims to provide resources for the development and access to affordable housing. The levy, which is set at 1.5% of the employee's total gross monthly salary, is expected to generate significant revenue for the affordable housing program,
- Deletion of Section 54 of the Affordable Housing Act 2024: The bill also proposes amendments to section 54 of the Affordable Housing Act 2024 by deleting it. This section currently states that, "Except with the prior written consent of the Board, a purchaser of an affordable housing unit under this Act shall not by contract, agreement or otherwise, sell or agree to sell his or her unit or any interest therein to any other person." The proposed deletion aims to clean up the provision following the advisory given by the Attorney General, abd,
- Family Trust: The Finance Bill of 2024 outlines tax regulations concerning the income or principal sum of a registered family trust. Previously, there existed an exemption for capital gains arising from the transfer of title of immovable property to a family trust, but this exemption has been removed from the bill. Additionally, the bill includes provisions regarding the withdrawal of funds from the National Housing Development Fund for the purchase of a house by a first-time homeowner who is a contributor to the fund, aligning it with family trust regulations.
- Commercial Office Sector
During the week, Gateway Real Estate Africa, a subsidiary of London-listed Grit Real Estate Income Group, unveiled a significant development in Kenya's real estate landscape. The project, named Eneo, is a state-of-the-art Business Process Outsourcing (BPO) facility located within the Tatu City Special Economic Zone (SEZ). Comprising 2 towers with a combined gross lettable area of approximately 26,000 SQM, Eneo boasts modern amenities and interconnected retail spaces, including a grocer, restaurants, pharmacy, and convenience retail shops. Additionally, Eneo is designed to offer green design principles. Incorporating sustainability elements such as eco-conscious designs and natural lighting ensures environmental responsibility while enhancing the quality of life for occupants.
This development is poised to have a transformative impact on the local economy and job market. With more than 1,300 employment opportunities created during the construction phase alone, Eneo is expected to generate additional employment opportunities in the BPO sector upon its completion. Moreover, the facility is custom-designed for CCI Global, Africa's largest international contact center specializing in Business Process Outsourcing, further solidifying Kenya's position as a hub for BPO operations in the region.
We expect the unveiling of Eneo at Tatu City to catalyze further growth and investment in Kenya's commercial office real estate sector. As Kenya's Special Economic Zones continue to attract new entrants and drive investor confidence, the Eneo facility stands as a testament to the country's growing potential as a hub for global business services.
- Real Estate Investments Trusts (REITs)
On the Unquoted Securities Platform, Acorn D-REIT and I-REIT traded at Kshs 24.5 and Kshs 22.0 per unit, respectively, as of 9th May 2024. The performance represented a 22.5% and 10.0% gain for the D-REIT and I-REIT, respectively, from the Kshs 20.0 inception price. The volumes traded for the D-REIT and I-REIT came in at 12.3 mn and 30.7 mn shares, respectively, with a turnover of Kshs 257.5 mn and Kshs 633.8 mn, respectively, since inception in February 2021.
REITs provide various benefits like tax exemptions, diversified portfolios, and stable long-term profits. However, the continuous deterioration in the performance of Kenyan REITs and the restructuring of their business portfolios is hampering major investments that had previously been made. The other general challenges include; i) inadequate comprehension of the investment instrument among investors, ii) prolonged approval processes for REIT creation, iii) high minimum capital requirements of Kshs 100.0 mn for trustees, and, iv) minimum investment amounts set at Kshs 5.0 mn, continue to limit the performance of the Kenyan REITs market.
We expect the performance of Kenya’s real estate sector to be supported by: i) increased investment by local and international players, ii) Nairobi’s recognized position as a regional hub, which will spur growth, especially in the commercial office sector, iii) relatively positive demographics in the country necessitating demand for housing and real estate, and iv) continued infrastructural improvements opening up new areas for investments. However, factors such as rising construction costs, strain on infrastructure development like drainage systems, limited investor knowledge in REITs, and existing oversupply in select real estate sectors will continue to hinder the optimal performance of the sector by limiting developments and investments.
Introduction
Joint Ventures (JVs) can be defined as strategic arrangements between two or more businesses, where resources are pooled to work together on a project. Joint ventures are vital in bringing together businesses from different areas of expertise for business purposes. JVs can take many forms such as; i) limited liability company- in the case where the project will incur a lot of capital, the party may decide to form a new company for this purpose, mostly referred to as a ‘special purpose vehicle’. The new company will be a separate legal entity, ii) a partnership, and, iii) a contractual joint venture- two or more parties collaborate or share knowledge and expertise on an ongoing basis, here an agreement is well drafted.
To put this into context, let’s say a company, Company A, has extensive expertise in Real Estate and has delivered many successful projects. Another company, Company B, owns a well-situated piece of land in an area where Company A has previously delivered a successful project. Company B wants to develop this land. In this case, Companies A and B can enter into a joint venture where Company A will provide expertise, and Company B will provide capital for the project.
JVs in many cases, the operating member and the capital member of a Real Estate joint venture establish the project as an independent limited liability company (LLC). They sign a joint venture agreement outlining the terms and conditions, including the venture’s objective, the capital member’s contribution, profit-sharing arrangements, management responsibilities, ownership rights, and more. It is important to note that a Real Estate joint venture is not limited to an LLC. It can also be structured as a corporation, partnership, or other business arrangement. The specific structure of the JV defines the relationship between the operator and the capital provider.
In Real Estate, multiple parties can collaborate and combine resources to develop a project. Some of the largest Real Estate projects are financed and developed through joint ventures. Joint ventures allow parties with extensive experience in managing Real Estate projects to work with capital providers who have the financial capacity to fund these projects. This week, we shall focus on joint venture arrangements in Real Estate. We shall discuss the following;
- Joint Venture Process,
- Things to Consider in Joint Ventures,
- Benefits of Joint Venture Agreements, and,
- Conclusion,

Disclaimer: The views expressed in this publication are those of the writers where particulars are not warranted. This publication, which is in compliance with Section 2 of the Capital Markets Authority Act Cap 485A, is meant for general information only and is not a warranty, representation, advice or solicitation of any nature. Readers are advised in all circumstances to seek the advice of a registered investment advisor

- Talk to us
- Kenya
- P.O Box 20695 - 00200, Nairobi, Kenya
- Cell +254709101200
- Tel +254709101200
- WhatsApp +254741676635
- United States
- +254709101200
- DOWNLOAD OUR APP
-


- Kenya
- 8th Floor, Pinetree Plaza, Kaburu Drive, Ngong Road, Nairobi, Kenya
- USA
- Suite 1150, 1775 Eye Street NW, USA, Washington DC 20006, USA
- Investments
- High Yield
- Private Equity
- Real Estate
- Real Estate
- RiverRun Estates
- Cytonn Towers
- The Ridge
- Taraji Heights
- The Alma