Kenya Currency & Interest Rates Review 2026, & Cytonn Weekly #06/2026
By Research team, Feb 15, 2026
Executive Summary
Fixed Income
This week, T-bills were oversubscribed for the third consecutive week, with the overall subscription rate coming in at 308.8%, higher than the subscription rate of 267.8% recorded the previous week. Investors’ preference for the shorter 91-day paper waned, with the paper receiving bids worth Kshs 7.2 bn against the Kshs 4.0 bn offered, translating to a subscription rate of 179.5%, lower than the subscription rate of 323.9%, recorded the previous week. The subscription rate for the 182-day paper increased significantly to 68.8% from the 5.0% recorded the previous week, as well as that of the 364-day paper which also increased significantly to 600.5% from 508.3% recorded the previous week. The government accepted a total of Kshs 44.8 bn worth of bids out of Kshs 74.1 bn bids received, translating to an acceptance rate of 60.5%. The yields on the government papers showed a downward trajectory performance with the yield on the 364-day paper decreasing the most by 22.4 bps to 9.0% from 9.2% recorded the previous week, while the yields on the 91-day and 182-day papers decreased by 2.0 bps and 1.8 bps to remain relatively unchanged at 7.6% and 7.8% respectively in comparison to last week;
During the week, the Central Bank of Kenya released the auction results for the re-opened treasury bonds FXD3/2019/015 and FXD1/2018/025 with tenors to maturities of 8.4 years and 17.3 years respectively and fixed coupon rates of 12.3% and 13.4% respectively. The bonds were oversubscribed, with the overall subscription rate coming in at 427.5%, receiving bids worth Kshs 213.7 bn against the offered Kshs 50.0 bn. The government accepted bids worth Kshs 100.5 bn, translating to an acceptance rate of 47.0%. The weighted average yield for the accepted bids for the FXD3/2019/015 and FXD1/2018/025 came in at 12.2% and 13.4% respectively. Notably, the 12.2% on the FXD3/2019/015 was lower than the 12.6% recorded the last time the bond was reopened in November 2025 as well as the 13.4% on FXD1/2018/025 which was also lower than the 14.3% recorded the last time the bond was reopened in July 2025. With the Inflation rate at 4.4% as of January 2026, the real returns of the FXD3/2019/015 and FXD1/2018/025 are 7.8% and 9.0% respectively. Given the 10.0% withholding tax on the bonds, the tax equivalent yields for shorter term bonds with 15.0% withholding tax are 12.9% and 14.2% for the FXD3/2019/015 and FXD1/2018/025 respectively;
The monetary policy committee met on February 10th, 2026, to review the outcome of its previous policy decisions and decided to lower the CBR rate by 25.0 bps to 8.75%, from 9.00% in December 2026. Notably, inflation rates remain anchored and remained within the CBK preferred range of 2.5%-7.5% for the thirty first consecutive month, with a decrease of 0.1% points to 4.4% in January 2026, from 4.5% in December 2025. Key to note, the MPC had cut the CBR rate to 9.00% in the previous meeting in December from 9.25% in October 2025;
During the week, the National Treasury gazetted the revenue and net expenditures for the seventh month of FY’2025/2026, ending 30th January 2026, highlighting that the total revenue collected as at the end of January 2026 amounted to Kshs 1,437.2 bn, equivalent to 52.2% of the original estimates of Kshs 2,754.7 bn for FY’2025/2026 and is 89.4% of the prorated estimates of Kshs 1,606.9 bn;
The National Infrastructure Fund Bill, 2026, seeks to establish a National Infrastructure Fund as a new financing mechanism for Kenya’s priority development projects. The Fund is intended to mobilize private capital and alternative financing sources, including proceeds from state asset sales, to reduce reliance on public debt for infrastructure development. Public hearings are being held across several counties, and written submissions are being accepted ahead of further legislative consideration;
During the week, The Energy and Petroleum Regulatory Authority (EPRA) released their monthly statement on the maximum retail fuel prices in Kenya, effective from 15th February 2026 to 14th March 2026. Notably, the maximum allowed prices for Super Petrol, Diesel and Kerosene decreased by Kshs 4.2, Kshs 3.9 and Kshs 1.0 per litre to Kshs 178.3, Kshs 166.5 and Kshs 152.8 per litre from Kshs 182.5, Kshs 170.5 and Kshs 153.8 per litre respectively in January 2026, the second consecutive decrease in 2026;
Equities
During the week, the equities market was on an upward trajectory, with NSE 20, NSE 25, NSE 10, and NASI gaining by 8.5%, 7.6%, 7.5% and 6.9% respectively, taking the YTD performance to gains of 15.7%, 15.7%, 14.4% and 14.0% for NSE 20, NASI, NSE 25 and NSE 10 respectively. The equities market performance was mainly driven by gains recorded by large cap stocks such as DTB-K, Stanbic and Equity of 18.1%, 16.8% and 12.9% respectively. However, the performance was weighed down by losses recorded by large cap stocks such as NCBA and BAT of 2.7% and 0.4% respectively;
In the regional equities market, the East African Exchanges 20 (EAE 20) share index lost by 0.6%, attributable to losses recorded by large cap stocks such as Bank of Baroda, Tanzania Cigarette Corporation, and Bank of Kigali of 3.6%, 1.9%, and 0.3% respectively. The performance was however, supported by gains recorded by large cap stocks such MTN Uganda, KCB Group, and Tanga Cement of 10.7%, 9.3% and 9.1% respectively;
Additionally, during the week, the banking sector index gained by 8.5% to 237.1 from 218.5 recorded the previous week. This is attributable to gains recorded by stocks such as DTB-K, Stanbic and Equity of 18.1%, 16.8% and 12.9% respectively. However, the performance was weighed down by losses recorded by stocks such as NCBA of 2.7%;
During the week, Kenya Electricity Generating Company (KenGen), released its H1'2026 financial results for the period ended 31st December 2025, recording a profit after tax of Kshs 4.2 bn, a 20.2% decrease from the Kshs 5.3 bn recorded in H1’2025, majorly attributable to the 7.4% increase in operating expenses to Kshs 19.0 bn from Kshs 17.7 bn recorded in H1’2025, which was mainly driven by higher depreciation expense arising from additional asset capitalization as well as increased plant operating and steam costs;
Real Estate
During the week, the National Social Security Fund took a 9.5bn stake in Nairobi-Nakuru toll road, marking its first investment in a public road as part of a diversification strategy. The state-owned pension fund is participating through a consortium with China Road and Bridge Corporation (CRBC), contributing 40.0% of the equity portion for the section of the highway they are developing together. The overall 170.0bn project is split between two Chinese firms with the other section awarded to Shandong Hi-Speed Road and Bridge International Engineering (SDRBI);
On the Unquoted Securities Platform, Acorn D-REIT and I-REIT traded at Kshs 27.4 and Kshs 23.2 per unit, respectively, as per the last updated data on 13th February 2026. Additionally, ILAM Fahari I-REIT traded at Kshs 11.0 per share as of 13th February 2026 representing a 45.0% loss from the Kshs 20.0 inception price;
Focus of the Week
The Kenyan Shilling has experienced a marginal Year-to-Date negligible appreciation of 2.3 bps against the US Dollar, closing the week at Kshs 129.0 as of February 13, 2026, compared to Kshs 129.1 at the beginning of the year. This is an addition to the 22.9 bps appreciation in 2025. The appreciation experienced in 2025 and the current stability of the Shilling is supported by improved forex reserves currently at USD 12.5 bn (equivalent to 5.4-months of import cover), an increase of 33.3% from USD 9.3 bn (equivalent to 4.8-months of import cover) recorded in a similar period in 2025, and an 1.2% increase in diaspora remittances to USD 5,020.7 mn in the twelve months to January 2026 higher than USD 4,960.2 mn recorded in a similar period in 2025. The Kenyan macroeconomic environment challenges have alleviated as evidenced by credit rating outlook revision by Moody’s. In February 2026, Moody’s announced its revision of Kenya’s credit outlook to B3 Stable from Caa1 Positive, on the back of a reduction in near-term default risk and strengthened external liquidity. However, the previous Positive outlook had already indicated a high probability of an upgrade, the move largely formalizes that expectation, while the shift to a Stable outlook signals that further upgrades are unlikely in the near term as risks remain balanced at the new rating level. Fitch Ratings affirmed Kenya's Long-Term Foreign-Currency Issuer Default Rating (IDR) at 'B-' with a Stable Outlook in January 2026. This rating is supported by robust medium-term growth prospects, a diverse economy, continued access to multilateral and bilateral financing and improved external liquidity buffers, despite elevated public debt levels and ongoing fiscal pressures. However, the rating is limited by persistent vulnerabilities such as high external debt service, reliance on concessional borrowing and limited fiscal space. Additionally, an affirmed rating reduces concerns and improves investor confidence, leading to a reduced flight from the local currency. Over the past twelve months, Kenya’s Eurobond Yields have been on a downward trajectory, decreasing by a cumulative average of 247.7 bps reflecting improved investor confidence and a more favourable economic outlook. Investors are getting lower returns due to reduced perceived risks, in turn decreasing demand for foreign currencies and, consequently, the appreciation of the Kenyan Shilling. The currency stability, anchored inflationary pressures, reduced credit risk, coupled with reduced Central Bank Rates has led to decreased yields on government securities.
Investment Updates:
-
Weekly Rates: Cytonn Money Market Fund closed the week at a yield of 11.7 % p.a. To invest, dial *809# or download the Cytonn App from Google Play store here or from the Appstore here;
-
We continue to offer Wealth Management Training every Tuesday, from 7:00 pm to 8:00 pm. The training aims to grow financial literacy among the general public. To register for any of our Wealth Management Trainings, click here;
-
If interested in our Private Wealth Management Training for your employees or investment group, please get in touch with us through wmt@cytonn.com;
-
Cytonn Insurance Agency acts as an intermediary for those looking to secure their assets and loved ones’ future through insurance namely; Motor, Medical, Life, Property, WIBA, Credit and Fire and Burglary insurance covers. For assistance, get in touch with us through insuranceagency@cytonn.com;
-
Cytonn Asset Managers Limited (CAML) continues to offer pension products to meet the needs of both individual clients who want to save for their retirement during their working years and Institutional clients that want to contribute on behalf of their employees to help them build their retirement pot. To more about our pension schemes, kindly get in touch with us through pensions@cytonn.com;
Hospitality Updates:
-
We currently have promotions for Staycations. Visit cysuites.com/offers for details or email us at sales@cysuites.com;
Money Markets, T-Bills Primary Auction:
This week, T-bills were oversubscribed for the third consecutive week, with the overall subscription rate coming in at 308.8%, higher than the subscription rate of 267.8% recorded the previous week. Investors’ preference for the shorter 91-day paper waned, with the paper receiving bids worth Kshs 7.2 bn against the Kshs 4.0 bn offered, translating to a subscription rate of 179.5%, lower than the subscription rate of 323.9%, recorded the previous week. The subscription rate for the 182-day paper increased significantly to 68.8% from the 5.0% recorded the previous week, as well as that of the 364-day paper which also increased significantly to 600.5% from 508.3% recorded the previous week. The government accepted a total of Kshs 44.8 bn worth of bids out of Kshs 74.1 bn bids received, translating to an acceptance rate of 60.5%. The yields on the government papers showed a downward trajectory performance with the yield on the 364-day paper decreasing the most by 22.4 bps to 9.0% from 9.2% recorded the previous week, while the yields on the 91-day and 182-day papers decreased by 2.0 bps and 1.8 bps to remain relatively unchanged at 7.6% and 7.8% respectively in comparison to last week.
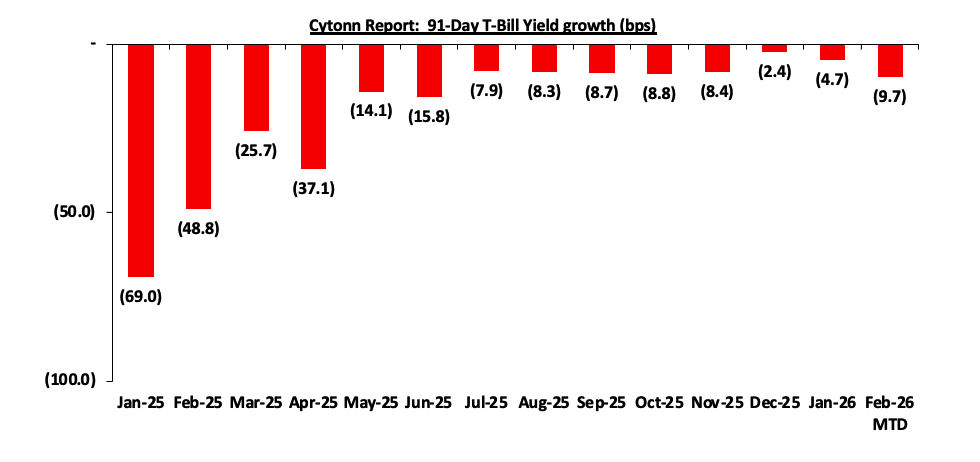
The chart below shows the yield growth rate for the 91-day paper from January 2024 to date:
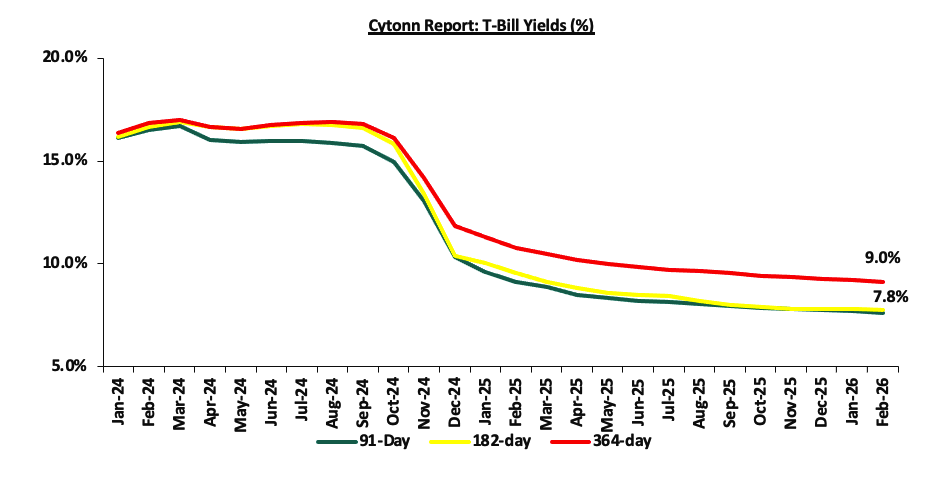
The charts below show the performance of the 91-day, 182-day and 364-day papers from January 2025 to February2026
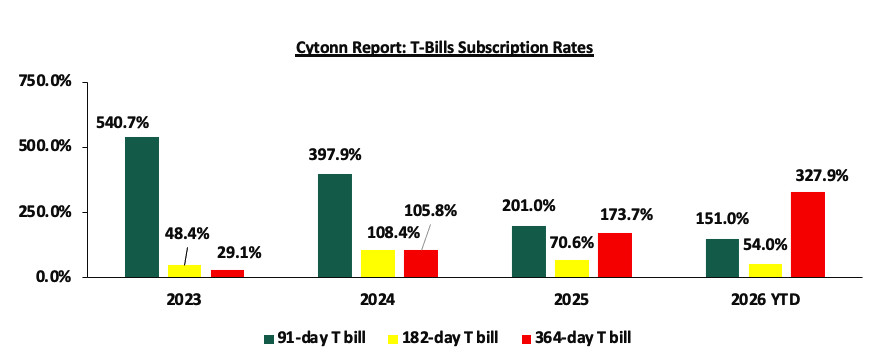
The chart below compares the overall average T-bill subscription rates obtained in 2023, 2024, 2025 and 2026 Year-to-date (YTD):
The Central Bank of Kenya released the auction results for the re-opened treasury bonds FXD3/2019/015 and FXD1/2018/025 with tenors to maturities of 8.4 years and 17.3 years respectively and fixed coupon rates of 12.3% and 13.4% respectively. The bonds were oversubscribed, with the overall subscription rate coming in at 427.5%, receiving bids worth Kshs 213.7 bn against the offered Kshs 50.0 bn. The government accepted bids worth Kshs 100.5 bn, translating to an acceptance rate of 47.0%. The weighted average yield for the accepted bids for the FXD3/2019/015 and FXD1/2018/025 came in at 12.2% and 13.4% respectively. Notably, the 12.2% on the FXD3/2019/015 was lower than the 12.6% recorded the last time the bond was reopened in November 2025 as well as the 13.4% on FXD1/2018/025 which was also lower than the 14.3% recorded the last time the bond was reopened in July 2025. With the Inflation rate at 4.4% as of January 2026, the real returns of the FXD3/2019/015 and FXD1/2018/025 are 7.8% and 9.0% respectively. Given the 10.0% withholding tax on the bonds, the tax equivalent yields for shorter term bonds with 15.0% withholding tax are 12.9% and 14.2% for the FXD3/2019/015 and FXD1/2018/025 respectively.
Money Market Performance:
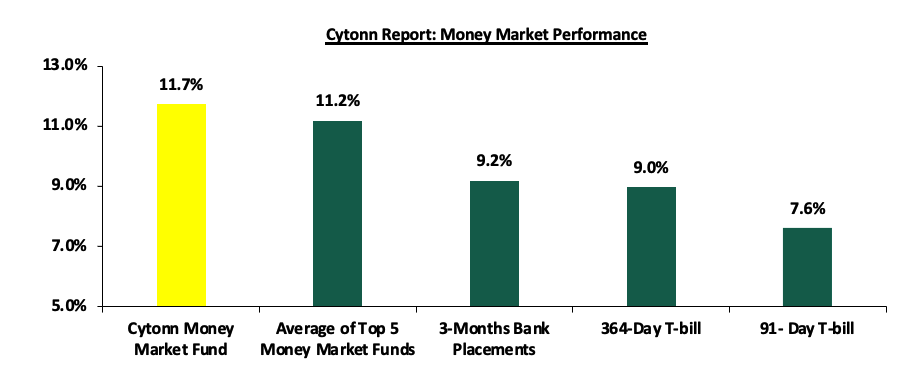
In the money markets, 3-month bank placements ended the week at 9.2% (based on rates offered by various banks), while yields on government papers recorded a downward performance, with the 364-day paper declining the most by 22.4 bps to 9.0% from 9.2% the previous week, and the 91-day paper decreasing marginally by 2.0 bps to remain relatively unchanged at 7.6% in comparison to last week. The yield on the Cytonn Money Market Fund decreased by 7.0 bps to 11.7% from 11.8% the previous week, while the average yields on the Top 5 Money Market Funds declined by 36.8 bps to 11.2% from 11.6% recorded the previous week.
The table below shows the Money Market Fund Yields for Kenyan Fund Managers as published on 13th February 2026:
|
Money Market Fund Yield for Fund Managers as published on 13th February 2026 |
||
|
Rank |
Fund Manager |
Effective Annual Rate |
|
1 |
Cytonn Money Market Fund ( Dial *809# or download Cytonn App) |
11.7% |
|
2 |
Arvocap Money Market Fund |
11.3% |
|
3 |
Nabo Africa Money Market Fund |
11.1% |
|
4 |
Enwealth Money Market Fund |
10.9% |
|
5 |
Lofty-Corban Money Market Fund |
10.9% |
|
6 |
Gulfcap Money Market Fund |
10.8% |
|
7 |
Ndovu Money Market Fund |
10.5% |
|
8 |
Etica Money Market Fund |
10.5% |
|
9 |
Jubilee Money Market Fund |
10.4% |
|
10 |
Kuza Money Market fund |
10.4% |
|
11 |
Old Mutual Money Market Fund |
10.1% |
|
12 |
Madison Money Market Fund |
10.0% |
|
13 |
British-American Money Market Fund |
9.9% |
|
14 |
Orient Kasha Money Market Fund |
9.8% |
|
15 |
Dry Associates Money Market Fund |
9.6% |
|
16 |
GenAfrica Money Market Fund |
9.5% |
|
17 |
SanlamAllianz Money Market Fund |
9.4% |
|
18 |
KCB Money Market Fund |
9.3% |
|
19 |
Faulu Money Market Fund |
9.2% |
|
20 |
Genghis Money Market Fund |
9.1% |
|
21 |
Apollo Money Market Fund |
8.9% |
|
22 |
CIC Money Market Fund |
8.5% |
|
23 |
CPF Money Market Fund |
8.2% |
|
24 |
Mali Money Market Fund |
8.2% |
|
25 |
ICEA Lion Money Market Fund |
8.2% |
|
26 |
Co-op Money Market Fund |
8.1% |
|
27 |
Absa Shilling Money Market Fund |
7.5% |
|
28 |
Mayfair Money Market Fund |
7.0% |
|
29 |
Ziidi Money Market Fund |
6.2% |
|
30 |
AA Kenya Shillings Fund |
6.1% |
|
31 |
Stanbic Money Market Fund |
5.6% |
|
32 |
Equity Money Market Fund |
4.9% |
Source: Business Daily
Liquidity:
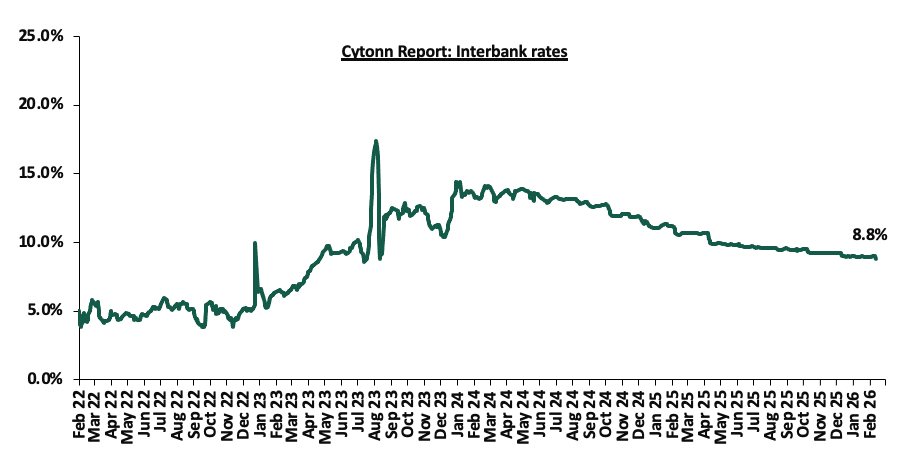
During the week, liquidity in the money markets eased with the average interbank rate decreasing by 7.0 bps to 8.9% from 9.0% recorded the previous week, partly attributable to government payments that offset tax remittances. The average interbank volumes traded increased by 11.7% to Kshs 7.5 bn from Kshs 6.7 bn recorded the previous week. The chart below shows the interbank rates in the market over the years:
Kenya Eurobonds:
During the week, the yields on the Eurobonds recorded a mixed performance with the yield on the 13-year Eurobond issued in 2021 and the 7-year Eurobond issued in 2024 both increasing the most by 5.0 bps to remain relatively unchanged at 7.8% and 6.7% respectively, recorded the previous week while the yield on both the 10-year Eurobond issued in 2018 and 12-year Eurobond issued in 2019 both decreased by 1.0 bps to remain relatively unchanged 6.1% and 7.0% respectively. The table below shows the summary performance of the Kenyan Eurobonds as of 12th February 2026;
|
Cytonn Report: Kenya Eurobonds Performance |
||||||
|
|
2018 |
2019 |
2021 |
2024 |
||
|
Tenor |
10-year issue |
30-year issue |
12-year issue |
13-year issue |
7-year issue |
|
|
Amount Issued (USD) |
1.0 bn |
1.0 bn |
1.0 bn |
1.5 bn |
1.5 bn |
|
|
Years to Maturity |
2.5 |
22.5 |
8.8 |
5.5 |
10.5 |
|
|
Yields at Issue |
7.3% |
8.3% |
6.2% |
10.4% |
9.9% |
|
|
02-Jan-26 |
6.1% |
8.8% |
7.2% |
7.8% |
7.1% |
|
|
02-Feb-26 |
6.1% |
8.6% |
7.0% |
7.7% |
6.8% |
|
|
05-Feb-26 |
6.1% |
8.7% |
7.0% |
7.8% |
6.7% |
|
|
06-Feb-26 |
6.1% |
8.7% |
7.0% |
7.9% |
6.8% |
|
|
09-Feb-26 |
6.1% |
8.7% |
7.0% |
7.8% |
6.7% |
|
|
10-Feb-26 |
6.1% |
8.7% |
7.0% |
7.8% |
6.7% |
|
|
11-Feb-26 |
6.1% |
8.7% |
7.0% |
7.8% |
6.7% |
|
|
12-Feb-26 |
6.1% |
8.7% |
7.0% |
7.8% |
6.7% |
|
|
Weekly Change |
0.0% |
0.0% |
0.0% |
0.1% |
0.1% |
|
|
MTD Change |
0.1% |
0.1% |
0.0% |
0.1% |
0.0% |
|
|
YTD Change |
0.1% |
(0.2%) |
(0.2%) |
0.0% |
(0.4%) |
|
Source: Central Bank of Kenya (CBK) and National Treasury
Kenya Shilling:
During the week, the Kenya Shilling remained unchanged against the US Dollar at Kshs 129.0. On a year-to-date basis, the shilling has appreciated by 2.3 bps against the dollar, lower than the 22.9 bps appreciation recorded in 2025.
We expect the shilling to be supported by:
-
Diaspora remittances standing at a cumulative USD 5,020.7 mn in the twelve months to January 2026, 1.2% higher than the USD 4,960.2 mn recorded over the same period in 2025. These hve continued to cushion the shilling against further depreciation. In the January 2026 diaspora remittances figures, North America remained the largest source of remittances to Kenya accounting for 51.3% in the period, and,
-
Tourism inflows, which strengthened significantly. Tourism receipts reached Kshs 560.0 bn in 2025, up from Kshs 452.2 bn in 2024, representing a 23.9% increase, supported by improved international arrivals through the country’s major airports, and,
-
Improved forex reserves currently at USD 12.5 bn (equivalent to 5.4-months of import cover), which is above the statutory requirement of maintaining at least 4.0-months of import cover and above the EAC region’s convergence criteria of 4.5-months of import cover.
The shilling is however expected to remain under pressure in 2025 as a result of:
-
An ever-present current account deficit which is estimated at at 2.4% of GDP in 2025 and 2.2% in 2026, and,
-
Elevated government debt servicing obligations, which continue to exert pressure on foreign exchange reserves, given that 59.7% of Kenya’s external debt is US Dollar-denominated as of June 2025, sustaining demand for hard currency in 2026.
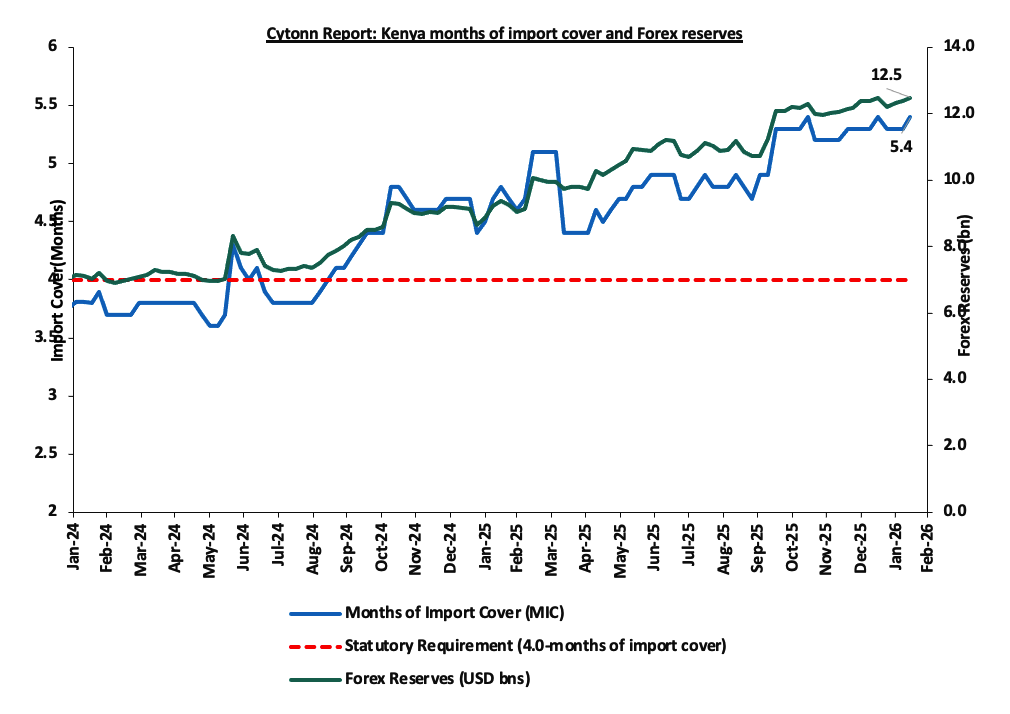
Kenya’s forex reserves increased by 0.8% during the week to USD 12.5 bn from the USD 12.4 bn recorded the previous week, equivalent to 5.4 months of import cover, and above the statutory requirement of maintaining at least 4.0-months of import cover.
The chart below summarizes the evolution of Kenya's months of import cover over the years:
Weekly Highlights
-
Monetary Policy Committee (MPC) February Meeting
The monetary policy committee met on February 10th, 2026, to review the outcome of its previous policy decisions and decided to lower the CBR rate by 25.0 bps to 8.75%, from 9.00% in December 2026. Notably, inflation rates remain anchored and remained within the CBK preferred range of 2.5%-7.5% for the thirty first consecutive month, with a decrease of 0.1% points to 4.4% in January 2026, from 4.5% in December 2025. Key to note, the MPC had cut the CBR rate to 9.00% in the previous meeting in December from 9.25% in October 2025. Below are some of the key highlights from the February meeting:
-
The overall inflation decreased by 0.1% points to 4.4% in January 2026, from 4.5% in December 2025, remaining below the mid-point of the preferred CBK range of 2.5%-7.5%. Core inflation increased to 2.2% in January 2026, from 2.0% in December driven by higher prices of some processed food items, particularly maize flour. Additionally, non-core inflation declined to 10.3% in January 2026, from 11.2% in December 2025, driven by lower prices of some vegetables, particularly tomatoes and onions. Overall inflation is expected to remain below the midpoint of the target range in the near term, supported by stable prices of processed food items and energy, and continued exchange rate stability.
-
The performance of the Kenyan economy remained resilient in the third quarter of 2025, with real GDP growth averaging 4.9%, supported by a rebound of the industrial sector, and resilience of the service sectors. Leading indicators of economic activity point to improved performance in the fourth quarter of 2025. The growth of the economy is projected to pick up to 5.0% compared to the previous projection of 5.2% mainly reflecting a slowdown in agriculture sector performance in the third quarter.
The economy is expected to remain resilient, with real GDP growth projected to pick up to 5.5% in 2026 and 5.6% percent in 2027, supported by the resilience of the services sector, continued recovery of industrial sector, and stable growth of agriculture. This outlook is subject to risks, including adverse weather conditions, elevated trade policy uncertainties, and geopolitical tensions.
-
The current account deficit is estimated at 2.4% of GDP in 2025 compared to 1.3% of GDP in 2024,
due to lower service receipts and secondary income transfers as a share of GDP. Goods exports increased by 6.1%, driven by horticulture, coffee, tea, manufactured goods, and apparel. Goods imports rose by 9.1%, reflecting increases in intermediate and capital goods imports. Services receipts increased by 1.1%, mainly supported by higher receipts from travel services, while diaspora remittances increased by 1.9%. The current account deficit is projected to remain stable at 2.2% of GDP in 2026 and 2027, and is expected to be more than fully financed by financial account inflows. Currently, the CBK foreign exchange reserves stand at USD 12.5 mn (5.4 months of import cover), and continue to provide adequate cover and a buffer against short-term domestic and external shocks.
-
The banking sector remains stable and resilient, with strong liquidity and capital adequacy ratios. The ratio of gross non-performing loans (NPLs) to gross loans stood at 15.5% in January 2026, down from 16.7% in October 2025 and 17.6% in August 2025. Decreases in NPLs were noted in the real estate, manufacturing, trade, building and construction, and personal and household sectors. Banks have continued to make adequate provisions for the NPLs.
-
The CEOs Survey and Market Perceptions Survey conducted in January 2026 revealed sustained optimism about business activity and economic growth prospects for the next 12 months. The optimism was attributed to the stable macroeconomic environment with low inflation and stable exchange rate, lower interest rates, expected favorable weather conditions, increased infrastructure spending and digital innovations, and improved private sector credit growth. Some respondents expressed concerns about low consumer demand, high cost of doing business, and increased global uncertainties attributed to heightened geopolitical tensions and higher tariffs.
-
Respondents to the January 2026 Agriculture Sector Survey expect stable pump prices, exchange rate stability, and favorable weather conditions with the expected onset of the long rains, to support a stable inflation rate in the near term. However, a majority of respondents expect seasonal factors associated with the dry weather conditions before the onset of the long rains to exert moderate upward pressure on prices of some food items, particularly vegetables, and overall inflation.
-
Global growth has remained resilient and is estimated at 3.3% in 2025, reflecting lower-than-expected tariff rates on imports into the United States, improved financial conditions, strong consumer spending, and a surge in investment in Artificial Intelligence-led technology, particularly in the United States. The outlook for global growth for 2026 has been revised upwards, and is expected to remain steady at 3.3%, mainly due to improved growth prospects in the United States, Euro area, and China. Nevertheless, weak global demand, elevated trade policy uncertainty, and heightened geopolitical tensions particularly in the Middle East, and the Russia-Ukraine conflict, remain key risks to growth.
-
Global inflation declined in 2025, and is projected to decline further in 2026 and 2027, mainly driven by lower energy prices and reduced global demand. Inflation in the major economies has eased modestly in recent months, but is still above target in some countries, reflecting the stickiness in core inflation. Central banks in the major economies have continued to ease monetary policy, but at a cautious and uneven pace depending on their inflation and growth outlooks. International oil prices have moderated owing to increased production and subdued global demand, but have been volatile due to elevated global uncertainties. Food inflation has declined, partly driven by lower inflation rates for cereals and sugar prices.
-
The MPC noted that the revised banking sector Risk-Based Credit Pricing Model (RBCPM), which will be fully operational by March 2026, will improve the transmission of monetary policy decisions to commercial banks’ lending interest rates, and enhance transparency in the pricing of loans by banks.
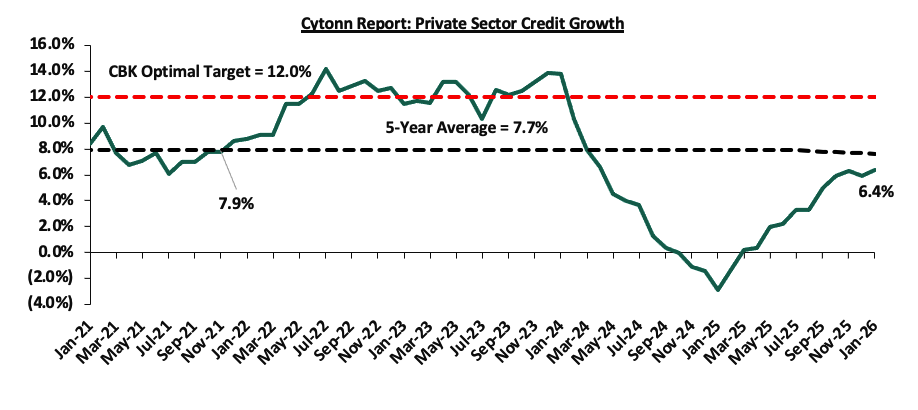
Growth in commercial banks’ lending to the private sector continued to improve and stood at 6.4% in January 2026 compared to 5.9% in December 2025 and (2.9%) in January 2025. Growth in credit to key sectors of the economy, particularly building and construction, trade, and consumer durables, remained strong in January 2026, reflecting improved demand for credit in line with the declining lending interest rates. Average commercial banks’ lending rates stood at 14.8% in January 2026, down from 15.0% in October 2025 and 17.2% in November 2024.
-
The Committee noted the ongoing implementation of the FY2025/26 Government Budget, and the planned fiscal consolidation strategy to reduce debt vulnerabilities over the medium term.
-
To further strengthen the effectiveness of the monetary policy implementation framework and enhance monetary policy transmission, the MPC approved a narrowing of the interest rate corridor around the Central Bank Rate (CBR) from the current ±75 bps to ±50 bps. This will further support the alignment of the Kenya Shilling Overnight Interbank Average (KESONIA) to the CBR. In line with this review, the Committee also approved the adjustment of the applicable interest rate on the Discount Window from the current 75 bps above CBR to 50 bps, which is the upper bound of the interest rate corridor.
The MPC noted that overall inflation is expected to remain below the midpoint of the 2.5%-5.0% target range in the near term, supported by stable prices of processed food items and energy, and stability in the exchange rate. Additionally, central banks in major economies have continued to lower interest rates at a cautious pace. The Committee also noted that the recent economic developments, created room for further easing of monetary policy to support economic activity while maintaining exchange rate stability. The MPC noted that it will continue to monitor the effects of these policy measures, as well as global and domestic economic developments, and will remain ready to take additional action if necessary. Going forward, we expect the MPC to adopt a more cautious approach to rate adjustments in the coming meetings in a bid to continue supporting the private sector, while also keeping an eye on the effect on the inflation and exchange rate. The next MPC meeting is scheduled for April 2026.
-
Exchequer Highlight January 2026
The National Treasury gazetted the revenue and net expenditures for the seventh month of FY’2025/2026, ending 30th January 2026, highlighting that the total revenue collected as at the end of January 2026 amounted to Kshs 1,437.2 bn, equivalent to 52.2% of the original estimates of Kshs 2,754.7 bn for FY’2025/2026 and is 89.4% of the prorated estimates of Kshs 1,606.9 bn. Below is a summary of the performance:
|
FY'2025/2026 Budget Outturn - As at 30th January 2026 |
|||||
|
Amounts in Kshs billions unless stated otherwise |
|||||
|
Item |
12-months Original Estimates |
Actual Receipts/Release |
Percentage Achieved |
Prorated |
% achieved of the Prorated |
|
Opening Balance |
|
6.4 |
|
|
|
|
Tax Revenue |
2,627.1 |
1,344.4 |
51.2% |
1,532.5 |
87.7% |
|
Non-Tax Revenue |
127.6 |
86.4 |
67.7% |
74.5 |
116.0% |
|
Total Revenue |
2,754.7 |
1,437.2 |
52.2% |
1,606.9 |
89.4% |
|
External Loans & Grants |
569.8 |
234.9 |
41.2% |
332.4 |
70.7% |
|
Domestic Borrowings |
1,098.3 |
732.6 |
66.7% |
640.7 |
114.3% |
|
Other Domestic Financing |
10.8 |
21.6 |
199.8% |
6.3 |
342.6% |
|
Total Financing |
1,678.9 |
989.0 |
58.9% |
979.3 |
101.0% |
|
Recurrent Exchequer issues |
1,470.4 |
885.7 |
60.2% |
857.8 |
103.3% |
|
CFS Exchequer Issues |
2,141.0 |
1,164.3 |
54.4% |
1,248.9 |
93.2% |
|
Development Expenditure & Net Lending |
407.1 |
167.8 |
41.2% |
237.5 |
70.6% |
|
County Governments + Contingencies |
415.0 |
205.4 |
49.5% |
242.1 |
84.9% |
|
Total Expenditure |
4,433.6 |
2,423.2 |
54.7% |
2,586.3 |
93.7% |
|
Fiscal Deficit excluding Grants |
1,678.9 |
986.0 |
58.7% |
979.3 |
100.7% |
|
Total Borrowing |
1,668.1 |
967.4 |
58.0% |
973.0 |
99.4% |
Amounts in Kshs bns unless stated otherwise
The key take-outs from the release include;
-
Total revenue collected as at the end of January 2026 amounted to Kshs 1,437.2 bn, equivalent to 52.2% of the original estimates of Kshs 2,754.7 bn for FY’2025/2026 and is 89.4% of the prorated estimates of Kshs 1,606.9 bn. Cumulatively, tax revenues amounted to Kshs 1,344.4 bn, equivalent to 51.2% of the original estimates of Kshs 2,627.1 bn and 87.7% of the prorated estimates of Kshs 1,532.5 bn,
-
Total financing amounted to Kshs 989.0 bn, equivalent to 58.9% of the original estimates of Kshs 1,678.9 bn and is equivalent to 101.0% of the prorated estimates of Kshs 979.3 bn. Additionally, domestic borrowing amounted to Kshs 732.6 bn, equivalent to 66.7% of the original estimates of Kshs 1,098.3 bn and is 114.3% of the prorated estimates of Kshs 640.7 bn,
-
The total expenditure amounted to Kshs 2,423.2 bn, equivalent to 54.7% of the original estimates of Kshs 4,433.6 bn, and is 93.7% of the prorated target expenditure estimates of Kshs 2,586.3 bn. Additionally, the net disbursements to recurrent expenditures came in at Kshs 885.7 bn, equivalent to 60.2% of the original estimates of Kshs 1,470.4 and are equivalent to 103.3% of the prorated estimates of Kshs 857.8 bn,
-
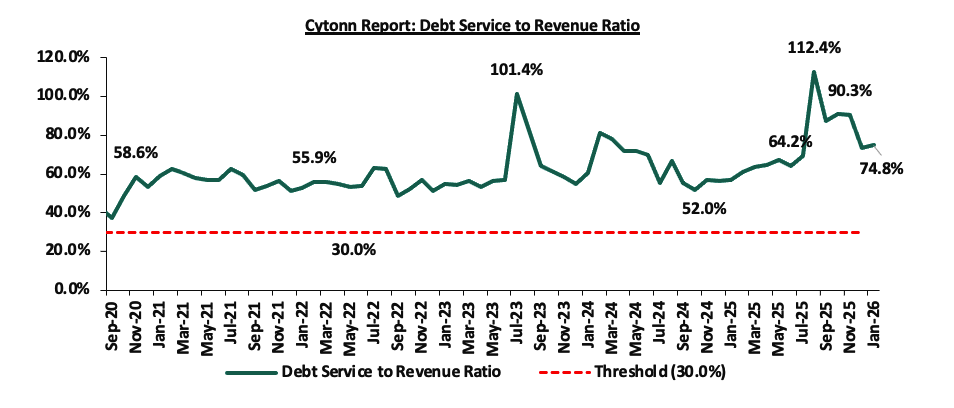
Consolidated Fund Services (CFS) Exchequer issues came in at Kshs 1,164.3 bn, equivalent to 54.4% of the original estimates of Kshs 2,141.0 bn, and are 93.2% of the prorated amount of Kshs 1,248.9 bn. The cumulative public debt servicing cost amounted to Kshs 1,075.1 bn which is 56.5% of the original estimates of Kshs 1,901.4 bn and is 96.9% of the prorated estimates of Kshs 1,109.1 bn. Additionally, the Kshs 1,075.1 bn debt servicing cost is equivalent to 74.8% of the actual cumulative revenues collected as at the end of January 2026. The chart below shows the debt servicing cost to revenue ratio over the period;
-
Total Borrowings as at the end of January 2026 amounted to Kshs 967.4 bn, equivalent to 58.0% of the original estimates of Kshs 1,668.1 bn for FY’2025/2026 and are 99.4% of the prorated estimates of Kshs 973.0 bn. The cumulative domestic borrowing of Kshs 1,098.3 bn comprises of Net Domestic Borrowing Kshs 634.8 bn and Internal Debt Redemptions (Rollovers) Kshs 463.5 bn.
The government underachieved its prorated revenue targets for the seventh month of the FY’2025/2026, achieving 89.4% of the prorated revenue targets in January 2026, lower than the 90.7% recorded in December 2025. This was driven by shortfall in tax revenues, which stood at 87.7% of prorated levels despite the non-tax revenues standing at 116.0% of the prorated levels. External loans and grants remained significantly below target at 41.2%, increasing reliance on domestic borrowing, which came in at 114.3% of the prorated target. The business environment, however, showed signs of recovery, with the Purchasing Managers’ Index (PMI) standing at 51.9 in January 2026 despite dropping from 53.5 in December 2025, remaining over the 50.0 neutral mark and signaling a slowdown in the contraction of business activity. Expenditure absorption stood at 93.7% of prorated levels, with development spending still lagging at 70.6%, reflecting slow implementation of capital projects. Future revenue performance will depend on how quickly private sector activity strengthens, supported by a stable Shilling, easing credit conditions following the 25.0 bps reduction in the Central Bank Rate to 8.75% from 9.00% in December 2025, and continued efforts to broaden the tax base, curb evasion, and stimulate economic growth.
-
The National Infrastructure Fund Bill
The National Infrastructure Fund Bill, 2026, seeks to establish a National Infrastructure Fund as a new financing mechanism for Kenya’s priority development projects. The Fund is intended to mobilize private capital and alternative financing sources, including privatization proceeds, dividends from State-Owned Enterprises, infrastructure-linked levies, grants, and institutional investment, to reduce reliance on public debt for infrastructure development. Public hearings are being held across several counties, and written submissions are being accepted ahead of further legislative consideration. Operating on a commercially driven model, it will invest in viable projects through equity, debt, public-private partnerships (PPPs), and special purpose vehicles (SPVs), guided by risk-return principles. Resources will be strictly ring-fenced for capital investment and prohibited from funding recurrent expenditure. The Bill also outlines a governance framework with oversight by a Board appointed by the Cabinet Secretary for the National Treasury, supported by fiduciary and risk management structures, alongside mandatory annual audited reporting to Parliament. Overall, the proposal signals a shift towards a more sustainable, accountable, and private-sector-oriented approach to infrastructure financing, aimed at accelerating development in transport, energy, water, and other critical sectors while strengthening fiscal sustainability.
-
Fuel Prices effective 15th February – 14th March 2026
During the week, The Energy and Petroleum Regulatory Authority (EPRA) released their monthly statement on the maximum retail fuel prices in Kenya, effective from 15th February 2026 to 14th March 2026. Notably, the maximum allowed prices for Super Petrol, Diesel and Kerosene decreased by Kshs 4.2, Kshs 3.9 and Kshs 1.0 per litre to Kshs 178.3, Kshs 166.5 and Kshs 152.8 per litre from Kshs 182.5, Kshs 170.5 and Kshs 153.8 per litre respectively in January 2026, the second consecutive decrease in 2026.
Other key take-outs from the performance include,
-
The average landing cost per cubic metre of Diesel, Super Petrol and Kerosene decreased by 6.4%, 2.7% and 1.4% to USD 586.8, USD 576.3 and USD 598.8 in January 2026 from USD 626.8, USD 592.2 and USD 607.5 recorded in December 2025.
-
The Kenyan Shilling stabilized against the US Dollar to remain unchanged at Kshs 129.3 in comparison to December 2025
We note that fuel prices in the country have stabilized in recent months largely due to the government's efforts to stabilize pump to cushion the increases applied to the petroleum pump prices, coupled with the stabilization of the Kenyan Shilling against the dollar and other major currencies. The government also increased spending through the price stabilization mechanism, subsidizing Kshs 1.4 Kerosene in February 2026 saw a reduction in fuel prices for the period under review. Additionally, the price of crude oil per barrel has also declined by 10.6% for the twelve months leading to January 2026 to USD 65.5 from USD 73.3 in February 2025.
Going forward, we expect that fuel prices will stabilize in the coming months as a result of the government's efforts to mitigate the cost of petroleum through the pump price stabilization mechanism and a stable exchange rate. As such, we expect the business environment in the country to improve as fuel is a major input cost, as well as continued stability in inflationary pressures, with the inflation rate expected to remain within the CBK’s preferred target range of 2.5%-7.5% in the short to medium term.
Rates in the Fixed Income market have been on a downward trend due to easing inflation, strong money market liquidity, and the government’s rejection of high-priced bids supporting yield curve normalization. The government is 119.3% ahead of its prorated net domestic borrowing target of Kshs 401.1 bn, having a net borrowing position of Kshs 879.4 bn (inclusive of T-bills). Going forward, we anticipate stabilization across the short to medium end of the yield curve as the government increasingly turns to external borrowing to sustain its fiscal position, thereby easing pressure on the domestic market. In this environment, investors are expected to shift towards longer-dated securities to lock in the prevailing high yields.
Market Performance:
The equities market was on an upward trajectory, with NSE 20, NSE 25, NSE 10, and NASI gaining by 8.5%, 7.6%, 7.5% and 6.9% respectively, taking the YTD performance to gains of 15.7%, 15.7%, 14.4% and 14.0% for NSE 20, NASI, NSE 25 and NSE 10 respectively. The equities market performance was mainly driven by gains recorded by large cap stocks such as DTB-K, Stanbic and Equity of 18.1%, 16.8% and 12.9% respectively. However, the performance was weighed down by losses recorded by large cap stocks such as NCBA and BAT of 2.7% and 0.4% respectively.
In the regional equities market, the East African Exchanges 20 (EAE 20) share index lost by 0.6%, attributable to losses recorded by large cap stocks such as Bank of Baroda, Tanzania Cigarette Corporation, and Bank of Kigali of 3.6%, 1.9%, and 0.3% respectively. The performance was however, supported by gains recorded by large cap stocks such MTN Uganda, KCB Group, and Tanga Cement of 10.7%, 9.3% and 9.1% respectively.
Additionally, during the week, the banking sector index gained by 8.5% to 237.1 from 218.5 recorded the previous week. This is attributable to gains recorded by stocks such as DTB-K, Stanbic and Equity of 18.1%, 16.8% and 12.9% respectively. However, the performance was weighed down by losses recorded by stocks such as NCBA of 2.7%.
During the week, Kenya Electricity Generating Company (KenGen), released its H1'2026 financial results for the period ended 31st December 2025, recording a profit after tax of Kshs 4.2 bn, a 20.2% decrease from the Kshs 5.3 bn recorded in H1’2025, majorly attributable to the 7.4% increase in operating expenses to Kshs 19.0 bn from Kshs 17.7 bn recorded in H1’2025, which was mainly driven by higher depreciation expense arising from additional asset capitalization as well as increased plant operating and steam costs.
During the week, equities turnover increased by 54.9% to USD 56.9 mn from USD 36.7 mn recorded the previous week, taking the YTD total turnover to USD 198.2 mn. Foreign investors remained net sellers for the second consecutive week with a net selling position of USD 4.6 mn, from a net selling position of USD 8.2 mn recorded the previous week, taking the YTD foreign net selling position to USD 21.2 mn, compared to a net selling position of USD 92.9 mn recorded in 2025.
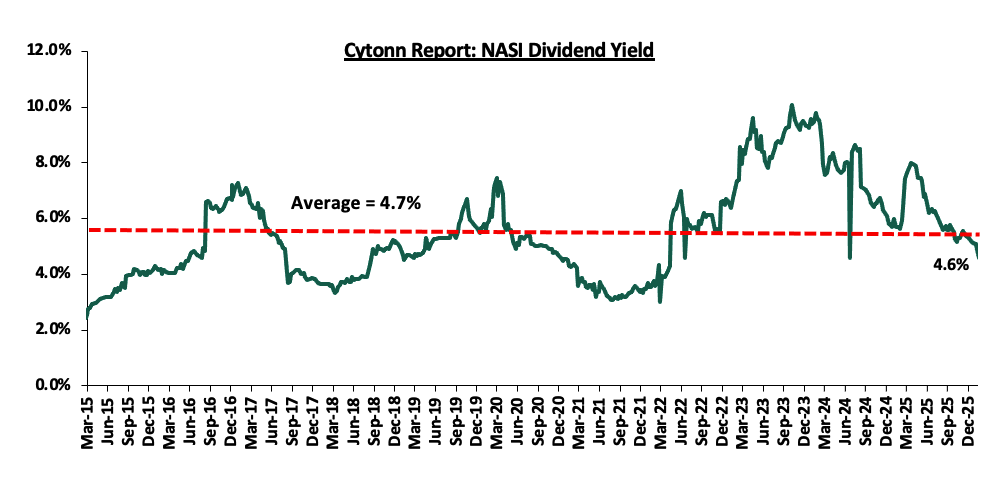
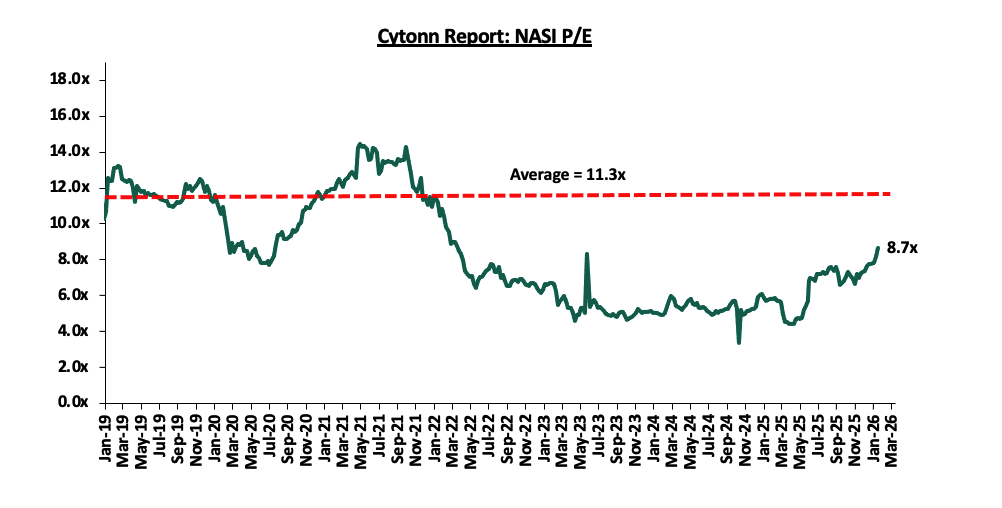
The market is currently trading at a price to earnings ratio (P/E) of 8.7x, 23.5% below the historical average of 11.3x. The dividend yield stands at 4.6%, 0.1% points below the historical average of 4.7%. Key to note, NASI’s PEG ratio currently stands at 1.1x, an indication that the market is overvalued relative to its future growth. A PEG ratio greater than 1.0x indicates the market may be overvalued while a PEG ratio less than 1.0x indicates that the market is undervalued.
The charts below indicate the historical P/E and dividend yields of the market.
Universe of Coverage:
|
Cytonn Report: Equities Universe of Coverage |
||||||||||
|
Company |
Price as at 06/02/2026 |
Price as at 13/02/2026 |
w/w change |
YTD Change |
Year Open 2026 |
Target Price* |
Dividend Yield |
Upside/ Downside** |
P/TBv Multiple |
Recommendation |
|
NCBA |
92.3 |
89.75 |
(2.7%) |
5.6% |
85.0 |
101.3 |
6.1% |
19.0% |
1.4x |
Accumulate |
|
Standard Chartered Bank |
314.8 |
336.75 |
7.0% |
12.3% |
299.8 |
354.6 |
13.4% |
18.7% |
1.9x |
Accumulate |
|
Equity Group |
68.0 |
76.75 |
12.9% |
14.6% |
67.0 |
83.2 |
5.5% |
13.9% |
1.3x |
Accumulate |
|
Stanbic Holdings |
205.5 |
240.00 |
16.8% |
21.4% |
197.8 |
250.6 |
8.6% |
13.1% |
1.5x |
Accumulate |
|
I&M Group |
45.0 |
49.85 |
10.8% |
16.5% |
42.8 |
53.1 |
6.0% |
12.5% |
0.9x |
Accumulate |
|
Co-op Bank |
28.4 |
29.60 |
4.4% |
23.8% |
23.9 |
31.5 |
5.1% |
11.5% |
1.2x |
Accumulate |
|
CIC Group |
4.6 |
5.52 |
20.3% |
21.6% |
4.5 |
6.0 |
2.4% |
11.1% |
1.5x |
Accumulate |
|
Britam |
10.1 |
11.55 |
14.4% |
27.5% |
9.1 |
12.8 |
0.0% |
10.8% |
1.1x |
Accumulate |
|
Diamond Trust Bank |
135.5 |
160.00 |
18.1% |
39.4% |
114.8 |
170.0 |
4.4% |
10.6% |
0.6x |
Accumulate |
|
ABSA Bank |
28.2 |
29.55 |
4.8% |
18.9% |
24.9 |
30.7 |
5.9% |
9.8% |
1.9x |
Hold |
|
KCB Group |
67.3 |
75.25 |
11.9% |
14.4% |
65.8 |
78.0 |
4.0% |
7.6% |
0.9x |
Hold |
|
Jubilee Holdings |
329.8 |
349.75 |
6.1% |
8.4% |
322.5 |
354.3 |
3.9% |
5.1% |
0.5x |
Hold |
|
*Target Price as per Cytonn Analyst estimates **Upside/ (Downside) is adjusted for Dividend Yield ***Dividend Yield is calculated using FY’2024 Dividends |
||||||||||
Weekly Highlights
-
The Kenya Electricity Generating Company (KenGen) H1’2026 Financial Performance.
During the week, Kenya Electricity Generating Company (KenGen), released its H1'2026 financial results for the period ended 31st December 2025, recording a profit after tax of Kshs 4.2 bn, a 20.2% decrease from the Kshs 5.3 bn recorded in H1’2025, majorly attributable to the 7.4% increase in operating expenses to Kshs 19.0 bn from Kshs 17.7 bn recorded in H1’2025, which was mainly driven by higher depreciation expense arising from additional asset capitalization as well as increased plant operating and steam costs. However, net revenue increased by 6.2% to Kshs 24.8 bn in H1’2026, from Kshs 23.4 bn in H1’2025 mainly driven by the 9.4% increase in topline revenue to Kshs 30.1 bn from Kshs 27.5 bn in H1’2025. Notably, finance costs reduced by 11.0% to Kshs 1.0 bn, from Kshs 1.1 bn in H1’2025, due to continued debt management. The tables below show the breakdown of KenGen’s financial performance:
|
Cytonn Report: Kenya Electricity Generating Company (KenGen) H1'2026 Perfomance |
|||
|
Income Statement |
H1'2025 Kshs (bn) |
H1'2026 Kshs (bn) |
% Change |
|
Revenue |
27.5 |
30.1 |
9.4% |
|
Fuel & Water Costs |
(4.1) |
(5.3) |
27.4% |
|
Revenue Net Reimbursable Expenses |
23.4 |
24.8 |
6.2% |
|
Other Income |
0.6 |
0.5 |
(17.2%) |
|
Gains/(Losses) on Net Forex & Fair Valuation of Financial assets |
0.4 |
0.8 |
97.2% |
|
Expenses |
(17.7) |
(19.0) |
7.4% |
|
Operating Profit |
6.6 |
7.1 |
6.4% |
|
Finance Income |
2.4 |
1.5 |
(37.3%) |
|
Finance Cost |
(1.1) |
(1.0) |
(11.0%) |
|
Profit/(Loss) Before Tax |
8.0 |
7.6 |
(4.5%) |
|
Income Tax |
(2.7) |
(3.4) |
26.7% |
|
Profit/(Loss) After Tax |
5.3 |
4.2 |
(20.2%) |
|
Earnings Per Share (EPS) in Kshs |
0.8 |
0.6 |
(19.9%) |
Source: Kenya Electricity Generating Company (KenGen) H1’2026 Financial Report,
|
Cytonn Report: Kenya Electricity Generating Company (KenGen) H1'2026 Perfomance |
|||
|
Balance Sheet |
H1'2025 Kshs (bn) |
H1'2026 Kshs (bn) |
% Change |
|
Non-Current Assets |
452.1 |
451.0 |
(0.2%) |
|
Current Assets |
53.5 |
54.3 |
1.5% |
|
Total Assets |
505.6 |
505.3 |
(0.1%) |
|
Non-Current Liabilities |
200.6 |
194.8 |
(2.9%) |
|
Current Liabilities |
20.4 |
27.7 |
35.8% |
|
Total Liabilities |
221.0 |
222.4 |
0.6% |
|
Total Equity |
284.5 |
282.8 |
(0.6%) |
Source: Kenya Electricity Generating Company (KenGen) H1’2026 Financial Report
Key take outs from the financial performance include;
-
Net revenue increased by 6.2% to Kshs 24.8 bn in H1’2026, from Kshs 23.4 bn in H1’2025 mainly driven by the 9.4% increase in topline revenue to Kshs 30.1 bn from Kshs 27.5 bn in H1’2025. The performance was however weighed down by a 27.4% increase in fuel and water costs to Kshs 5.3 bn from Kshs 4.1 bn in H1’2025.
-
Operating profit increased by 6.4% to Kshs 7.1 bn in H1’2026 from Kshs 6.6 bn in H1’2025, largely driven by the 6.2% increase in net revenue to Kshs 24.8 bn in H1’2026, from Kshs 23.4 bn in H1’2025 accompanied by a 97.2% increase in gains by net forex and financial assets at a fair value to Kshs 0.8 bn in H1’2026 from the Kshs 0.4 bn recorded in H1’2025. The performance was however weighed down by the 17.2% decline in other income to Kshs 0.5 bn from in H1’2026 from Kshs 0.6 bn mainly attributable to due to fewer consultancy engagement compared to the previous period.
-
The balance sheet recorded a contraction as total assets decreased by 0.1% to Kshs 505.3 bn in H1’2026 from Kshs 505.6 bn in H1’2025, attributable to the 0.2% decrease in the non-current assets to Kshs 451.0 bn from Kshs 452.1 bn in H1’ 2025.The performance was however supported by the 1.5% increase in the current assets to Kshs 54.3 from Kshs 53.5 bn in H1’2025.
-
The current liabilities increased by 35.8% to Kshs 27.7 bn in H1’2026, from Kshs 20.4 bn recorded in H1’2025,
-
Earnings per share decreased by 19.9% to Kshs 0.6 in H1’2026, from Kshs 0.8 in H1’2025, mainly due to the 20.2% decrease in the company’s profit after tax to Kshs 4.2 bn in H1’2026 from Kshs 5.3 bn in H1’2025, and,
-
The board of directors have not recommended any dividend payment for the period, consistent with H1’2025.
Going forward, we expect the company’s earnings to be supported by robust profitability, improved efficiency and growth in strategic investments. Notably, KenGen is accelerating delivery of priority projects under its G2G 2034 Strategy, with a near- to medium-term pipeline of about 253 MW. Key projects include the 63 MW Olkaria I Rehabilitation (targeted for completion by end of 2026), the 42.5 MW Seven Forks Solar Project, the 80 MW Olkaria VII Project, 58.4 MW of wellhead generation through leasing arrangements, and the Gogo Hydropower Upgrade, which will increase capacity from 2 MW to 8.6 MW. The company is also progressing a 200 MW Battery Energy Storage System (BESS) to enhance grid stability and energy storage, alongside the Raising of Masinga Dam project to boost water storage capacity and improve hydropower availability.
We are “Neutral” on the equities market in the short term, supported by relatively attractive valuations, declining yields on short-term government securities, and expectations of both global and local economic recovery. In the long term, however, we remain “Bullish” on selective high-yielding counters. With the market currently trading slightly above its growth-adjusted valuation (PEG ratio at 1.1x), we believe investors should reposition towards fundamentally strong value stocks with solid earnings growth and those trading at discounts to their intrinsic value. We expect continued foreign investor sell-offs to weigh on market performance and sentiment in the short term.
-
Infrastructure Sector
-
National Social Security Fund (NSSF) takes a 9.5bn stake in Nairobi-Nakuru toll road
During the week, the National Social Security Fund (NSSF) took a Kshs 9.5bn stake in Nairobi-Nakuru toll road, marking its first investment in a public road as part of a diversification strategy. The state-owned pension fund is participating through a consortium with China Road and Bridge Corporation (CRBC), contributing 40.0% of the equity portion for the section of the highway they are developing together. The overall 170.0bn project is split between two Chinese firms with the other section awarded to Shandong Hi-Speed Road and Bridge International Engineering (SDRBI).
The project features a unique financial model that protects the government from revenue shortfalls, as the contract lack minimum revenue guarantees. Instead, it employs a revenue cap system where the government will share in any collections exceeding an agreed threshold effectively limiting their potential for excessive profits during the concession period hence deviating from the demand-risk model used for the existing 27.1km Nairobi Expressway. The new toll road is expected to ease congestion on a major transport corridor used by an estimated 40,000 vehicles daily, serving as a crucial link not only within Kenya but also in countries like Uganda, Rwanda and Democratic Republic of Congo (DRC).
We expect the development of the Nairobi-Nakuru toll road to significantly boost Kenya's real estate market by driving land value appreciation and stimulating new development along the corridor, transforming satellite towns Naivasha into prime investment hotspots due to improved connectivity. This major infrastructure project drives suburban living trends, as properties near such roads typically experience higher rental demand and capital appreciation, ultimately unlocking value in previously undervalued areas and making them increasingly attractive for both residential development and long-term investment.
-
Real Estate Investments Trusts (REITs)
-
REITs Weekly Performance
On the Unquoted Securities Platform, Acorn D-REIT and I-REIT traded at Kshs 27.4 and Kshs 23.2 per unit, respectively, as per the last updated data on 13th February 2026. The performance represented a 33.4% and 14.5% gain for the D-REIT and I-REIT, respectively, from the Kshs 20.0 inception price. The volumes traded for the D-REIT and I-REIT came in at 13.4 mn and 42.0 mn shares respectively. Additionally, ILAM Fahari I-REIT traded at Kshs 11.0 per share as of 13th February 2026, representing a 45.0% loss from the Kshs 20.0 inception price. The volume traded to date came in at 1.2 mn shares for the I-REIT. REITs offer various benefits, such as tax exemptions, diversified portfolios, and stable long-term profits. However, the ongoing decline in the performance of Kenyan REITs and the restructuring of their business portfolios are hindering significant previous investments. Additional general challenges include:
-
Insufficient understanding of the investment instrument among investors leading to a slower uptake of REIT products,
-
Lengthy approval processes for REIT creation,
-
High minimum capital requirements of Kshs 100.0 mn for REIT trustees compared to Kshs 10.0 mn for pension funds Trustees, essentially limiting the licensed REIT Trustee to banks only
-
The rigidity of choice between either a D-REIT or and I-REIT forces managers to form two REITs, rather than having one Hybrid REIT that can allocate between development and income earning properties
-
Limiting the type of legal entity that can form a REIT to only a trust company, as opposed to allowing other entities such as partnerships, and companies,
-
We need to give time before REITS are required to list – they would be allowed to stay private for a few years before the requirement to list given that not all companies maybe comfortable with listing on day one, and,
-
Minimum subscription amounts or offer parcels set at Kshs 0.1 mn for D-REITs and Kshs 5.0 mn for restricted I-REITs. The significant capital requirements still make REITs relatively inaccessible to smaller retail investors compared to other investment vehicles like unit trusts or government bonds, all of which continue to limit the performance of Kenyan REITs.
We expect the performance of Kenya’s Real Estate sector to remain resilient, supported by several factors: i) NSSF taking a 9.5bn stake in the Nairobi-Nakuru toll road. However, challenges such as rising construction costs, infrastructure constraints, weak investor appetite in listed REITs such as ILAM Fahari I-REIT, oversupply in select real estate classes, and high capital demands will continue to impede the sector’s optimal performance.
The Kenyan Shilling has experienced a marginal Year-to-Date appreciation of 2.3 bps against the US Dollar, closing the week at Kshs 129.0 as of February 13, 2026, compared to Kshs 129.1 at the beginning of the year. This is in line with the 22.9 bps appreciation in 2025. The minimal appreciation experienced in 2025 and the current stability of the Shilling is supported by improved forex reserves currently at USD 12.5 bn (equivalent to 5.4-months of import cover), an increase of 33.3% from USD 9.3 bn (equivalent to 4.8-months of import cover) recorded in a similar period in 2025, and an 1.2% increase in diaspora remittances to USD 5,020.7 mn in 2026 higher than USD 4,960.2 mn recorded in 2025.
The Kenyan macroeconomic environment challenges have alleviated as evidenced by credit rating outlook revision by Moody’s. In February 2026, Moody’s announced its revision of Kenya’s credit outlook to B3 Stable from Caa1 Positive, on the back of a reduction in near-term default risk and strengthened external liquidity. However, the previous Positive outlook had already indicated a high probability of an upgrade, the move largely formalizes that expectation, while the shift to a Stable outlook signals that further upgrades are unlikely in the near term as risks remain balanced at the new rating level. Fitch Ratings affirmed Kenya's Long-Term Foreign-Currency Issuer Default Rating (IDR) at 'B-' with a Stable Outlook in January 2026. This rating is supported by robust medium-term growth prospects, a diverse economy, continued access to multilateral and bilateral financing and improved external liquidity buffers, despite elevated public debt levels and ongoing fiscal pressures. However, the rating is limited by persistent vulnerabilities such as high external debt service, reliance on concessional borrowing and limited fiscal space. The table below shows the classification of ratings by Moody, S&P and Fitch and their respective outlook:
|
Cytonn Report: Credit Rating Scales by Agency |
|||
|
Moody's |
S&P |
Fitch |
Outlook |
|
Aaa |
AAA |
AAA |
Prime |
|
Aa1 |
AA+ |
AA+ |
High Grade |
|
Aa2 |
AA |
AA |
|
|
Aa3 |
AA- |
AA- |
|
|
A1 |
A+ |
A+ |
Upper Medium Grade |
|
A2 |
A |
A |
|
|
A3 |
A- |
A- |
|
|
Baa1 |
BBB+ |
BBB+ |
Lower Medium Grade |
|
Baa2 |
BBB |
BBB |
|
|
Baa3 |
BBB- |
BBB- |
|
|
Ba1 |
BB+ |
BB+ |
Non-Investment grade speculative |
|
Ba2 |
BB |
BB |
|
|
Ba3 |
BB- |
BB- |
|
|
B1 |
B+ |
B+ |
Highly speculative |
|
B2 |
B |
B |
|
|
B3 |
B- |
B- |
|
|
Caa1 |
CCC+ |
CCC |
Substantial risk |
|
Caa2 |
CCC |
|
Extremely speculative |
|
Caa3 |
CCC- |
|
Default imminent with low probability of recovery |
|
Ca |
CC |
CC |
|
|
C |
|
C |
|
|
/ |
C |
D |
In Default |
|
/ |
D |
|
|
We have previously covered the topic, with the latest summarized below:
-
In February 2025, we covered Currency and Interest Rates Review, with our outlook on the currency being a 4.6% depreciation mainly on the back of the ever-present current account deficit with Kenya being a net importer, which will increase US Dollar demand in the market, the low interest rates as evidenced by the expansionary monetary policy stance adopted by the MPC, the lower interest rates will lead to reduced capital inflows as foreign investor demand for local assets reduces, and, the persistent US Dollar demand by importers, mainly in the oil and energy sector as well as manufacturers.
With the shilling having appreciated by 22.9 bps at the end of 2025 and the continuous downward readjustment on the yield curve, we saw the need to revisit the topic of currency and interest rates outlook, in order to shed some light on how the Kenyan shilling and the interest rates are expected to behave in 2026. In this focus, we shall be doing an in-depth analysis of the factors that are expected to drive the performance of the Kenyan shilling and the interest rates and thereafter give our outlook for 2026 based on these factors. We shall cover the following:
-
Historical Performance of the Kenyan Shilling and Drivers,
-
Evolution of the Interest Rate Environment,
-
Currency Outlook,
-
Factors Expected to Drive the Interest Rate Environment, and,
-
Conclusion and Our View Going Forward.
Section I: Historical Performance of the Kenyan Shilling
The Kenyan shilling has depreciated at a 10-year CAGR of 2.4% to close at Kshs 129.0 as of 13th February 2026 from Kshs 101.9 over the same period in 2016, mainly attributable to challenges within the country’s macroeconomic environment. Over the last years we have seen the country run a fiscal deficit which has led to the government borrowing both locally and internationally and continues to witness a persistent current account deficit, recorded at 3.2% of GDP as of Q3’2025, which continues to weigh down the Shilling. The current account deficit is largely due to the high imports of petroleum products and the manufacturing equipment. The chart below illustrates the performance of the Kenyan Shilling against the US Dollar over the last 10 years:
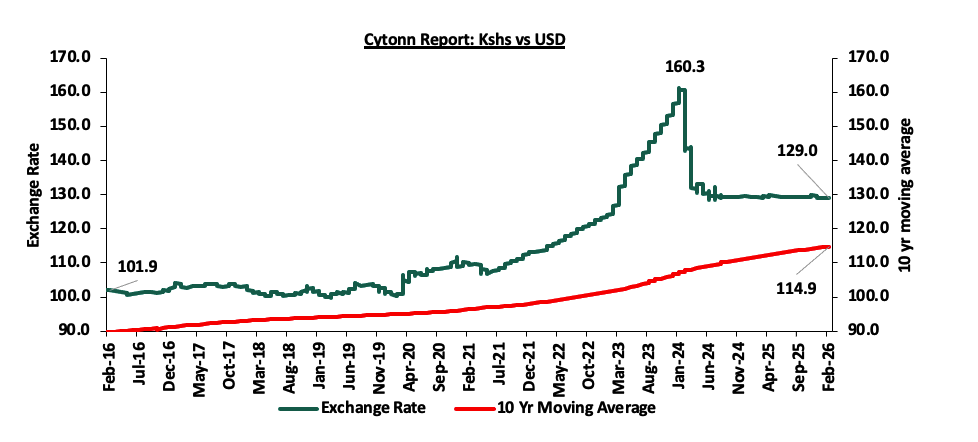
Source: Cytonn Research
The following are the factors that have continued to support the shilling;
-
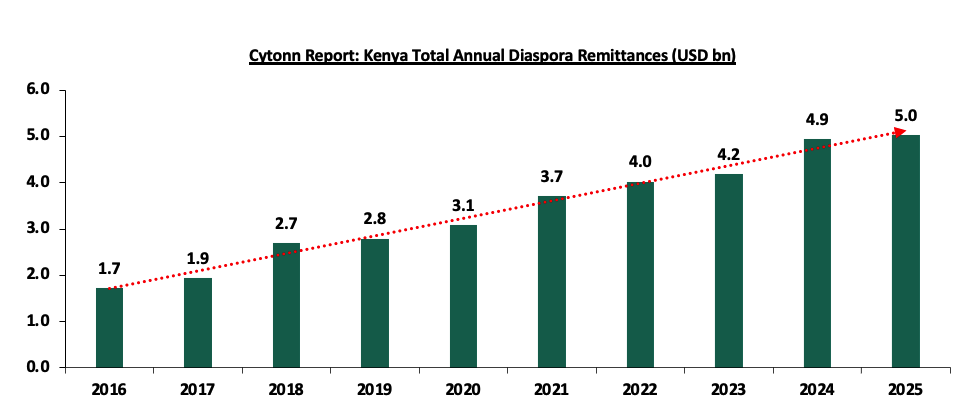
Strong diaspora remittances, with monthly diaspora remittances having grown at a 10-year CAGR of 11.6% to USD 411.3 mn in January 2026, from USD 137.5 mn recorded in January 2016. In the 12 months to January 2026, the Diaspora remittances stood at a cumulative USD 5,020.7 mn which is 1.2% higher than the USD 4,960.2 mn recorded over the same period in 2025. The continued growth in diaspora remittance is mainly attributable to the recovery of the of the global economy, increasing Kenyan population in the diaspora and advancing technology that has facilitated easier transfer of money. The charts below show the trend of the evolution of monthly and annual Diaspora Remittances;
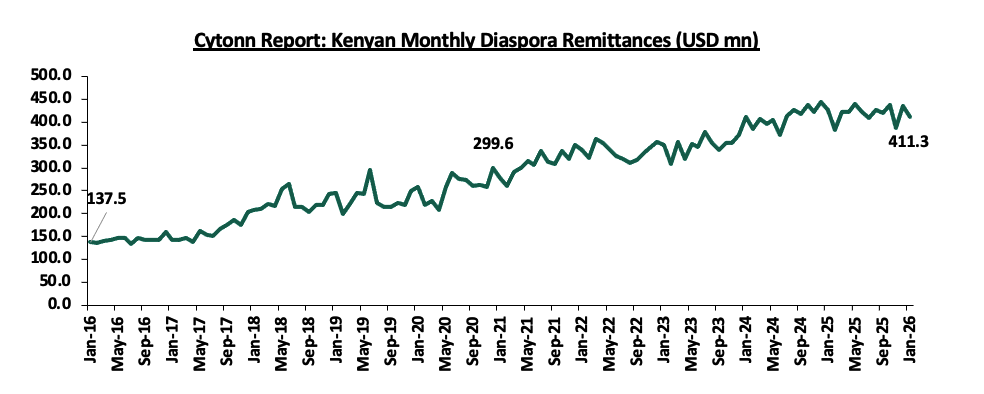
Source: Central Bank of Kenya
Source: Central Bank of Kenya
-
The narrowing of the current account deficit due to the increased value and volumes of the country’s principal exports relative to the import bill, with total exports increasing by 2.5% in Q3’2025, compared to a 7.4% growth in imports over the same period in 2024. It is good to note that there has been a positive trend with the current account deficit coming at 3.2% of GDP in Q3’2025. Notably, exports of edible products grew the most by 32.7% in Q3’2025, to Kshs 4.1 bn from Kshs 3.1 bn in Q3’2024. Also, in Q3’2025, tea exports and horticulture contributed Kshs 44.9 bn and Kshs 52.0 bn, respectively, to the total export value of Kshs 289.4 bn. This also, marked an 0.4% increase in tea export earnings from Kshs 44.7 bn in a similar period last year, while horticulture saw a 3.3% increase from Kshs 50.3 bn in Q3’2024.
-
The issuance of USD 1.0 bn Eurobond notes in October 2025 increased foreign reserves to USD 12.1 bn, further supporting the Kenyan Shilling. Higher reserves enhanced the country’s import cover and improved its ability to meet external debt obligations, which reassured investors about short-term external sustainability.
-
The Central Bank of Kenya (CBK) has been actively purchasing US dollars from the market to stabilize the Kenyan shilling and mitigate excessive volatility. By buying dollars, the CBK increases foreign exchange reserves, providing a buffer against potential short-term economic shocks and ensuring sufficient liquidity in the market. This strategy helps maintain a stable exchange rate, fostering a predictable economic environment conducive to investment and growth.
-
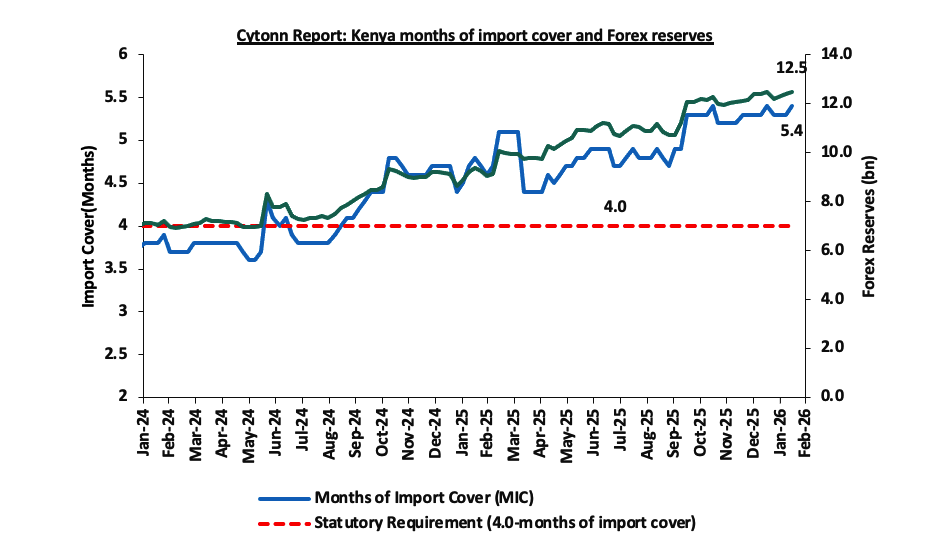
Improving forex reserves having increased by a significant 33.2% to USD 12.5 bn (equivalent to 5.4 months of import cover) in February 2026, from USD 9.4 bn (equivalent to 4.8 months of import cover) in a similar period in 2025. Notably, for the last six months, forex reserves have remained above the statutory requirement of maintaining at least 4.0-months of import cover. The increase is largely attributed to decreased debt service obligations due to the continued stability of the Kenyan shilling. The chart below shows the trend of the evolution of the forex reserves:
However, the shilling remains under pressure due to;
-
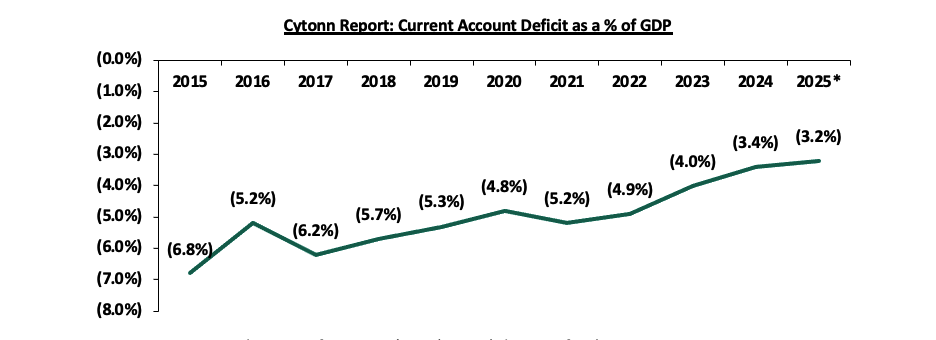
The existence of an ever-present current account deficit, coming in at 3.2% of GDP as of Q3’2025.The persistent current account deficit highlights the country's dependence on imports. The chart below highlights the trend in the current account deficit as a percentage of GDP for the last 10 years:
Source: Kenya National Bureau of Statistics (KNBS), 2025* data as of Q3’ 2025
-
The low interest rates as evidenced by the expansionary monetary policy stance adopted by the MPC. The Monetary Policy Committee reduced the Central Bank Rate (CBR) by 25.0 bps to 8.75% in February 2026, from 9.00%, and a cumulative 425.0 bps cut from the high of 13.00% in August 2024, signalling easing of policy stance to stir economic activity, noting that its previous measures had contributed to a stronger Shilling and reduced inflationary pressures. Lower interest rates tend to reduce capital inflows as foreign investors demand for local assets reduces, which might put pressure on the Shilling due to limited supply of foreign currency,
-
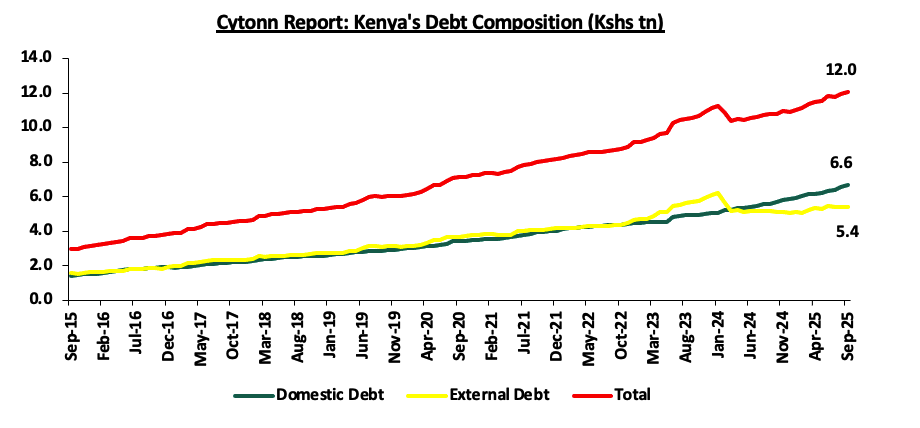
The high debt levels in the country with the Kenya’s public debt having grown at a 10-year CAGR of 15.2% to Kshs 12.1 tn in September 2025, from Kshs 2.9 tn in September 2015, with external debt accounting for 44.7% of the total debt. This continues to put pressure on our foreign reserves due to the burden of high debt servicing costs and hence continues to weigh down on the Kenyan shilling. The chart below highlights the trend in the country’s debt composition:
Source: CBK
Section II: Evolution of the Interest Rate Environment in Kenya
Interest rates in Kenya are primarily influenced by the Central Bank of Kenya (CBK) through the Central Bank Rate (CBR), which guides the cost of borrowing and liquidity in the economy. The Monetary Policy Committee (MPC) adjusts the CBR based on inflation, exchange rates, and economic growth trends. Commercial banks use this benchmark to set lending and deposit rates, affecting credit availability and overall economic activity.
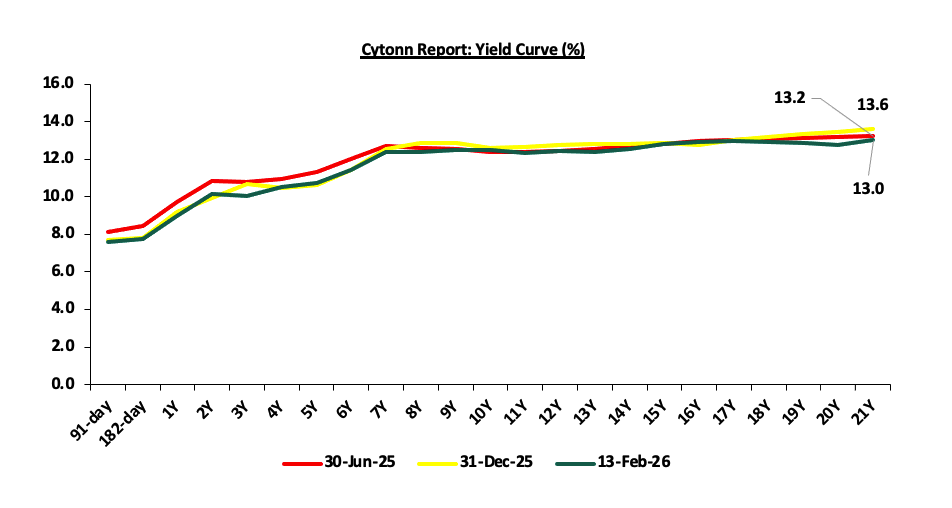
In FY’2025, interest rates were on a downward trajectory with rates on the 91-day paper falling by 209.7 basis points cumulatively, to close the year at 7.7%, down from the rate of 9.8% recorded at the beginning of the year. However, interest rates recorded highs of 16.0%, 16.9%, and 16.9% for the 91-day, 182-day and 364-day papers respectively in July 2024 before the downward trend. The significant decrease in interest rates is attributed to investors perceiving lower risks due to reduced credit risk on the country, eased inflation, currency stability, and improved liquidity positions. As a result, there was less demand for higher returns to compensate for potential losses. Government securities yields trended downward throughout 2025, supported by easing inflation and a more accommodative monetary policy stance. The yield curve had already normalized in December 2024, reversing the earlier inversion where short- to medium-term yields exceeded long-term yields.
By late 2025 and into February 2026, the curve remained stable and upward-sloping, reflecting improved investor confidence and balanced market expectations. The graph below shows the yield curve over the period:
Over the last 10-year yields on government papers have remained steady for the most part, with the yields on the 91-day paper averaging 8.9%. However, Kenya’s interest rates witnessed high volatility in 2024 with the 91-day paper hitting a record high of 16.7% in March 2024 attributed to the tight monetary policy stance adopted by the Central Bank of Kenya, with the Monetary Policy Committee (MPC) raising the CBR to 10.0% in June 2015 from 8.5% in order to anchor inflationary expectations and curtail demand pressures in the economy, and, 16.0% in July 2024, attributable to the tight monetary policy with CBR at 13.0%. However, following an ease in inflationary pressures and a stronger Shilling, the CBK has since adopted an expansionary monetary policy stance by cutting the Central Bank Rate and Cash Reserve Ratio in in a bid to support the economy through reduced cost of borrowing and improved liquidity. The chart below highlights the trend in the 91-day T-bill weighted average yield for the last 10 years:
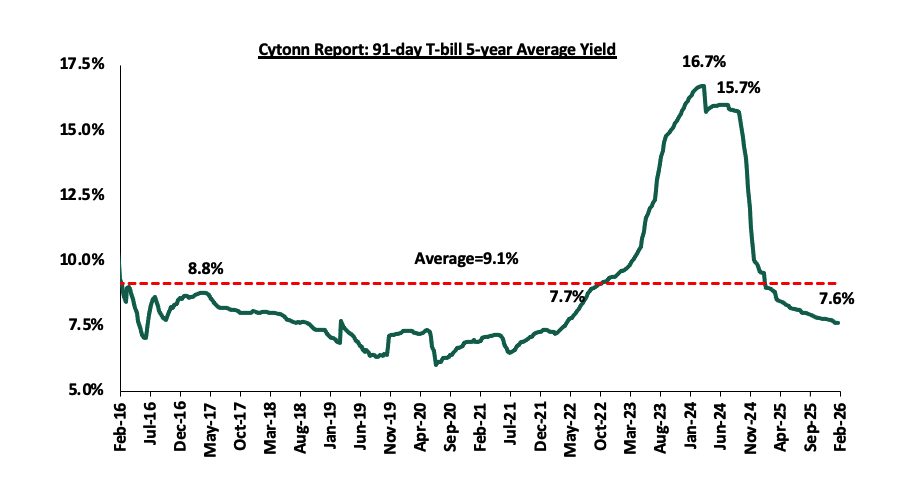
The yields on the government papers continue to decline in 2026, with the yields on the 91-day paper recording a YTD decline of 11.9 bps to 7.6% as of 12th February 2026, from the 7.7% recorded at the start of the year. The yields on the 364-day and 182-day papers have declined by 23.4 bps and 3.0 bps respectively on a YTD basis to 9.0% and 7.8% as of 12th February 2026, from the 9.2% and 7.8% respectively recorded at the start of the year.
The Kenyan macroeconomic environment has shown major improvement mainly as a result of the reduced inflationary pressures and appreciation of the Kenyan Shilling that have supported business production levels. Business conditions in the Kenyan private sector recorded an improvement during the year, with the average Stanbic Bank Monthly Purchasing Managers’ Index (PMI) for 2025 averaging at 51.0, 3.0% points higher than the average of 49.6 recorded during a similar period in 2024, and currently at 51.9 as of January 2026 and above the expansionary zone of 50.0. Additionally, we expect the reduced borrowing costs to increase lending to the private sector, which has increased to 6.4% in January 2026 from (2.9%) in January 2025, hence increasing activity and growth in the economy. Despite this, cost of living still remains high in the country partly on the back of increased taxation, impeding on revenue collection and as such, we expect revenue collection to slightly lag behind the revised target.
Section III: Currency Outlook
|
Driver |
Outlook |
Effect on the currency |
|
Balance of Payments |
|
Neutral |
|
Government Debt |
|
Negative |
|
Forex Reserves |
Additionally, we expect the reserves to be supported by improving diaspora remittance inflows which came in at USD 5,020.7 mn in the 12 months to January 2026 which is 1.2% higher than the USD 4,960.2 mn recorded over the same period in 2025 and the increasing exports especially in the agricultural sector with government having subsidized key inputs such as fertilizers. This will in turn support the stability of the Kenyan Shilling
|
Positive |
|
Monetary Policy |
|
Neutral |
From the above currency drivers, 1 is negative (Government Debt), 2 are neutral (Balance of payment and Monetary Policy), while 1 is positive (Forex Reserves) indicating a more stable outlook for the currency.
Section IV: Factors Expected to Drive the Interest Rate Environment
-
Monetary Policy
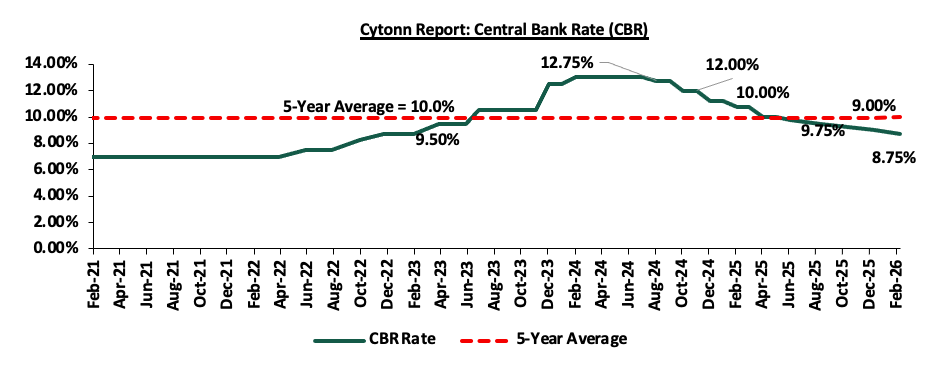
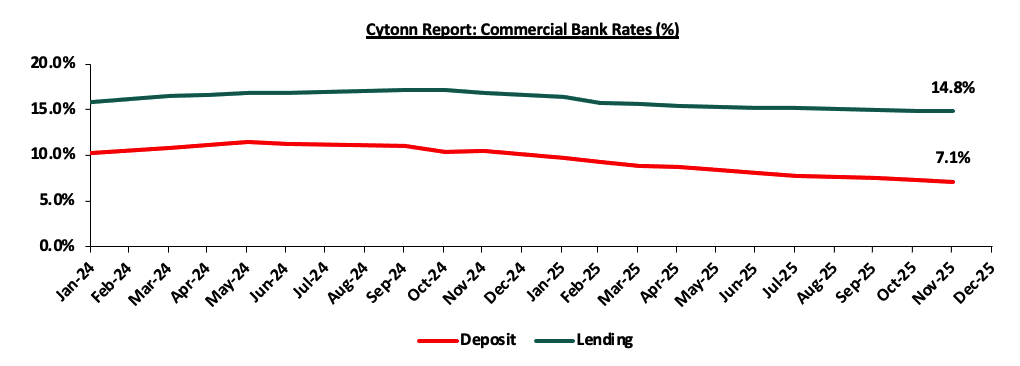
The monetary policy committee has continued to play a crucial role in determining the interest rates levels in the country. In 2025, the interest rates have been on a downward trajectory, with the 91-day, 182-day and 364-day papers registering declines of 209.7, 222.6 and 216.0 bps to 7.7%, 7.8% and 9.2% from 9.8%, 10.0% and 11.4% respectively. The yields on the short-term papers then began to decline, gaining momentum following the Central Bank's decision to reduce the base lending rate to 11.25% by December 2024, a cumulative 175 .0 bps from the existed 13.00% in July 2024, which saw the rates decline to close 2024 at 9.9%, 10.0%, and 11.4% for 91-day, 182-day and 364-day papers respectively. In its December meeting, the MPC noted that its previous measures had contained inflation which stood at 4.5% as of November 2025, nearing the lower end of the target range of 2.5%-7.5%. In its latest meeting held in February 2026, the MPC cut the CBR further by 25.0 bps to 8.75%. Short-term paper yields declined after the CBK cut the base lending rate to 9.00% by December 2025 225 bps drop from 11.20% in January 2025, closing the year at 7.7%, 7.8% and 9.2% for the 91-day, 182-day and 364-day papers respectively. The MPC attributed the cut in December 2025 to contained inflation, which fell to 4.5% in November 2025, nearing the 2.5%-7.5% target range. In February 2026, the CBR was cut further by 25 bps to 8.75%. The policy rate influences the cost of borrowing for banks and consequently, affects the rates at which they lend to businesses and individuals. This, in turn, creates a ripple effect on the overall interest rate environment, including the yields on government securities. Since then, the rates for short-term government papers have declined, reaching 7.6%, 7.8%, and 9.0% for 91-day, 182-day, and 364-day papers, respectively as of 16th February 2026. The Central Bank is expected to continue with the expansionary monetary policy stance in the medium term with the intention to revive private sector growth and boost economic activity and has initiated on-site inspections of commercial banks to ensure they reduce lending rates in line with recent monetary policy changes. As such, we expect to see continued downward pressure on the interest rates attributable to investors perceiving lower risks due to eased inflation, currency appreciation, and improved liquidity positions. The following is a graph highlighting the Central Bank Rate and commercial banks rates for the last 5 years;
Source: CBK
Source: CBK
-
Fiscal policies
The government continues to put in place measures to broaden the revenue base and rationalize expenditures in order to reduce the fiscal deficits. The FY’2025/26 budget primarily aims to achieve growth-friendly fiscal consolidation by safeguarding the country’s debt sustainability through targeted expenditure rationalization and enhanced revenue mobilization. However, the upward revision of taxes comes at a time when the cost of living is high, weighing down on the projected revenue performance. As such, we expect this will significantly affect revenue collection necessitating borrowing to plug in the budget deficit. Below is a chart showing the revenue collections and domestic borrowings over the last 10 financial years:
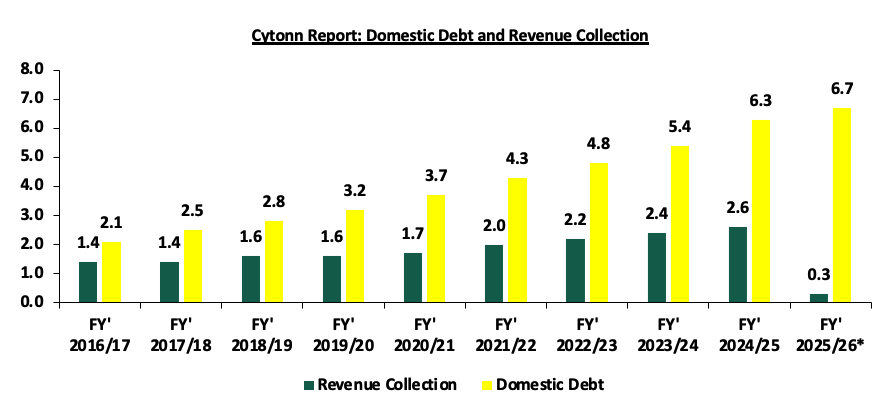
Source: National Treasury, KRA, * Domestic Debt Figures as of September 2025, *Revenue collection as of January 2026
-
Liquidity
The MPC maintained the Cash Reserve Ratio (CRR) at 3.25% in their February 2026. This is aimed to support the lowering of lending rates, complement the reduction in the CBR, and address banks’ reluctance to lower their lending rates in line with CBR cuts. By maintaining the CRR at 3.25%, the MPC freed up liquidity that banks had previously been required to hold with the Central Bank. This increased the money supply in the interbank market and commercial lending. Liquidity in the money market eased in 2025, as evidenced by the decrease in the average interbank rate by 3.1% points to 9.9% from 13.0% in 2024. Similarly, the average volumes traded in the interbank market decreased by 48.2% to Kshs 13.8 bn in 2025, from Kshs 26.7 bn recorded in 2024. In an ideal situation, ample liquidity in the money market, the lowering of commercial banks’ lending rates, and deposit rates would lead to increased money supply in the economy and an increase in consumers’ purchasing power. The low Cash Reserve Ratio has played a big role in maintaining favourable liquidity in the money market as well increases the supply of money by commercial banks. We expect liquidity to improve in 2026 driven by increased access to credit as banks gradually increase their lending to the private sector and the continued adoption of risk-based lending by banks. However, due to uncertainties in the economy, there still exists a high credit risk which hampers lending to businesses and individuals.
Outlook:
|
Driver |
Outlook |
Effect on Interest Rates |
|
Fiscal Policies |
• The government is expected to continue borrowing in order to offset the budget deficit and finance debt maturities. The total T-bonds and T-bill maturities so far stand at Kshs 96.8 bn and Kshs 539.4 bn, respectively for the remaining FY’2025/26 which is likely to put pressure on rates |
Negative |
|
Monetary Policy |
|
Positive |
|
Liquidity |
|
Positive |
From the above indicators, 1 of the drivers is negative (fiscal policies), and 2 are positive (Monetary policies and liquidity). We therefore believe that the interest rate environment remains optimistic and will likely adjust further downwards.
Section V: Conclusion and Our View Going Forward
Based on the factors discussed above and factoring in the uncertainties in the Kenyan macroeconomic environment;
-
We expect the Kenya Shilling to trade within the range of between Kshs 129.0 and Kshs 132.0 against the USD by the end of 2026 based on the purchasing power parity (PPP) and interest rate parity (IRP) approach respectively, with a bias of a 2.3% depreciation mainly driven by:
-
The ever-present current account deficit with Kenya being a net importer, which will increase US Dollar demand in the market,
-
The low interest rates as evidenced by the expansionary monetary policy stance adopted by the MPC. The lower interest rates will lead to reduced capital inflows as foreign investor demand for local assets reduces, and,
-
The persistent US Dollar demand by importers, mainly in the oil and energy sector as well as manufacturers.
-
We expect a continued downward readjustment on the yield curve with our sentiments being on the back of the improved liquidity in the money markets, allowing for cheaper borrowing for budgetary support, funding of infrastructure projects, and payment of domestic maturities. Further, we expect the yield curve to normalize in the short to medium- term as the government turns to increased external borrowing alleviating pressure on the domestic market.
Concerns about the future performance of the Kenyan shilling have eased, driven by reduced pressure on the currency and improved foreign exchange reserves. However, the high national debt will continue to exert pressure on the shilling. As we anticipate continued currency stability, economic improvement is expected, reflected in a declining import bill. Despite the implementation of an eased monetary policy, marked by the MPC's reduction of the Central Bank rate to 8.75% in February 2026 from 9.00%, we still expect inflationary pressures to be contained in the short-term, remaining within the CBK’s target range of 2.5%-7.5%. The current stability of the Kenyan shilling is likely to be sustained in the immediate future, contingent on the government’s ability to effect proactive measures that further sustain the strong Shilling. These measures encompass strategic interventions and policies aimed at maintaining the stability of the currency and fostering economic resilience. They include:
-
Formulate policies to encourage Foreign Direct Investments (FDIs): The government should prioritize creating an attractive investment environment for foreign investments by improving transparency in all required regulations as well as reducing hurdles in the process. This would include targeting sectors that enjoy global interest like the Renewable Energy sector and Sustainable Energy Development Goals (SEDG), and could include incentives for the same. This would majorly increase the foreign exchange reserves thus reducing the pressure on the foreign currency in the Kenyan markets,
-
Promotion of Tourism through Implementing robust marketing campaigns to attract international tourists and enhancing the tourism infrastructure which will help increase the inflow of dollars and hence boost our Foreign Exchange Reserves
-
Dramatically cut Spending: The government should contain expenditure by limiting expenditure to the core activities of the government as well as reducing wasteful spending at both the County and Central government levels
-
Reduce corruption: The government should adopt measures to reduce corruption, improve transparency, and strengthen governance structures. A corruption-free environment attracts foreign direct investment, enhance economic efficiency, and instils confidence in the stability of the Kenyan Shilling.
-
Stimulate our moribund capital markets to attract foreign investors: The government should focus on improving the capital markets by implementing policies that encourage foreign investment, streamlining regulatory frameworks, and introducing investor-friendly initiatives. A vibrant capital market attracts foreign capital as well as enhances liquidity and diversifies investment options, contributing positively to currency stability.
-
Maintaining a sustainable debt level: The government should find a harmonious equilibrium between engaging in foreign borrowing to boost foreign reserves and preserving a favourable credit standing with creditors. This delicate balance is crucial for maintaining the country's attractiveness to investors, facilitating capital inflows and financial stability.
Disclaimer: The views expressed in this publication are those of the writers where particulars are not warranted. This publication, which is in compliance with Section 2 of the Capital Markets Authority Act Cap 485A, is meant for general information only and is not a warranty, representation, advice, or solicitation of any nature. Readers are advised in all circumstances to seek the advice of a registered investment advisor.

- Talk to us
- Kenya
- P.O Box 20695 - 00200, Nairobi, Kenya
- Cell +254709101200
- Tel +254709101200
- WhatsApp +254741676635
- United States
- +254709101200
- DOWNLOAD OUR APP
-


- Kenya
- 8th Floor, Pinetree Plaza, Kaburu Drive, Ngong Road, Nairobi, Kenya
- USA
- Suite 1150, 1775 Eye Street NW, USA, Washington DC 20006, USA
- Investments
- High Yield
- Private Equity
- Real Estate
- Real Estate
- RiverRun Estates
- Cytonn Towers
- The Ridge
- Taraji Heights
- The Alma