Kenya FY’2024 Listed Insurance Report, & Cytonn Weekly #28/2025
By Cytonn Research, Jul 13, 2025
Executive Summary
Fixed Income
This week, T-bills were undersubscribed for the third consecutive week, with the overall subscription rate coming in at 94.9%, higher than the subscription rate of 90.9% recorded the previous week. Investors’ preference for the shorter 91-day paper prevailed, with the paper receiving bids worth Kshs 4.2 bn against the offered Kshs 4.0 bn, translating to a subscription rate of 103.8%, higher than the subscription rate of 67.4%, recorded the previous week. The subscription rates for the 182-day paper decreased to 89.7% from the 111.7% recorded the previous week, while for the 364-day paper increased to 96.6% from the 79.6% recorded the previous week. The government accepted a total of Kshs 22.75 bn worth of bids out of Kshs 22.78 bn bids received, translating to an acceptance rate of 99.9%. The yields on the government papers registered a mixed performance with the yields on the 91-day paper and 182-day paper decreasing by 0.3 bps and 1.0 bps to 8.1% and 8.4%, from the 8.2% and 8.5% recorded the previous week respectively, while the yields on the 364-day increased by 0.8 bps to 9.72% from 9.71% recorded the previous week;
Also, during the week, the Central Bank of Kenya released the auction results for the re-opened treasury bonds; FXD1/2018/020 and FXD1/2018/025 with tenors to maturities of 12.8 years and 18.0 years respectively, and fixed coupon rates of 13.2% and 13.4% respectively. The bonds were oversubscribed, with the overall subscription rate coming in at 153.8%, receiving bids worth Kshs 76.9 bn against the offered Kshs 50.0 bn. The government accepted bids worth Kshs 66.7 bn, translating to an acceptance rate of 86.7%. The weighted average yield for the accepted bids for the FXD1/2018/020 and FXD1/2018/025 came in at 13.9% and 14.3% respectively. Notably, the 14.3% on the FXD1/2018/025 was higher than the 13.8% recorded the last time the bond was reopened in March 2025, while the 13.9% on the FXD1/2018/020 was lower than the 15.1% recorded the last time the bond was reopened in December 2024. With the Inflation rate at 3.8% as of June 2025, the real returns of the FXD1/2018/020 and FXD1/2018/025 are 10.1% and 10.5%. Given the 10.0% withholding tax on the bonds, the tax equivalent yields for shorter term bonds with 15.0% withholding tax are 14.7% and 15.2% for the FXD1/2018/020 and FXD1/2018/025 respectively;
During the week, the Kenya Revenue Authority (KRA) released the annual revenue performance for FY’2024/25, highlighting that revenue collection for the period grew by 6.8% down from 11.1% growth in the previous financial year, after KRA collected Kshs 2.57 tn compared to Kshs 2.4 tn in the previous financial year. This translates to a performance rate of 100.6% against the target of Kshs 2.55 tn;
Equities
During the week, the equities market recorded a mixed performance, with NSE 20 gaining by 0.4%, while NASI, NSE 25 and NSE 10 lost by 1.3%, 0.7% and 0.7% respectively, taking the YTD performance to gains of 26.9%, 22.1%, 18.1% and 17.9% for NASI, NSE 20, NSE 10 and NSE 25 respectively. The equities market performance was driven by losses recorded by large-cap stocks such as Equity, Stanbic and Safaricom of 4.1%, 3.7% and 3.5% respectively. The performance was however supported by gains recorded by large cap stocks such as EABL, BAT and DTB-K of 10.7%, 3.7% and 1.6% respectively;
Additionally, in the regional equities market, the East African Exchanges 20 (EAE 20) share index lost by 0.8%, attributable to losses recorded by large cap stocks such as Equity Group, Tanzania Cigarette and Tanzania Breweries of 1.5%, 1.3% and 1.3% respectively. The performance was however supported by gains recorded by large cap stocks such as CRDB Bank, NMB Bank and Bank of Baroda Uganda of 24.6%, 3.3% and 3.2% respectively;
Real Estate
During the week, Knight Frank released its annual report titled Africa Horizons 2025/26, where according to the report 15.0% of Nairobi’s housing units have shifted to short-term rentals, driving a 10.0% rent increase over two years as Nairobi residents are now competing with this new demand. Policymakers and various stakeholders face a daunting task of harnessing economic benefits of short-term rentals without worsening the housing crisis;
During the week, the government expressed its plan to upgrade and improve the Jomo Kenyatta International Airport before the end of the year. This comes after President William Ruto announced the cancellation of the Adani airport deal due to widespread public outcry and concern after controversial clauses in the contract, which had been shrouded in secrecy were discovered in the contract;
Additionally, during the week, Roads and Transport Cabinet Secretary confirmed that the Narok Airport project has officially taken off, with construction already underway. The development is jointly funded by the national and county governments at a cost of KShs 1.4 bn. It is aimed at improving air connectivity to Narok County and the greater Maasai Mara region, one of Kenya’s key tourism and conservation zones. This infrastructure push is expected to open up the area to increased economic activity, particularly in the tourism, transport, and property sectors. The project stands in sharp contrast to the stalled Kericho Airport upgrade, which has been halted due to procurement irregularities and is currently inactive;
On the Unquoted Securities Platform, Acorn D-REIT and I-REIT traded at Kshs 26.7 and Kshs 22.9 per unit, respectively, as per the last updated data on 04th July 2025. The performance represented a 33.4% and 14.5% gain for the D-REIT and I-REIT, respectively, from the Kshs 20.0 inception price. Additionally, ILAM Fahari I-REIT traded at Kshs 11.0 per share as of 04th July 2025, representing a 45.0% loss from the Kshs 20.0 inception price. The volume traded to date came in at 1.2 mn shares for the I-REIT, with a turnover of Kshs 1.5 mn since inception in November 2015;
Focus of the Week
Following the release of FY’2024 results by insurance companies, the Cytonn Financial Services Research Team undertook an analysis on the performance of the 5 listed insurance companies in Kenya, identified the key factors that influenced their performance, and gave our outlook for the insurance sector going forward.
Investment Updates:
- Weekly Rates: Cytonn Money Market Fund closed the week at a yield of 13.5% p.a. To invest, dial *809# or download the Cytonn App from Google Play store here or from the Appstore here;
- We continue to offer Wealth Management Training every Tuesday, from 7:00 pm to 8:00 pm. The training aims to grow financial literacy among the general public. To register for any of our Wealth Management Trainings, click here;
- If interested in our Private Wealth Management Training for your employees or investment group, please get in touch with us through wmt@cytonn.com;
- Cytonn Insurance Agency acts as an intermediary for those looking to secure their assets and loved ones’ future through insurance namely; Motor, Medical, Life, Property, WIBA, Credit and Fire and Burglary insurance covers. For assistance, get in touch with us through insuranceagency@cytonn.com;
- Cytonn Asset Managers Limited (CAML) continues to offer pension products to meet the needs of both individual clients who want to save for their retirement during their working years and Institutional clients that want to contribute on behalf of their employees to help them build their retirement pot. To more about our pension schemes, kindly get in touch with us through pensions@cytonn.com;
Hospitality Updates:
- We currently have promotions for Staycations. Visit cysuites.com/offers for details or email us at sales@cysuites.com;
Money Markets, T-Bills and T-Bonds Primary Auction:
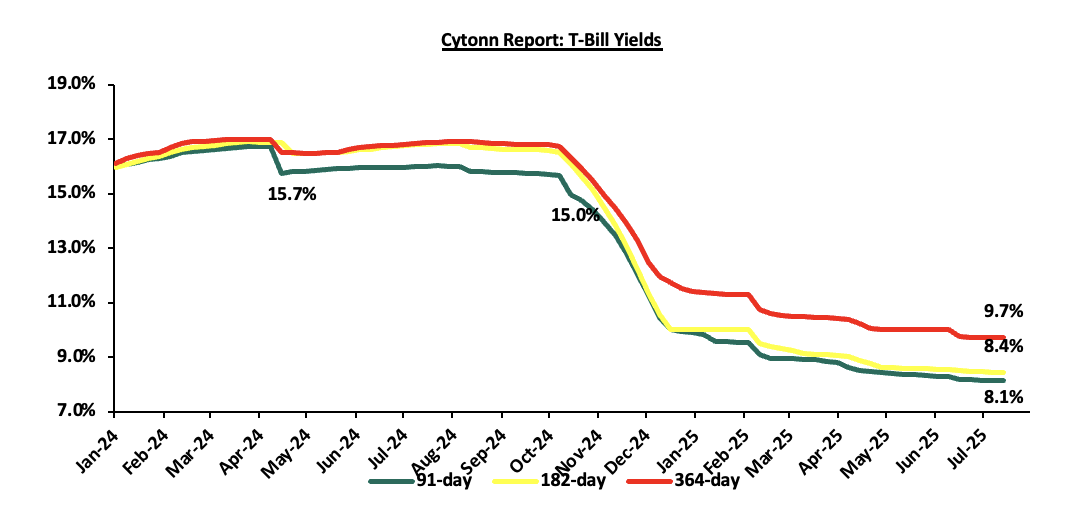
This week, T-bills were undersubscribed for the third consecutive week, with the overall subscription rate coming in at 94.9%, higher than the subscription rate of 90.9% recorded the previous week. Investors’ preference for the shorter 91-day paper prevailed, with the paper receiving bids worth Kshs 4.2 bn against the offered Kshs 4.0 bn, translating to a subscription rate of 103.8%, higher than the subscription rate of 67.4%, recorded the previous week. The subscription rates for the 182-day paper decreased to 89.7% from the 111.7% recorded the previous week, while for the 364-day paper increased to 96.6% from the 79.6% recorded the previous week. The government accepted a total of Kshs 22.75 bn worth of bids out of Kshs 22.78 bn bids received, translating to an acceptance rate of 99.9%. The yields on the government papers registered a mixed performance with the yields on the 91-day paper and 182-day paper decreasing by 0.3 bps and 1.0 bps to 8.1% and 8.4%, from the 8.2% and 8.5% recorded the previous week respectively, while the yields on the 364-day increased by 0.8 bps to 9.72% from 9.71% recorded the previous week.
The chart below shows the yield performance of the 91-day, 182-day and 364-day papers over the period;
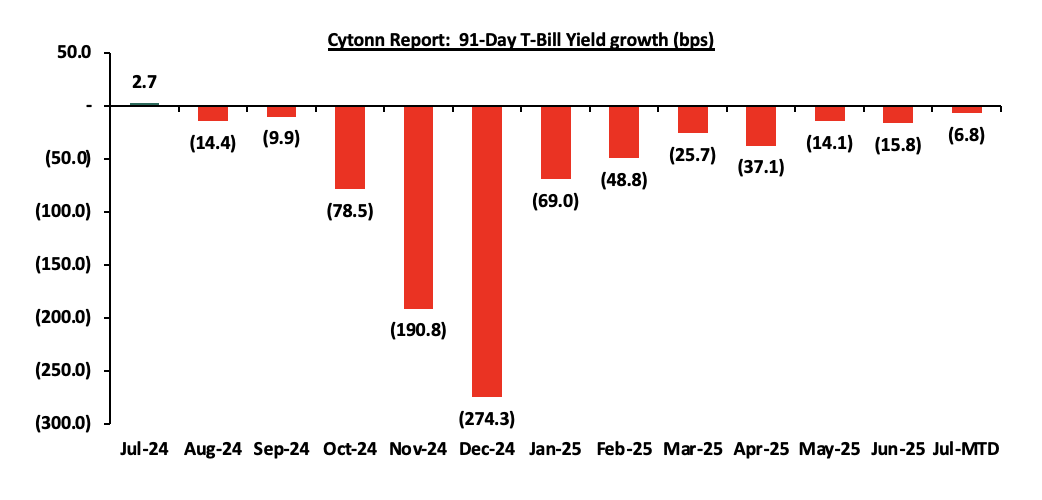
The chart below shows the yield growth for the 91-day T-bill:
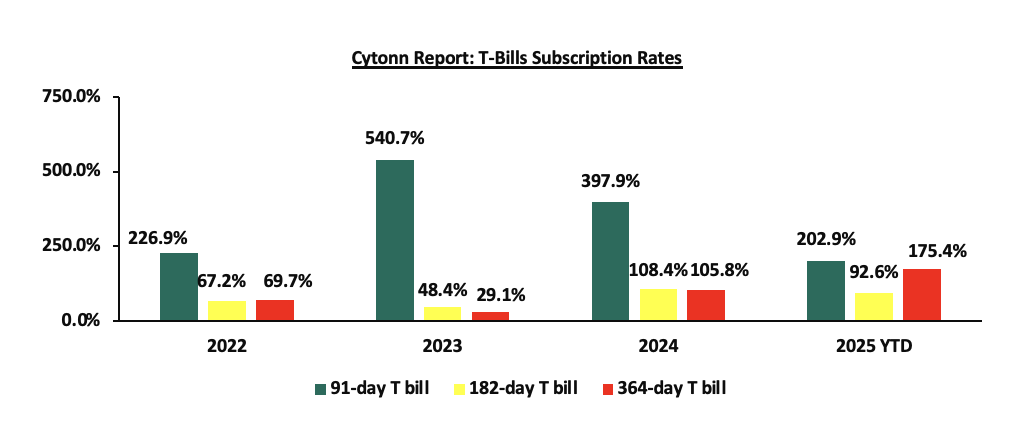
The chart below compares the overall average T-bill subscription rates obtained in 2022,2023, 2024 and 2025 Year-to-date (YTD):
During the week, the Central Bank of Kenya released the auction results for the re-opened treasury bonds; FXD1/2018/020 and FXD1/2018/025 with tenors to maturities of 12.8 years and 18.0 years respectively and fixed coupon rates of 13.2% and 13.4% respectively. The bonds were oversubscribed, with the overall subscription rate coming in at 153.8%, receiving bids worth Kshs 76.9 bn against the offered Kshs 50.0 bn. The government accepted bids worth Kshs 66.7 bn, translating to an acceptance rate of 86.7%. The weighted average yield for the accepted bids for the FXD1/2018/020 and FXD1/2018/025 came in at 13.9% and 14.3% respectively. Notably, the 14.3% on the FXD1/2018/025 was higher than the 13.9% recorded the last time the bond was reopened in March 2025, while the 13.8% on the FXD1/2018/020 was lower than the 15.1% recorded the last time the bond was reopened in December 2024. With the Inflation rate at 3.8% as of June 2025, the real returns of the FXD1/2018/020 and FXD1/2018/025 are 10.1% and 10.5%. Given the 10.0% withholding tax on the bonds, the tax equivalent yields for shorter term bonds with 15.0% withholding tax are 14.7% and 15.2% for the FXD1/2018/020 and FXD1/2018/025 respectively.
Money Market Performance:
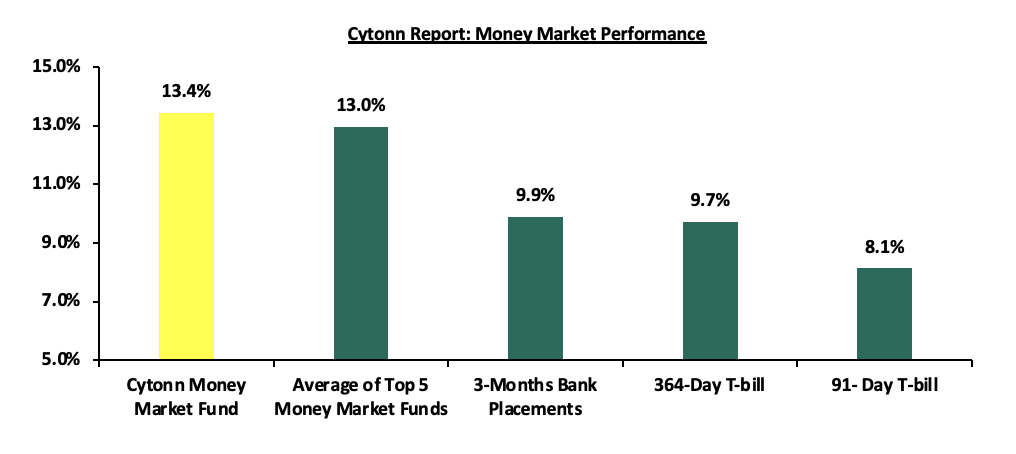
In the money markets, 3-month bank placements ended the week at 9.9% (based on what we have been offered by various banks), while the yields on the government papers registered a mixed performance with the yields on 91-day papers decreasing by 0.3 bps to 8.1% from the 8.2% recorded the previous week, while the yields on the 364-day papers increased by 0.8 bps to 9.72% from the 9.71% recorded the previous week. The yield on the Cytonn Money Market Fund remained unchanged from the 13.4% recorded the previous week, while the average yields on the Top 5 Money Market Funds decreased marginally by 4.6 bps to remain relatively unchanged from the 13.0% recorded the previous week.
The table below shows the Money Market Fund Yields for Kenyan Fund Managers as published on 11th July 2025:
|
Money Market Fund Yield for Fund Managers as published on 11th July 2025 |
||
|
Rank |
Fund Manager |
Effective Annual Rate |
|
1 |
Cytonn Money Market Fund (Dial *809# or download Cytonn App) |
13.4% |
|
2 |
Gulfcap Money Market Fund |
13.1% |
|
3 |
Ndovu Money Market Fund |
13.1% |
|
4 |
Lofty-Corban Money Market Fund |
12.7% |
|
5 |
Kuza Money Market fund |
12.5% |
|
6 |
Etica Money Market Fund |
12.5% |
|
7 |
Orient Kasha Money Market Fund |
12.3% |
|
8 |
Nabo Africa Money Market Fund |
11.9% |
|
9 |
GenAfrica Money Market Fund |
11.5% |
|
10 |
Madison Money Market Fund |
11.1% |
|
11 |
Arvocap Money Market Fund |
11.1% |
|
12 |
Enwealth Money Market Fund |
11.0% |
|
13 |
Old Mutual Money Market Fund |
11.0% |
|
14 |
Jubilee Money Market Fund |
10.9% |
|
15 |
British-American Money Market Fund |
10.9% |
|
16 |
Faulu Money Market Fund |
10.4% |
|
17 |
Apollo Money Market Fund |
10.3% |
|
18 |
Sanlam Money Market Fund |
10.2% |
|
19 |
Dry Associates Money Market Fund |
10.1% |
|
20 |
Genghis Money Market Fund |
9.8% |
|
21 |
KCB Money Market Fund |
9.7% |
|
22 |
Mali Money Market Fund |
9.5% |
|
23 |
ICEA Lion Money Market Fund |
9.4% |
|
24 |
Co-op Money Market Fund |
9.2% |
|
25 |
CIC Money Market Fund |
9.1% |
|
26 |
Absa Shilling Money Market Fund |
8.6% |
|
27 |
Mayfair Money Market Fund |
8.6% |
|
28 |
CPF Money Market Fund |
8.6% |
|
29 |
AA Kenya Shillings Fund |
7.9% |
|
30 |
Ziidi Money Market Fund |
6.8% |
|
31 |
Stanbic Money Market Fund |
6.7% |
|
32 |
Equity Money Market Fund |
4.5% |
Source: Business Daily
Liquidity:
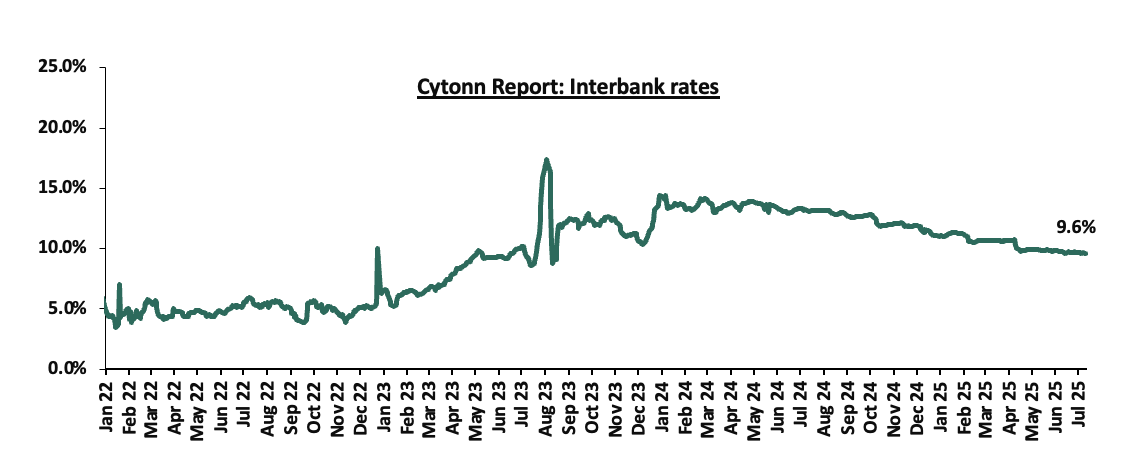
During the week, liquidity in the money markets marginally eased, with the average interbank rate decreasing by 4.7 bps, to remain relatively unchanged from the 9.6% recorded the previous week, partly attributable to tax remittances that were offset by government payments. The average interbank volumes traded increased significantly by 140.3% to Kshs 11.9 bn from Kshs 5.0 bn recorded the previous week. The chart below shows the interbank rates in the market over the years:
Kenya Eurobonds:
During the week, the yields on Kenya’s Eurobonds were on an upward trajectory with the yield on the 10-year Eurobond issued in 2018 increasing the most by 33.3 bps to 8.4% from the 8.0% recorded the previous week. The table below shows the summary performance of the Kenyan Eurobonds as of 10th July 2025;
|
Cytonn Report: Kenya Eurobond Performance |
|||||||
|
|
2018 |
2019 |
2021 |
2024 |
2025 |
||
|
Tenor |
10-year issue |
30-year issue |
7-year issue |
12-year issue |
13-year issue |
7-year issue |
11-year issue |
|
Amount Issued (USD) |
1.0 bn |
1.0 bn |
0.9 bn |
1.2 bn |
1.0 bn |
1.5 bn |
1.5 bn |
|
Years to Maturity |
2.7 |
22.7 |
1.9 |
6.9 |
9.0 |
5.7 |
10.7 |
|
Yields at Issue |
7.3% |
8.3% |
7.0% |
7.9% |
6.2% |
10.4% |
9.9% |
|
02-Jan-25 |
9.1% |
10.3% |
8.5% |
10.1% |
10.1% |
10.1% |
9.95% |
|
01-Jul-25 |
8.0% |
10.3% |
- |
9.4% |
9.7% |
9.3% |
|
|
03-Jul-25 |
8.0% |
10.3% |
- |
9.4% |
9.6% |
9.2% |
|
|
04-Jul-25 |
8.0% |
10.3% |
- |
9.4% |
9.6% |
9.2% |
|
|
07-Jul-25 |
8.1% |
10.3% |
- |
9.4% |
9.7% |
9.3% |
|
|
08-Jul-25 |
8.2% |
10.4% |
- |
9.5% |
9.7% |
9.3% |
|
|
09-Jul-25 |
8.3% |
10.5% |
- |
9.5% |
9.8% |
9.4% |
|
|
10-Jul-25 |
8.4% |
10.5% |
- |
9.7% |
9.9% |
9.5% |
|
|
Weekly Change |
0.3% |
0.2% |
- |
0.2% |
0.2% |
0.3% |
- |
|
MTD Change |
0.3% |
0.2% |
- |
0.2% |
0.2% |
0.2% |
- |
|
YTD Change |
(0.7%) |
0.2% |
- |
(0.4%) |
(0.2%) |
(0.6%) |
- |
Source: Central Bank of Kenya (CBK) and National Treasury
Kenya Shilling:
During the week, the Kenyan Shilling depreciated marginally against the US Dollar by 0.1 bps, to remain unchanged from the Kshs 129.2 recorded the previous week. On a year-to-date basis, the shilling has appreciated by 5.0 bps against the dollar, compared to the 17.4% appreciation recorded in 2024.
We expect the shilling to be supported by:
- Diaspora remittances standing at a cumulative USD 5,084.0 mn in the twelve months to June 2025, 12.1% higher than the USD 4,535.0 mn recorded over the same period in 2024. These has continued to cushion the shilling against further depreciation. In the June 2025 diaspora remittances figures, North America remained the largest source of remittances to Kenya accounting for 57.9% in the period,
- The tourism inflow receipts which came in at Kshs 452.2 bn in 2024, a 19.8% increase from Kshs 377.5 bn inflow receipts recorded in 2023, and owing to tourist arrivals that improved by 8.0% to 2,303,028 in the 12 months to February 2025 from 2,133,612 in the 12 months to February 2024 and,
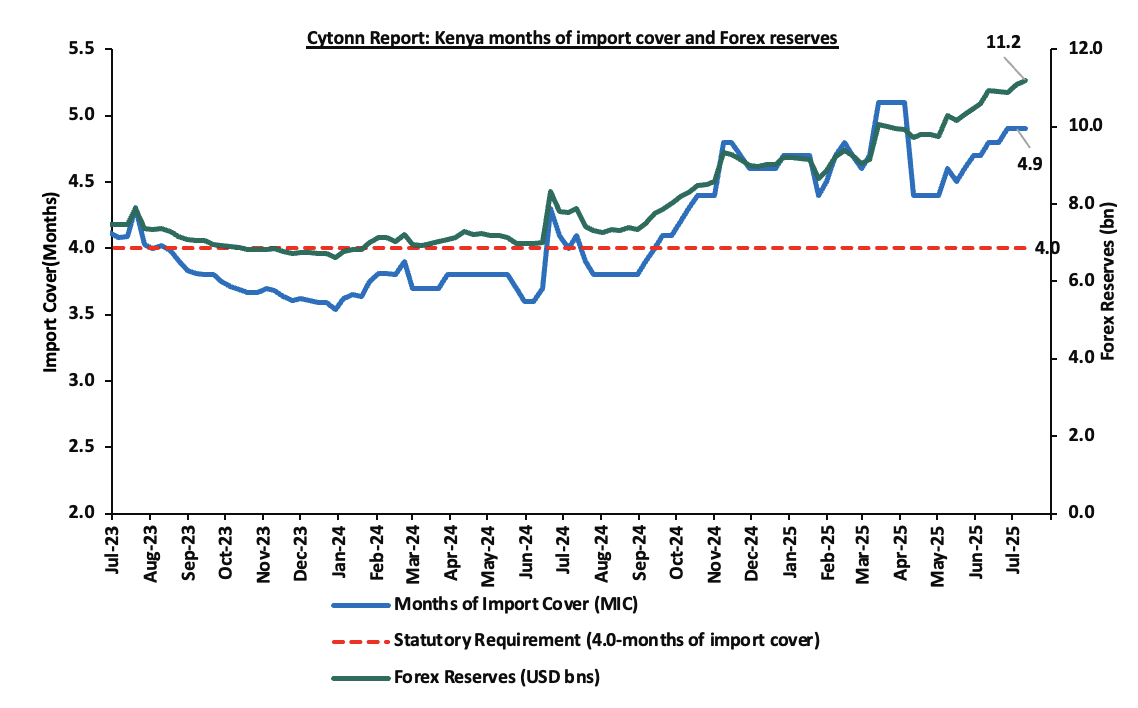
- Improved forex reserves currently at USD 11.2 bn (equivalent to 4.9-months of import cover), which is above the statutory requirement of maintaining at least 4.0-months of import cover and above the EAC region’s convergence criteria of 4.5-months of import cover.
The shilling is however expected to remain under pressure in 2025 as a result of:
- An ever-present current account deficit which came at 1.8% of GDP in the twelve months to April 2025, and,
- The need for government debt servicing, continues to put pressure on forex reserves given that 62.0% of Kenya’s external debt is US Dollar-denominated as of December 2024.
Key to note, Kenya’s forex reserves increased by 1.0% during the week, from the USD 11.2 bn recorded in the previous week, (equivalent to 4.9 months of import cover), and above the statutory requirement of maintaining at least 4.0-months of import cover and above the EAC region’s convergence criteria of 4.5-months of import cover.
The chart below summarizes the evolution of Kenya's months of import cover over the years:
Weekly highlights
- Kenya Revenue Authority (KRA) FY’2024/25 Revenue Performance
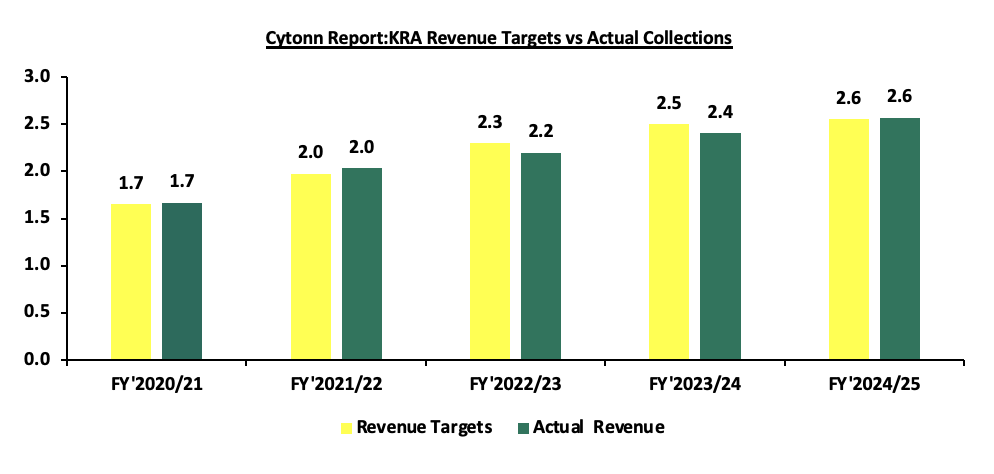
During the week, the Kenya Revenue Authority (KRA) released the annual performance for FY’2024/25, highlighting that revenue collection for the period grew by 6.8% down from 11.1 % growth in the previous financial year, after KRA collected Kshs 2.6 tn compared to Kshs 2.4 tn in the previous financial year. This translates to a performance rate of 100.6% against the target of 2.55 tn. The chart below shows the revenue collected against the targets in the last five years:
Some of the key take-outs from the release include;
- The Exchequer revenue (revenue collected for the National Treasury) grew by 4.5% after KRA collected Kshs 2.3 tn compared to Kshs 2.2 tn collected in the previous financial year,
- Agency revenue (collected for government agencies) recorded a 34.9% growth with a collection of Kshs 248.3 bn compared to 184.0 bn collected in FY’2023/24,
- Customs Revenue recorded growth of 11.1% with a collection of Kshs 879.3 bn compared to the 791.3 bn collected in FY’2023/24, and,
- Domestic Taxes registered a revenue growth of 4.8% after collecting Kshs 1.7 tn, from the Kshs 1.6 tn collected in the previous financial year.
The table below summarizes the performance of some of the key tax heads;
|
Cytonn Report: Performance of Key Tax Heads (Kshs Bn) |
|||
|
Tax head |
Collection FY'2023/2024 |
Collection FY'2024/25 |
y/y growth |
|
PAYE |
543.2 |
560.9 |
3.3% |
|
Domestic VAT |
314.2 |
327.3 |
4.2% |
|
Corporation tax |
278.2 |
301.8 |
8.5% |
|
Domestic excise |
73.6 |
69.4 |
(5.7%) |
|
Excise on betting |
24.3 |
18.9 |
(22.2%) |
Key take-outs from the table are as follows;
- Revenue from PAYE (Pay As You Earn) grew by 3.3% to Kshs 560.9 billion in FY 2024/2025 from Kshs 543.2 billion in FY 2023/2024. The relatively modest growth was attributed to the utilization of adjustment vouchers by taxpayers to offset liabilities, as well as policy changes such as the reclassification of SHIF and Housing Levy from tax reliefs to allowable deductions before tax computation.
- Revenue from domestic VAT increased by 4.2% to Kshs 327.3 billion in FY’2024/2025 from Kshs 314.2 billion in FY’2023/2024. The growth was driven by a raft of compliance initiatives implemented in the second half of the year, including strict VAT registration controls and verification of declarations, which helped plug revenue leakages.
- Revenue from corporation tax rose by 8.5% to Kshs 301.8 billion in FY’2024/2025 from Kshs 278.2 billion in FY’2023/2024. The performance was supported by robust contributions from key sectors such as ICT, manufacturing, financial services, real estate, and wholesale and retail, reflecting stronger corporate profitability.
- Revenue from domestic excise declined by 5.7% to Kshs 69.4 billion in FY 2024/2025 from Kshs 73.6 billion in FY 2023/2024. The underperformance is largely due to a drop in remittances from manufacturers of beer and tobacco products, which fell by 13.9% and 8.9% respectively, despite continued compliance efforts by KRA in the sector.
- Revenue from excise on betting declined by 22.2% to Kshs 18.9 billion in FY’2024/2025 from Kshs 24.3 billion in FY’2023/2024. Despite the year-on-year drop, excise tax on betting services surpassed its target, registering a surplus of Kshs 1.9 bn with a performance rate of 117.2%, reflecting improved tax compliance and enforcement.
The improved tax revenue collections were mainly attributable to the following key revenue drivers;
- Debt Collection Initiatives and Tax Base Expansion- The Kenya Revenue Authority (KRA) strengthened its debt recovery efforts through targeted programmes, which yielded Kshs 28.5 bn from non-compliant taxpayers. These efforts contributed to a total collection of Kshs 141.3 bn in the 2024/2025 financial year. The positive performance is largely attributed to consistent follow-ups on demand notices and structured debt instalment agreements with taxpayers.
- Digital Economy Taxation- Revenue collection from the digital economy achieved a performance rate of 112.0% during the review period, generating Kshs 14.3 bn. This reflects a 32.0% increase compared to Kshs 10.8 billion collected in FY 2023/24.
- Rental Income Tax Expansion- KRA boosted rental income tax collections through the rollout of the Electronic Rental Income Tax System (eRITS) and the expanded recruitment of landlords under the Monthly Rental Income (MRI) programme. This was supported by a targeted taxpayer mapping initiative using the Block Management System (BMS), which helped onboard more taxpayers and assess additional tax obligations based on income levels.
- Anti-Corruption Measures- In its fight against corruption and revenue leakages, KRA implemented several interventions, including the iWhistle platform. This anonymous reporting system facilitated the collection of Kshs 6.9 billion from 821 reported cases. Additional anti-corruption strategies included profiling tax evaders and streamlining the processes for refunds and debt management.
- Tax at Source- KRA integrated 141 betting and gaming companies into its tax system, enabling real-time data access. This integration allowed Excise Duty on betting services and Betting Tax collections to exceed the set target for FY 2024/25.
- Dispute Resolution Framework- The Alternative Dispute Resolution (ADR) mechanism enhanced revenue collection by resolving 97 cases, resulting in the release of Kshs 15.3 bn. Furthermore, KRA collected Kshs 65.1 bn through litigation, achieving a performance rate of 195.0%.
We note that while the government has managed to meet its revenue targets in FY 2024/2025, underlying challenges such as a narrow tax base, widespread tax evasion, economic headwinds, and administrative inefficiencies continue to pose significant risks to sustained revenue growth. Going forward, we expect the Kenya Revenue Authority (KRA) to significantly enhance its revenue mobilization and operational efficiency through the implementation of the 9th Corporate Plan, spanning five years instead of the previous three-year cycles. This plan will focus on simplifying tax and Customs compliance processes, expanding the tax base, scaling up infrastructure to meet growing business demands, and optimizing human resource capacity and capability. Additionally, KRA will implement the National Tax Policy and the Medium-Term Revenue Strategy (MTRS) for FY 2024/25 - 2026/27, aiming to boost tax compliance and streamline revenue collection. Despite the current challenging economic environment, the resilience shown by taxpayers is encouraging, with a notable increase in tax returns filed. Although the Finance Bill 2025 did not introduce any new tax increases, it focused on enhancing tax collection by closing loopholes commonly exploited for tax evasion. The government is relying on improved enforcement, compliance measures, and administrative efficiencies to boost revenue without imposing additional tax burdens on taxpayers.
Rates in the Fixed Income market have been on a downward trend due to high liquidity in the money market which allowed the government to front load most of its borrowing. The government is 163.8% ahead of its prorated net domestic borrowing target of Kshs 22.7 bn, having a net borrowing position of Kshs 59.9 bn (inclusive of T-bills). However, we expect a stabilization of the yield curve in the short and medium term, with the government looking to increase its external borrowing to maintain the fiscal surplus, hence alleviating pressure in the domestic market. As such, we expect the yield curve to stabilize in the short to medium-term and hence investors are expected to shift towards the long-term papers to lock in the high returns
Market Performance
During the week, the equities market recorded a mixed performance, with NSE 20 gaining by 0.4%, while NASI, NSE 25 and NSE 10 lost by 1.3%, 0.7% and 0.7% respectively, taking the YTD performance to gains of 26.9%, 22.1%, 18.1% and 17.9% for NASI, NSE 20, NSE 10 and NSE 25 respectively. The equities market performance was driven by losses recorded by large-cap stocks such as Equity, Stanbic and Safaricom of 4.1%, 3.7% and 3.5% respectively. The performance was however supported by gains recorded by large cap stocks such as EABL, BAT and DTB-K of 10.7%, 3.7% and 1.6% respectively.
Additionally, in the regional equities market, the East African Exchanges 20 (EAE 20) share index lost by 0.8%, attributable to losses recorded by large cap stocks such as Equity Group, Tanzania Cigarette and Tanzania Breweries of 1.5%, 1.3% and 1.3% respectively. The performance was however supported by gains recorded by large cap stocks such as CRDB Bank, NMB Bank and Bank of Baroda Uganda of 24.6%, 3.3% and 3.2% respectively.
During the week, equities turnover decreased by 44.9% to USD 15.9 mn, from USD 28.9 mn recorded the previous week, taking the YTD total turnover to USD 463.0 mn. Foreign investors remained net buyers for the fifth consecutive time, with a net buying position of USD 0.21 mn, from a net buying position of USD 0.24 mn recorded the previous week, taking the YTD foreign net selling position to USD 26.6 mn, compared to a net selling position of USD 16.9 mn in 2024.
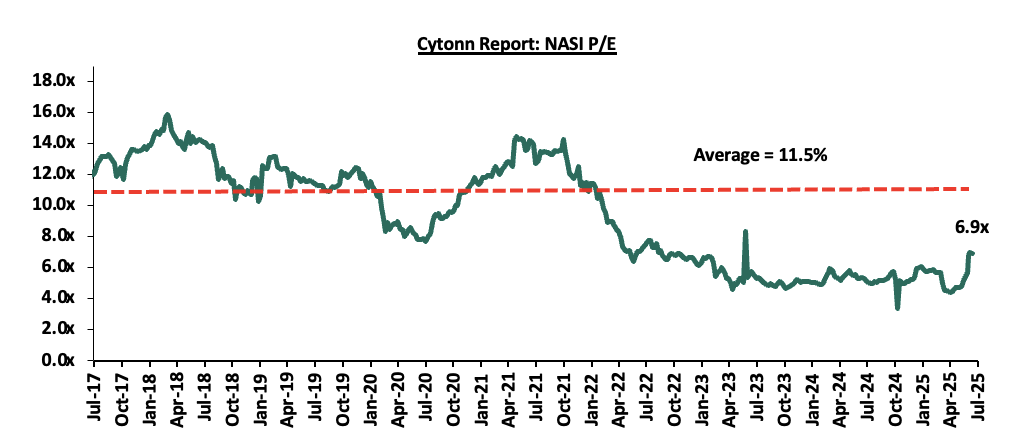
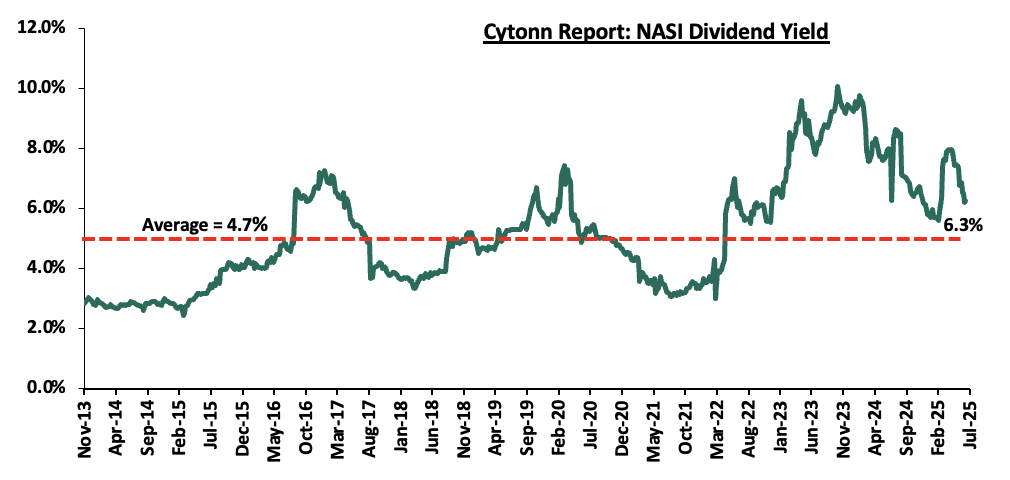
The market is currently trading at a price-to-earnings ratio (P/E) of 6.9x, 39.5% below the historical average of 11.5x. The dividend yield stands at 6.3%, 1.6% points above the historical average of 4.7%. Key to note, NASI’s PEG ratio currently stands at 0.9x, an indication that the market is undervalued relative to its future growth. A PEG ratio greater than 1.0x indicates the market is overvalued while a PEG ratio less than 1.0x indicates that the market is undervalued. The charts below indicate the historical P/E and dividend yields of the market;
|
Cytonn Report: Equities Universe of Coverage |
|||||||||||
|
Company |
Price as at 04/07/2025 |
Price as at 11/07/2025 |
w/w change |
YTD Change |
Year Open 2025 |
Target Price* |
Dividend Yield |
Upside/ Downside** |
P/TBv Multiple |
Recommendation |
|
|
CIC Group |
3.0 |
3.3 |
8.2% |
53.7% |
2.1 |
4.0 |
4.0% |
26.4% |
0.9x |
Buy |
|
|
Equity Group |
51.8 |
49.7 |
(4.1%) |
3.4% |
48.0 |
58.0 |
8.6% |
25.4% |
0.9x |
Buy |
|
|
Standard Chartered Bank |
306.0 |
301.3 |
(1.6%) |
5.6% |
285.3 |
328.8 |
14.9% |
24.1% |
1.7x |
Buy |
|
|
Diamond Trust Bank |
78.0 |
79.3 |
1.6% |
18.7% |
66.8 |
90.4 |
8.8% |
22.9% |
0.3x |
Buy |
|
|
KCB Group |
47.0 |
46.4 |
(1.3%) |
9.4% |
42.4 |
53.7 |
6.5% |
22.2% |
0.6x |
Buy |
|
|
Jubilee Holdings |
233.0 |
226.0 |
(3.0%) |
29.3% |
174.8 |
260.4 |
6.0% |
21.2% |
0.3x |
Buy |
|
|
Stanbic Holdings |
177.5 |
171.0 |
(3.7%) |
22.4% |
139.8 |
185.8 |
12.1% |
20.8% |
1.0x |
Buy |
|
|
Co-op Bank |
17.3 |
17.1 |
(1.4%) |
(2.3%) |
17.5 |
18.9 |
8.8% |
19.8% |
0.6x |
Accumulate |
|
|
Britam |
7.8 |
8.2 |
4.9% |
40.5% |
5.8 |
9.5 |
0.0% |
16.4% |
0.8x |
Accumulate |
|
|
I&M Group |
37.4 |
36.2 |
(3.3%) |
0.4% |
36.0 |
39.0 |
8.3% |
16.2% |
0.6x |
Accumulate |
|
|
ABSA Bank |
20.0 |
19.9 |
(0.3%) |
5.6% |
18.9 |
21.0 |
8.8% |
14.3% |
1.3x |
Accumulate |
|
|
NCBA |
62.8 |
63.5 |
1.2% |
24.5% |
51.0 |
60.2 |
8.7% |
3.4% |
1.0x |
Lighten |
|
|
*Target Price as per Cytonn Analyst estimates **Upside/ (Downside) is adjusted for Dividend Yield ***Dividend Yield is calculated using FY’2024 Dividends |
|||||||||||
We are “Bullish” on the Equities markets in the short term due to current cheap valuations, lower yields on short-term government papers and expected global and local economic recovery, and, “Neutral” in the long term due to persistent foreign investor outflows. With the market currently trading at a discount to its future growth (PEG Ratio at 0.9x), we believe that investors should reposition towards value stocks with strong earnings growth and that are trading at discounts to their intrinsic value. We expect the current high foreign investors sell-offs to continue weighing down the economic outlook in the short term.
- Residential Sector
- Knight Frank Africa Horizons Report
During the week, Knight Frank released its annual report titled Africa Horizons 2025/26, where according to the report 15% of Nairobi’s housing units have shifted to short-term rentals, driving a 10% rent increase over two years as Nairobi residents are now competing with this new demand. Policymakers and various stakeholders face a daunting task of harnessing economic benefits of short-term rentals without worsening the housing crisis. This growth provides property owners with new income streams and travelers with flexible options. However, it also sparks concerns regarding affordability.
Over the recent decade, Airbnb have become popular and preferable to hotels due to its flexibility and its affordability especially for short-term travelers. Despite providing investors with new ways to earn money from Real Estate ventures, Airbnb has become a pain to workers whose salaries rise in 2024 lagged behind inflation and cost of living measure for the fifth year in a row weakening workers’ purchasing power and their standards of living.
Strategies that can be employed by policymakers to balance the emerging trends of Airbnbs without worsening the housing crisis include, (i) imposing a cap on the number of units a particular property should be rented out as airbnbs. This will help in preventing large-scale commercial operators from dominating the market, (ii) encouraging purpose-built short-term rental developments. This can be achieved by incentivizing developers to construct dedicated short-term rental units which will not displace long-term housing. Moreover, by allowing for mixed use developments with allocated Airbnb floors, will help in reducing pressure on residential housing, (iii) requiring platforms such as Airbnb to publicize their data which will help in market analysis. This data could prove useful in adjusting policies based on updated information, (iv) introducing zoning and land use regulations. For instance, restricting Airbnb operations in residential areas which are already under housing stress will help to prevent displacement of long-term tenants.
While the rise of Airbnb has introduced new income streams and diversified Kenya's hospitality landscape, it also risks deepening the housing shortage if left unchecked. By adopting proactive zoning laws and regulating operations, Kenya can ensure that the benefits of short-term rentals are broadly shared, without undermining the long-term stability of its urban housing market.
- Infrastructure Sector
- The government plans to Upgrade the Jomo Kenyatta International Airport
During the week, the government expressed its plan to upgrade and improve the Jomo Kenyatta International Airport (JKIA) before the end of the year. This comes after President William Ruto announced the cancellation of the Adani airport deal due to widespread public outcry and concern after controversial clauses in the contract, which had been shrouded in secrecy were discovered in the contract. The plan to upgrade and improve the JKIA is on course, 229 days since President William Ruto announced the cancellation of the Adani airport deal. Roads and Transport Cabinet Secretary, Davis Chirchir, says that the government intends to break ground before the end of the calendar year, 2025
The government has been in talks with different development financial institutions, including the European Investment Bank, the French Development Bank, the Japan International Cooperation Agency, Abu Dhabi Fund for Development, and China Exim Bank, and is waiting for feedback on how to fund the redevelopment of JKIA using the airport's balance sheet. This proposed project will have immense benefits to the Infrastructure sector which will ripple to Kenya’s economy; i) there will be a surge in construction related jobs, both skilled and unskilled, will arise from the volume of civil, electric and mechanical tasks, ii) expansion of transport infrastructure. For instance, the revival plans for a JKIA-Nairobi rail link could be accelerated to complement airport works, iii) there will be a stimulation in the supply chain and local industry stimulation. Massive spillover benefits for local manufacturers and service providers who deal in supply for construction materials such as concrete, steel and road materials. Iv) Moreover, regulatory tweaks to meet International Civil Aviation Organization (ICAO) and Airports Council International (ACI) standards will drive homegrown engineering firms to elevate quality and compete for similar tenders.
The planned upgrade of JKIA is a strategic investment that will energize the country’s infrastructure sector. From stimulating construction activity and transport connectivity to unlocking innovative financing models and expanding employment opportunities, the project positions Kenya for long-term economic growth. As the government races to complete critical components by year-end, the JKIA upgrade sets a powerful precedent for future infrastructure projects, anchoring Nairobi as a competitive regional gateway and reinforcing Kenya’s vision of becoming an integrated, investor-friendly transport and logistics hub in Africa.
- Narok Airport Project
During the week, Roads and Transport Cabinet Secretary, Davis Chirchir, confirmed that the Narok Airport project has officially taken off, with construction already underway. The development is jointly funded by the national and county governments at a cost of Kshs 1.4 bn. It is aimed at improving air connectivity to Narok County and the greater Maasai Mara region, one of Kenya’s key tourism and conservation zones. This infrastructure push is expected to open up the area to increased economic activity, particularly in the tourism, transport, and property sectors. The project stands in sharp contrast to the stalled Kericho Airport upgrade, which has been halted due to procurement irregularities and is currently inactive.
The Narok Airport is expected to serve as a catalyst for regional real estate transformation. Improved accessibility will likely trigger a surge in demand for land and hospitality-related developments such as lodges, resorts and serviced apartments near the airport and along key access routes. This may also lead to appreciation of land and property prices as speculative activity increases in anticipation of tourism-driven investment.
However, while the economic upside is clear, there are planning and regulatory risks if growth is left unmanaged. County governments and urban planners must anticipate demand pressure and establish clear zoning laws to separate commercial tourism developments from long-term residential areas. Encouraging public-private partnerships (PPPs), incentivizing infrastructure-aligned developments and integrating environmental safeguards will be crucial in avoiding urban sprawl and preserving the ecological balance around the Maasai Mara.
Overall, we expect that the Narok Airport project presents a rare opportunity to unlock real estate value through infrastructure but it requires intentional planning to ensure sustainable, inclusive growth that benefits both investors and local communities.
- Real Esate Investment Trusts (REITs)
On the Unquoted Securities Platform, Acorn D-REIT and I-REIT traded at Kshs 26.7 and Kshs 22.9 per unit, respectively, as per the last updated data on 4th July 2025. The performance represented a 33.4% and 14.5% gain for the D-REIT and I-REIT, respectively, from the Kshs s 20.0 inception price. The volumes traded for the D-REIT and I-REIT came in at Kshs s 12.3 mn and Kshs 31.6 mn shares, respectively, with a turnover of Kshs 311.5 mn and Kshs 702.7 mn, respectively, since inception in February 2021. Additionally, ILAM Fahari I-REIT traded at Kshs 11.0 per share as of 4th July 2025, representing a 45.0% loss from the Kshs 20.0 inception price. The volume traded to date came in at 1.2 mn shares for the I-REIT, with a turnover of Kshs 1.5 mn since inception in November 2015.
REITs offer various benefits, such as tax exemptions, diversified portfolios, and stable long-term profits. However, the ongoing decline in the performance of Kenyan REITs and the restructuring of their business portfolios are hindering significant previous investments. Additional general challenges include:
- Insufficient understanding of the investment instrument among investors leading to a slower uptake of REIT products,
- Lengthy approval processes for REIT creation,
- High minimum capital requirements of Kshs 100.0 mn for REIT trustees compared to Kshs 10.0 mn for pension funds Trustees, essentially limiting the licensed REIT Trustee to banks only
- The rigidity of choice between either a D-REIT or and I-REIT forces managers to form two REITs, rather than having one Hybrid REIT that can allocate between development and income earning properties
- Limiting the type of legal entity that can form a REIT to only a trust company, as opposed to allowing other entities such as partnerships, and companies,
- We need to give time before REITS are required to list – they would be allowed to stay private for a few years before the requirement to list given that not all companies maybe comfortable with listing on day one, and,
- Minimum subscription amounts or offer parcels set at Kshs 0.1 mn for D-REITs and Kshs 5.0 mn for restricted I-REITs. The significant capital requirements still make REITs relatively inaccessible to smaller retail investors compared to other investment vehicles like unit trusts or government bonds, all of which continue to limit the performance of Kenyan REITs.
We expect Kenya’s Real Estate sector to remain on a growth trend, supported by: i) demand for housing sustained by positive demographics, such as urbanization and population growth rates of 3.8% p.a and 2.0% p.a, respectively, against the global average of 1.7% p.a and 0.9% p.a, respectively, as at 2023,, ii) activities by the government under the Affordable Housing Program (AHP) iii) heightened activities by private players in the residential sector iv) increased investment by local and international investors in the hospitality and industrial sector,v) improved infrastructure throughout the country. However, challenges such as rising construction costs, strain on infrastructure development (including drainage systems), high capital requirements for REITs, and existing oversupply in select Real Estate sectors will continue to hinder the sector’s optimal performance by limiting developments and investments.
Following the release of the FY’2024 results by Kenyan insurance firms, the Cytonn Financial Services Research Team undertook an analysis on the financial performance of the listed insurance companies and the key factors that drove the performance of the sector. In this report, we assess the main trends in the sector, and areas that will be crucial for growth and stability going forward, seeking to give a view on which insurance firms are the most attractive and stable for investment. As a result, we shall address the following:
- Insurance Penetration in Kenya,
- Key Themes that Shaped the Insurance Sector in FY’2024,
- Interest rates
- Industry Highlights and Challenges,
- Performance of The Listed Insurance Sector in FY’2024, and,
- Conclusion & Outlook of the Insurance Sector.
Section I: Insurance Penetration in Kenya
Insurance uptake in Kenya remains low compared to other key economies with the insurance penetration coming in at 2.4% as at FY’2024, according to Q4’2024 Insurance Regulatory Authority (IRA). The low penetration rate, which is below the global average of 7.0%, according to Swiss RE institute, is attributable to the fact that insurance uptake is still seen as a luxury and mostly taken when it is necessary or a regulatory requirement. Notably, Insurance penetration remained relatively unchanged from 2.4% recorded in 2023, showcasing the mild economic recovery that saw a slight improved business environment in the country. The chart below shows Kenya’s insurance penetration for the last 14 years:
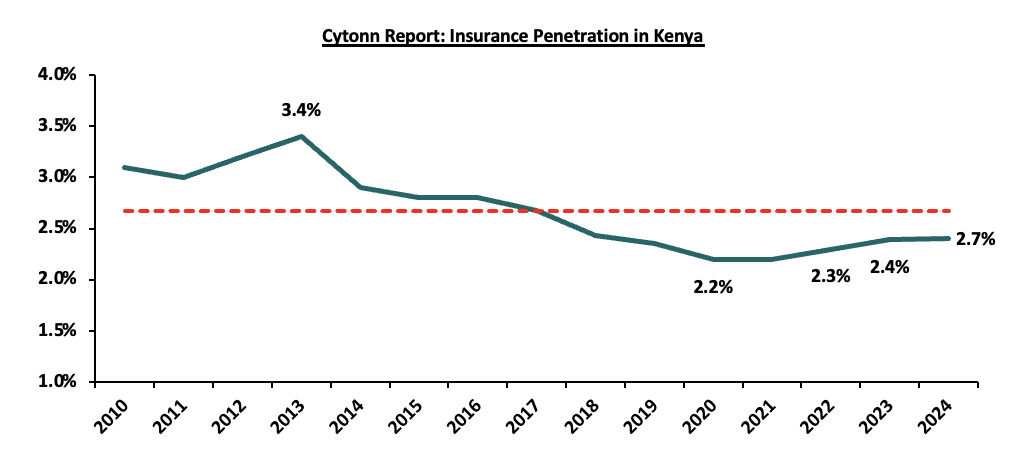
Source: Cytonn Research
The chart below shows the insurance penetration in other economies across Africa:
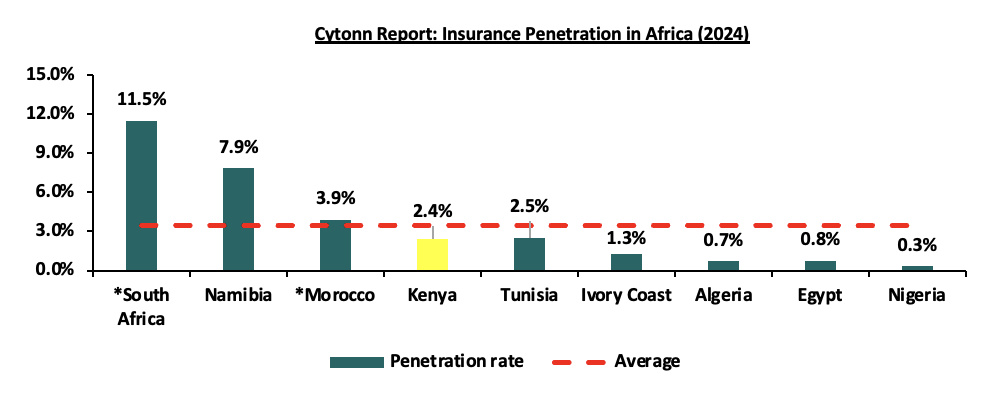
*Data as of 2023
Source: Atlas Magazine
Insurance penetration in Africa has remained relatively low, averaging 3.5% in 2024, mainly attributable to lower disposable income in the continent and slow growth of alternative distribution channels such as mobile phones to ensure wider reach of insurance products to the masses. South Africa remains the leader in insurance penetration in the continent, owing to a mature and highly competitive market, coupled with strong institutions and a sound regulatory environment.
Section II: Key Themes that Shaped the Insurance Sector in FY’2024
In FY’2024, the country experienced a more favourable operating environment due to declining inflation and a stronger Shilling. Notably, the inflation rate in FY’2024 averaged 4.5%, 3.2% points lower than the 7.7% average in FY’2023, with the Kenyan Shilling having appreciated by 17.4% against the USD in FY’2024. As such, according to the Q4’2024 Insurance Regulatory Authority Insurance industry report, the insurance sector showcased resilience recording a 9.4% growth in gross premium to Kshs 395.3 bn in FY’2024, from Kshs 361.4 bn in FY’2023. Insurance claims also increased by 12.5% to Kshs 105.7 bn in FY’2024, from Kshs 94.0 bn in FY’2023. On the other hand, the overall GDP growth rate declined to 4.7% in FY’2024, from 5.7% recorded in a similar period last year according to 2025 Economic Survey Report.
Notably, the general insurance business contributed 51.6% of the industry’s premium income in FY’2024 compared to 48.4% contribution by long term insurance business in the same period. During the period, the long-term business premiums increased by 12.5% to Kshs 191.2 bn, from Kshs 170.0 bn in 2023 while the general business premiums grew by 6.7% to Kshs 204.1bn, from Kshs 191.3 bn in 2023. Additionally, motor insurance and medical insurance classes of insurance accounted for 64.8% of the gross premium income under the general insurance business, compared to 63.5% recorded in 2023. As for long-term insurance business, the major contributors to gross premiums were deposit administration and life assurance classes accounting for 57.5% in FY’2024, compared to the 59.8% contribution by the two classes in FY’2023.
Key highlights from the industry performance:
- The sector’s investments income increased by 61.3% to Kshs 132.1 bn in 2024, from Kshs 81.9 bn in 2023, mainly attributable to the 86.4% increase in the investment income in the long-term to Kshs 106.8 bn, from Kshs 57.3 bn in 2023, coupled with the 2.9% increase in investment income in the general insurance business to Kshs 25.3bn, from Kshs 24.6 bn in 2023,
- Continued recovery from the ripple effects of the pandemic witnessed in 2020 that saw both individuals and businesses seek insurance uptake to cover for their activities, leading to growth in gross premiums which increased by 9.4% to Kshs 395.3 bn in 2024, from Kshs 361.4 bn in 2023,
- Enhanced convenience and operational efficiency driven by the use of alternative distribution and premium collection channels, including Bancassurance and strengthened agency networks, and,
- Technological advancements and innovation have enabled premium payments to be made easily via mobile phones.
On valuations, listed insurance companies are trading at a price to book (P/Bv) of 0.6x, lower than listed banks at 0.9x, but both are lower than their 16-year historical averages of 1.3x and 1.7x, for the insurance and banking sectors respectively. These two sectors are attractive for long-term investors supported by the strong economic fundamentals. The chart below shows the price to book comparison for Listed Banking and Insurance Sectors:
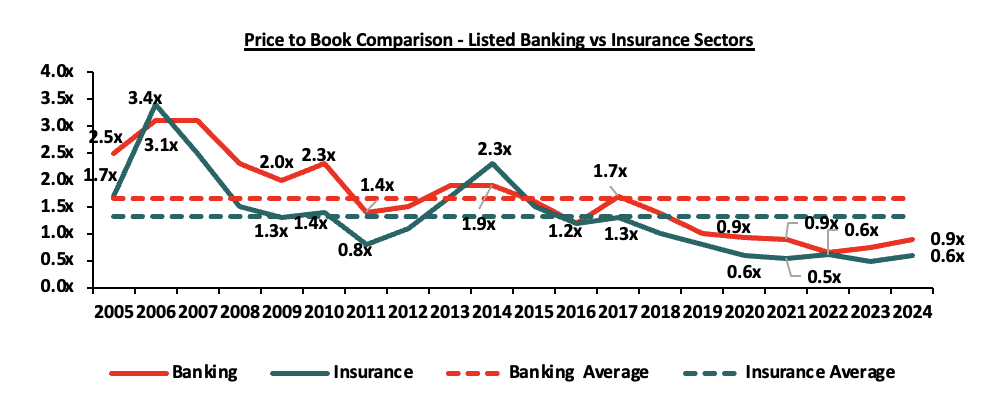
Source: Cytonn Research
The key themes that have continued to drive the insurance sector include:
- Technology and Innovation
Although the insurance industry was initially slow to embrace digital trends, the outbreak of the COVID-19 pandemic in 2020 made digital distribution of insurance products a necessity. As a result, most insurers have since leveraged digital platforms to boost growth and enhance insurance penetration across the country.In April 2024, CIC Group announced the launch of Easy Bima, a digital motor insurance product. This solution enables customers to spread the cost of their comprehensive motor insurance premiums into equal monthly instalments over a 12-month period, offering greater flexibility and affordability. By utilizing digital platforms, it enhances accessibility to insurance, particularly for individuals who find it challenging to make lump-sum payments. Consumers often term insurance as difficult and complex to understand. This sentiment has been established through various studies carried out to establish reasons for low uptake of insurance, the latest being the 2024 Fin Access Survey. The survey found that 63.2% of the respondents do not afford premiums while 19.4% lacks awareness of the products. Additionally in February 2025, Jubilee insurance launched J-Force a digital solution aimed at improving efficiency in insurance distribution by simplifying policy administration, client interaction, and transaction handling. In addition to providing real-time business analytics, J-Force empowers intermediaries to work faster and more accurately facilitating client onboarding, lead management, policy issuance, and renewal tracking in a smooth, fully digital environment.
- Regulation
To position the sector within a globally competitive financial services landscape, the regulator has been actively implementing regulations aimed at tackling both longstanding and emerging challenges. The COVID-19 environment proved challenging especially on the regulatory front, as it was a balance between remaining prudent as an underwriter and adhering to the set regulations given the negative effects of the pandemic. Regulations used for the insurance sector in Kenya include the Insurance Act Cap 487 and its accompanying schedule and regulations, Retirement Benefits Act Cap 197 and The Companies Act. In FY’2024, regulation remained a key aspect affecting the insurance sector and the key themes in the regulatory environment include;
- IFRS 17- IFRS 9, Financial Instruments was replaced with IFRS 17. The standard establishes the principle for recognition, measurement, presentation and disclosure of insurance contracts with the objective of ensuring insurance companies provide relevant information that faithfully represents the contracts. However, as a way to protect the insurance industry from the negative effects of the pandemic the International Accounting Standards Board (IASB), the international body responsible for setting up financial reporting standards deferred its implementation effective from January 2023 or earlier. The standard, having replaced IFRS 4, is expected to give better information on profitability by providing more insights about current and future profitability of insurance contracts. Separation of financial and insurance results in the income statement will allow for better analysis of core performance for the entities and allow for better comparability of insurance companies, and,
- Risk Based Supervision - IRA has been implementing risk-based supervision through guidelines that require insurers to maintain a capital adequacy ratio of at least 200.0% of the minimum capital. The regulation requires insurers to monitor the capital adequacy and solvency margins on a quarterly basis, with the main objective being to safeguard the insurer’s ability to continue as a going concern and provide shareholders with adequate returns. We expect more mergers within the industry as smaller companies struggle to meet the minimum capital adequacy ratios. We also expect insurance companies to adopt prudential practices in managing and taking on risk and reduction of premium undercutting in the industry as insurers will now have to price risk appropriately.
- Capital Raising and share purchase
The move to a risk-based capital adequacy framework presented opportunities for capital raising initiatives mostly by the small players in the sector to shore up their capital and meet compliance measures. With the new capital adequacy assessment framework, capital is likely to be critical to ensuring stability and solvency of the sector to ensure the businesses are a going concern. According to the updated Insurance act 2022,General insurers are required to have at least KES 600 mn while life insurance providers are required to have KES 400 mn in minimum capital. In May 2022, Sanlam Limited, a South African financial services group listed on the Johannesburg Stock Exchange, announced that it had entered into a definitive Joint Venture agreement for a term of 10 years with Allianz SE, with the aim to leverage on the two entities footprints in Africa and create a leading Pan-African financial services group, with an estimated equity value of Kshs 243.7 bn. Key to note, Sanlam Limited, indirectly owns 100.0% in Hubris Holdings Limited, which is the majority shareholder in Sanlam Kenya Plc, a listed insurance and financial services entity on the Nairobi Stock Exchange. The initial shareholding split of the Joint Venture was announced to be 60:40, Sanlam Limited to Allianz respectively, with the effective date of the proposed transaction being within 12-15 months of the announcement, subject to relevant approvals. However, given the length of the Agreement we expect that the Joint Venture will provide for Sanlam Kenya Plc, Allianz General Insurance Kenya and Jubilee General Insurance (which Allianz owns the majority stake in – 66.0%), to combine operations to grow their market share, asset base and bottom lines.
Additionally, insurance companies have increasingly turned to capital raising initiatives such as rights issues to strengthen their financial positions. A recent example is Sanlam Kenya, which undertook a rights issue offering 500.0 million new shares at an offer price of Kshs 5.00 per share. The capital raised is to be directed towards key strategic areas, primarily aimed at reducing the Group’s long-term debt exposure and supporting its return to profitability.
Section III: Interest rates
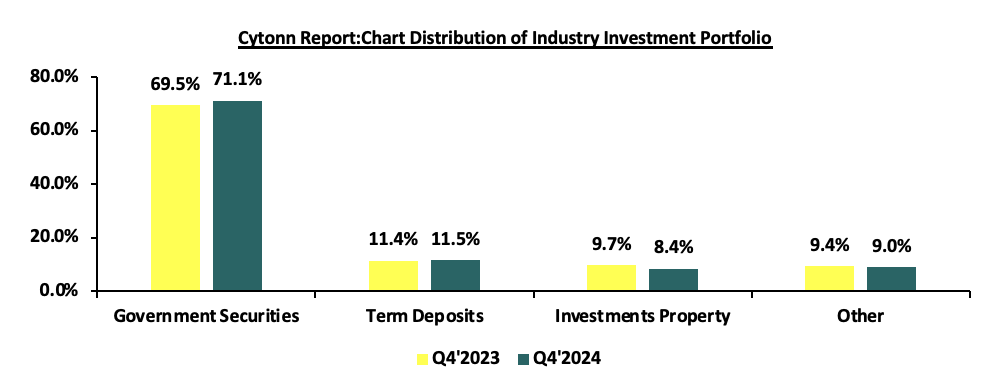
The higher interest rate environment in 2024 translated into significantly enhanced returns for insurers with investments on government securities. With Central Bank rates elevated at the for most part of 2024, insurers capitalized on higher-yielding treasury bills and bonds, with 364-day T-bill,182-day T-bill and 91-day T-bill giving average return of 16.0%,15.7% and 15.2% respectively in 2024, compared to 12.8%,12.4% and 12.2% returns for 364-day T-bill,182-day T-bill and 91-day T-bill respectively in 2023. According to IRA report, Investments in income-generating assets registered growth, increasing by 16.6% to Kshs 1.09 tn in Q4’2024, up from Kshs 938.4 bn recorded in Q4’2023, with government securities growing by 19.1% to Kshs 777.4 bn in Q4’2024,up from Kshs 652.6 bn in Q4’2023. Insurers rebalanced their portfolios to seize the higher yields available in government instruments. The share of government securities rose 1.6% points year-on-year to 71.1% in Q4’2024 from 69.5% in Q4’2023, attributable to increased returns from government securities. The chart below shows comparison of investments portfolio allocations for the industry:
Source: IRA
Section IV: Industry Highlights and Challenges
The insurance sector has recorded consistent growth over the past ten years, and this trend is expected to continue at a moderate pace, supported by an improving economic outlook and a corresponding increase in insurance premiums, factors which are likely to enhance the industry's capacity to maintain profitability.
On the regulatory front, the rejected Finance Bill 2024 included provisions that sought to expand taxes on insurance premiums and extend VAT to certain insurance services. These included a new 2.5% tax on the value of motor vehicles, payable when issuing insurance cover and limiting VAT exemptions to insurance and reinsurance premiums only, subjecting other related services to the standard VAT rate of 16.0%. These measures were aimed at increasing government revenue but were met with opposition from industry stakeholders, including the Association of Kenya Insurers (AKI) due to concerns over increased insurance costs. The rejection of the Finance Bill has provided a temporary reprieve for the insurance sector, though discussions on balancing fiscal policy and market growth continue to shape the regulatory landscape.
Industry Challenges:
- Insolvency: A major challenge facing the insurance industry is the financial instability and insolvency of key players, as evidenced by recent cases in 2024 like Resolution Insurance and United Insurance Company. These companies have been placed under statutory management and provisional liquidation by the Insurance Regulatory Authority (IRA) and through court orders. The issues arise from extended financial struggles, internal boardroom disputes, and declining market share, especially in unprofitable areas such as Public Service Vehicle (PSV) insurance. The collapse of these insurers undermines customer trust, destabilizes the industry, and compels policyholders to find alternative coverage. To regain stability and rebuild consumer confidence, the sector must tackle issues related to governance, risk management, and liquidity,
- Insurance fraud: Insurance Fraud is an intentional deceit performed by an applicant or policyholder for financial advantage. In recent years, there has been an upsurge in fraudulent claims, particularly in medical and motor insurance, with estimates indicating that one in every five medical claims are fraudulent. This is mainly through exaggerating medical costs and hospitals by making patients undergo unnecessary tests. Fraudsters also collude with hospitals to file false claims, including fabricated surgeries and treatments, while some healthcare providers inflate charges for insured patients. To curb these challenges, the industry has adopted implementing blockchain technology and artificial intelligence to detect and prevent fraud. In 2024, the number of fraud cases reported to the Insurance Fraud Investigation Unit (IFIU) decreased by 15.6% to 184 cases, from 218 cases reported in 2023,
- High Market competition: Despite low insurance penetration in the country, the sector is served by 57 insurance companies offering the same products. The sector is increasingly facing competition from banking institutions and telecommunications companies, which pose a growing threat to its market share. New players like Safaricom, which was recently licensed by the Insurance Regulatory Authority (IRA) as an insurance broker, along with Equity Group’s ongoing expansion into the insurance space through the launch of Equity life Assurance, are intensifying competition for traditional insurers,although increasing the availability of insurance services in the country. Some insurers have resorted to shady tactics in the fight for market dominance, such as premium undercutting, which is involves offering clients implausibly low premiums in order to gain competitive advantage and protect their market share. This is a significant factor in the industry's underwriting losses. Plans to hire a consultant to review industry pricing in March 2021 were retaliated against by the regulator, but the plans are still in the works. However, this is against a background of weak insurance uptake, which could be made worse by higher premium prices. Industry participants have debated pricing,
- Declining consumer confidence in the insurance industry: In 2024, IRA received 1,842 complaints from policyholders and beneficiaries lodged against insurers. The general insurance accounting for majority of the complaints at 76.3%, while long-term insurers recording 23.7%. The complaints range from insurance companies failing to settle claims and constant haggling over terms of insurance. Such experiences have led to skepticism toward insurers thus leading to declined consumer confidence, and,
- Regulation compliance: Due constant updates on the laws governing insurance sector, such as capital requirements, smaller insurance businesses and new market entrants have found it challenging to operate without raising capital or combining to expand their capital base. Additionally, the implementation of IFRS 17, are expensive since accounting and actuarial systems need to be updated and realigned. There is lack of adequate skilled professionals due to the complexity of IFRS 17 which requires a solid grasp of both accounting and actuarial concepts. This skills gap has resulted in difficulties in fully understanding and applying the requirements of the framework.
Section V: Performance of the Listed Insurance Sector in FY’2024
The table below highlights the performance of the listed insurance sector, showing the performance using several metrics, and the key take-outs of the performance.
|
Listed Insurance Companies FY’2024 Earnings and Growth Metrics |
||||||||||||||||||||||||||||||||||||||||||||||||||||||||||||||||||||||||||||||||||||||||||||||||||
|
Insurance |
Core EPS Growth |
Insurance revenue growth |
Claims growth |
Loss Ratio |
Expense Ratio |
Combined Ratio |
ROaE |
ROaA |
||||||||||||||||||||||||||||||||||||||||||||||||||||||||||||||||||||||||||||||||||||||||||
|
Sanlam |
695.5% |
6.1% |
2.6% |
77.1% |
40.1% |
117.2% |
75.7% |
2.8% |
||||||||||||||||||||||||||||||||||||||||||||||||||||||||||||||||||||||||||||||||||||||||||
|
Liberty |
112.3% |
(2.3%) |
44.0% |
77.9% |
55.8% |
133.7% |
13.7% |
3.0% |
||||||||||||||||||||||||||||||||||||||||||||||||||||||||||||||||||||||||||||||||||||||||||
|
Jubilee Insurance |
85.7% |
13.5% |
2.6% |
94.3% |
29.8% |
124.2% |
9.2% |
2.2% |
||||||||||||||||||||||||||||||||||||||||||||||||||||||||||||||||||||||||||||||||||||||||||
|
Britam |
53.5% |
3.1% |
24.3% |
72.7% |
32.0% |
104.7% |
18.3% |
2.6% |
||||||||||||||||||||||||||||||||||||||||||||||||||||||||||||||||||||||||||||||||||||||||||
|
CIC |
82.5% |
3.7% |
7.2% |
92.0% |
25.6% |
117.5% |
25.9% |
4.6% |
||||||||||||||||||||||||||||||||||||||||||||||||||||||||||||||||||||||||||||||||||||||||||
|
*FY'2024 Weighted Average |
126.7% |
8.4% |
23.5% |
83.2% |
47.2% |
130.4% |
24.9% |
4.1% |
||||||||||||||||||||||||||||||||||||||||||||||||||||||||||||||||||||||||||||||||||||||||||
|
**FY'2023 Weighted Average |
116.0% |
21.3% |
31.8% |
82.3% |
100.3% |
182.6% |
10.5% |
1.7% |
||||||||||||||||||||||||||||||||||||||||||||||||||||||||||||||||||||||||||||||||||||||||||
|
*Market cap weighted as at 11/07/2025 |
||||||||||||||||||||||||||||||||||||||||||||||||||||||||||||||||||||||||||||||||||||||||||||||||||
|
**Market cap weighted as at 21/06/2024 |
||||||||||||||||||||||||||||||||||||||||||||||||||||||||||||||||||||||||||||||||||||||||||||||||||
The key take-outs from the above table include;
- Core EPS growth recorded a weighted growth of 126.7%, higher compared to the weighted growth of 116.0%, in FY’2023. The sustained growth in earnings was attributable to increased premiums during the period following continued recovery by the sector from the impacts of the COVID-19 pandemic, coupled with higher yields from government papers at the beginning of the period,
- Insurance revenue grew at a slower pace of 8.4% in FY’2024, compared to a growth of 21.3% in FY’2023, while claims also grew at a slower rate of 23.5% in FY’2024, from the 31.8% growth recorded in FY’2023 on a weighted average basis,
- The loss ratio across the sector increased to 83.2% in FY’2024 from 82.3% in FY’2023,
- The expense ratio reduced significantly to 47.2% in FY’2024, from 100.3% in FY’2023, owing to decreased in operating expenses, a sign of increased efficiency,
- The insurance core business still remains unprofitable, with a combined ratio of 130.5% as at FY’2024, lower than the 182.6% in FY’2023, and,
- On average, the insurance sector delivered a Return on Average Equity (ROaE) of 24.9%, an increase from a weighted Return on Average Equity of 10.5% in FY’2023.
Based on the Cytonn FY’2024 Insurance Report, we ranked insurance firms from a franchise value and from a future growth opportunity perspective with the former getting a weight of 40.0% and the latter a weight of 60.0%.
For the franchise value ranking, we included the earnings and growth metrics as well as the operating metrics shown in the table below in order to carry out a comprehensive review:
|
Listed Insurance Companies FY’2024 Franchise Value Score |
||||||
|
Insurance Co. |
Loss Ratio |
Expense Ratio |
Combined Ratio |
Tangible Common Ratio |
Franchise Value Score |
Ranking |
|
Sanlam |
77.1% |
40.1% |
117.2% |
4.5% |
14 |
1 |
|
Britam |
72.7% |
32.0% |
104.7% |
14.0% |
15 |
2 |
|
CIC |
92.0% |
25.6% |
117.5% |
17.5% |
15 |
3 |
|
Jubilee Insurance |
94.3% |
29.8% |
124.2% |
22.9% |
21 |
4 |
|
Liberty |
77.9% |
55.8% |
133.7% |
19.7% |
25 |
5 |
|
*FY'2024 Weighted Average |
83.2% |
47.2% |
130.4% |
17.8% |
|
|
The Intrinsic Valuation is computed through a combination of valuation techniques, with a weighting of 40.0% on Discounted Cash-flow Methods, 35.0% on Residual Income and 25.0% on Relative Valuation. The overall FY’2024 ranking is as shown in the table below:
|
Listed Insurance Companies FY’2024 Comprehensive Ranking |
|||||
|
Bank |
Franchise Value Score |
Intrinsic Value Score |
Weighted Score |
FY’2024 Ranking |
FY’2023 Ranking |
|
Sanlam Kenya |
1 |
1 |
1.0 |
1 |
1 |
|
CIC Group |
3 |
2 |
2.4 |
2 |
4 |
|
Britam Holdings |
2 |
5 |
3.8 |
3 |
5 |
|
Liberty Holdings |
5 |
3 |
3.8 |
4 |
3 |
|
Jubilee Holdings |
4 |
4 |
4.0 |
5 |
2 |
Major Changes from the FY’2024 Ranking are;
- Sanlam Kenya maintained position 1 in FY’2024 driven by strong intrinsic and franchise score, attributable to the sharp increase in core earnings per share growth to a growth of 695.5%, from a decline of 87.9%,
- CIC Group improved to position 2 in FY’2024 driven by improved franchise score, attributable to the decrease in the claims growth to 7.2%, from a 17.8% growth recorded in FY’2023.
- Liberty Holdings declined to position 4 in FY’2024 mainly due to weakened franchise score in FY’2024, driven by an increase in claims ratio to 44.0% in FY’2024, from 42.0% recorded in FY’2023,
- Britam Holdings improved to position 3 in FY’2024, mainly due to increase in franchise scores in FY’2024, driven by the decrease in claims growth to 24.3%, from the 55.1% growth recorded in FY’2023, and,
Section VI: Conclusion & Outlook of the Insurance Sector
Recent improvements in Kenya's economy have set the stage for a more optimistic outlook for the insurance industry. As inflation eases and the Kenyan Shilling stabilizes, households are likely to enjoy increased disposable income, potentially driving higher insurance uptake. Despite ongoing challenges, the sector is benefiting from accelerated digital transformation and innovation trends that gained momentum during the pandemic. Regulatory improvements and customer-centric approaches remain key areas of focus. The more favourable economic environment offers insurers a solid foundation for growth, with opportunities to refine product offerings, strengthen customer relationships, and develop policies that reflect the evolving financial needs and capabilities of consumers.
The insurance sector should build on the following strategies to sustain growth and capitalize on the economic upturn:
- Regulations - To ensure the sector's solvency and sustainability, we anticipate more regulation from the regulatory body and other international stakeholders. Insurers must modify their insurance contract recognition techniques in advance of the implementation of IFRS 17. The regulator's quest for the targeted capital adequacy levels will almost certainly result in further consolidations as insurers struggle to achieve the capital requirements, particularly for small firms. Furthermore, regulators, governments, and policymakers are working harder to make Environmental, Social, and Governance (ESG) standards a requirement in the insurance industry,
- Partnerships and alternative distribution channels-We expect underwriters to keep forming strategic partnerships and expanding their distribution channels in the future. This can be accomplished by collaborating with other financial service providers such as fund managers who have ventured into offering insurance-related products alongside existing bancassurance arrangements with banks. Additionally, insurers can leverage the penetration of banking products to increase awareness and uptake of their own offerings.For instance, in July 2024, NCBA Group announced the completion of 100% acquisition of AIG Kenya Insurance Company (AIG Kenya). This move allows NCBA to leverage its physical and digital platforms to boost insurance penetration in Kenya and the wider East African region. This acquisition aligns with the broader trend of partnerships and alternative distribution channels, as NCBA’s collaboration with AIG Kenya demonstrates how banks and insurance providers can work together to broaden access to insurance products. According to AKI released state of the Bancassurance Market in Kenya 2024 report, Bancassurance distribution channel market share grew to 10.0% with the channels gross written premium growing to Kshs 35.0 bn in 2023,
- Regional Diversification - As insurers look to expand their portfolios and mitigate risks, entering new markets can provide growth opportunities and help spread exposure across multiple economies. This strategy allows companies to tap into underpenetrated regions, improving overall revenue streams and reducing dependence on local markets. By entering emerging and underserved markets, insurers can gain access to new customer bases, diversify their product offerings, and strengthen their positions across Africa and beyond. For instance, in June 2024, Britam announced its plans to expand into the Democratic Republic of Congo (DRC) as part of its five-year strategy to grow regionally. This expansion builds on its success in international markets, which contributed 29.0% of its total insurance revenue in 2023. With strong performance driving a 65.0% increase in profit before tax, Britam continues to focus on growth and customer-centric transformation,
- Technology and Innovation: To aid portfolio expansion and growth, insurers must harness the digital insurance solutions at their disposal in order to improve internal efficiency and accelerate time to market. As such, we anticipate cooperation between insurers and InsurTechs. For instance, in February 2024, Britam launched BetaLab a new insurance innovation hub, as it aims to nurture budding InsurTech and fintech start-ups, and fast track product development in the industry. The lab’s mission is to incubate, innovate, and accelerate start-ups, nurturing and empowering innovation among internal staff, while also exploring innovation opportunities with insuretechs and fintechs. Additionally, insurers should embrace use of artificial intelligence to improve efficiency by integrating Artificial Intelligence (AI) into underwriting, automating claims processes, and using chatbots for customer support, thereby streamlining overall operations. For instance, in April 2024, M-tiba announce the successful integration of AI into their claims processing system, leading to significant reductions in claims approval process to just hours. Additionally, use of AI enhances their efficiency and fraud management resulting in low administrative and healthcare costs for health insurers,
- Insurance awareness campaigns – Low insurance penetration is significantly impacted by the persistent information gap about insurance products and their significance. Insurance is still largely assumed to be regulatory compliance rather than a necessity. The regulators, insurers, and other stakeholders should enhance insurance awareness campaigns to increase understanding of insurance products. According to Finaccess survey 2024, the second largest contributor to low insurance uptake at 19.4% is a lack of awareness of the various insurance products and their benefits. As such, there is a lot of headroom for insurers to educate, repackage, and tailor their products to different potential clients, and,
- Investment diversification – To enhance profitability and minimize losses, underwriters should prioritize diversifying their investments through avenues like pension schemes, unit trusts, fund management, and investment advisory services. The combined ratios declined to 130.4% in FY’2024 from 182.6% in FY’2023 pointing toward losses in insurers' core operations, although an improvement, as rising underwriting costs and claims have outpaced premium growth. In addition, we anticipate insurers will continue to investigate non-traditional asset types such as infrastructure.
Disclaimer: The views expressed in this publication are those of the writers where particulars are not warranted. This publication is meant for general information only and is not a warranty, representation, advice or solicitation of any nature. Readers are advised in all circumstances to seek the advice of a registered investment advisor.

- Talk to us
- Kenya
- P.O Box 20695 - 00200, Nairobi, Kenya
- Cell +254709101200
- Tel +254709101200
- WhatsApp +254741676635
- United States
- +254709101200
- DOWNLOAD OUR APP
-


- Kenya
- 8th Floor, Pinetree Plaza, Kaburu Drive, Ngong Road, Nairobi, Kenya
- USA
- Suite 1150, 1775 Eye Street NW, USA, Washington DC 20006, USA
- Investments
- High Yield
- Private Equity
- Real Estate
- Real Estate
- RiverRun Estates
- Cytonn Towers
- The Ridge
- Taraji Heights
- The Alma