Kenya FY’2019 Listed Insurance Note
By Cytonn Research Team, Aug 4, 2020
- Following the release of the FY’2019 results by Kenyan insurance firms, the Cytonn Financial Services Research Team undertook an analysis on the financial performance of the listed insurance companies and identified the key factors that shaped the performance of the sector. As such, we shall address the following:
- Key Themes that Shaped the Insurance Sector in FY’2019,
- Summary of Performance of the Listed Insurance Sector in FY’2019,
- The Focus Areas of the Insurance Sector Players Going Forward,
- Brief Summary and Ranking of the Listed Insurers based on the Outcome of Our Analysis, and,
- Conclusion
Introduction:
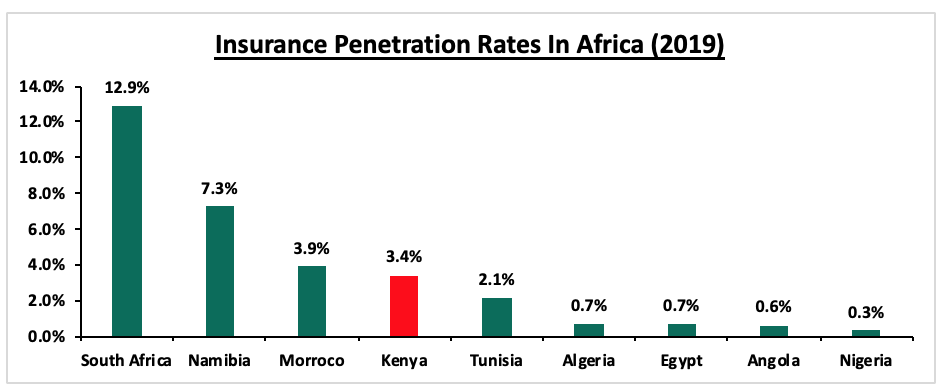
Insurance uptake in Kenya remains low compared to other key economies with the insurance penetration in 2019 coming in at 3.4% up from 2.4% in 2018, according to Q4’2019 reports by the Insurance Regulatory Authority (IRA). The slow penetration level is attributable to the fact that insurance uptake is still seen as a luxury and mostly taken when it is necessary or a regulatory requirement, with the growth in insurance uptake being undermined by the high unemployment and levels of poverty.
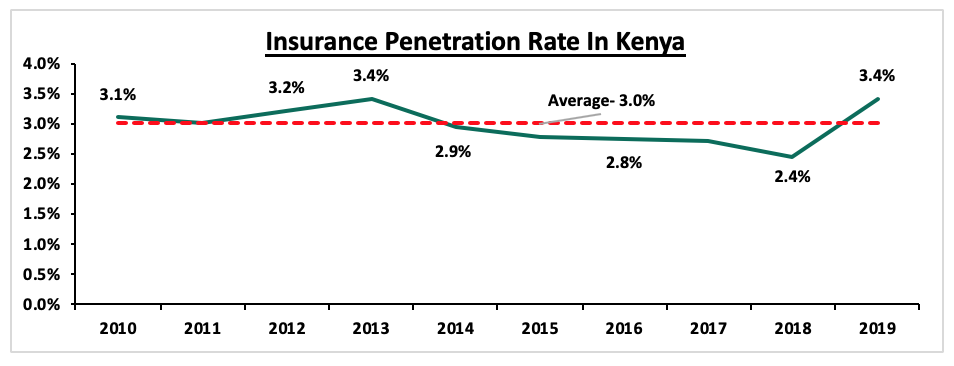
The chart below shows the penetration in other economies:
The financial performance of the insurance companies have largely been driven by the performance of their investment portfolios with the industry combined ratio at 103.3% leading to a total industry underwriting loss of Kshs 2.97 bn. General business remain the largest revenue contributor at around 57.0% of the total underwritten premiums.
Section I: Key Themes that Shaped the Insurance Sector in FY’2019
The uptake of insurance products has lately been driven by:
- Growth of the Agency Model: Convenience and efficiency through adoption of alternative channels for both distribution and premium collection such as Bancassurance and improved agency networks,
- Advancement in technology and innovation making it possible to make premium payments through mobile phones, and,
- The growing middle class, which has led to increased disposable income, thereby increasing demand for insurance products and services. These factors have been key in driving growth of the sector.
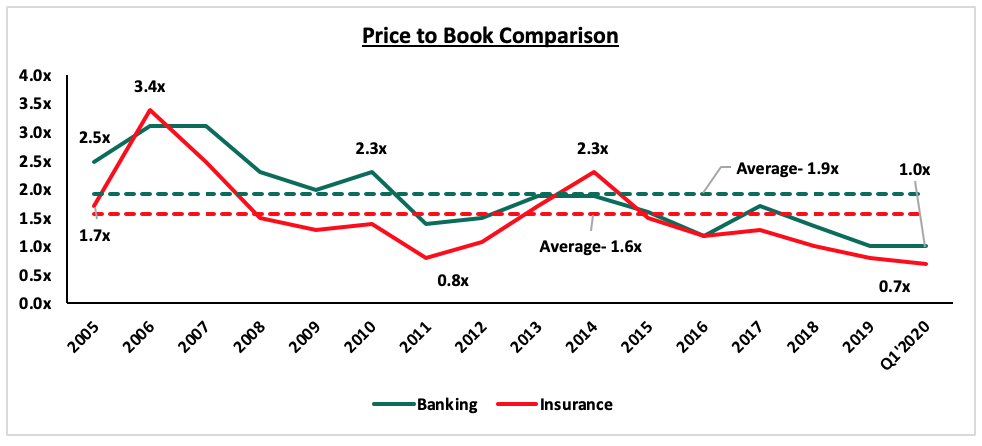
On valuations, listed insurance companies were trading at a price to book of 0.7x, lower than listed banks at 1.0x as at 31stMarch 2020, with both lower than their historical averages of 1.6x. The lower price to book valuations are attributable to the low prices recorded in the Equities market as a result of the ongoing pandemic, which has seen investors flee the Equities market in favor of safe havens.
In the last five years, the life insurance market in Kenya has experienced growth in both the level of direct premiums, recording growths of 57.5% to Kshs 228.8 bn in FY’2019 from Kshs 145.3 bn in FY’2015, as well as in the equity held by the industry constituents shaped by the following themes;
- Technology and Innovation
Although the industry has been slow in adopting digital trends, FY’2019 saw insurance companies increasingly take advantage of digital transformation to drive growth and increase insurance penetration in the country. Insure-Tech adoption has been rapidly increasing as insurance companies seek to speed up claims processing, automate their back office and improve customer experience, with industry players continuing to innovate products while leveraging on technology to remain competitive. In the East African context, there have been several digital innovations mostly observed by developments of smartphone apps that streamline how insurance is provided for instance MY DAWA, M-Tiba and Hello Doctor
- Regulation
In FY’2019, regulation remained a key aspect affecting the insurance sector and the key themes in the regulatory environment include;
- IFRS 9 - IAS 39, Financial Instruments Recognition and Measurement was replaced with IFRS 9, Financial Instruments to address, classification and measurement of financial instruments, impairment, and hedge accounting. The guideline recommends an entity to measure the loss allowance at an amount equal to lifetime expected credit losses for receivables. Large players such as Jubilee Insurance and Kenya Re, who implemented IFRS 9 experienced increased impairments of between 5.0% and 40.0%, with many insurance companies using a simplified loss rate approach in determining the provisions for premium receivables, with most opting to delay implementation of IFRS 9 to January 2022. IFRS 9 will enable insurance companies to develop appropriate models for their customer debtors and develop plans that will help them lower their credit risk in the future,
- IFRS 17- The standard establishes the principle for recognition, measurement, presentation, and disclosure of insurance contracts with the objective of ensuring insurance companies provide relevant information that faithfully represents the contracts with an effective date of January 2022 or earlier. The standard is expected to give better information on profitability by providing more insights about the current and future profitability of insurance contracts. Separation of financial and insurance results in the income statement will allow for better analysis of core performance for the entities and allow for better comparability of insurance companies,
- Risk-Based Supervision - IRA has been implementing risk-based supervision through guidelines that require insurers to maintain a capital adequacy ratio of at least 200.0% of the minimum capital by 2020. The regulation requires insurers to monitor the capital adequacy and solvency margins on a quarterly basis, with the main objective being to safeguard the insurer’s ability to continue as a going concern and provide shareholders with adequate returns. We expect more mergers within the industry as smaller companies struggle to meet the minimum capital adequacy ratios. We also expect insurance companies to adopt prudential practices in managing risk and reduction of premium undercutting in the industry as insurers will now have to price risk appropriately, and
- Amendments to the Kenya Insurance Act- in FY ’2019, IRA made amendments undervaluation of technical provisions for life insurance business and capital adequacy guidelines. The assumption under interest rate risk for life valuation was revised from 20.0% to 10.0%, and the insurance risk factors relating to interest rate risk margin for capital adequacy was revised from 10.0% to 18.0%. The implication of this amendment is that those insurers will need to be wary and look out for and manage various interest rate stress factors to remain well within the assumptions set forth in the guidelines,
- Redirection in Core Operations
With low insurance penetration rates, insurers moved their focus to growing their investment income, which involved an increase in the assets under management (AUM) segments and investments in property. In FY’2019, the listed insurance sector recorded an average of 10.3% in investment yield, 0.5% points above the 9.7% recorded in FY’2018. Notably in FY’2019, ICEA Lion signed an agreement to acquire, fund manager, Stanlib Kenya in a deal estimated at Kshs 1.5 bn in a bid to boost their group revenues.
Section II: Summary of Performance of The Listed Insurance sector in FY’2019
The table below highlights the performance of the listed insurance sector, showing the performance using several metrics, and the key take-outs of the performance.
|
Listed Insurance Companies FY'2019 Earnings and Growth Metrics |
|||||||
|
Insurance |
Core EPS Growth |
Net Premium growth |
Claims growth |
Loss Ratio |
Expense Ratio |
ROaE |
ROaA |
|
Jubilee Insurance |
(2.6%) |
13.0% |
23.8% |
101.2% |
46.6% |
13.9% |
3.3% |
|
Liberty |
31.0% |
6.6% |
24.3% |
77.5% |
69.5% |
9.5% |
2.0% |
|
Kenya Re |
74.1% |
9.3% |
25.3% |
71.2% |
44.3% |
13.2% |
8.4% |
|
CIC |
(33.1%) |
0.9% |
11.9% |
69.7% |
50.0% |
4.1% |
0.9% |
|
Britam |
N/A |
12.3% |
8.4% |
65.3% |
69.3% |
13.3% |
3.1% |
|
Sanlam |
N/A |
5.1% |
(5.6%) |
85.7% |
62.2% |
6.9% |
0.4% |
|
*FY'2019 Weighted Average |
6.4% |
10.2% |
16.3% |
79.4% |
56.8% |
11.9% |
3.3% |
|
**FY'2018 Weighted Average |
(18.4%) |
1.1% |
4.5% |
72.4% |
52.5% |
3.9% |
2.3% |
|
*Market cap weighted as at 17/07/2020 |
|||||||
|
**Market cap weighted as at 31/12/2018 |
|||||||
The key take-outs from the above table include;
- The above six listed insurance companies recorded a 6.4% increase in core Earnings Per Share (EPS), higher than the 18.4% decline recorded in FY’2018, primarily driven by growth in investment income with the average investment yield for the listed sector coming in at 10.3%, higher than the 9.7% recorded in FY’2018. The Return on Average Equity (RoAE) consequently increased to 11.9%, from 3.9% recorded in FY’2018,
- The listed sector recorded a stronger premium growth, which came in at 10.2%, with all the listed insurance companies recording a level of growth in their top line. The growth was faster than the 1.1% growth recorded in FY’2018. Consequently, the net claims and policyholders benefits rose by 16.3%, higher than the 4.5% increase recorded in FY’2018 amid concerns of underwriting profits in the industry, and,
- The loss ratio recorded a 79.4% growth in FY’2019 from 72.4% in FY’2018, despite the tough measures undertaken by market players to reduce fraudulent claims. The expense ratio also increased to 56.8% in FY’2019 from 52.5% in FY’2018, highlighting the listed insurance sector has not been efficient in managing costs.
Section III: The Focus Areas of the Insurance Sector Players Going Forward
Following the stable growth achieved by the insurance sector over the last decade, we expect the sector to transition into a more stable sector on the back of an improving economy and heightened regulations, which will enhance the capacity of the sector to sustain profitability. Based on the current tough operating environment, we believe 2020 performance in the Insurance sector will be shaped by the following key factors;
- Depressed Investment Income: With declines recorded in the Equities market and a decline in yields on government securities, we expect insurance companies to record lower income from investments. Over the years, insurers had moved their focus to growing investment income, which involved an increase in the assets under management segments and investments in property. We expect insurers to refocus on their core operations boosted by an amendment to the Insurance Act which requires premiums to be paid directly to insurance companies in effect cutting intermediaries and reducing fraud,
- Cost Rationalization: Operational expenses have been a key agenda item for insurance companies, as they try to bring down their operating costs. We expect insurance companies to continue with their cost rationalization measures through increased adoption of alternative channels of transactions such as mobile, internet and banc assurance thus insurance companies are able to reduce front-office operations, thereby cutting the number of staff required and by extension, reducing operating expenses and hence, improving operational efficiency
- Fraud: Fraud is still one of the biggest challenges faced by the insurance industry and with an expectation of an increase in claims, which are indirectly related to the pandemic and a reduction in written premiums as an individual, and business incomes are affected, we expect insurance companies to push more efforts towards curbing fraud in order to boost their underwriting profits. Estimates indicate that 25.0% of insurance industry income is fraudulently claimed, with motor and medical claims being the most common,
- Increased Adoption of Technology: The insurance sector has been riding on the digital revolution wave to improve their operational efficiency and increase insurance penetration. Increased adoption of alternative channels of transactions such as mobile, internet and banc assurance, has led to increased transactions carried out via alternative channels, and,
- Merger & Acquisition activity: The insurance sector is booming with mergers and acquisitions mainly with companies trying to protect their market share in a competitive environment. The insurance sector is likely to experience more mergers and acquisitions with many insurers trying to meet the solvency requirements.
Section IV: Brief Summary and Ranking of the Listed Insurers based on the Outcome of Our Analysis
As per our analysis on the Insurance sector, we ranked insurance firms based on a weighted average ranking of Franchise value (accounting for 40%) and intrinsic value (accounting for 60%). Important to note is that Kenya Re was not considered in the below rankings given it is a re-insurance company, and not a listed insurance company that undertakes traditional life & general underwriting business.
For the franchise value ranking, we included the earnings and growth metrics as well as the operating metrics shown in the table below in order to carry out a comprehensive review:
|
Insurance |
Loss Ratio |
Expense Ratio |
Combined Ratio |
Return on Average Capital Employed |
Tangible Common Ratio |
|
Jubilee Insurance |
101.2% |
46.6% |
147.8% |
13.9% |
21.50% |
|
Britam |
65.3% |
69.3% |
134.6% |
13.3% |
21.40% |
|
Liberty |
77.5% |
69.5% |
147.0% |
9.5% |
17.20% |
|
Sanlam |
85.7% |
62.2% |
147.9% |
6.9% |
5.70% |
|
CIC |
69.7% |
50.0% |
119.7% |
4.1% |
21.70% |
|
Weighted Average FY'2019 |
71.0% |
51.6% |
136.2% |
10.3% |
20.6% |
The Intrinsic Valuation is computed through a combination of valuation techniques, with a weighting of 40.0% on Discounted Cash-flow Methods, 35.0% on Residual Income and 25.0% on Relative Valuation. The overall FY’2019 ranking is as shown in the table below:
|
Cytonn Listed Insurance Companies FY’2019 Comprehensive Ranking |
|||||
|
Bank |
Franchise Value Score |
Intrinsic Value Score |
Weighted Score |
FY'2019 Ranking |
H1'2019 Ranking |
|
Jubilee Holdings |
12 |
1 |
5.4 |
1 |
1 |
|
Britam Holdings |
20 |
4 |
10.4 |
2 |
4 |
|
Liberty Holdings |
22 |
3 |
10.6 |
3 |
3 |
|
Sanlam Kenya |
26 |
2 |
11.6 |
4 |
2 |
|
CIC Group |
25 |
5 |
13.0 |
5 |
5 |
Major Changes from the H1’2019 Ranking are;
- Britam Holdings whose rank improved to position 2 from position 4 in H1’2019, mainly due to an improvement in franchise scores, as a result of improved returns on assets and equity as well as an improvement in its loss ratio, and,
- Sanlam Kenya whose rank declined to position 4 from position 2 in H1’2019, on the back of a weak franchise score, driven by the deterioration in its expense ratio to 62.2% in FY’2019 from 54.3% in H1’2019.
Section V: Conclusion & Recommendation
The sector continues to undergo transition mainly on the digital transformation and regulation front, which is critical for stability and sustainability of a conducive business environment for one of the key sectors of Kenya’s economy. We are of the view that insurance companies have a lot they can do in order to register considerable growth and improve the level of penetration in the country, namely:
- We expect the synergy between banks and insurance companies to offer Banc assurance to continue and will help with penetration. Insurance companies will still want to leverage on the penetration of bank products to also push insurance products. Integration of mobile money payments to allow for policy payments is also expected to continue because of convenience which it provides and also mobile phone penetration in the country is high therefore insurance companies will want to leverage this to improve penetration,
- Technology and innovation capabilities are set to continue being the key anchors of growth for Sub-Saharan Africa in the coming years and thus it would be a great move for the sector to continue adopting mobile and online underwriting platforms enhancing convenience to customers in taking insurance policies thus raising the uptake of insurance products, and,
- We also expect that there will be increased regulation in the sector, as well as increased consolidation to reduce duplication of products by insurance companies. These efforts will improve revenue channels for insurance firms and the uptake of insurance products to enhance the sustainability of profitability.
Recommendation:
|
Company |
Price at 17/07/2020 |
Price at 24/07/2020 |
w/w change |
YTD Change |
Year Open |
Target Price* |
Dividend Yield |
Upside/ Downside** |
P/TBv Multiple |
Recommendation |
|
Kenya Reinsurance |
2.4 |
2.4 |
0.0% |
(20.8%) |
3.0 |
4.6 |
4.6% |
96.3% |
0.2x |
Buy |
|
Jubilee Holdings |
250.0 |
240.0 |
(4.0%) |
(31.6%) |
351.0 |
337.0 |
3.8% |
44.2% |
0.9x |
Buy |
|
Sanlam |
14.0 |
14.0 |
0.0% |
(18.6%) |
17.2 |
18.5 |
0.0% |
32.1% |
1.3x |
Buy |
|
Liberty Holdings |
7.9 |
8.0 |
1.5% |
(22.5%) |
10.4 |
9.9 |
0.0% |
23.4% |
0.7x |
Buy |
|
Britam |
7.5 |
7.1 |
(5.9%) |
(21.6%) |
9.0 |
7.7 |
3.5% |
12.6% |
0.7x |
Accumulate |
|
CIC Group |
2.4 |
2.4 |
3.8% |
(9.0%) |
2.7 |
2.1 |
0.0% |
(14.0%) |
0.8x |
Sell |

- Talk to us
- Kenya
- P.O Box 20695 - 00200, Nairobi, Kenya
- Cell +254709101200
- Tel +254709101200
- WhatsApp +254741676635
- United States
- +254709101200
- DOWNLOAD OUR APP
-


- Kenya
- 8th Floor, Pinetree Plaza, Kaburu Drive, Ngong Road, Nairobi, Kenya
- USA
- Suite 1150, 1775 Eye Street NW, USA, Washington DC 20006, USA
- Investments
- High Yield
- Private Equity
- Real Estate
- Real Estate
- RiverRun Estates
- Cytonn Towers
- The Ridge
- Taraji Heights
- The Alma