Kenya FY’2023 Insurance Report, & Cytonn Weekly #25/2024
By Research Team, Jun 23, 2024
Executive Summary
Fixed Income
During the week, T-bills were undersubscribed for the second consecutive week, with the overall undersubscription rate coming in at 60.0%, lower than the undersubscription rate of 94.7% recorded the previous week. Investors’ preference for the shorter 91-day paper persisted, with the paper receiving bids worth Kshs 5.9 bn against the offered Kshs 4.0 bn, translating to an oversubscription rate of 148.0%, lower than the oversubscription rate of 257.2% recorded the previous week. The subscription rate for the 182-day paper decreased to 39.3% from the 99.3% recorded the previous week, while the subscription rate for the 364-day paper increased to 45.5%, from the 25.0% recorded the previous week. The government accepted a total of Kshs 13.4 bn worth of bids out of Kshs 14.4 bn bids received, translating to an acceptance rate of 92.9%. The yields on the government papers recorded mixed performances, with the yield on the 91-day paper decreasing by 0.03 bps to remain relatively unchanged at 16.0%, while the yields on the 182-day and 364-day papers increased by 3.8 bps and 0.1 bps to remain relatively unchanged at 16.7% and 16.8% respectively;
Also, during the week, the Central Bank of Kenya released the tap sale results for the re-opened bonds, FXD1/2023/002 with a tenor to maturity of 1.2 years, and a fixed coupon rate of 17.0%, FXD1/2024/003 with a tenor to maturity of 2.6 years, and a fixed coupon rate of 18.4%, FXD1/2023/005 with a tenor to maturity of 4.1 years and a fixed coupon rate of 16.8% and FXD1/2024/010 with a tenor to maturity of 8.7 years and a fixed coupon rate of 14.2%. The bonds were oversubscribed with the overall subscription rate coming in at 125.7%, receiving bids worth Kshs 25.1 bn against the offered Kshs 20.0 bn. The government accepted bids worth Kshs 23.9 bn, translating to an acceptance rate of 94.9%. The weighted average yield of accepted bids for the FXD1/2023/002, FXD1/2024/003, FXD1/2023/005, and FXD1/2024/010 came in at 17.1%, 17.6%, 18.2% and 16.4% respectively, remaining unchanged from the weighted average rate of accepted bids in the last auction. With the inflation rate at 5.1% as of May 2024, the real return of the FXD1/2023/002, FXD1/2024/003, FXD1/2023/005, and FXD1/2024/010 is 12.0%, 12.5%, 13.1% and 11.3% respectively;
We are projecting the y/y inflation rate for June 2024 to come in at the range of 4.7% - 5.1% mainly on the back of reduced fuel prices, strengthened currency, and tight monetary policy, but weighed down by increased electricity prices;
Equities
During the week, the equities market was on a downward trajectory, with NSE 10 declining the most by 0.9% while NSE 20, NASI, and NSE 25 declined by 0.8% each taking the YTD performance to gains of 25.9%, 22.6%, 22.5% and 14.7% for NSE 10, NASI, NSE 25, and NSE 20 respectively. The equities market performance was driven by losses recorded by large-cap stocks such as KCB Group, Stanbic, and Co-op Bank of 3.7%, 3.0%, and 3.0% respectively. The performance was, however, supported by gains recorded by large-cap stocks such as Bamburi, EABL, and ABSA Bank of 2.3%, 0.4%, and 0.4% respectively;
Real Estate
During the week, Two Rivers International Finance & Innovation Centre (TRIFIC) announced that it has secured an investment of Kshs 6.0 bn from Vantage Capital; an African mezzanine finance investor. The funding will be utilized to fit out its first office tower, the TRIFIC North Tower, occupying 14,975 SQM in the Two Rivers. Additionally, Kenya’s National Social Security Fund (NSSF) and Tanzania’s Ministry of Foreign Affairs, in a joint real estate investment, launched the construction of Twin Towers in Upper Hill, Nairobi. Each tower will consist of 22 floors and will accommodate commercial offices and residential spaces ;
In the retail sector, international retail chain China Square opened its third branch in Langata. The retailer invested Kshs 600.0 mn to lease 100,000.0 square feet of space previously occupied by Uchumi Supermarkets for a seven-year period;
On the Unquoted Securities Platform, Acorn D-REIT and I-REIT traded at Kshs 24.5 and Kshs 22.0 per unit, respectively, as per the last updated data on 14th June, 2024. The performance represented a 22.5% and 10.0% gain for the D-REIT and I-REIT, respectively, from the Kshs 20.0 inception price;
Focus of the Week
Following the release of FY’2023 results by insurance companies, the Cytonn Financial Services Research Team undertook an analysis on the performance of the 5 listed insurance companies in Kenya, identified the key factors that influenced their performance, and gave our outlook for the insurance sector going forward.
Investment Updates:
- Weekly Rates:
- Cytonn Money Market Fund closed the week at a yield of 17.61% p.a. To invest, dial *809# or download the Cytonn App from Google Play store here or from the Appstore here;
- We continue to offer Wealth Management Training every Mondays and Thursdays, from 7:00 pm to 8:30 pm. The training aims to grow financial literacy among the general public. To register for any of our Wealth Management Trainings, click here;
- If interested in our Private Wealth Management Training for your employees or investment group, please get in touch with us through wmt@cytonn.com;
- Cytonn Insurance Agency acts as an intermediary for those looking to secure their assets and loved ones’ future through insurance namely; Motor, Medical, Life, Property, WIBA, Credit and Fire and Burglary insurance covers. For assistance, get in touch with us through insuranceagency@cytonn.com;
- Cytonn Asset Managers Limited (CAML) continues to offer pension products to meet the needs of both individual clients who want to save for their retirement during their working years and Institutional clients that want to contribute on behalf of their employees to help them build their retirement pot. To more about our pension schemes, kindly get in touch with us through pensions@cytonn.com;
Real Estate Updates:
- For more information on Cytonn’s real estate developments, email us at sales@cytonn.com;
- Phase 3 of The Alma is now ready for occupation and the show house is open daily. To join the waiting list to rent, please email properties@cytonn.com;
- For Third Party Real Estate Consultancy Services, email us at rdo@cytonn.com;
- For recent news about the group, see our news section here;
Hospitality Updates:
- We currently have promotions for Staycations. Visit cysuites.com/offers for details or email us at sales@cysuites.com;
Money Markets, T-Bills Primary Auction:
During the week, T-bills were undersubscribed for the second consecutive week, with the overall undersubscription rate coming in at 60.0%, lower than the undersubscription rate of 94.7% recorded the previous week. Investors’ preference for the shorter 91-day paper persisted, with the paper receiving bids worth Kshs 5.9 bn against the offered Kshs 4.0 bn, translating to an oversubscription rate of 148.0%, lower than the oversubscription rate of 257.2% recorded the previous week. The subscription rate for the 182-day paper decreased to 39.3% from the 99.3% recorded the previous week, while the subscription rate for the 364-day paper increased to 45.5%, from the 25.0% recorded the previous week. The government accepted a total of Kshs 13.4 bn worth of bids out of Kshs 14.4 bn bids received, translating to an acceptance rate of 92.9%. The yields on the government papers recorded mixed performances, with the yield on the 91-day paper decreasing by 0.03 bps to remain relatively unchanged at 16.0%, while the yields on the 182-day and 364-day papers increased by 3.8 bps and 0.1 bps to remain relatively unchanged at 16.7% and 16.8% respectively; The chart below shows the yield growth rate for the 91-day paper over the period:

The chart below compares the overall average T-bill subscription rates obtained in 2018, 2022, 2023, and 2024 Year-to-date (YTD):

Also, during the week, the Central Bank of Kenya released the tap sale results for the re-opened bonds, FXD1/2023/002 with a tenor to maturity of 1.2 years, and a fixed coupon rate of 17.0%, FXD1/2024/003 with a tenor to maturity of 2.6 years, and a fixed coupon rate of 18.4%, FXD1/2023/005 with a tenor to maturity of 4.1 years and a fixed coupon rate of 16.8% and FXD1/2024/010 with a tenor to maturity of 8.7 years and a fixed coupon rate of 14.2%. The bonds were oversubscribed with the overall subscription rate coming in at 125.7%, receiving bids worth Kshs 25.1 bn against the offered Kshs 20.0 bn. The government accepted bids worth Kshs 23.9 bn, translating to an acceptance rate of 94.9%. The weighted average yield of accepted bids for the FXD1/2023/002, FXD1/2024/003, FXD1/2023/005, and FXD1/2024/010 came in at 17.1%, 17.6%, 18.2% and 16.4% respectively, remaining unchanged from the weighted average rate of accepted bids in the last auction. With the Inflation rate at 5.1% as of May 2024, the real return of the FXD1/2023/002, FXD1/2024/003, FXD1/2023/005, and FXD1/2024/010 is 12.0%, 12.5%, 13.1% and 11.3% respectively;
Money Market Performance:
In the money markets, 3-month bank placements ended the week at 13.5% (based on what we have been offered by various banks), and the yields on the government papers recorded mixed performances, with the yield on the 91-day paper decreasing by 0.03 bps to remain relatively unchanged at 16.0%, while the yield on the 364-day papers increased by 0.1 bps to remain relatively unchanged at 16.8% respectively. The yields on the Cytonn Money Market Fund remained unchanged at the 17.6% recorded the previous week, while the average yields on the Top 5 Money Market Funds decreased by 3.0 bps to 17.5% from the 17.6% recorded the previous week.

The table below shows the Money Market Fund Yields for Kenyan Fund Managers as published on 21st June 2024:
|
Cytonn Report: Money Market Fund Yield for Fund Managers as published on 21st June 2024 |
||
|
Rank |
Fund Manager |
Effective Annual Rate |
|
1 |
Lofty-Corban Money Market Fund |
18.3% |
|
2 |
Etica Money Market Fund |
18.0% |
|
3 |
Cytonn Money Market Fund (Dial *809# or Download the Cytonn App) |
17.6% |
|
4 |
Kuza Money Market fund |
17.1% |
|
5 |
GenAfrica Money Market Fund |
16.6% |
|
6 |
Nabo Africa Money Market Fund |
16.5% |
|
7 |
Enwealth Money Market Fund |
15.7% |
|
8 |
Co-op Money Market Fund |
15.7% |
|
9 |
KCB Money Market Fund |
15.6% |
|
10 |
Apollo Money Market Fund |
15.5% |
|
11 |
GenCap Hela Imara Money Market Fund |
15.5% |
|
12 |
Madison Money Market Fund |
15.3% |
|
13 |
Mali Money Market Fund |
15.2% |
|
14 |
Jubilee Money Market Fund |
15.2% |
|
15 |
AA Kenya Shillings Fund |
15.2% |
|
16 |
Sanlam Money Market Fund |
15.1% |
|
17 |
Absa Shilling Money Market Fund |
14.9% |
|
18 |
Mayfair Money Market Fund |
14.8% |
|
19 |
Orient Kasha Money Market Fund |
14.2% |
|
20 |
Dry Associates Money Market Fund |
14.0% |
|
21 |
Equity Money Market Fund |
13.9% |
|
22 |
Old Mutual Money Market Fund |
13.5% |
|
23 |
CIC Money Market Fund |
13.2% |
|
24 |
ICEA Lion Money Market Fund |
12.3% |
|
25 |
British-American Money Market Fund |
9.7% |
Source: Business Daily
Liquidity:
During the week, liquidity in the money markets marginally tightened, with the average interbank rate increasing by 2.3 bps, to 13.1% from the 13.0% recorded the previous week, partly attributable to tax remittances that offset government payments. The average interbank volumes traded increased by 36.2% to Kshs 26.7 bn from Kshs 19.6 bn recorded the previous week. The chart below shows the interbank rates in the market over the years:

Kenya Eurobonds:
During the week, the yields on Eurobonds were on an upward trajectory, with the yields on the 10-year Eurobond issued in 2018 increasing the most by 61.7 bps to 10.1% from 9.4% recorded the previous week, partly attributable to the ongoing finance bill protests in the country that have heightened instability and increased investor concerns over disruptions in economic activities. The table below shows the summary of the performance of the Kenyan Eurobonds as of 20th June 2024;
|
Cytonn Report: Kenya Eurobonds Performance |
||||||
|
|
2018 |
2019 |
2021 |
2024 |
||
|
Tenor |
10-year issue |
30-year issue |
7-year issue |
12-year issue |
13-year issue |
7-year issue |
|
Amount Issued (USD) |
1.0 bn |
1.0 bn |
0.9 bn |
1.2 bn |
1.0 bn |
1.5 bn |
|
Years to Maturity |
3.7 |
23.7 |
2.9 |
7.9 |
10.0 |
6.7 |
|
Yields at Issue |
7.3% |
8.3% |
7.0% |
7.9% |
6.2% |
10.4% |
|
1-Jan-24 |
9.8% |
10.2% |
10.1% |
9.9% |
9.5% |
|
|
3-Jun-24 |
9.2% |
10.1% |
9.0% |
9.7% |
9.8% |
9.7% |
|
13-Jun-24 |
9.4% |
10.4% |
9.3% |
10.0% |
10.1% |
10.0% |
|
14-Jun-24 |
9.6% |
10.5% |
9.3% |
10.2% |
10.2% |
10.1% |
|
17-Jun-24 |
9.8% |
10.7% |
9.6% |
10.4% |
10.4% |
10.3% |
|
18-Jun-24 |
9.7% |
10.6% |
9.4% |
10.3% |
10.3% |
10.2% |
|
19-Jun-24 |
9.7% |
10.6% |
9.4% |
10.3% |
10.3% |
10.2% |
|
20-Jun-24 |
10.1% |
10.8% |
9.6% |
10.5% |
10.5% |
10.5% |
|
Weekly Change |
0.6% |
0.4% |
0.3% |
0.5% |
0.4% |
0.5% |
|
MTD Change |
0.8% |
0.7% |
0.6% |
0.8% |
0.7% |
0.8% |
|
YTD Change |
0.2% |
0.6% |
(0.5%) |
0.7% |
1.0% |
- |
Source: Central Bank of Kenya (CBK) and National Treasury
Kenya Shilling:
During the week, the Kenya Shilling appreciated against the US Dollar by 0.1%, to close at Kshs 128.6, from Kshs 128.7 recorded the previous week. On a year-to-date basis, the shilling has appreciated by 18.1% against the dollar, a contrast to the 26.8% depreciation recorded in 2023.
We expect the shilling to be supported by:
- Diaspora remittances standing at a cumulative USD 4,509.8 mn in the 12 months to May 2024, 12.8% higher than the USD 3,997.3 mn recorded over the same period in 2023, which has continued to cushion the shilling against further depreciation. In the May 2024 diaspora remittances figures, North America remained the largest source of remittances to Kenya accounting for 56.0% in the period, and,
- The tourism inflow receipts which came in at USD 352.5 bn in 2023, a 31.5% increase from USD 268.1 bn inflow receipts recorded in 2022, and owing to tourist arrivals that improved by 27.2% to 2.1 mn in the 12 months to March 2024, from 1.6 mn recorded during a similar period in 2023.
The shilling is however expected to remain under pressure in 2024 as a result of:
- An ever-present current account deficit which came at 4.0% of GDP in FY’2023 from 5.1% recorded in FY’2022,
- The need for government debt servicing, continues to put pressure on forex reserves given that 67.3% of Kenya’s external debt was US Dollar denominated as of December 2023, and,
- Dwindling forex reserves, currently at USD 8.3 mn (equivalent to 4.3 months of import cover), which is above the statutory requirement of maintaining at least 4.0 months of import cover.
Key to note, Kenya’s forex reserves increased significantly by 18.7% during the week to close at USD 8.3 bn from the USD 7.0 bn recorded the previous week, equivalent to 4.3 months of import cover, an increase from the 3.7 months recorded the previous week, and above the statutory requirement of maintaining at least 4.0-months of import cover for the first time in eleven months. This jump could be attributed to disbursement on the USD 1.2 bn earlier approved in April 2024, which would be used in settlement of the remainder of the USD 600 mn the 10-year Eurobond issued in 2014 set to mature on 24th June, 2024. The chart below summarizes the evolution of Kenya's months of import cover over the years:

Weekly Highlights
- June Inflation Projection
We are projecting the y/y inflation rate for June 2024 to come in at the range of 4.7%-5.1%mainly on the back of:
- Reduced Fuel Prices – The prices for Super Petrol, Diesel, and Kerosene decreased by Kshs 3.0, Kshs 6.1, and Kshs 5.7 each respectively, and will retail at Kshs 192.8, Kshs 179.2 and Kshs 168.7 per litre respectively from the May 2024 prices of Kshs 189.8, Kshs 173.1 and Kshs 163.1 respectively, according to the latest EPRA report, following the government's efforts to stabilize pump prices through the petroleum pump price stabilization mechanism which has so far expended Kshs 9.9 bn in the FY2023/24 to cushion the increases applied to the petroleum pump prices. This decline in fuel prices is likely to contribute to the easing of inflationary pressures as it provides a stabilizing effect on consumer purchasing power as well as business operational costs, since fuel is a major input cost for businesses,
- The maintenance of the Central Bank Rate (CBR) at 13.0% – In February this year, the monetary policy committee noted that there was need to tighten the monetary policy following the sustained depreciation of the Kenyan shilling as well as the heightened inflationary pressures which came in at 6.9% in the month of January, 0.3% points increase from the 6.6% in December and remaining within the upper bound of the inflation target range of 2.5% to 7.5%. In line with this, the committee increased the CBR by 50 bps to 13.00% from 12.50% in February. Additionally, on 5th June 2024, the monetary policy committee decided to maintain the CBR at 13.0% to give the new rate time to take further effect in the economy, with inflation at 5.1% in May from 5.0% recorded in April 2024. This tight monetary policy stance helps manage inflation by reducing circulation of credit in the economy through the high interest rates, and,
- Strengthening of the Kenya Shilling against the US Dollar – The Kenyan Shilling has recorded a 1.3% month-to-date gain to Kshs 128.6 as of 21st June 2024 from the Kshs 130.5 recorded at the beginning of the month in addition to the 18.1% year-to-date gain from the Kshs 157.0 recorded at the beginning of the year. This can be attributed to the recent buyback of the USD 2.0 bn Eurobond, alleviating the debt-risk on the country, the inflows from foreign loans and the infrastructure bond, which increased dollar supply in the economy coupled with the monetary policy committee’s decision to maintain the CBR at 13.0%. This gain in the exchange rate is expected to ease inflation further on the back of reduced import bill and input prices.
This may, however, be negatively impacted by:
- Increase in electricity prices – This month, EPRA announced a Kshs 0.86 increase per unit in electricity consumer prices on the back of higher payments of power purchase costs to power producers during the month. With electricity being one of the major inputs of inflation, this increase is expected to increase production costs for businesses as well as increase electricity costs for households and thus easing inflation. In the same review, EPRA raised the Fuel Energy Charge (FEC) to Kshs 3.6 per unit from Kshs 3.5 in May. Foreign exchange adjustment (Ferfa) was also increased to Kshs 1.8 per unit from Kshs 1.0 in May.
Going forward, we expect inflationary pressures to alleviate in the short term, while remaining in the CBK’s target range of 2.5%-7.5% aided by the strengthening of the Kenya shilling against the US Dollar, which has continued to contribute to a reduction in fuel prices. Furthermore, the decision to maintain the CBR at 13.0% during the latest MPC meeting in June is meant to continue reducing money supply, in turn easing inflation as well as support the exchange rate. We also anticipate that government initiatives to subsidize key inputs in agricultural production, such as fertilizers, will drive down the costs of farming inputs and support the easing of inflation in the long term.
Rates in the Fixed Income market have been on an upward trend given the continued high demand for cash by the government and the occasional liquidity tightness in the money market. The government is 4.4% behind its prorated net domestic borrowing target of Kshs 581.2 bn, and 5.7% behind the total domestic net borrowing target of Kshs 589.3 bn for FY’2023/2024, having a net borrowing position of Kshs 555.6 bn. However, we expect a downward readjustment of the yield curve in the short and medium term, with the government looking to increase its external borrowing to maintain the fiscal surplus, hence alleviating pressure in the domestic market. As such, we expect the yield curve to normalize in the medium to long-term and hence investors are expected to shift towards the long-term papers to lock in the high returns.
Market Performance:
During the week, the equities market was on a downward trajectory, with NSE 10 declining the most by 0.9% while NSE 20, NASI and NSE 25 declined by 0.8% each taking the YTD performance to gains of 25.9%, 22.6%, 22.5% and 14.7% for NSE 10, NASI, NSE 25, and NSE 20 respectively. The equities market performance was driven by losses recorded by large-cap stocks such as KCB Group, Stanbic, and Co-op Bank of 3.7%, 3.0%, and 3.0% respectively. The performance was, however, supported by gains recorded by large-cap stocks such as Bamburi, EABL, and ABSA Bank of 2.3%, 0.4%, and 0.4% respectively.
During the week, equities turnover decreased by 10.0% to USD 9.3 mn from USD 10.3 mn recorded the previous week, taking the YTD total turnover to USD 341.3 mn. Foreign investors remained net buyers for the fifth consecutive week with a net buying position of USD 1.3 mn, from a net buying position of USD 1.9 mn recorded the previous week, taking the YTD foreign net buying position to USD 7.7 mn.
The market is currently trading at a price-to-earnings ratio (P/E) of 5.6x, 53.1% below the historical average of 11.9x. The dividend yield stands at 7.7%, 3.2% points above the historical average of 4.5%. Key to note, NASI’s PEG ratio currently stands at 0.7x, an indication that the market is undervalued relative to its future growth. A PEG ratio greater than 1.0x indicates the market is overvalued while a PEG ratio less than 1.0x indicates that the market is undervalued. The charts below indicate the historical P/E and dividend yields of the market;


Universe of Coverage:
|
Cytonn Report: Equities Universe of Coverage |
||||||||||
|
Company |
Price as at 14/06/2024 |
Price as at 21/06/2024 |
w/w change |
YTD Change |
Year Open 2024 |
Target Price* |
Dividend Yield |
Upside/ Downside** |
P/TBv Multiple |
Recommendation |
|
Jubilee Holdings |
180.0 |
180.0 |
0.0% |
(2.7%) |
185.0 |
260.7 |
7.9% |
52.8% |
0.3x |
Buy |
|
Diamond Trust Bank*** |
46.1 |
46.3 |
0.4% |
3.5% |
44.8 |
65.2 |
10.8% |
51.6% |
0.2x |
Buy |
|
Equity Group*** |
43.9 |
43.4 |
(1.1%) |
26.9% |
34.2 |
60.2 |
9.2% |
47.9% |
0.9x |
Buy |
|
Sanlam |
6.0 |
6.0 |
0.0% |
0.0% |
6.0 |
8.8 |
0.0% |
46.9% |
1.7x |
Buy |
|
NCBA*** |
40.8 |
40.9 |
0.2% |
5.3% |
38.9 |
55.2 |
11.6% |
46.6% |
0.8x |
Buy |
|
Co-op Bank*** |
13.4 |
13.0 |
(3.0%) |
14.5% |
11.4 |
17.2 |
11.5% |
43.8% |
0.6x |
Buy |
|
Stanbic Holdings |
117.3 |
113.8 |
(3.0%) |
7.3% |
106.0 |
145.3 |
13.5% |
41.2% |
0.8x |
Buy |
|
KCB Group*** |
35.5 |
34.2 |
(3.7%) |
55.6% |
22.0 |
46.7 |
0.0% |
36.6% |
0.5x |
Buy |
|
Standard Chartered*** |
197.8 |
193.8 |
(2.0%) |
20.9% |
160.3 |
233.1 |
15.0% |
35.3% |
1.3x |
Buy |
|
ABSA Bank*** |
13.9 |
14.0 |
0.4% |
20.8% |
11.6 |
17.3 |
11.1% |
35.1% |
1.1x |
Buy |
|
CIC Group |
2.2 |
2.2 |
0.0% |
(4.8%) |
2.3 |
2.8 |
6.0% |
34.4% |
0.7x |
Buy |
|
Kenya Reinsurance |
2.8 |
2.8 |
1.1% |
53.0% |
1.9 |
3.5 |
10.6% |
34.3% |
0.2x |
Buy |
|
I&M Group*** |
20.6 |
21.5 |
4.1% |
22.9% |
17.5 |
25.5 |
11.9% |
30.8% |
0.4x |
Buy |
|
Britam |
6.0 |
6.0 |
0.0% |
16.7% |
5.1 |
7.5 |
0.0% |
25.0% |
0.8x |
Buy |
|
Liberty Holdings |
5.9 |
5.8 |
(1.0%) |
50.8% |
3.9 |
6.1 |
6.4% |
11.2% |
0.4x |
Accumulate |
|
HF Group |
4.2 |
4.1 |
(2.6%) |
19.4% |
3.5 |
4.5 |
0.0% |
9.2% |
0.2x |
Hold |
|
Target Price as per Cytonn Analyst estimates **Upside/ (Downside) is adjusted for Dividend Yield ***For Disclosure, these are stocks in which Cytonn and/or its affiliates are invested in |
||||||||||
We are “Neutral” on the Equities markets in the short term due to the current tough operating environment and huge foreign investor outflows, and, “Bullish” in the long term due to current cheap valuations and expected global and local economic recovery. With the market currently being undervalued for its future growth (PEG Ratio at 0.7x), we believe that investors should reposition towards value stocks with strong earnings growth and that are trading at discounts to their intrinsic value. We expect the current high foreign investors’ sell-offs to continue weighing down the equities outlook in the short term.
- Commercial Office Sector
- Two Rivers International Finance and Innovation Centre (TRIFIC) secured Kshs 6.0 bn from Vantage Capital
During the week, Two Rivers International Finance & Innovation Centre (TRIFIC) announced that it has secured an investment of Kshs 6.0 bn from Vantage Capital; an African mezzanine finance investor. The funding will be utilized to fit out its first office tower, the TRIFIC North Tower, occupying 14,975.0 SQM in the Two Rivers. In addition, TRIFIC SEZ will develop a new office tower of 76,800.0 SQM of leasable space for additional SEZ enterprises. TRIFIC SEZ has already secured bookings for the TRIFIC North Tower from fourteen SEZ enterprises and has a pipeline of additional enterprises interested in joining its zone, prompting the need for the development of more office towers. A major attractiveness to the enterprises entering the TRIFIC SEZ is the direct access to the expansive Two Rivers, which features residential developments, dining and lifestyle options, retail offerings, and entertainment venues.
- Launch of the construction of Tanzanian Twin Towers in Upper Hill
During the week, Kenya’s National Social Security Fund (NSSF) and Tanzania’s Ministry of Foreign Affairs, in a joint real estate investment, launched the construction of Twin Towers in Upper Hill, Nairobi. Each tower will consist of 22 floors and will accommodate commercial offices and residential spaces. Tanzania’s embassy in Kenya will be housed in this development, aiming to save on rental expenses once completed.
By adding this investment to its foreign real estate portfolio, Tanzania aims to offset rental expenditures on embassies’ commercial offices and residential spaces, which currently stand at Kshs 1.4 bn, and to generate a rental income of Kshs 1.8 bn from its real estate properties across different countries. Tanzania plans to develop its government properties in other countries, including the Democratic Republic of Congo (DRC), Uganda, Nigeria, and others, in collaboration with private entities from those countries.
Upon completion, the project is expected to contribute to growth in the commercial office segment, especially in the Nairobi Metropolitan Area (NMA), by adding more grade-A offices in the Upper Hill node. It will also create job opportunities, improve Upper Hill’s status as an ideal location for ambassadorial and diplomatic residency, spur business activities in the area, enhance Kenya’s diplomatic ties with Tanzania, and strengthen Nairobi’s reputation as a hub for quality commercial and residential real estate. In Q1’ 2024, Upper Hill posted a performance of 6.3% in rental yields, which was below market average, mainly due to stiff competition from neighboring nodes such as Nairobi CBD and Kilimani. The table below displays the performance of sub-markets in the Nairobi Metropolitan Area (NMA) in the commercial office submarket in Q1’2024;
|
Cytonn Report: NMA Commercial Office Submarket Performance Q1'2024 |
|||||||||||
|
Area |
Price/SQFT Q1'2024 |
Rent/SQFT Q1'2024 |
Occupancy Q1'2024 |
Rental Yields Q1'2024 |
Price/SQFT Q1'2023 |
Rent/SQFT Q1'2023 |
Occupancy Q1'2023 |
Rental Yields Q1'2023 |
∆ in Rent |
∆ in Occupancy (% points) |
∆ in Rental Yields (% points) |
|
Westlands |
12,495 |
118 |
76.3% |
8.5% |
12032 |
108 |
77.2% |
8.4% |
9.6% |
0.9% |
0.1% |
|
Gigiri |
15,000 |
128 |
80.2% |
8.2% |
13,500 |
118 |
81.6% |
8.7% |
8.5% |
1.4% |
0.5% |
|
Karen |
14,254 |
118 |
80.5% |
8.0% |
13,431 |
111 |
82.9% |
8.3% |
6.3% |
2.5% |
0.3% |
|
Parklands |
11,875 |
92 |
84.0% |
7.8% |
11,662 |
91 |
82.2% |
7.8% |
1.0% |
1.8% |
0.1% |
|
Kilimani |
13,051 |
100 |
83.2% |
7.8% |
12,260 |
93 |
84.1% |
7.8% |
7.2% |
0.9% |
0.0% |
|
Nairobi CBD |
12,029 |
89 |
85.6% |
7.6% |
11,971 |
83 |
85.3% |
7.2% |
8.0% |
0.3% |
0.4% |
|
Upperhill |
13,014 |
100 |
72.9% |
6.3% |
12,605 |
97 |
76.6% |
7.0% |
3.6% |
3.6% |
0.7% |
|
Thika Road |
12,571 |
79 |
80.4% |
6.0% |
12,571 |
79 |
80.3% |
6.0% |
0.0% |
0.1% |
0.0% |
|
Mombasa Road |
11,325 |
79 |
72.2% |
6.0% |
11,325 |
71 |
67.0% |
5.2% |
10.1% |
5.2% |
0.8% |
|
Average |
12,665 |
103 |
80.1% |
7.6% |
12,238 |
97 |
79.8% |
7.6% |
6.0% |
0.3% |
0.0% |
|
All values in Kshs unless stated otherwise |
|||||||||||
Source:Cytonn Research
Going forward, we expect more developments in the commercial office segment driven by: i) a robust demand for high-quality office environments, particularly from international corporations seeking prime locations for their operations, ii) the expansion of the serviced office concept, which offers flexible and fully-equipped office solutions and is likely to attract a wide range of businesses, and iii) the rise of entrepreneurial ventures and start-ups, as well as the continued uptake of commercial spaces.
- Retail Sector
During the week, international retail chain China Square opened its third branch in Langata. The retailer invested Kshs 600.0 mn to lease 100,000.0 square feet of space previously occupied by Uchumi Supermarkets for a seven-year period. China Square also operates two other outlets at Kenyatta University’s Unicity Mall and The Waterfront Mall in Karen. For this new venture, the retailer raised capital internally and from banks, targeting the heavy vehicular and human traffic in the area. Additionally, China Square plans to open another outlet in Mombasa later this year. Retailers have been actively pursuing expansion, especially in high-traffic areas like Langata. For example, Naivas opened a new branch in the area this year. This expansion trend aims to widen customer bases and adapt to evolving market demands. Besides China Square, other retailers that have launched new outlets in 2024 include Naivas, Jaza Stores, and Quick Mart. The following table outlines the current store counts of major local and international supermarket chains operating in Kenya and international supermarket chains operating in Kenya;
|
Cytonn Report: Main Local and International Retail Supermarket Chains |
|||||||||||
|
# |
Name of retailer |
Category |
Branches as at FY’2018 |
Branches as at FY’2019 |
Branches as at FY’2020 |
Branches as at FY’2021 |
Branches as at FY’2022 |
Branches as at FY’2023 |
Branches opened in FY’2024 |
Closed Branches |
Current Branches |
|
1 |
Naivas |
Hybrid* |
46 |
61 |
69 |
79 |
91 |
100 |
5 |
0 |
105 |
|
2 |
Quick Mart |
Hybrid** |
10 |
29 |
37 |
48 |
55 |
59 |
1 |
0 |
60 |
|
3 |
Chandarana |
Local |
14 |
19 |
20 |
23 |
26 |
26 |
0 |
0 |
26 |
|
4 |
Carrefour |
International |
6 |
7 |
9 |
16 |
19 |
22 |
0 |
0 |
22 |
|
5 |
Cleanshelf |
Local |
9 |
10 |
11 |
12 |
12 |
13 |
0 |
0 |
13 |
|
6 |
Jaza Stores |
Local |
0 |
0 |
0 |
0 |
0 |
4 |
2 |
0 |
6 |
|
7 |
Tuskys |
Local |
53 |
64 |
64 |
6 |
6 |
5 |
0 |
59 |
5 |
|
8 |
China Square |
International |
0 |
0 |
0 |
0 |
0 |
2 |
1 |
0 |
3 |
|
9 |
Uchumi |
Local |
37 |
37 |
37 |
2 |
2 |
2 |
0 |
35 |
2 |
|
10 |
Panda Mart |
International |
0 |
0 |
0 |
0 |
0 |
0 |
1 |
0 |
1 |
|
11 |
Game Stores |
International |
2 |
2 |
3 |
3 |
0 |
0 |
0 |
3 |
0 |
|
12 |
Choppies |
International |
13 |
15 |
15 |
0 |
0 |
0 |
0 |
15 |
0 |
|
13 |
Shoprite |
International |
2 |
4 |
4 |
0 |
0 |
0 |
0 |
4 |
0 |
|
14 |
Nakumatt |
Local |
65 |
65 |
65 |
0 |
0 |
0 |
0 |
65 |
0 |
|
Total |
257 |
313 |
334 |
189 |
211 |
233 |
10 |
181 |
243 |
||
|
*51% owned by IBL Group (Mauritius), Proparco (France), and DEG (Germany), while 49% owned by Gakiwawa Family (Kenya) |
|
||||||||||
|
**More than 50% owned by Adenia Partners (Mauritius), while Less than 50% owned by Kinuthia Family (Kenya) |
|||||||||||
Source: Cytonn Research
Going forward, we expect to witness more retailers rolling out their expansion agendas for the year, driven by increased investments from both local and international investors, the availability of retail space, a growing consumer base, and evolving consumer preferences in the country.
- Real Estate Investments Trusts (REITs)
On the Unquoted Securities Platform, Acorn D-REIT and I-REIT traded at Kshs 24.5 and Kshs 22.0 per unit, respectively, as per the last updated data on 14th June, 2024. The performance represented a 22.5% and 10.0% gain for the D-REIT and I-REIT, respectively, from the Kshs 20.0 inception price. The volumes traded for the D-REIT and I-REIT came in at 12.3 mn and 30.7 mn shares, respectively, with a turnover of Kshs 257.5 mn and Kshs 633.8 mn, respectively, since inception in February 2021.
REITs offer various benefits, such as tax exemptions, diversified portfolios, and stable long-term profits. However, the ongoing decline in the performance of Kenyan REITs and the restructuring of their business portfolios are hindering significant previous investments. Additional general challenges include: i) insufficient understanding of the investment instrument among investors, ii) lengthy approval processes for REIT creation, iii) high minimum capital requirements of Kshs 100.0 mn for trustees, and iv) minimum investment amounts set at Kshs 5.0 mn for the Investment REITs, all of which continue to limit the performance of the Kenyan REITs market.
We expect performance of Kenya’s real estate sector will be supported by: i) increased investment from local and international players, particularly in the retail and commercial sectors, ii) Nairobi’s recognized status as a regional hub, which will drive growth in the commercial office and industrial sectors, iii) relatively favorable demographics in the country, leading to increased demand for housing and real estate, and iv) ongoing residential developments under the Affordable Housing Agenda, which aims to reduce the housing deficit in the country. However, challenges such as rising construction costs, strain on infrastructure development (including drainage systems), high capital requirements for REITs, and existing oversupply in select real estate sectors will continue to hinder the sector’s optimal performance by limiting developments and investments.
Following the release of the FY’2023 results by Kenyan insurance firms, the Cytonn Financial Services Research Team undertook an analysis on the financial performance of the listed insurance companies and the key factors that drove the performance of the sector. In this report, we assess the main trends in the sector, and areas that will be crucial for growth and stability going forward, seeking to give a view on which insurance firms are the most attractive and stable for investment. As a result, we shall address the following:
- Insurance Penetration in Kenya,
- Key Themes that Shaped the Insurance Sector in FY’2023,
- Industry Highlights and Challenges,
- Performance of The Listed Insurance Sector in FY’2023, and,
- Conclusion & Outlook of the Insurance Sector.
Section I: Insurance Penetration in Kenya
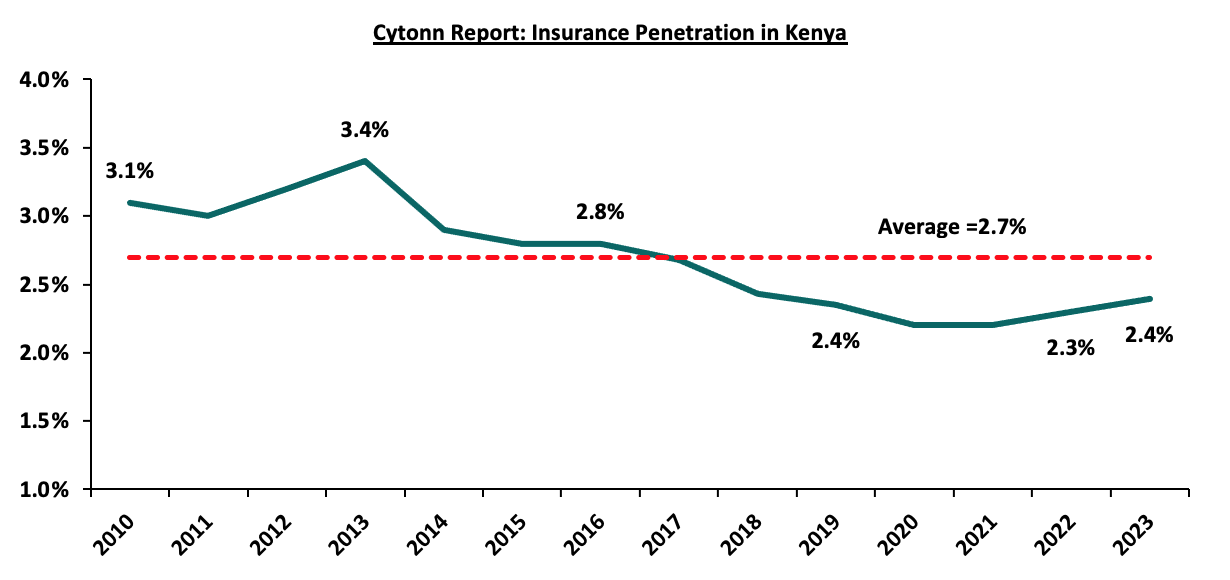
Insurance uptake in Kenya remains low compared to other key economies with the insurance penetration coming in at 2.4% as at FY’2023, according to the Q4’2023 Insurance Regulatory Authority (IRA) and the Kenya National Bureau of Statistics (KNBS) 2024 Economic Survey. The low penetration rate, which is below the global average of 6.8%, according to Swiss RE institute, is attributable to the fact that insurance uptake is still seen as a luxury and mostly taken when it is necessary or a regulatory requirement. Notably, Insurance penetration increased by 0.1% points from 2.3% recorded in 2022, showcasing the economic recovery that saw an improved business environment in the country. The chart below shows Kenya’s insurance penetration for the last 13 years:
Source: Cytonn Research
The chart below shows the insurance penetration in other economies across Africa:
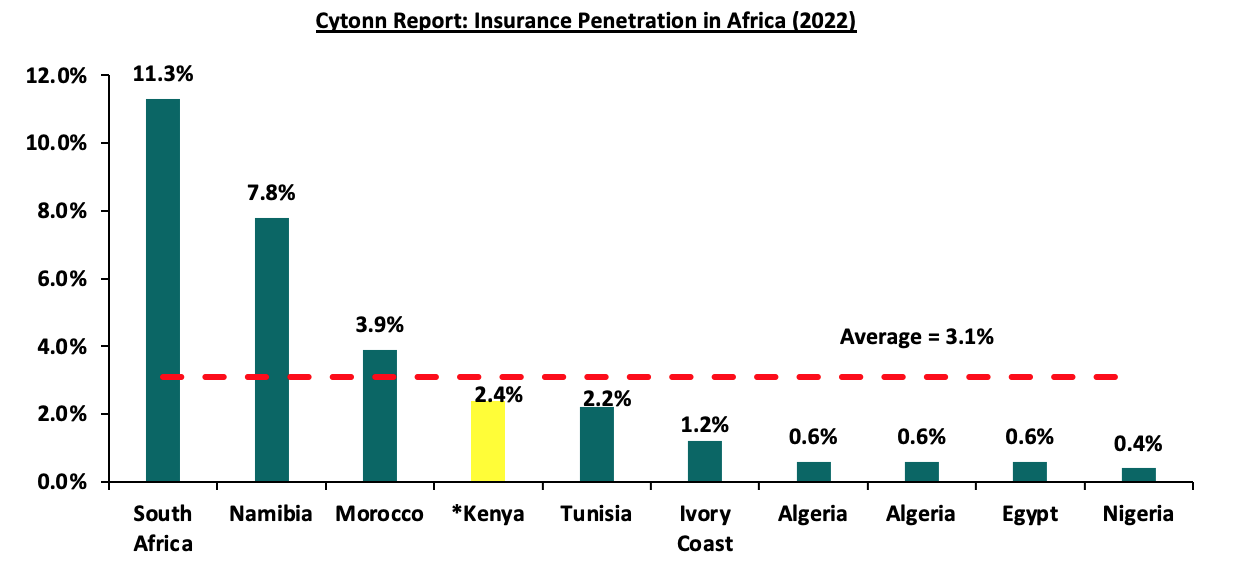
*Data as of 2023
Source: Swiss Re, GCR Research, KNBS
Insurance penetration in Africa has remained relatively low, averaging 3.1% in 2022, mainly attributable to lower disposable income in the continent and slow growth of alternative distribution channels such as mobile phones to ensure wider reach of insurance products to the masses. South Africa remains the leader in insurance penetration in the continent, owing to a mature and highly competitive market, coupled with strong institutions and a sound regulatory environment.
Section II: Key Themes that Shaped the Insurance Sector in FY’2023
In FY’2023, the country witnessed a tough economic environment occasioned by elevated inflationary pressures with the average inflation rate increasing to 7.7% from 7.6% recorded in 2022. On the other hand, the overall GDP growth rate increased to 5.6% in 2023, from 4.9% recorded in 2022 according to the Central bank of Kenya. However, according to the Q4’2023 Insurance Regulatory Authority Insurance industry report, the insurance sector showcased resilience recording a 16.7% growth in gross premium to Kshs 361.4 bn in FY’2023, from Kshs 309.8 bn in FY’2022. Insurance claims also increased by 13.3% to Kshs 94.0 bn in FY’2023, from Kshs 82.9 bn in FY’2022 and this was higher than the 2.4% growth recorded in FY’2022.
Notably, the general insurance business contributed 52.9% of the industry’s premium income compared to 47.1% contribution by long term insurance business. During the period, the long term business premiums increased by 20.7% to Kshs 170.0 bn, from Kshs 140.8 bn in FY’2022 while the general business premiums grew by 13.3% to Kshs 191.3 bn, from Kshs 168.9 bn in FY’2022. Additionally, motor insurance and medical insurance classes of insurance accounted for 63.5% of the gross premium income under the general insurance business, compared to 64.4% recorded in FY’2022. As for long-term insurance business, the major contributors to gross premiums were deposit administration and life assurance classes accounting for 59.8% in FY’2023, compared to the 61.1% contribution by the two classes in FY’2022.
The NASI index declined by 27.7% in FY’2023, from a 23.7% gain recorded in FY’2022, leading to the deterioration of the insurance sector’s bottom line as a result of fair value losses in the equities investments. As such, the sector’s allocation quoted continue to reduce, with the proportion of quoted equities to total industry assets declining to 2.0% in FY’2023, from 2.8% in FY’2022.
Key highlights from the industry performance:
- Convenience and efficiency through adoption of alternative channels for both distribution and premium collection such as Bancassurance and improved agency networks,
- Advancement in technology and innovation making it possible to make premium payments and through mobile phones,
- Continued recovery from the ripple effects of the pandemic witnessed in 2020 that saw both individuals and businesses seek insurance uptake to cover for their activities, leading to growth in gross premiums which increased by 16.7% to Kshs 361.4 bn in FY’2023, from Kshs 309.8 bn in FY’2022 and,
- The sector’s investments income increased by 17.4% to Kshs 69.7 bn in FY’2023, from Kshs 59.3 bn in FY’2022, mainly attributable to the 28.1% increase in investment income in the general insurance business to Kshs 15.0 bn, from Kshs 11.7 bn in FY’2022, coupled with a 14.8% increase in the investment income in the long-term to Kshs 54.7 bn, from Kshs 47.6 bn in FY’2022.
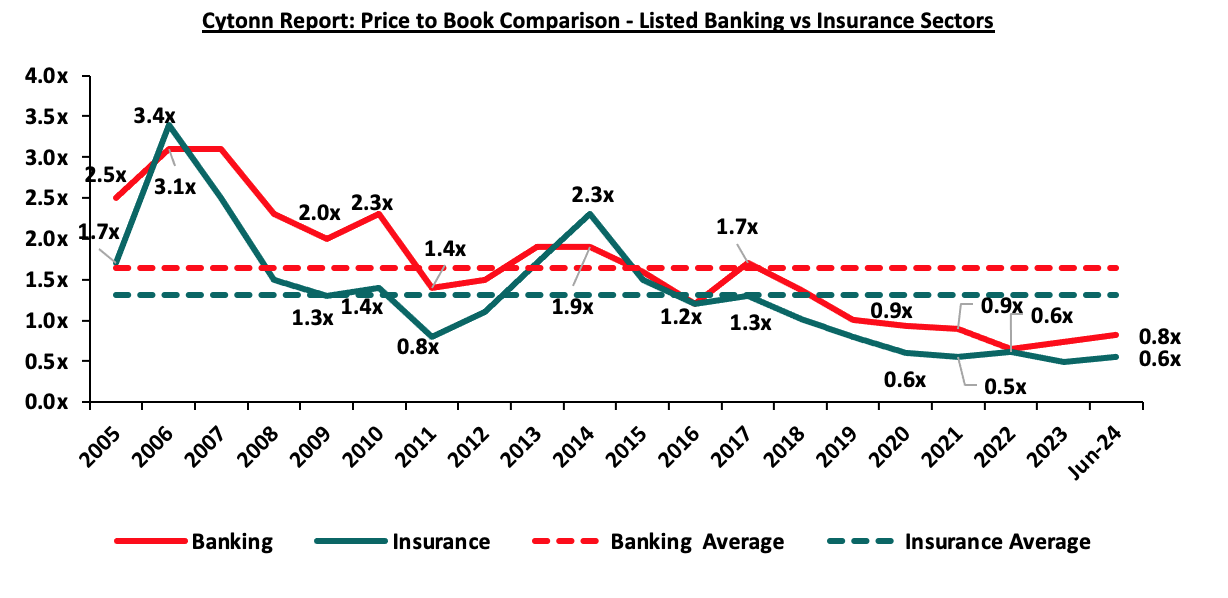
On valuations, listed insurance companies are trading at a price to book (P/Bv) of 0.6x, lower than listed banks at 0.8x, but both are lower than their 16-year historical averages of 1.3x and 1.6x, for the insurance and banking sectors respectively. These two sectors are attractive for long-term investors supported by the strong economic fundamentals. The chart below shows the price to book comparison for Listed Banking and Insurance Sectors:
The key themes that have continued to drive the insurance sector include:
- Technology and Innovation
Although the industry has been slow in adopting digital trends, the onset of the COVID-19 pandemic in 2020 saw the adoption of digital distribution of insurance products as a matter of necessity. Consequently, majority of insurance companies continue to take advantage of the available digital channels to drive growth and increase insurance penetration in the country. In January 2023, the Association of Kenyan Insurers (AKI) announced that they had launched a website to help consumers learn more about insurance. This website is part of the various initiatives the Association and other players in the industry including the Insurance Regulatory Authority (IRA) are undertaking to increase knowledge and understanding of insurance so that consumers can make informed choices. Consumers often term insurance as difficult and complex to understand. This sentiment has been established through various studies carried out to establish reasons for low uptake of insurance, the latest being the 2021 FinAccess Survey. The survey found that there has been growth of insurance understanding with only 14.3% citing lack of understanding in 2021 compared to 40.9% in 2016.
- Regulation
To ensure that the sector benefits from a globally competitive financial services sector, the regulator has been working through regulation implementations to address some of the perennial, as well as emerging problems in the sector. The COVID-19 environment proved challenging especially on the regulatory front, as it was a balance between remaining prudent as an underwriter and adhering to the set regulations given the negative effects the pandemic. Regulations used for the insurance sector in Kenya include the Insurance Act Cap 487 and its accompanying schedule and regulations, Retirement Benefits Act Cap 197 and The Companies Act. In FY’2023, regulation remained a key aspect affecting the insurance sector and the key themes in the regulatory environment include;
- IFRS 17- IFRS 9, Financial Instruments was replaced with IFRS 17. The standard establishes the principle for recognition, measurement, presentation and disclosure of insurance contracts with the objective of ensuring insurance companies provide relevant information that faithfully represents the contracts. However, as a way to protect the insurance industry from the negative effects of the pandemic the International Accounting Standards Board (IASB), the international body responsible for setting up financial reporting standards deferred its implementation effective from January 2023 or earlier. The standard, having replaced IFRS 4, is expected to give better information on profitability by providing more insights about current and future profitability of insurance contracts. Separation of financial and insurance results in the income statement will allow for better analysis of core performance for the entities and allow for better comparability of insurance companies, and,
- Risk Based Supervision - IRA has been implementing risk-based supervision through guidelines that require insurers to maintain a capital adequacy ratio of at least 200.0% of the minimum capital by 2020. The regulation requires insurers to monitor the capital adequacy and solvency margins on a quarterly basis, with the main objective being to safeguard the insurer’s ability to continue as a going concern and provide shareholders with adequate returns. We expect more mergers within the industry as smaller companies struggle to meet the minimum capital adequacy ratios. We also expect insurance companies to adopt prudential practices in managing and taking on risk and reduction of premium undercutting in the industry as insurers will now have to price risk appropriately.
- Capital Raising and share purchase
The move to a risk based capital adequacy framework presented opportunities for capital raising initiatives mostly by the small players in the sector to shore up their capital and meet compliance measures. With the new capital adequacy assessment framework, capital is likely to be critical to ensuring stability and solvency of the sector to ensure the businesses are a going concern. In May 2022, Sanlam Limited, a South African financial services group listed on the Johannesburg Stock Exchange, announced that it had entered into a definitive Joint Venture agreement for a term of 10 years with Allianz SE, with the aim to leverage on the two entities footprints in Africa and create a leading Pan-African financial services group, with an estimated equity value of Kshs 243.7 bn. Key to note, Sanlam Limited, indirectly owns 100.0% in Hubris Holdings Limited, which is the majority shareholder in Sanlam Kenya Plc, a listed insurance and financial services entity on the Nairobi Stock Exchange. The initial shareholding split of the Joint Venture was announced to be 60:40, Sanlam Limited to Allianz respectively, with the effective date of the proposed transaction being within 12-15 months of the announcement, subject to relevant approvals. However, given the length of the Agreement we expect that the Joint Venture will provide for Sanlam Kenya Plc, Allianz General Insurance Kenya and Jubilee General Insurance (which Allianz owns the majority stake in – 66.0%), to combine operations to grow their market share, asset base and bottom lines.
Section III: Industry Highlights and Challenges
The insurance industry has experienced steady growth over the last decade, as a result, we anticipate sustained moderate growth on the back of an improving economy and subsequent rise in insurance premiums, which will strengthen the sector's ability to sustain profitability.
In FY’2023, the Insurance Regulatory Authority (IRA) accepted 4 new or repackaged insurance products filed by various insurance companies in accordance with their duty of regulating and supporting the development of the insurance sector. In the new products, three were general insurance products of medical and motor covers, with one an investment product in education.
In addition, in September 2023, the Retirement Benefits Authority (RBA) approved seventeen Life Insurance Companies to receive NSSF Tier 2 contributions. This approval follows the implementation of the National Social Security Fund (NSSF) Act, 2013. The objective of this Act is to review and enhance the minimum rate of contributions that will guarantee better accumulation of funds and thus better benefits at retirement.
Industry Challenges:
- Insurance fraud: Insurance Fraud is an intentional deceit performed by an applicant or policyholder for financial advantage. In recent years, there has been an upsurge in fraudulent claims, particularly in medical and motor insurance, with estimates indicating that one in every five medical claims are fraudulent. This is mainly through exaggerating medical costs and hospitals by making patients undergo unnecessary tests. In FY’2023, 56 fraud instances were reported, with fraudulent motor accident injury claims accounting for 21.4% of the total. Fraudsters also collude with hospitals to make false claims, fake surgeries and treatments, while health-care providers overcharge insured patients. To combat fraud, the sector has adopted the usage of block chain and artificial intelligence,
- IFRS Reporting: With the new system of financial reporting being effected for the Fy’2023 reporting, insurance companies experienced challenges adhering and adapting to the new rules, with some, e.g. Jubilee Holdings, having to postpone the release of their results because of this. Additional training and personnel hiring costs were also incurred by the companies,
- High loss ratios: Core insurance business performance has been dwindling, mainly attributable to the high loss ratios. In FY’2023, loss ratios under the long-term insurance business increased by 22.2% to 3.1 bn, from 2.6 recorded in FY’2022, mainly attributable to 10.9% increase in claims to Kshs 86.1 bn, from Kshs 77.6 bn in FY’2022, that outpaced the 12.4% increase in net premiums to Kshs 128.8 bn, from Kshs 114.6 bn in FY’2022. However, the loss ratios under the general insurance business remained relatively unchanged from the 67.9% recorded in FY’2022,
- Declining consumer confidence in the insurance industry: In FY2023, IRA received 440 complaints from policyholders and beneficiaries lodged against insurers. The general insurance accounting for majority of the complaints at 77.5%, while long-term insurers recording 22.5%. The complaints range from insurance companies failing to settle claims and constant haggling over terms of insurance,
- High Market competition: Despite low insurance penetration in the country, the sector is served by 57 insurance companies offering the same products. Some insurers have resorted to shady tactics in the fight for market dominance, such as premium undercutting, which is involves offering clients implausibly low premiums in order to gain competitive advantage and protect their market share. This is a significant factor in the industry's underwriting losses. Plans to hire a consultant to review industry pricing in March 2021 were retaliated against by the regulator, but the plans are still in the works. However, this is against a background of weak insurance uptake, which could be made worse by higher premium prices. Industry participants have debated pricing, and,
- Regulation compliance: Due to laws on capital requirements, smaller insurance businesses have found it challenging to operate without raising capital or combining to expand their capital base. Additionally, the implementation of IFRS 17, are expensive since accounting and actuarial systems need to be updated and realigned.
Section IV: Performance of the Listed Insurance Sector in FY’2023
The table below highlights the performance of the listed insurance sector, showing the performance using several metrics, and the key take-outs of the performance.
|
Cytonn Report: Listed Insurance Companies FY’2023 Earnings and Growth Metrics |
||||||||
|
Insurance |
Core EPS Growth |
Net Premium growth |
Claims growth |
Loss Ratio |
Expense Ratio |
Combined Ratio |
ROaE |
ROaA |
|
Britam |
97.5% |
61.5% |
155.1% |
73.7% |
243.7% |
317.4% |
7.7% |
1.0% |
|
Liberty |
190.5% |
148.6% |
42.0% |
63.2% |
35.3% |
98.5% |
7.4% |
1.6% |
|
CIC |
817.6% |
22.5% |
118.0% |
88.8% |
112.7% |
201.5% |
18.9% |
2.9% |
|
Jubilee |
(19.8%) |
(52.2%) |
21.9% |
95.8% |
237.9% |
333.8% |
8.9% |
2.5% |
|
Sanlam |
(124.0%) |
803.9% |
(46.5%) |
72.8% |
88.1% |
160.9% |
(15.0%) |
(0.4%) |
|
*FY'2023 Weighted Average |
116.0% |
41.4% |
83.3% |
83.8% |
203.1% |
287.0% |
4.9% |
1.8% |
|
**FY'2022 Weighted Average |
377.4% |
1.6% |
1.9% |
88.1% |
52.5% |
140.6% |
7.0% |
2.2% |
|
*Market cap weighted as at 21/06/2024 |
|
|||||||
|
**Market cap weighted as at 09/06/2023 |
|
|||||||
The key take-outs from the above table include;
- Core EPS growth recorded a weighted growth of 116.0%, compared to a weighted growth of 377.4%, in FY’2022. The sustained growth in earnings was attributable to increased premiums during the period following continued recovery by the sector from the impacts of the COVID-19 pandemic, coupled with higher yields from government papers,
- The premiums grew at a significantly quicker pace of 41.4% in FY’2023, compared to a growth of 1.6% in FY’2022, while claims also grew at a higher rate of 83.3% in FY’2023, from the 1.9% recorded in FY’2022 on a weighted average basis,
- The loss ratio across the sector decreased to 83.8% in FY’2023 from 88.1% in FY’2022,
- The expense ratio increased significantly to 203.1% in FY’2023, from 52.5% in FY’2022, owing to an increase in operating expenses, a sign of decreased efficiency,
- The insurance core business still remains unprofitable, with a combined ratio of 287.0% as at FY’2023, compared to 140.6% in FY’2022, and,
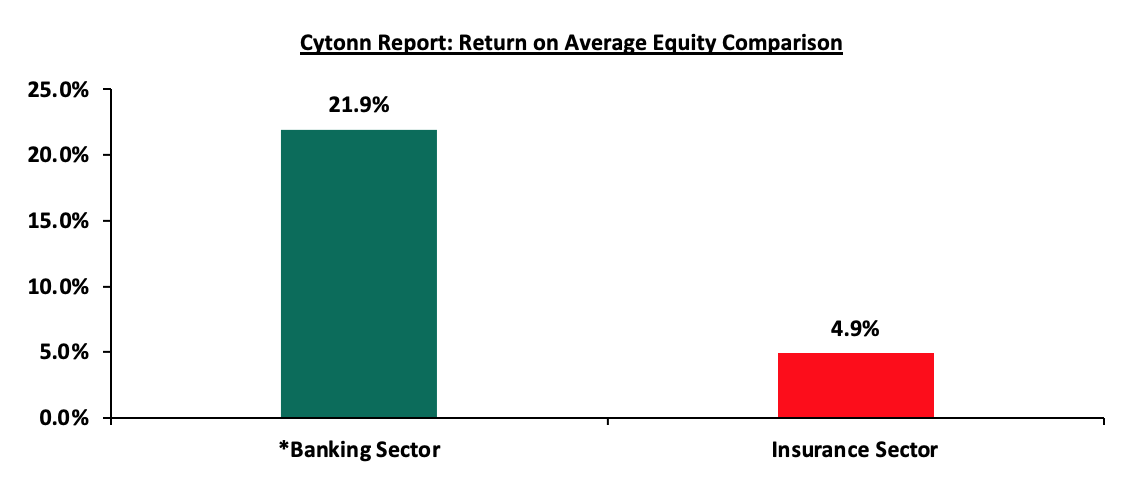
- On average, the insurance sector delivered a Return on Average Equity (ROaE) of 4.9%, a decrease from a weighted Return on Average Equity of 7.0% in FY’2022. The chart below shows a comparison between the insurance and banking sector return on average equity;
*Data as of Q1’2024
Source: Cytonn Research
Based on the Cytonn FY’2023 Insurance Report, we ranked insurance firms from a franchise value and from a future growth opportunity perspective with the former getting a weight of 40.0% and the latter a weight of 60.0%.
For the franchise value ranking, we included the earnings and growth metrics as well as the operating metrics shown in the table below in order to carry out a comprehensive review:
|
Cytonn Report: Listed Insurance Companies FY’2022 Franchise Value Score |
|||||||
|
Insurance Co. |
Loss Ratio |
Expense Ratio |
Combined Ratio |
Return on Average Capital Employed |
Tangible Common Ratio |
Franchise Value Score |
Ranking |
|
Liberty Holdings |
63.2% |
35.3% |
98.5% |
(10.7%) |
18.2% |
14 |
1 |
|
Sanlam Kenya |
72.8% |
88.1% |
160.9% |
(13.6%) |
2.3% |
19 |
2 |
|
CIC Group |
88.8% |
112.7% |
201.5% |
19.2% |
14.6% |
20 |
3 |
|
Britam Holdings |
73.7% |
243.7% |
317.4% |
13.9% |
13.6% |
23 |
4 |
|
Jubilee Holdings |
95.8% |
237.9% |
333.8% |
9.3% |
26.9% |
29 |
5 |
|
*FY'2023 Weighted Average |
83.8% |
203.1% |
287.0% |
10.5% |
18.9% |
|
|
The Intrinsic Valuation is computed through a combination of valuation techniques, with a weighting of 40.0% on Discounted Cash-flow Methods, 35.0% on Residual Income and 25.0% on Relative Valuation. The overall FY’2022 ranking is as shown in the table below:
|
Cytonn Report: Listed Insurance Companies FY’2023 Comprehensive Ranking |
|||||
|
Bank |
Franchise Value Score |
Intrinsic Value Score |
Weighted Score |
FY'2023 Ranking |
FY'2022 Ranking |
|
Sanlam Kenya |
3 |
2 |
2.4 |
1 |
4 |
|
Jubilee Holdings |
5 |
1 |
2.6 |
2 |
1 |
|
Liberty Holdings |
1 |
4 |
2.8 |
3 |
3 |
|
CIC Group |
4 |
3 |
3.4 |
4 |
2 |
|
Britam |
2 |
5 |
3.8 |
5 |
5 |
Major Changes from the FY’2022 Ranking are;
- Sanlam Kenya improved to position 1 in FY’2023 mainly due to the strong the franchise and intrinsic scores in FY’2022, driven by net premium growth to 803.9% in FY’2023, from a decline of 11.1% in FY’2022
- Liberty Kenya Holdings maintained position 3 in FY’2023 driven by an improvement in franchise score, attributable to the improvement in the expense ratio to 35.3%, from 71.2%, taking the combined ratio to 98.5%, an improvement from the 133.1% recorded in FY’2022,
- Britam Holdings maintained position 5 in FY’2023, mainly due to declines in intrinsic scores in FY’2023, driven by the deterioration in the loss ratio to 73.7%, from 66.1% in FY’2022. However, the combined ratio improved to 110.0%, from the 137.4% in FY’2022, and,
- CIC Group declined to position 4 in FY’2022 from position 2 in FY’2022 mainly due to deterioration in both the franchise score and intrinsic value score.
Section V: Conclusion & Outlook of the Insurance Sector
The insurance industry has continued to struggle with low penetration rates, as well as a deteriorating business environment caused by rising interest rates, higher inflationary pressures and persistent currency depreciation. As a result, the level of disposable income among households has decreased. However, the sector continues to undergo transition where traditional models have been disrupted, mainly on the digital transformation, innovation and regulation front, which have positively impacted the outlook. We also expect the insurance sector to maintain the culture of innovation achieved during the pandemic period while maintaining the customer centricity as the main focus of the sector’s operating model. As a result, we believe that in order to maintain profitability, the insurance industry will need to engage in careful balancing acts. Some of these things the industry can take to grow significantly and raise penetration in the nation include:
- Partnerships and alternative distribution channels: We anticipate that underwriters will continue to form alliances and offer additional distribution channels in the future. This can be accomplished by collaborating with other financial services providers, such as fund managers who have moved into delivering insurance-linked products, in addition to the present bancassurance connection with banks. The insurance business can also use the penetration of bank products to promote their own products. Integration of mobile money payments to allow for policy payments is also predicted to continue due to the ease it provides, as well as the country's high mobile phone penetration; thus, insurance companies would wish to exploit this to improve penetration,
- Regulations - To ensure the sector's solvency and sustainability, we anticipate more regulation from the regulatory body and other international stakeholders. Insurers must modify their insurance contract recognition techniques in advance of the implementation of IFRS 17. The regulator's quest for the targeted capital adequacy levels will almost certainly result in further consolidations as insurers struggle to achieve the capital requirements, particularly for small firms. Furthermore, regulators, governments, and policymakers are working harder to make Environmental, Social, and Governance (ESG) standards a requirement in the insurance industry,
- Innovation: To aid portfolio expansion and growth, insurers must harness the digital insurance solutions at their disposal in order to improve internal efficiency and accelerate time to market. As such, we anticipate cooperation between insurers and InsurTechs. For instance, in February 2024, Britam launched BetaLab, a new insurance innovation hub, as it aims to nurture budding InsurTech and fintech startups, and fast track product development in the industry. The lab’s mission is to incubate, innovate, and accelerate startups, nurturing and empowering innovation among internal staff, while also exploring innovation opportunities with insuretechs and fintechs,
- Investment diversification - To improve earnings and reduce losses, underwriters should focus more on investment diversification through routes such as pension plans, unit trusts, fund management, and investment advisories. As indicated by rising combined ratios, insurers have suffered losses in their core business, with increases in underwriting expenditures and claims exceeding increases in premiums. In addition, we anticipate insurers will continue to investigate non-traditional asset types such as infrastructure, and,
- Insurance awareness campaigns – Low insurance penetration is significantly impacted by the persistent information gap about insurance products and their significance. Insurance is still largely assumed to be regulatory compliance rather than a necessity. The regulators, insurers, and other stakeholders should enhance insurance awareness campaigns to increase understanding of insurance products. According to a survey commissioned by the Association of Kenya Insurers (AKI), the second largest contributor to low insurance uptake at 27.0% is a lack of knowledge of the various insurance products and their benefits. As such, there is a lot of headroom for insurers to educate, repackage, and tailor their products to different potential clients.
For more information, please read out FY’2023 Listed Insurance Sector full report.
Disclaimer: The views expressed in this publication are those of the writers where particulars are not warranted. This publication is meant for general information only and is not a warranty, representation, advice or solicitation of any nature. Readers are advised in all circumstances to seek the advice of a registered investment advisor.

- Talk to us
- Kenya
- P.O Box 20695 - 00200, Nairobi, Kenya
- Cell +254709101200
- Tel +254709101200
- WhatsApp +254741676635
- United States
- +254709101200
- DOWNLOAD OUR APP
-


- Kenya
- 8th Floor, Pinetree Plaza, Kaburu Drive, Ngong Road, Nairobi, Kenya
- USA
- Suite 1150, 1775 Eye Street NW, USA, Washington DC 20006, USA
- Investments
- High Yield
- Private Equity
- Real Estate
- Real Estate
- RiverRun Estates
- Cytonn Towers
- The Ridge
- Taraji Heights
- The Alma