
Kenya FY’2025 Listed Insurance Report, &Cytonn Weekly #27/2026
By research team, Jul 12, 2026
Executive Summary
Fixed Income
During the week, T-bills were oversubscribed for the sixth consecutive week, with the overall subscription rate coming in at 177.6% higher than the subscription rate of 146.6%, recorded the previous week. Investors’ preference for the shorter 91-day paper persisted, with the paper receiving bids worth 34.8 bn against the offered Kshs 8.0 bn, translating to a subscription rate of 435.0%, lower than the subscription rate of 640.4%, recorded the previous week. The subscription rate for the 364-day paper decreased to 60.4% from 70.9% recorded the previous week, while that of the 182-day paper increased to 88.8% from 24.9% recorded the previous week. The government accepted a total of Kshs 30.5 bn worth of bids out of Kshs 49.7 bn bids received, translating to an acceptance rate of 61.4%. The yields on the government papers showed a mixed performance with the yields on the 182-day paper increasing the most by 1.0 bps to remain relatively unchanged from 9.0% previous week. The yield on the 91-day paper decreased the most by 1.0 bps to remain relatively unchanged from the 8.8% recorded the previous week, while the yield on the 364-day paper decreased by 0.3 bps to remain relatively unchanged from 9.0% recorded the previous week;
The Central Bank of Kenya released the auction results for the re-opened treasury bonds FXD1/2022/010, FXD1/2021/020 and FXD1/2026/030 with tenors to maturities of 5.8 years, 15.2 years and 29.9 years respectively and fixed coupon rates of 13.5%, 13.4% and 12.5% respectively. The bonds were oversubscribed, with the overall subscription rate coming in at 206.4%, receiving bids worth Kshs 144.5 bn against the offered Kshs 70.0 bn. The government accepted bids worth Kshs 70.6 bn, translating to an acceptance rate of 48.9%. The weighted average yield for the accepted bids for the FXD1/2026/030, FXD1/2021/020 and FXD1/2022/010 came in at 14.6%, 14.3% and 12.8% respectively. Notably, the 14.6% and 14.3% yields on FXD1/2026/030 and FXD1/2021/020 were both higher than the 13.8% and 13.7% recorded at the last reopening in April 2026 and May 2026 respectively;
Stanbic Bank released its monthly Purchasing Manager’s Index (PMI) indicating that Kenya’s Purchasing Managers’ Index (PMI) rose by 3.4 points to the neutral mark of 50.0 in June 2026 from 46.6 in May 2026, ending three consecutive months of contraction in private sector activity;
The Kenya National Bureau of Statistics (KNBS) released the Q1’2026 Quarterly Gross Domestic Product Report, highlighting that the Kenyan economy recorded a 5.3% growth in FY’2025, higher than the 4.9% growth recorded in Q1’2026;
According to the Q1’2026 Quarterly Balance of Payments Report released by the Kenya National Bureau of Statistics (KNBS), Kenya’s balance of payments position deteriorated by 128.6% in Q1’2026, to a deficit of Kshs 176.0 bn, from a deficit of Kshs 77.0 bn in Q1’2025 and the current account deficit widened by 72.7% to Kshs 120.9 bn in Q1’2026 from the Kshs 70.0 bn deficit recorded in Q1’2025;
Also, during the week, the President assented to law the Sovereign Wealth Fund Bill, 2026, following its passage by the National Assembly with amendments on 2nd July 2026, giving Kenya a legal vehicle to save part of its oil, mineral and privatization earnings and shield them from political misuse and debt repayment
Equities
During the week, the equities market was on an upward trajectory, with NASI, NSE 20, NSE 25 and NSE 10 gaining by 0.8%, 0.4%, 0.3% and 0.1% respectively, taking the YTD performance to gains of 24.9%, 24.2%, 22.4% and 22.3% for NSE 10, NSE 25, NSE 20 and NASI respectively. The week-on-week equities market performance was mainly driven by gains recorded by large cap stocks such as Safaricom, BAT and ABSA of 2.5%, 2.3% and 2.0% respectively. However, the performance was weighed down by losses recorded by large cap stocks such as EABL, NCBA and Equity of 2.0%, 1.4% and 1.1% respectively;
During the week, the banking sector index decreased marginally by 1.5 bps to remain relatively unchanged at 261.5 recorded the previous week. This is attributable to losses recorded by large cap stocks such as NCBA and Equity of 1.4% and 1.1% respectively. However, the performance was supported by gains by large cap stocks such Absa, KCB and Stanbic of 2.0%, 1.9% and 1.2% respectively;
Real Estate
During the week, the Kenya National Bureau of Statistics (KNBS) released the Quarterly Gross Domestic Product Report that outlined the performance of various sectors to the GDP;
During the week, the Kenya Railways Corporation (KRC) announced plans to extend the Standard Gauge Railway (SGR) by 15 kilometers from the Syokimau passenger terminus to Nairobi Central Station, closing the long-standing last-mile connectivity gap between the SGR and the Nairobi Central Business District (CBD);
During the week, Kenya Airways (KQ) secured a second landing slot at Dubai International Airport, enabling the national carrier to introduce a second daily flight between Nairobi and Dubai from September 1st 2026. The additional frequency follows growing passenger demand on the route and is expected to significantly increase KQ's passenger carrying capacity while enhancing connectivity between Kenya and one of the world's busiest international aviation hubs. The move also comes amid increased competition on the Nairobi–Dubai route following Emirates' introduction of a third daily service;
On the Unquoted Securities Platform Acorn D-REIT and I-REIT traded at Kshs 29.6 and Kshs 23.8 per unit, respectively, as per the last updated data on 5th June 2026. The performance represented a 48.0% and 18.8% gain for the D-REIT and I-REIT, respectively, from the Kshs 20.0 inception price. Additionally, ILAM Fahari I-REIT traded at Kshs 13.8 per share as of 5th June 2026, representing a 31.0% loss from the Kshs 20.0 inception price;
Digital Payments
During the week, Visa Inc. rolled out an upgraded suite of digital payment tools across its Visa Accept and Visa Direct platforms, transforming standard smartphones into full-stack point-of-sale infrastructure for small businesses. The solution allows merchants to securely accept contactless card payments directly on a mobile device while utilizing real-time payout capabilities to instantly distribute employee wages, supplier payments, and cross-border remittances without additional hardware;
During the week, Mastercard Inc announced that it will release its second quarter 2026 financial results on Thursday, July 30, 2026, followed by a live conference call to discuss its latest performance metrics with the investment community. The announcement comes at a crucial time as the company's stock experienced short-term technical pressure, slipping slightly below its long-term 200-day simple moving average despite posting strong underlying business fundamentals and a projected full-year earnings growth of 15.3%;
During the week, Circle Internet Group made a major cross-border expansion move by securing a strategic investment in African payments giant Flutterwave through its corporate venture arm, Circle Ventures. The partnership aims to integrate Circle’s USD Coin (USDC) settlement directly into Flutterwave’s payment infrastructure, allowing businesses across the continent to collect payments in local African currencies and settle them instantly in digital stable coins outside traditional banking hours;
The digital payment stocks we track (AXP, Visa, Mastercard, Circle, Block and Paypal) are currently trading at an average P/E of 19.1x, implying that investors are pricing in strong future earnings growth expectations and are willing to pay a significant premium for current earnings, which may also suggest that valuations may be stretched relative to near-term fundamentals;
Focus of the Week
Following the release of the FY’2025 results by Kenyan insurance firms, the Cytonn Financial Services Research Team undertook an analysis on the financial performance of the listed insurance companies and the key factors that drove the performance of the sector. In this report, we assess the main trends in the sector, and areas that will be crucial for growth and stability going forward, seeking to give a view on which insurance firms are the most attractive and stable for investment.
Investment Updates:
-
Weekly Rates: Cytonn Money Market Fund closed the week at a yield of 11.69% p.a. To invest, dial *809# or download the Cytonn App from Google Play store here or from the Appstore here;
-
We continue to offer Wealth Management Training every Tuesday, from 7:00 pm to 8:00 pm. The training aims to grow financial literacy among the general public. To register for any of our Wealth Management Trainings, click here. If interested in our Private Wealth Management Training for your employees or investment group, please get in touch with us through wmt@cytonn.com;
-
Cytonn Insurance Agency acts as an intermediary for those looking to secure their assets and loved ones’ future through insurance namely; Motor, Medical, Life, Property, WIBA, Credit and Fire and Burglary insurance covers. For assistance, get in touch with us through insuranceagency@cytonn.com;
-
Cytonn Asset Managers Limited (CAML) continues to offer pension products to meet the needs of both individual clients who want to save for their retirement during their working years and Institutional clients that want to contribute on behalf of their employees to help them build their retirement pot. To more about our pension schemes, kindly get in touch with us through pensions@cytonn.com;
Hospitality Updates:
-
We currently have promotions for Staycations. Visit cysuites.com/offers for details or email us at sales@cysuites.com;
Money Markets, T-Bills Primary Auction:
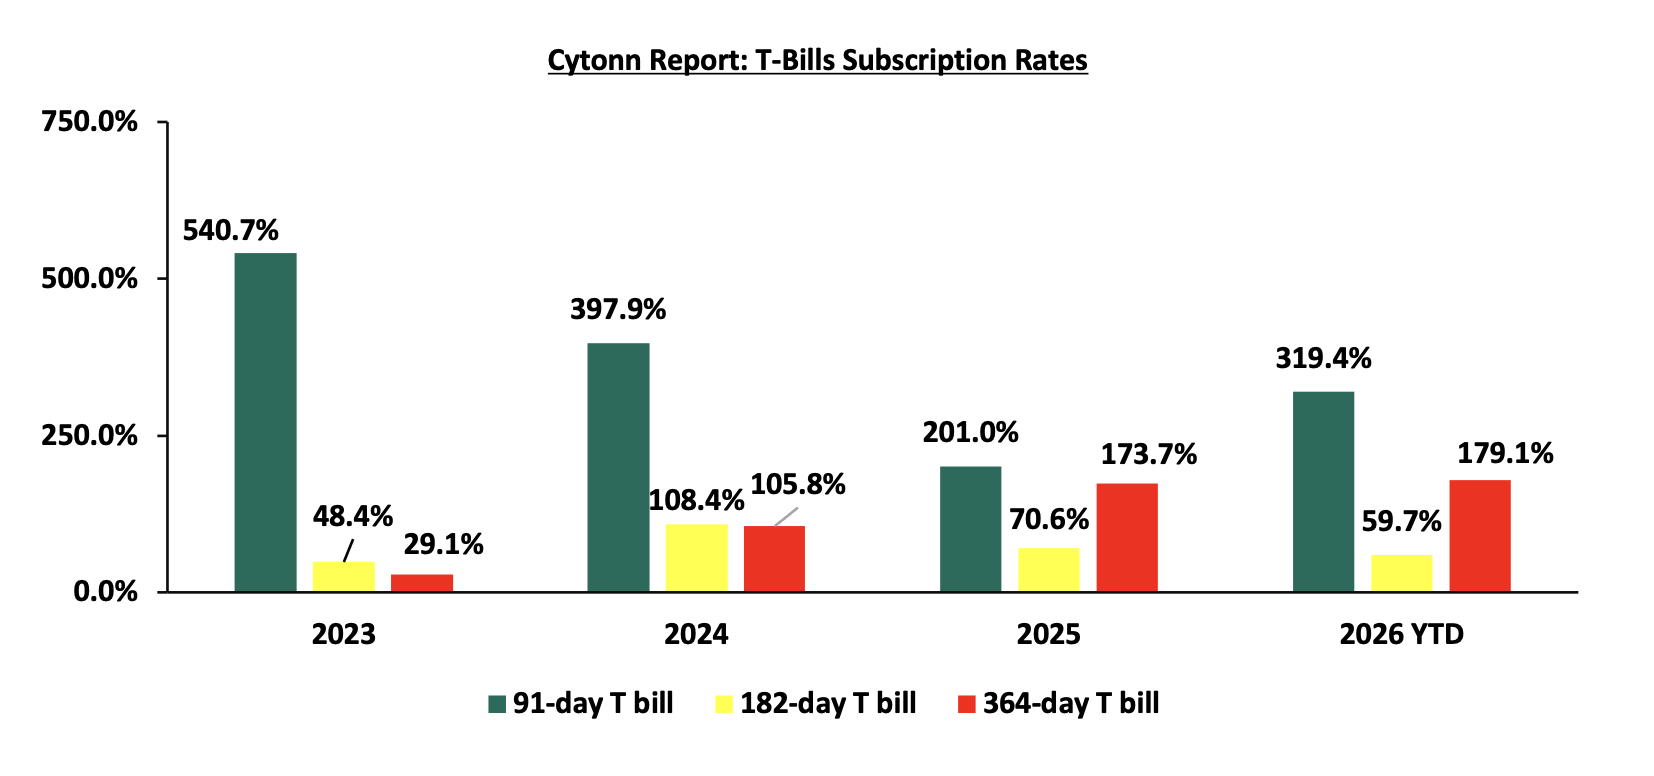
During the week, T-bills were oversubscribed for the sixth consecutive week, with the overall subscription rate coming in at 177.6% higher than the subscription rate of 146.6%, recorded the previous week.
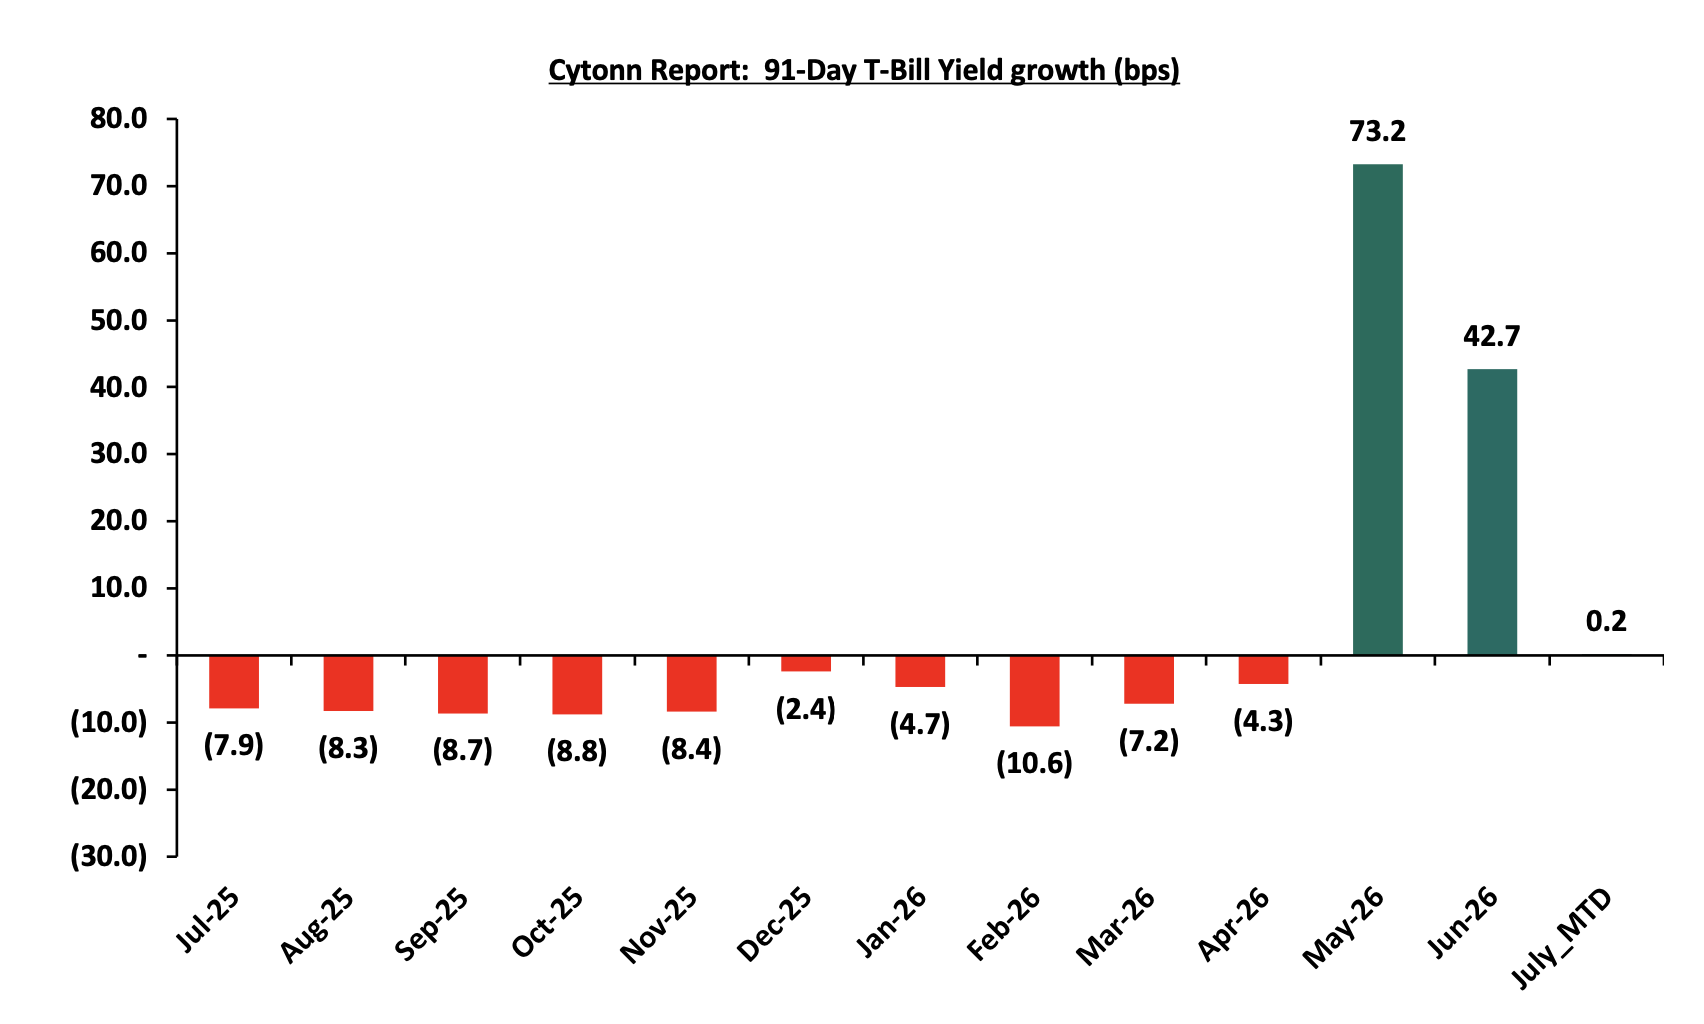
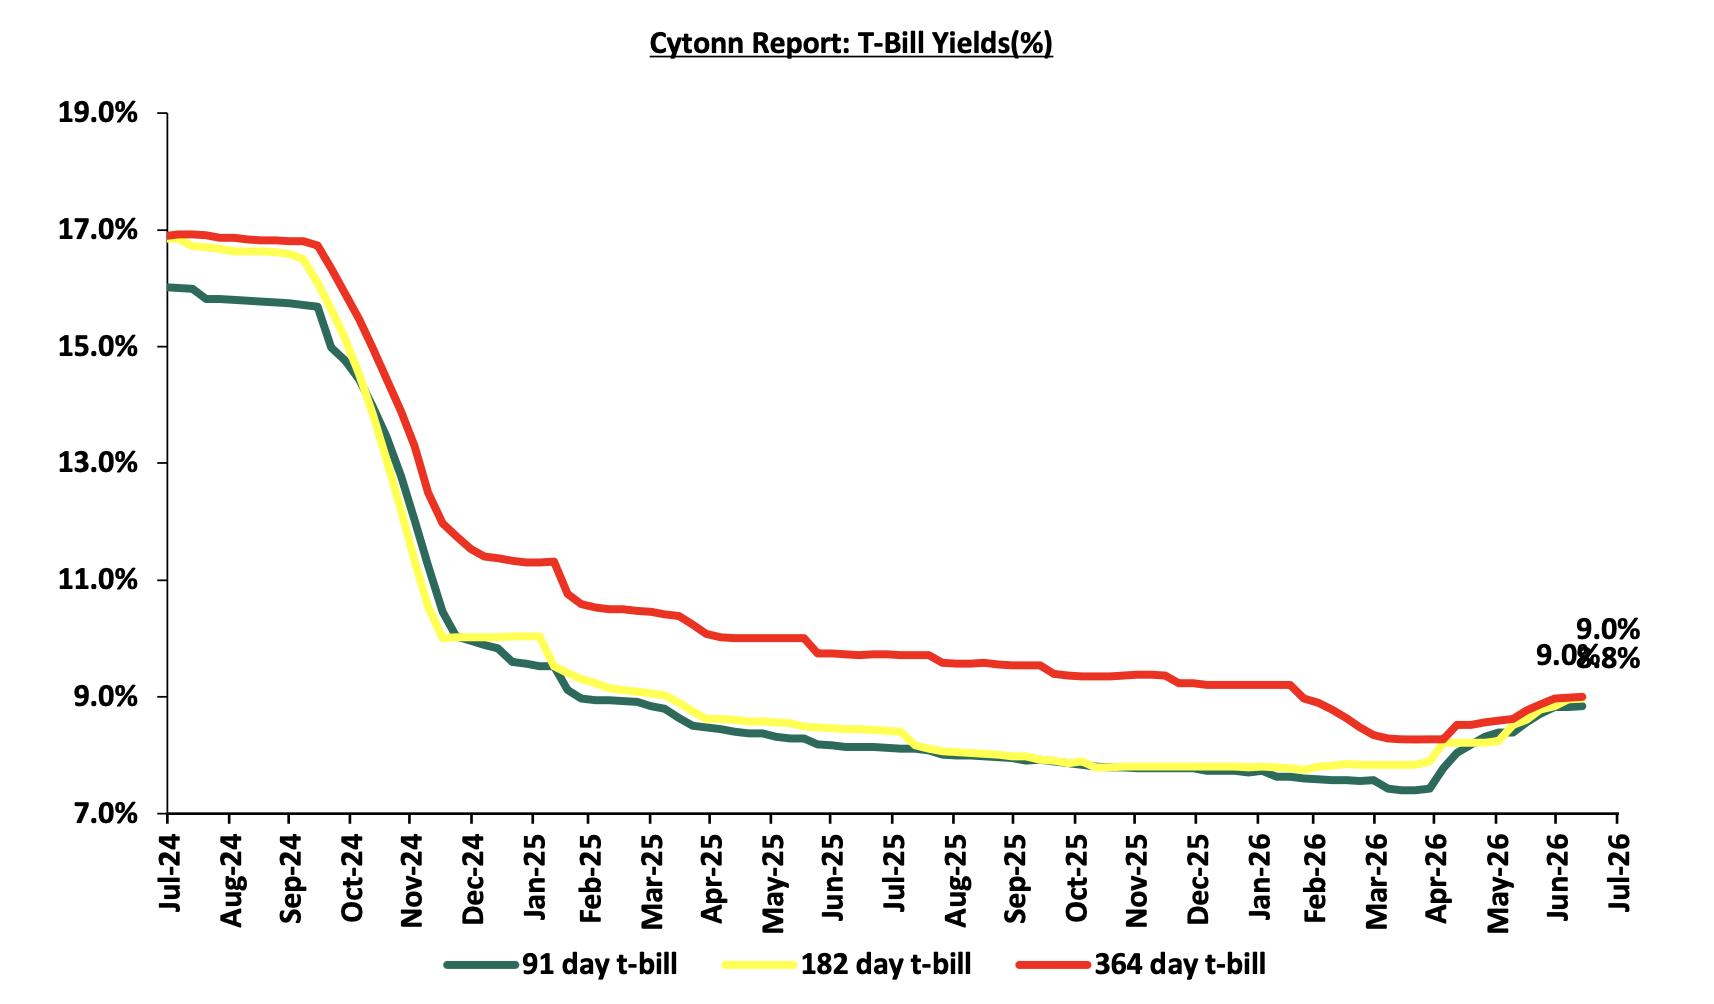
Investors’ preference for the shorter 91-day paper persisted, with the paper receiving bids worth 34.8 bn against the offered Kshs 8.0 bn, translating to a subscription rate of 435.0%, lower than the subscription rate of 640.4%, recorded the previous week. The subscription rate for the 364-day paper decreased to 60.4% from 70.9% recorded the previous week, while that of the 182-day paper increased to 88.8% from 24.9% recorded the previous week. The government accepted a total of Kshs 30.5 bn worth of bids out of Kshs 49.7 bn bids received, translating to an acceptance rate of 61.4%. The yields on the government papers showed a mixed performance with the yields on the 182-day paper increasing the most by 1.0 bps to remain relatively unchanged from 9.0% previous week. The yield on the 91-day paper decreased the most by 1.0 bps to remain relatively unchanged from the 8.8% recorded the previous week, while the yield on the 364-day paper decreased by 0.3 bps to remain relatively unchanged from 9.0% recorded the previous week.
The chart below shows the yield growth rate for the 91-day paper from July 2025 to date:
The chart below shows the performance of the 91-day, 182-day and 364-day papers from July 2024 to July 2026:
The chart below compares the overall average T-bill subscription rates obtained in 2023, 2024, 2025 and 2026 Year-to-date (YTD):
T-Bonds Primary Auction:
The Central Bank of Kenya released the auction results for the re-opened treasury bonds FXD1/2022/010, FXD1/2021/020 and FXD1/2026/030 with tenors to maturities of 5.8 years, 15.2 years and 29.9 years respectively and fixed coupon rates of 13.5%, 13.4% and 12.5% respectively. The bonds were oversubscribed, with the overall subscription rate coming in at 206.4%, receiving bids worth Kshs 144.5 bn against the offered Kshs 70.0 bn. The government accepted bids worth Kshs 70.6 bn, translating to an acceptance rate of 48.9%. The weighted average yield for the accepted bids for the FXD1/2026/030, FXD1/2021/020 and FXD1/2022/010 came in at 14.6%, 14.3% and 12.8% respectively. Notably, the 14.6% and 14.3% yields on FXD1/2026/030 and FXD1/2021/020 were both higher than the 13.8% and 13.7% recorded at the last reopening in April 2026 and May 2026 respectively. However, the 12.8% yield on the FXD1/2022/010 was lower than the 13.9% recorded in September 2022. Given the 10.0% withholding tax on the bonds, the tax equivalent yields for shorter term bonds with 15.0% withholding tax are 13.2% for the FXD1/2026/030, 14.2% for the FXD1/2021/020 and 14.3% for the FXD1/2022/010.
Money Market Performance:
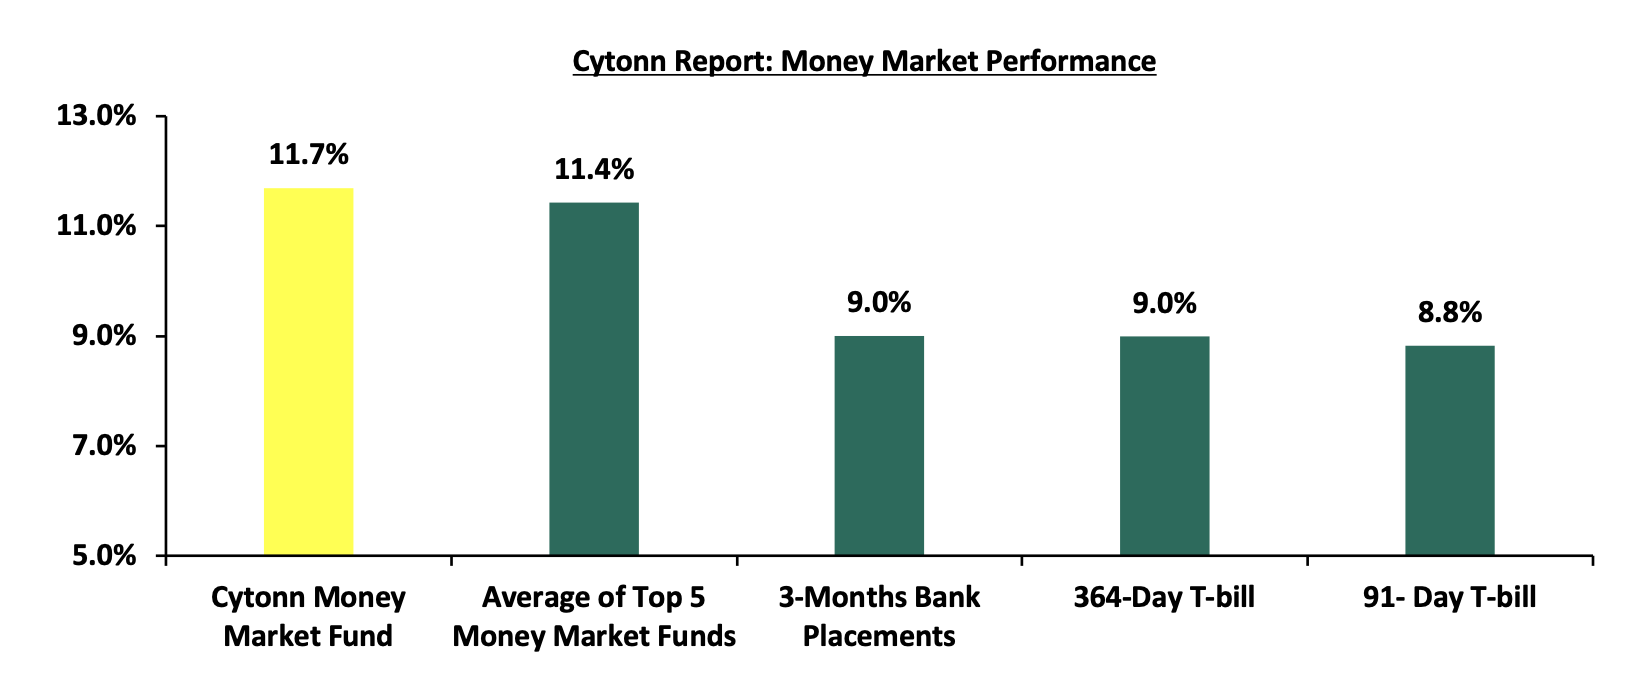
In the money markets, 3-month bank placements ended the week at 9.0% (based on rates offered by various banks). The yield on the 91-day paper decreased by 1.0 bps to remain relatively unchanged from the 8.8% recorded the previous week, while the yield on the 364-day paper decreased by 0.3 bps to remain relatively unchanged from 9.0% recorded the previous week. The yield on the Cytonn Money Market Fund remained relatively unchanged from the 11.7% recorded the previous week, while the average yields on the Top 5 Money Market Funds decreased by 5.2 bps to 11.4% from 11.5% recorded the previous week.
The table below shows the Money Market Fund Yields for Kenyan Fund Managers as published on 10th July 2026:
|
Money Market Fund Yield for Fund Managers as published on 10th July 2026 |
||
|
Rank |
Fund Manager |
Effective Annual Rate |
|
1 |
Nabo Africa Money Market Fund |
13.8% |
|
2 |
Cytonn Money Market Fund ( Dial *809# or download Cytonn App) |
11.7% |
|
3 |
Lofty-Corban Money Market Fund |
10.6% |
|
4 |
Enwealth Money Market Fund |
10.6% |
|
5 |
Etica Money Market Fund |
10.5% |
|
6 |
Ndovu Money Market Fund |
10.5% |
|
7 |
Kuza Money Market fund |
10.4% |
|
8 |
Faulu Money Market Fund |
10.2% |
|
9 |
Jubilee Money Market Fund |
10.1% |
|
10 |
Old Mutual Money Market Fund |
10.1% |
|
11 |
Gulfcap Money Market Fund |
10.1% |
|
12 |
Madison Money Market Fund |
10.1% |
|
13 |
Orient Kasha Money Market Fund |
10.0% |
|
14 |
Arvocap Money Market Fund |
9.9% |
|
15 |
British-American Money Market Fund |
9.8% |
|
16 |
GenAfrica Money Market Fund |
9.5% |
|
17 |
KCB Money Market Fund |
9.4% |
|
18 |
Apollo Money Market Fund |
9.2% |
|
19 |
SanlamAllianz Money Market Fund |
8.8% |
|
20 |
Dry Associates Money Market Fund |
8.7% |
|
21 |
CIC Money Market Fund |
8.4% |
|
22 |
CPF Money Market Fund |
8.3% |
|
23 |
ICEA Lion Money Market Fund |
8.0% |
|
24 |
Mali Money Market Fund |
8.0% |
|
25 |
Co-op Money Market Fund |
7.9% |
|
26 |
Mayfair Money Market Fund |
7.9% |
|
27 |
Genghis Money Market Fund |
7.8% |
|
28 |
Absa Shilling Money Market Fund |
7.2% |
|
29 |
Ziidi Money Market Fund |
6.0% |
|
30 |
AA Kenya Shillings Fund |
5.2% |
|
31 |
Stanbic Money Market Fund |
5.2% |
|
32 |
Equity Money Market Fund |
|
Source: Business Daily
Liquidity:
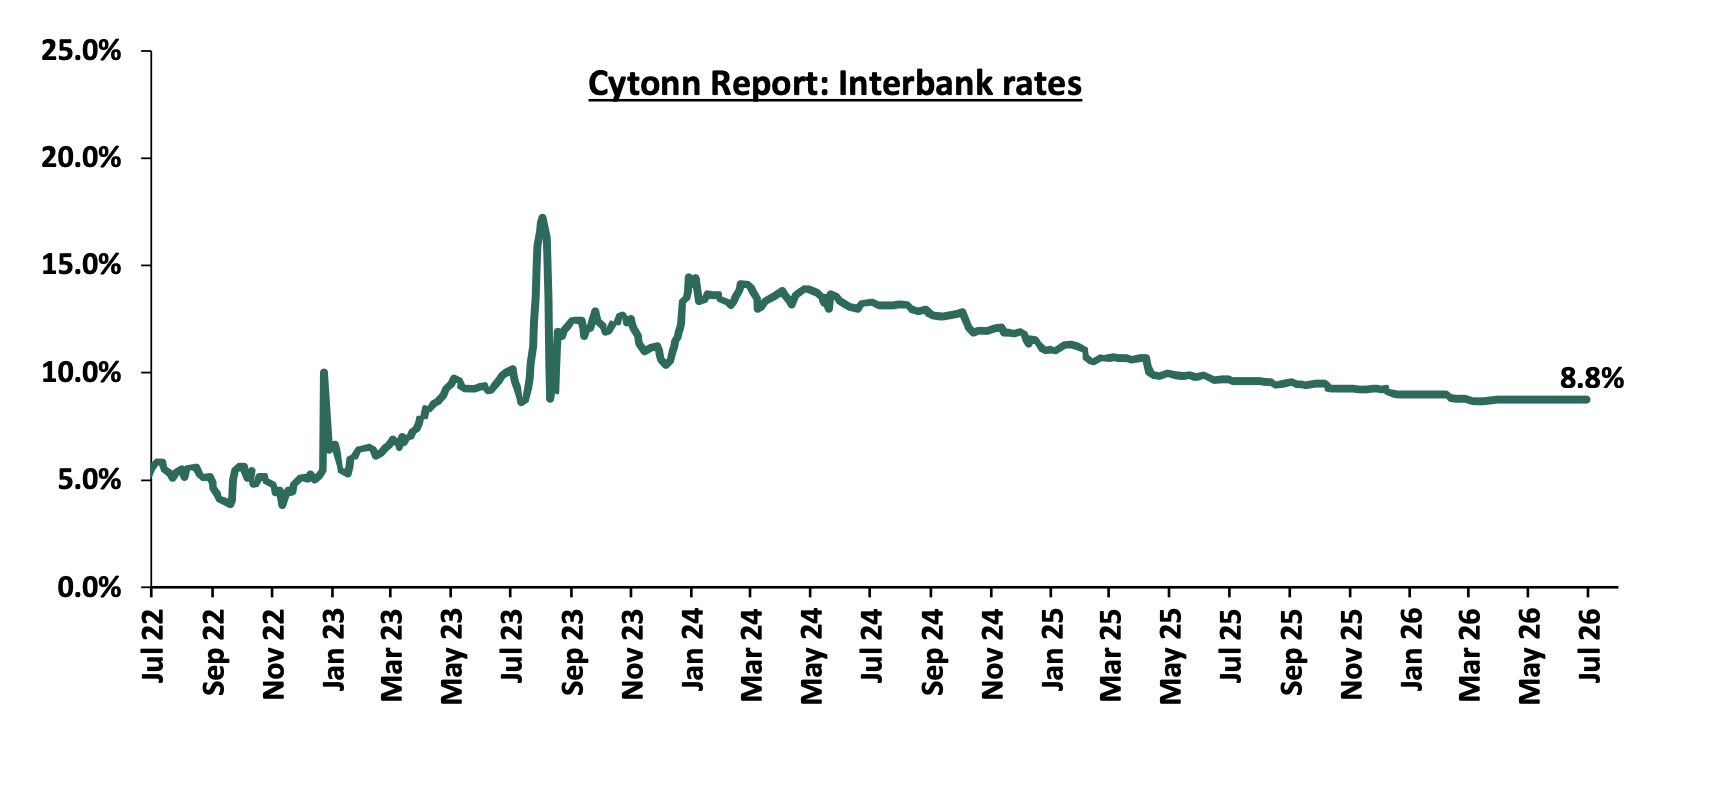
During the week, liquidity in the money markets eased with the average interbank rate decreasing marginally by 0.2 bps to remain relatively unchanged from 8.8% recorded last week, partly attributable to tax remittances that offset government payments. The average interbank volumes traded decreased by 51.7% to Kshs 4.2 bn from Kshs 8.8 bn recorded the previous week. The chart below shows the interbank rates in the market over the years:
Kenya Eurobonds:
During the week, the yields on the Eurobonds were on an upward trajectory with the yield on the 13-year Eurobond issued in 2019, increasing the most by 76.1 bps to 8.8% from 8.0% recorded the previous week. The table below shows the summary performance of the Kenyan Eurobonds as of 9th July 2026
-
Cytonn Report: Kenya Eurobonds Performance
2018
2019
2021
2024
Tenor
10-year issue
30-year issue
12-year issue
13-year issue
7-year issue
Amount Issued (USD)
1.0 bn
1.0 bn
1.0 bn
1.5 bn
1.5 bn
Years to Maturity
2.5
22.5
8.8
5.5
10.5
Yields at Issue
7.3%
8.3%
6.2%
10.4%
9.9%
02-Jan-26
6.1%
8.8%
7.2%
7.8%
7.1%
02-Jul-26
6.8%
8.8%
7.6%
8.0%
7.1%
03-Jul-26
7.1%
8.7%
8.0%
8.8%
7.6%
06-Jul-26
7.1%
8.7%
7.9%
8.7%
7.5%
07-Jul-26
7.2%
8.7%
8.0%
8.7%
7.6%
08-Jul-26
7.5%
8.7%
8.2%
8.8%
7.8%
09-Jul-26
7.4%
8.8%
8.1%
8.8%
7.7%
Weekly Change
0.6%
0.0%
0.6%
0.8%
0.6%
MTD Change
0.1%
(0.0%)
0.1%
0.1%
0.1%
YTD Change
1.3%
(0.1%)
1.0%
1.0%
0.6%
Source: Central Bank of Kenya (CBK) and National Treasury
Kenya Shilling:
During the week, the Kenya Shilling appreciated against the US Dollar by 1.5 bps to remain relatively unchanged from Kshs 129.2 recorded the previous week. On a year-to-date basis, the shilling has depreciated by 10.8 bps against the dollar, as compared to the 22.9 bps appreciation recorded in 2025.
We expect the shilling to be supported by:
-
Diaspora remittances standing at a cumulative USD 5,008.0 mn in the twelve months to May 2026, slightly lower than the USD 5,033.0 mn recorded over the same period in 2025. These have continued to cushion the shilling against further depreciation. In the May 2026 diaspora remittances figures, North America remained the largest source of remittances to Kenya accounting for 51.9% in the period,
-
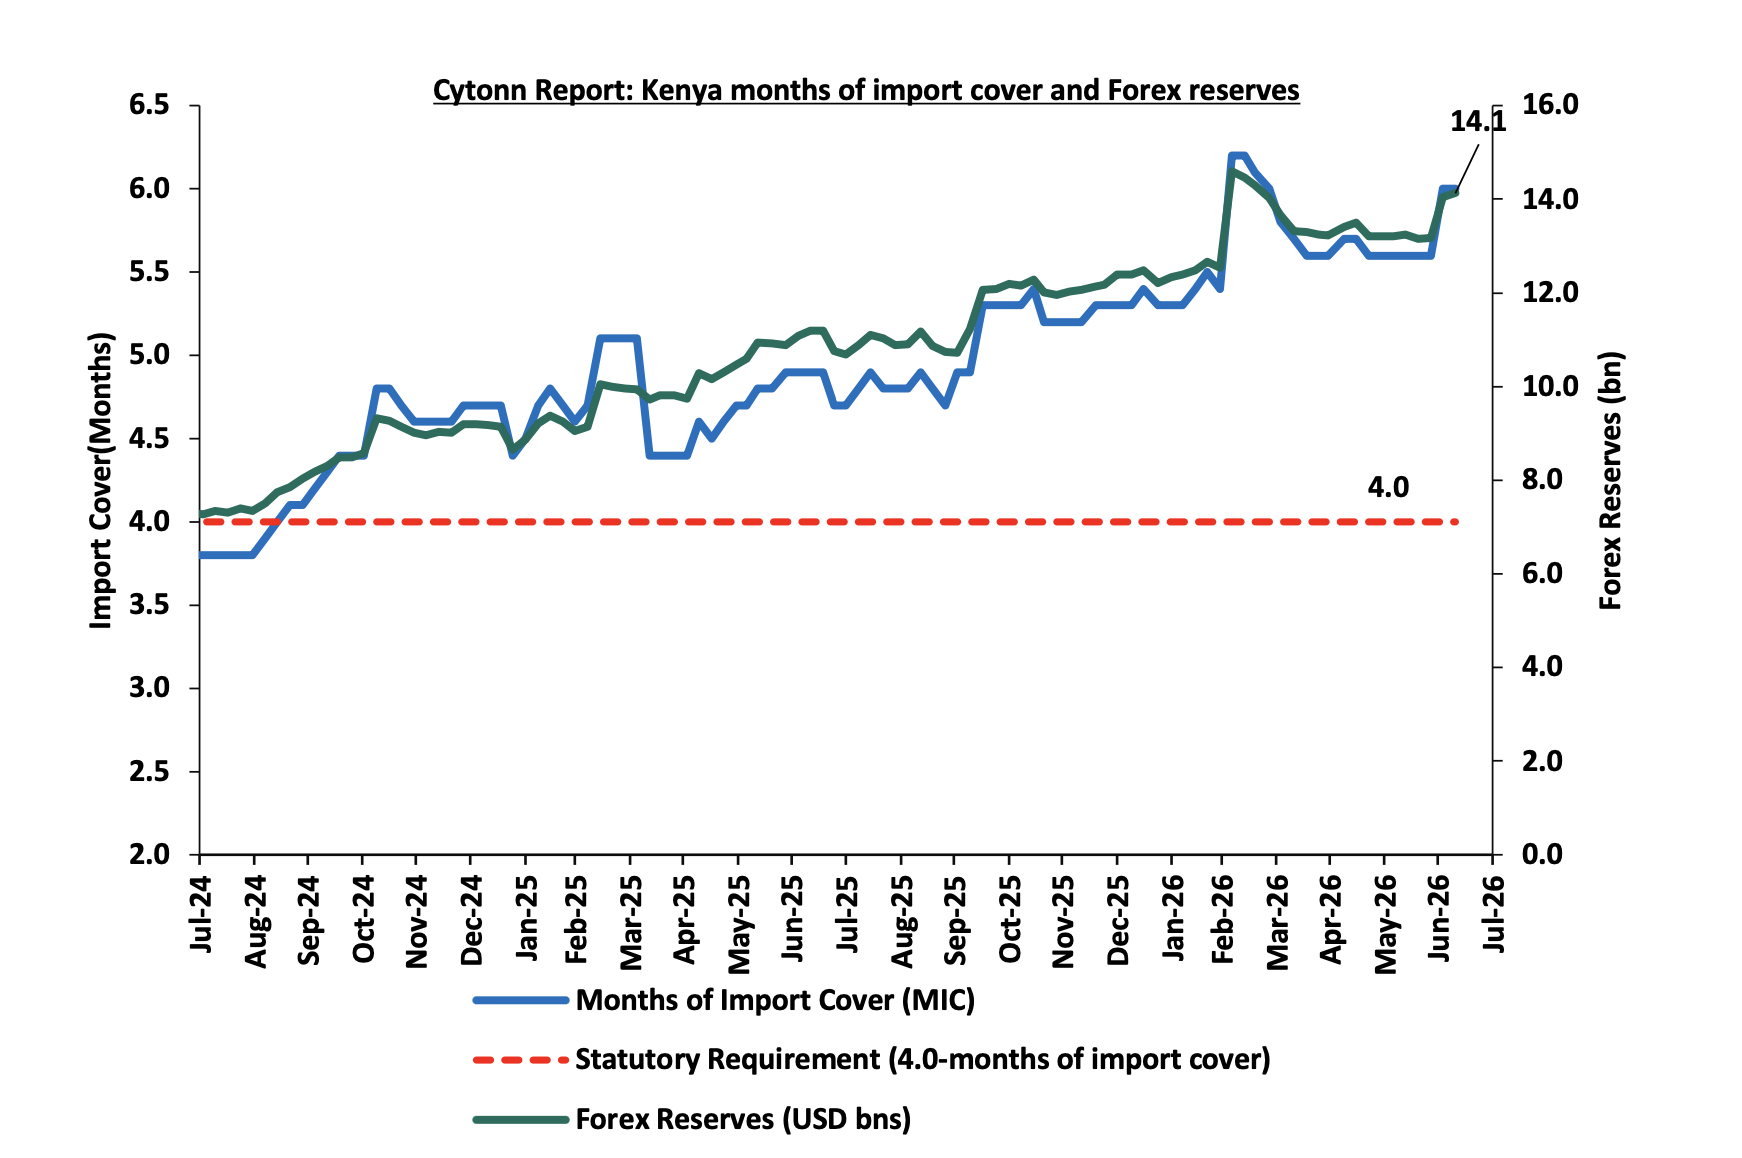
Improved forex reserves currently at USD 14.1 bn (equivalent to 6.0-months of import cover), which is above the statutory requirement of maintaining at least 4.0-months of import cover and above the EAC region’s convergence criteria of 4.5-months of import cover.
The shilling is however expected to remain under pressure in 2026 as a result of:
-
An ever-present current account deficit which is estimated at 2.6% of GDP in the 12 months to April 2026 compared to 1.7 percent of GDP in a similar period in 2025 and,
-
The need for government debt servicing, continues to put pressure on forex reserves given that 53.0% of Kenya’s external debt is US Dollar-denominated as of December 2025
Kenya’s forex reserves increased by 0.6% during the week to USD 14.1 bn from USD 14.0 bn recorded the previous week, equivalent to 6.0 months of import cover, and above the statutory requirement of maintaining at least 4.0-months of import cover.
The chart below summarizes the evolution of Kenya's months of import cover over the years:
Weekly Highlights
-
Stanbic Bank’s June 2026 Purchasing Manager’s Index (PMI)
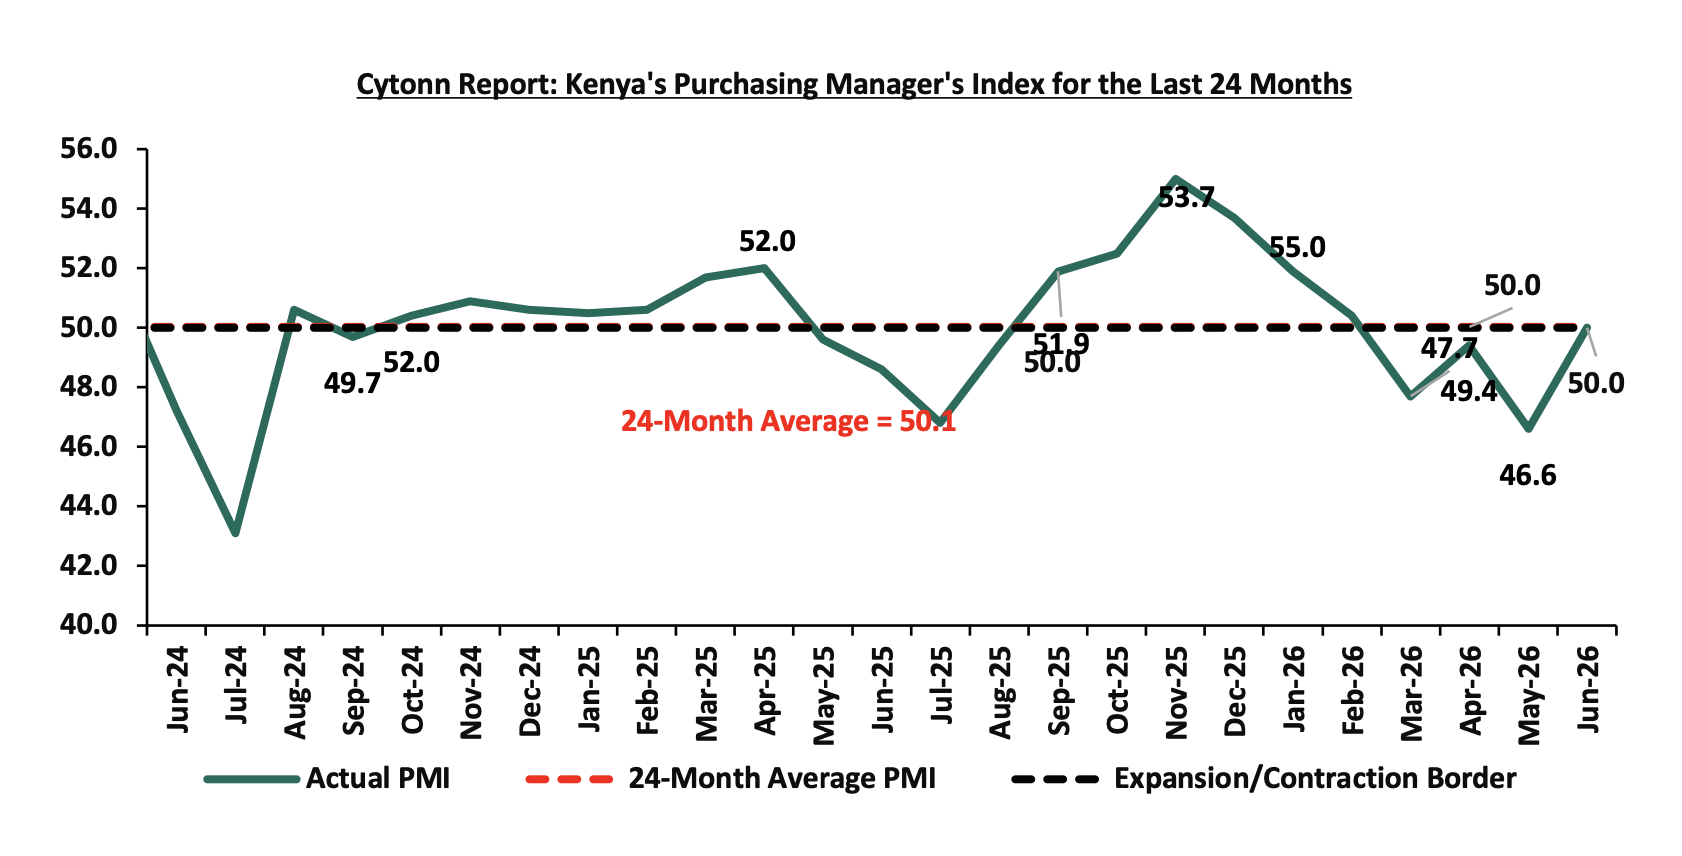
Stanbic Bank released its monthly Purchasing Manager’s Index (PMI) indicating that Kenya’s Purchasing Managers’ Index (PMI) rose by 3.4 points to the neutral mark of 50.0 in June 2026 from 46.6 in May 2026, marking the first expansion in four months since March 2026 in private sector activity. The reading was higher than the 48.6 recorded in June 2025. However, it was lower than the 50.4 recorded in February 2026 and the recent peak of 55.0 in November 2025, having only just crossed into neutral territory and therefore points to a very cautious recovery rather than a strong expansion. The increase was largely attributed to an increase in sales which boosted sentiment and led to higher backlogs, fresh job creation and restocking efforts. Furthermore, it was supported by a pickup in new order inflows, as firms reported a revival in customer demand, aided by referrals, marketing efforts, and business development initiatives. However, business activity remained under pressure, with output still subdued as firms continued to face thin client numbers, supplier capacity constraints, and tighter cash flow conditions. Input costs also remained elevated, with rising fuel levies and other cost pressures pushing total input cost inflation higher and weighing. Firms benefited from a modest rebound in new business, helping output to stabilize after the weakness recorded in the previous months. However, the recovery remained constrained by elevated cost pressures, with businesses still grappling with higher input and output prices, which continue to weigh on margins and limit the pace of improvement. Key to note, a PMI reading of above 50.0 indicates an improvement in the business conditions, while readings below 50.0 indicate a deterioration. The chart shows Kenya's Purchasing Manager's Index for the last 24 Months:
Going forward, Kenya’s private sector appears to have regained some stability in June for the first time in four months, but the recovery still looks fragile and uneven. While the return of the headline PMI to the neutral 50.0 mark is encouraging, it also suggests that business conditions are only just balancing between expansion and contraction rather than showing a decisive rebound. The latest survey shows that the improvement was still being held back by rising fuel levies, which triggered another pickup in total input cost inflation and kept business expenses elevated. These higher costs continued to squeeze margins and contributed to a reduction in output, even as customer orders showed signs of revival. That suggests that demand may be starting to improve, but the pace of recovery remains constrained by cost-side pressures that are still feeding through the system. Firms also appear more optimistic about future activity, suggesting that confidence is recovering even if current operating conditions remain challenging. Overall, the June reading points to a sector that is stabilizing, but one that still needs softer price pressures and firmer customer demand before a more durable expansion can take hold.
-
Kenya’s Q1’2026 Balance of Payments Note
Balance of Payments
According to the Q1’2026 Quarterly Balance of Payments Report released by the Kenya National Bureau of Statistics (KNBS), Kenya’s balance of payments position deteriorated by 128.6% in Q1’2026, to a deficit of Kshs 176.0 bn, from a deficit of Kshs 77.0 bn in Q1’2025. The y/y negative performance in BoP was mainly driven by a 72.7% widening of the current account deficit to Kshs 120.9 bn from Kshs 70.0 bn in Q1’2025. The table below shows the breakdown of the various balance of payments components, comparing Q1’2026 and Q1’2025:
|
Item |
Q1’2025 |
Q1’2026 |
Y/Y % Change |
|
Current Account Balance |
(70.0) |
(120.9) |
72.7% |
|
Capital Account Balance |
0.0 |
8.9 |
- |
|
Financial Account Balance |
(108.4) |
(243.5) |
124.7% |
|
Net Errors and Omissions |
38.6 |
44.5 |
15.1% |
|
Balance of Payments |
(77.0) |
(176.0) |
All values in Kshs bns
Key take-outs from the table include;
-
The current account deficit (value of goods and services imported exceeds the value of those exported) widened by 72.7% to Kshs 120.9 bn from Kshs 70.0 bn in Q1’2025. The y/y increase of the current account deficit was brought about by the 19.4% widening in the merchandise trade balance deficit to Kshs 352.3 bn from a Kshs 295.0 bn in Q1’2025.
-
The capital account balance (shows capital transfers receivable and payable between residents and non-residents, including the acquisition and disposal of non-produced non-financial items), which includes foreign direct investments (FDIs), widened by 100.0% to a surplus Kshs 8.9 bn in Q1’2026,
-
The financial account balance (the difference between the foreign assets purchased by domestic buyers and the domestic assets purchased by foreign buyers) recorded a 124.7% increase in net inflow to a deficit Kshs 243.5 bn in Q1’2026, from a deficit of Kshs 108.4 bn in Q1’2025.
-
Consequently, the Balance of Payments (BoP) position deteriorated to a deficit of Kshs 176.0 bn in Q1’2026, from a deficit of Kshs 77.0 bn recorded in Q1’2025.
Current Account Balance
Kenya’s current account deficit widened by 72.7% to Kshs 120.9 bn in Q1’2026 from the Kshs 70.0 bn deficit recorded in Q1’2025. The y/y expansion of the deficit registered was driven by:
-
The widening of the merchandise trade account deficit (the value of import goods exceeds the value of export goods, resulting in a negative net foreign investment) by 19.4% to Kshs 352.3 bn in Q1’2026, from Kshs 295.0 bn recorded in Q1’2025, and,
-
A 26.7% decrease in the Services Trade Balance to a surplus of Kshs 56.2 bn from a surplus of Kshs 76.7 bn in Q1’2025,
The table below shows the breakdown of the various current account components on a year-on-year basis, comparing Q1’2026 and Q1’2025:
|
Item |
Q1'2025 |
Q1'2026 |
Y/Y % Change |
|
Merchandise Trade Balance |
(295.0) |
(352.3) |
19.4% |
|
Services Trade Balance |
76.7 |
56.2 |
(26.7%) |
|
Primary Income Balance |
(82.7) |
(66.7) |
(19.3%) |
|
Secondary Income (transfer) Balance |
230.9 |
241.8 |
4.7% |
|
Current Account Balance |
(70.0) |
(120.9) |
All values in Kshs bns
Kenya’s balance of payment (BoP) position deteriorated by 128.6% in Q1’2026, to a deficit of Kshs 176.0 bn, from a deficit of Kshs 77.0 bn in Q1’2025. The y/y negative performance in BoP was mainly driven by a 72.7% widening of the current account deficit to Kshs 120.9 bn from Kshs 70.0 bn in Q1’2025. Looking ahead, Kenya's external position will largely depend on the evolution of both the current and financial accounts. On the current account, continued growth in services exports, supported by tourism, transport and ICT, is expected to provide a stable source of foreign exchange earnings. However, the persistent merchandise trade deficit continues to expose Kenya's structural dependence on imported petroleum products, machinery, industrial inputs and other intermediate goods, leaving the economy vulnerable to external supply shocks.
For more details please see our Cytonn Kenya’s Q1’2026 Balance of Payments Note
-
Kenya Q1’2026 GDP Highlight
The Kenya National Bureau of Statistics (KNBS) released the Q1’2026 Quarterly Gross Domestic Product Report, highlighting that the Kenyan economy recorded a 5.3% growth in FY’2025, higher than the 4.9% growth recorded in Q1’2026. The main contributor to Kenyan GDP remains to be the Agriculture, Fishing and Forestry sector which grew by 4.9% in Q1’2026, lower than the 5.3% expansion recorded in Q1’2025. All sectors in Q1’2026 recorded positive growths, with varying magnitudes across activities. Notably, Accommodation and Food Services, Mining and quarrying and Construction recorded the highest growth rates of 14.7%, 9.1% and 6.6% respectively. The chart below shows the first Quarter Kenyan GDP growth rates.
The key take-outs from the report are:
-
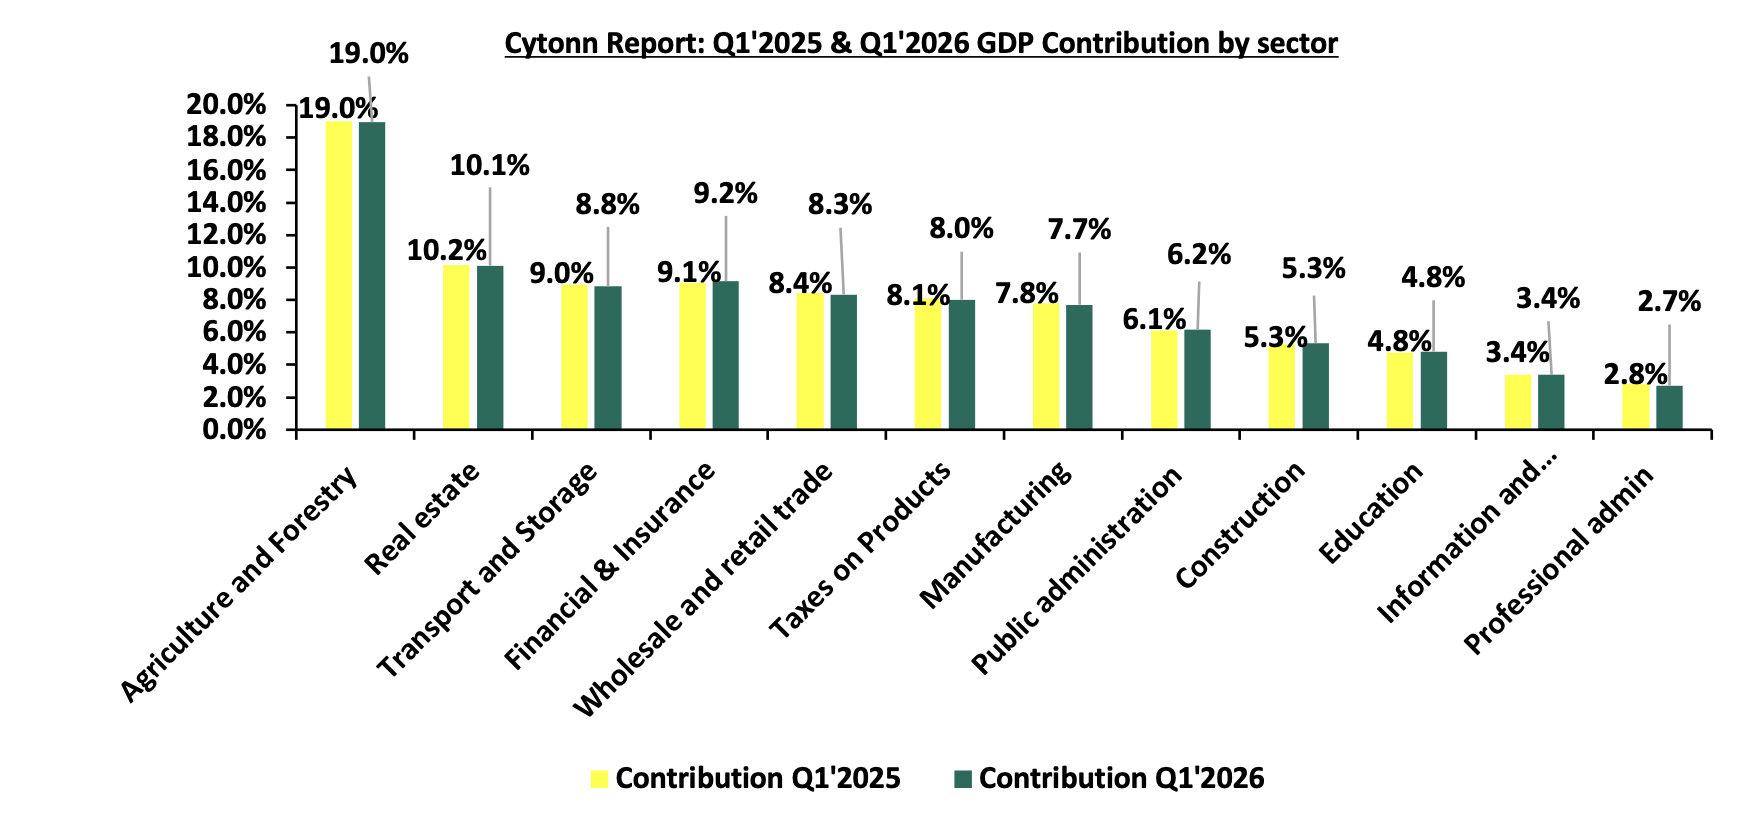
Sectoral contribution to growth: The biggest gainer in terms of sectoral contribution to GDP was the Financial & Insurance and Accommodation & Food Services sectors, increasing by 0.1% points to 9.2% and 1.8% respectively in Q1’2026 from 9.1% and 1.7% in Q1’2025, while the Transport and Storage sector was the biggest loser, declining by 0.2% points to 8.8% in Q1’2026, from 9.0% in Q1’2025. The chart below shows the top contributors to GDP by sector in FY’2025:
-
Decelerated growth in the Agricultural Sector: Agriculture and Forestry recorded a growth of 4.9% in Q1’2026. The performance was a decrease of 0.4% points, from the expansion of 5.3% recorded in Q1’2025. Nonetheless, the sector remains the major contributor to GDP, with the sectoral contribution to GDP the stood at 19.0% in Q1’2026, remaining constant from Q1’2025. The sector’s growth was, supported by;
-
Increased production of tea, which rose by 3.1% to 141.1 thousand metric tonnes in Q1’2026 from 136.9 thousand metric tonnes in Q1’2025, increased cane deliveries which increased by 6.2% to 2.505.4 thousand metric tonnes and increased milk deliveries which increased to 249.7 mn litres from 244.4 mn litres.
-
Increased exports of cut flowers, which rose by 4.3% to 35,768.0 metric tonnes in Q1’2026 and increased exports of vegetables which increased marginally to 17,337.3 metric tonnes from 17,317.3 metric tonnes .
The sector’s growth was, however, slowed down by;
-
A decline in coffee production, which fell by 6.2% 15,847.6 metric tonnes in the period under review from 16,894.4 metric tonnes in the first quarter of 2025.
-
Fruit exports declined to 47,509.1 metric tonnes in the period under review from 68,808.6 metric tonnes in the first quarter of 2025.
-
Accelerated growth in the electricity and water supply sector - The Electricity and Water Supply sector recorded a growth of 4.3% in Q1’2026 compared to a 4.1% growth in Q1’2025, with the sectoral contribution to GDP stood at 2.3% in Q1’2026, remaining constant from Q1’2025. Notably, total electricity generation increased by 7.4% to 3,446.4 million kilowatt hour (KWh) in Q1’2026, from 3,208.8 million kilowatt hour (KWh) in the first quarter of 2025. The sector’s performance was supported by increase in production from geothermal and hydroelectric power;
-
Electricity generated from geothermal generation increased in the first quarter of 2026 by 21.1% to 1664.1 million KWh.
-
Similarly, electricity generated from hydroelectric generation increased in Q1’2026 to 852.6 KWh compared to 797.0 KWh in Q1’2025
However, the sector’s growth was slowed down by;
-
Electricity generated from thermal declined by 6.4% to stand at 358.1 million KWh in the quarter under review,
-
Similarly, electricity generated from wind and solar declined by 14.1% and 7.5% to stand at 448.5 million KWh and 123.1 million KWh, respectively, in the quarter under review
-
Significant growth in the Accommodation and Food Service sector: Accommodation and Food Services sector recorded growth in Q1’2026, having expanded by 14.7%, higher than the 8.0% recorded in Q1’2025. Additionally, the contribution to GDP stood at 0.9% in Q1’2026, remaining constant from Q1’2025. Some of the notable improvements include:
-
International visitor arrivals through the two major airports, the Jomo Kenyatta International Airport (JKIA) and Mombasa International Airport (MIA) rose by 13.1% in first quarter of 2026 to stand at 506,622 visitors compared to the 0.5% growth in Q1’2025
The chart below shows the different sectoral GDP growth rates for FY’2025:
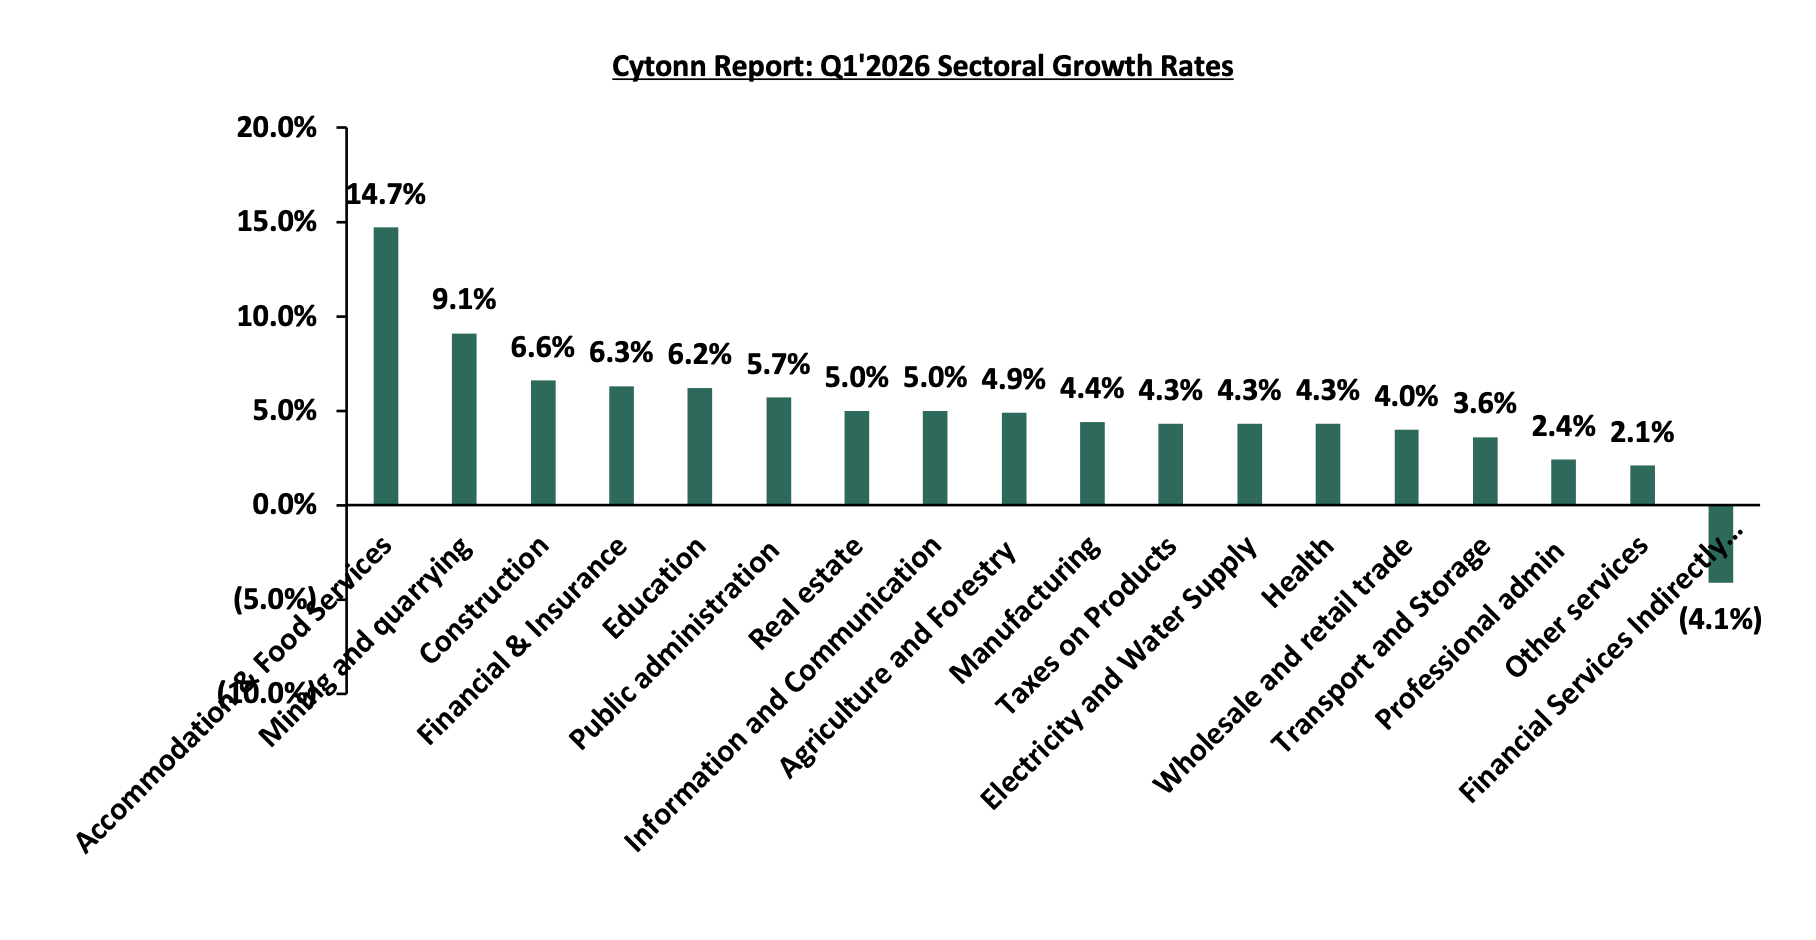
Kenya's economy is projected to grow by 4.4%–5.3% in 2026, representing a downward revision from earlier forecasts due to heightened global uncertainty stemming from the Middle East conflict and evolving international trade policies. Despite the softer outlook, economic activity continues to be supported by the relative stability of the Kenyan Shilling and the cumulative impact of monetary policy easing undertaken between August 2024 and March 2026. The agricultural sector, the largest contributor to Kenya's GDP is expected to remain the primary engine of growth, underpinned by favourable rainfall and improved agricultural output. Overall, while geopolitical risks and higher fuel prices continue to pose downside risks, resilient domestic fundamentals support a cautiously optimistic outlook for Kenya's economy in 2026.
For more details please see our Cytonn Kenya’s Q1’2026 GDP Note
-
Sovereign Wealth Fund Bill, 2026.
During the week, the President assented to law the Sovereign Wealth Fund Bill, 2026, following its passage by the National Assembly with amendments on 2nd July 2026, giving Kenya a legal vehicle to save part of its oil, mineral and privatisation earnings and shield them from political misuse and debt repayment. The Act establishes a legal framework for the Sovereign Wealth Fund, to be managed and invested for the benefit of current and future generations of Kenyan citizens, with an objective of achieving long-term fiscal sustainability and intergenerational wealth-sharing. Other key highlights from the Act include;
-
The Fund is structured around a Holding Account at the Central Bank of Kenya, which receives all resource revenues, including government profit share from petroleum operations, petroleum and mining royalties, bonus payments, and divestment proceeds, before transferring them within ten days into three components, namely the Stabilisation Component, the Strategic Infrastructure Investment Component, and the Future Generations, or "Urithi," Component, each held in its own Central Bank account, with the Cabinet Secretary setting annual transfer proportions between components in consultation with the Board, guided by macro-economic stability, non-resource sector competitiveness, strategic project investment needs, and the need to provide at least ten per cent savings for future generations
-
The Stabilisation Component is designed to cushion the national government against extraordinary shocks affecting macro-economic stability, drawing funding from Holding Account transfers and fifty per cent of its own investment income; withdrawals require the Cabinet Secretary to write to the Board justifying the amount, Cabinet approval, and National Assembly appropriation via a Supplementary Budget, while transfers into the component cease once it reaches Kshs 10.0 bn or a Cabinet Secretary-prescribed threshold, with any surplus above that ceiling redirected, with Cabinet and National Assembly approval, to servicing public debt
-
The Strategic Infrastructure Investment Component funds priorities aligned to the national development plan, spanning agriculture, transport, housing, energy, water, education and health, and may be used to leverage private sector finance in commercially viable projects; it is funded by Holding Account transfers and fifty per cent of its own investment income, with withdrawals following National Assembly budget approval, after which the Cabinet Secretary notifies the Board of the amount and timing, and the Board authorises the Central Bank to transfer funds to the Consolidated Fund for use per the approved Budget Estimates and appropriation Act
-
The Future Generations Component builds a savings base for when mineral and petroleum resources are exhausted, funded not only by Holding Account transfers and its own investment income but also by fifty per cent of the investment income earned on both the Stabilisation and Strategic Infrastructure Investment Components, effectively cross-subsidised by the other two; critically, funds in this component cannot be withdrawn or transferred for any purpose other than investment, locking in savings more tightly than the other two components
-
Qualifying instruments differ subtly by component: the Future Generations and Stabilisation Components are restricted to investment-grade rated foreign currency instruments issued or guaranteed by the IMF, World Bank, or a sovereign state other than Kenya, or deposits with the Bank for International Settlements, foreign central banks, or adequately capitalised foreign commercial banks, whereas the Strategic Infrastructure Investment Component's qualifying instruments carry no explicit credit-rating requirement, permitting plainer foreign currency debt instruments and deposits, likely to accommodate blended or concessional infrastructure financing
-
Each of the three components is separately barred from holding securities issued by a Kenyan issuer, real estate located in Kenya, or funds and companies whose primary purpose is to invest in Kenya, as well as covered bonds secured by such assets, on top of the Fund-wide prohibition on speculative derivatives, unlisted real estate, private equity, art or commodities
-
Liquidity rules also differ: investments from the Stabilisation Component must, to the extent possible, be in liquid instruments with maturities consistent with the risks covered, while Strategic Infrastructure Investment Component holdings must be liquid with maturities matched to the expected pay-out schedule for resources earmarked for that year's projects; no equivalent liquidity requirement is specified for the Future Generations Component, consistent with its longer investment horizon
-
Should mineral and large or medium-scale mining operations and petroleum resources undergo significant depletion, defined as a ninety per cent revenue reduction persisting for two years and confirmed by a registered geologist's report, the three components are consolidated into a single Fund account, after which only cumulative principal and earned interest may be withdrawn, restricted to financing strategic infrastructure priorities approved by the National Assembly in the Budget Estimates
-
Governance rests with a Board chaired by a presidential appointee, sitting alongside the Treasury, mining and petroleum Principal Secretaries (or delegates), the CBK Governor or delegate, and four competitively recruited non-public-officer members, operating under the Public Finance Management Act with parliamentary oversight, public reporting and auditing built into the framework
-
Reserves are ring-fenced from political misuse: withdrawals are barred within three months of a general election, the components cannot be used as collateral or to extend advances to any government entity, and misappropriation carries a penalty of twice the amount misappropriated plus a fine of at least Kshs 10.0 mn or five years' imprisonment, or both
-
The Act introduces a cap on annual management fees payable to external investment fund managers, limiting them to a maximum of 2.0% of the value of funds invested in qualifying instruments. This measure is intended to promote prudent utilisation of public resources and enhance transparency by requiring clear disclosure and documentation of all fees in the managers’ appointment instruments
We note that fixed income remains the primary beneficiary of the Fund's mandate, given the exclusion of Kenyan-issued securities and domestic real estate across all three components positions foreign investment-grade instruments as the natural home for the bulk of resources, while equities are confined to foreign-listed counters and domestic real estate is locked out entirely. Going forward, a sovereign wealth fund should be judged not by its size, whether it begins near the Kshs 200.0 bn floated for its early years or grows well beyond it, but by its ability to preserve and grow national wealth across economic and political cycles; the law now exists, and the harder task is operating it with the transparency, discipline and independence that separate a lasting fiscal asset from another public institution with unrealised potential.
Rates in the fixed income market have been on an upward trend, reversing the sharp declines seen through the CBK's easing cycle. The shift has been driven by the CBK's decision to pause its rate-cutting cycle, alongside a resurgence in inflation. The government is 123.7% ahead of its prorated net domestic borrowing target of Kshs 34.0 bn, having a net borrowing position of Kshs 76.0 bn (inclusive of T-bills). We expect investors to maintain a preference for short to medium-term papers as they monitor the pace of government issuance and the path of inflation before committing further out on the curve, with the yield curve likely to remain under upward pressure rather than stabilize, at least until the inflation trajectory becomes clearer.
Market Performance:
During the week, the equities market was on an upward trajectory, with NASI, NSE 20, NSE 25 and NSE 10 gaining by 0.8%,0.4%, 0.3% and 0.1% respectively, taking the YTD performance to gains of 24.9%, 24.2%,22.4% and 22.3% for NSE 10, NSE 25, NSE 20 and NASI respectively. The week-on-week equities market performance was mainly driven by gains recorded by large cap stocks such as Safaricom, BAT and ABSA of 2.5%, 2.3% and 2.0% respectively. However, the performance was weighed down by losses recorded by large cap stocks such as EABL, NCBA and Equity of 2.0%, 1.4% and 1.1% respectively;
During the week, the banking sector index decreased marginally by 1.5 bps to remain relatively unchanged at 261.5 recorded the previous week. This is attributable to losses recorded by large cap stocks such as NCBA and Equity of 1.4% and 1.1% respectively. However, the performance was supported by large cap stocks such Absa, KCB and Stanbic of 2.0%, 1.9% and 1.2% respectively;
During the week, equities turnover decreased by 98.3% to USD 28.9 mn from USD 1,662.2 mn recorded the previous week, taking the YTD total turnover to USD 2502.8 mn. Foreign investors became net buyers during the week with a net buying position of USD 0.5 mn, from a net selling position of USD 0.2 mn recorded the previous week, taking the YTD foreign net selling position to USD 75.9 mn, compared to a net selling position of USD 92.9 mn recorded in 2025;
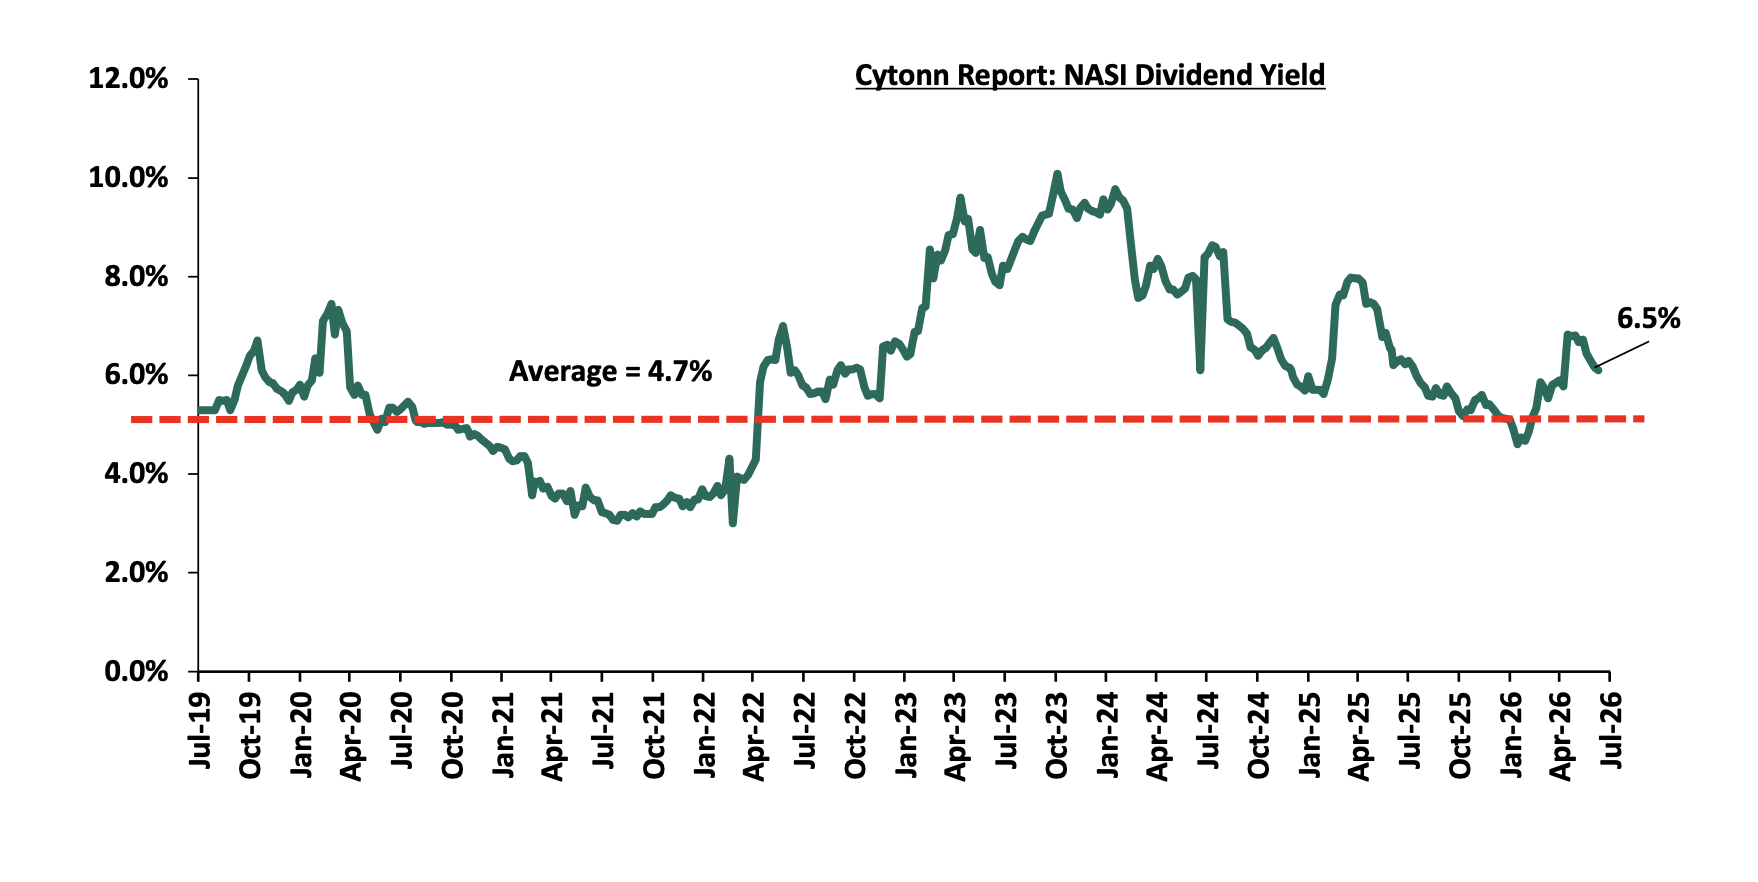
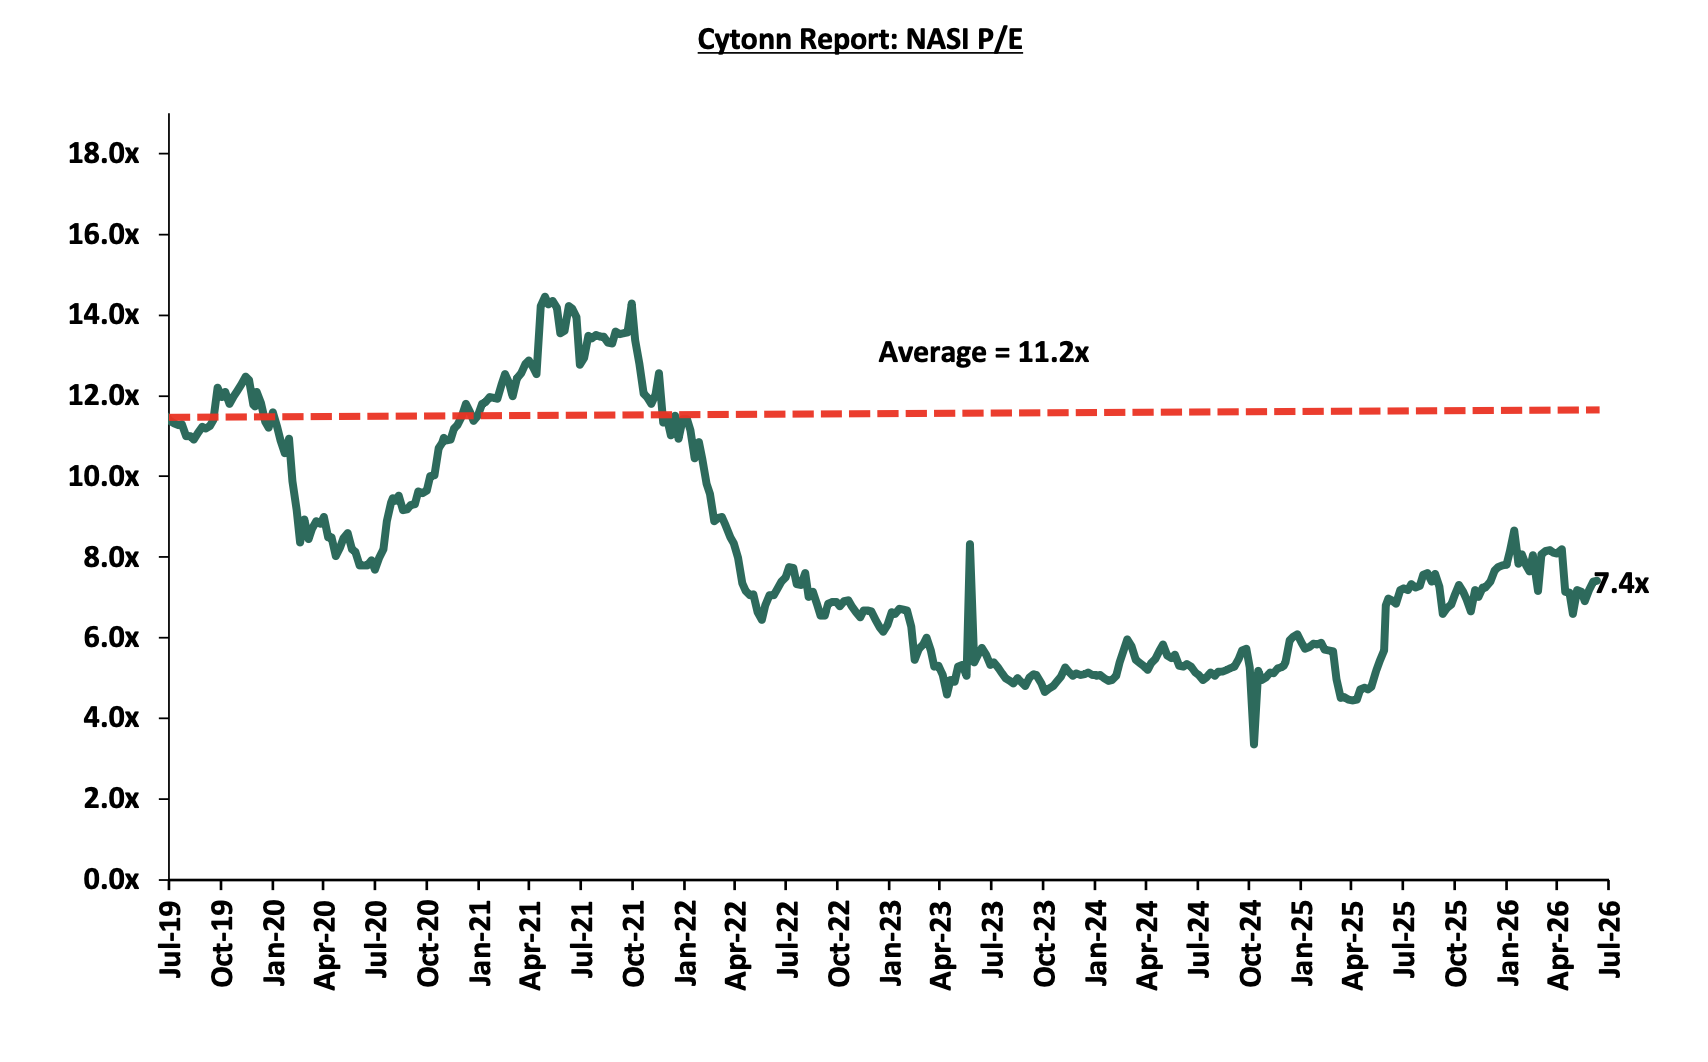
The market is currently trading at a price to earnings ratio (P/E) of 7.4x, 34.0% below the historical average of 11.2x, and a dividend yield of 6.3%, 1.6% points above the historical average of 4.7%. Key to note, NASI’s PEG ratio currently stands at 0.9x, an indication that the market is slightly undervalued relative to its future growth. A PEG ratio greater than 1.0x indicates the market may be overvalued while a PEG ratio less than 1.0x indicates that the market is undervalued;
The charts below indicate the historical P/E and dividend yields of the market:
Universe of Coverage:
|
Cytonn Report: Equities Universe of Coverage |
|||||||||||
|
Company |
Price as at 03/07/2026 |
Price as at 10/07/2026 |
w/w change |
m/m change |
YTD Change |
Year Open 2026 |
Target Price* |
Dividend Yield |
Upside/ Downside** |
P/TBv Multiple |
Recommendation |
|
NCBA |
88.3 |
87.0 |
(1.4%) |
(2.8%) |
2.4% |
85.0 |
108.9 |
8.2% |
33.4% |
1.2x |
Buy |
|
Family Bank |
23.6 |
24.3 |
3.0% |
0.4% |
35.0% |
18.0 |
27.6 |
4.9% |
18.5% |
1.3x |
Accumulate |
|
Diamond Trust Bank |
145.0 |
145.3 |
0.2% |
0.2% |
26.6% |
114.8 |
161.4 |
6.2% |
17.3% |
0.4x |
Accumulate |
|
ABSA Bank |
32.8 |
33.5 |
2.0% |
4.4% |
34.6% |
24.9 |
36.8 |
6.1% |
16.3% |
1.8x |
Accumulate |
|
KCB Group |
78.5 |
80.0 |
1.9% |
1.6% |
21.7% |
65.8 |
83.9 |
8.8% |
13.7% |
0.8x |
Accumulate |
|
CIC Group |
4.6 |
4.5 |
(2.4%) |
(1.3%) |
(1.3%) |
4.5 |
5.0 |
2.9% |
13.6% |
1.1x |
Accumulate |
|
Co-op Bank |
34.8 |
34.9 |
0.3% |
1.7% |
46.0% |
23.9 |
36.9 |
7.2% |
13.0% |
1.3x |
Accumulate |
|
Standard Chartered Bank |
339.0 |
339.3 |
0.1% |
3.5% |
13.2% |
299.8 |
345.8 |
9.1% |
11.1% |
2.1x |
Accumulate |
|
Jubilee Holdings |
382.3 |
381.3 |
(0.3%) |
5.7% |
18.2% |
322.5 |
407.5 |
3.9% |
10.8% |
0.5x |
Accumulate |
|
Stanbic Holdings |
288.0 |
291.5 |
1.2% |
4.0% |
47.4% |
197.8 |
300.3 |
7.7% |
10.7% |
1.6x |
Accumulate |
|
I&M Group |
69.0 |
65.5 |
(5.1%) |
(5.8%) |
53.0% |
42.8 |
67.9 |
5.7% |
9.4% |
1.1x |
Hold |
|
Equity Group |
87.0 |
86.0 |
(1.1%) |
7.5% |
28.4% |
67.0 |
87.5 |
6.7% |
8.4% |
1.1x |
Hold |
|
Britam |
13.2 |
14.6 |
10.6% |
15.9% |
60.6% |
9.1 |
13.5 |
0.0% |
(7.2%) |
1.1x |
Lighten |
|
*Target Price as per Cytonn Analyst estimates **Upside/ (Downside) is adjusted for Dividend Yield ***Dividend Yield is calculated using FY’2025 Dividends |
|||||||||||
We maintain a “cautiously optimistic” short-term outlook supported primarily earnings-led attractive valuations, despite rising yields on short-term government papers, which increase competition for capital by drawing investors towards risk-free government securities, as well as heightened geopolitical risks such as Iran war that may weigh on investor sentiment, and, “neutral” in the long term as persistent foreign investor outflows continue to constrain market liquidity and limit broad-based market re-rating. With the market currently trading at a discount to its future growth (PEG Ratio at 0.9x), where performance will be driven by company-specific fundamentals rather than general market direction, we believe that investors should reposition towards value stocks exhibiting strong earnings growth, attractive dividend yields, solid balance sheets, sustainable competitive advantages and trading at compelling discounts to their intrinsic value. While foreign investor sell-offs are expected to continue exerting pressure in the near term, we believe this will create selective entry opportunities for long-term investors.
-
Industry reports
During the week, the Kenya National Bureau of Statistics (KNBS) released the Quarterly Gross Domestic Product Report that outlined the performance of various sectors to the GDP and below are the key take-outs related to the Real Estate sector:
-
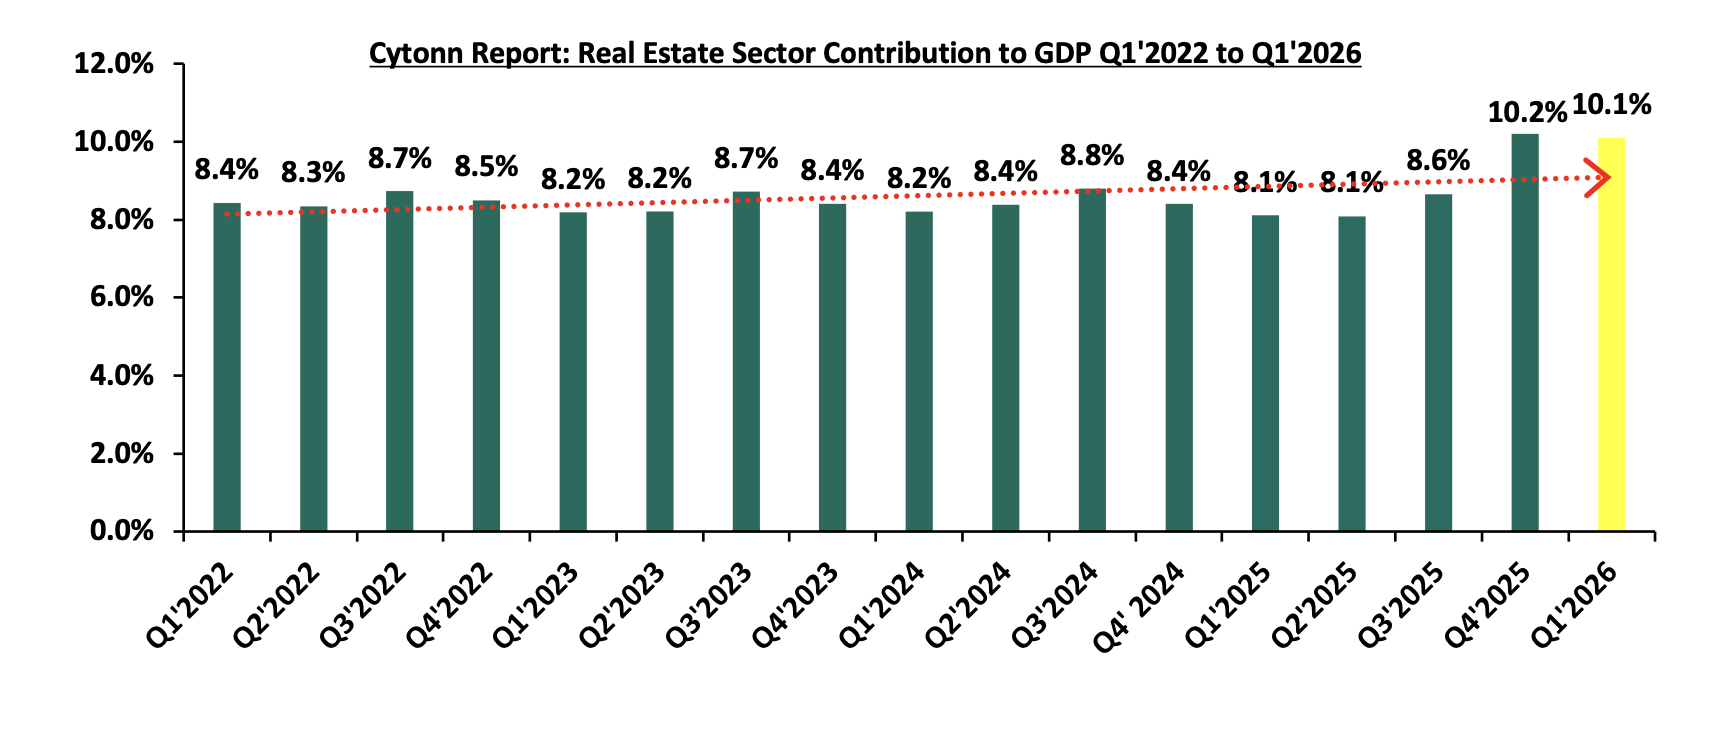
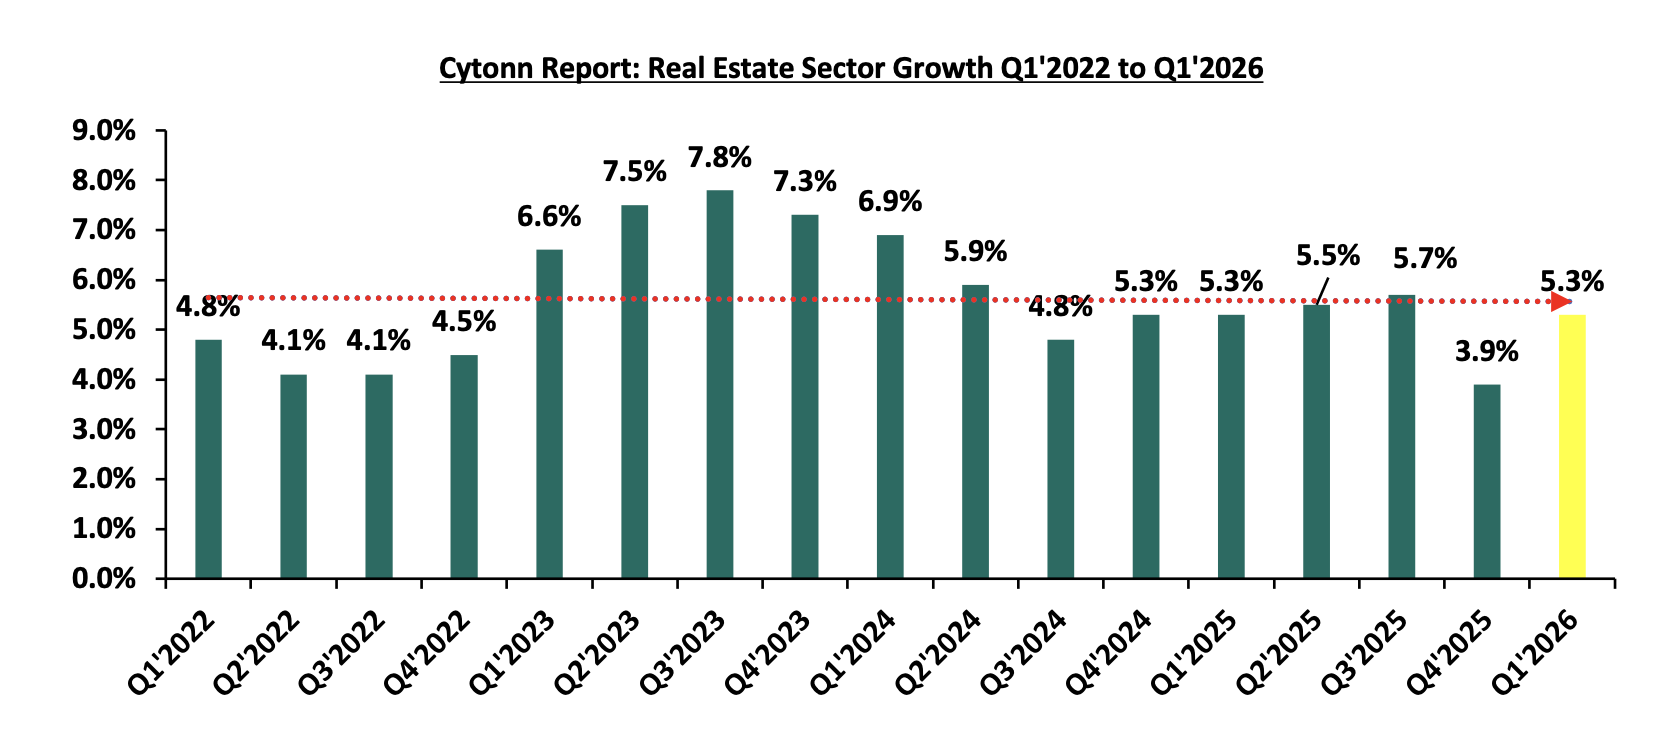
Steady growth in the Real Estate Sector - The Real Estate sector recorded stable growth of 5.3% in Q1'2026, unchanged from the 5.3% expansion registered in the corresponding quarter of 2025. The sustained performance reflects relatively steady demand across the property market, particularly within the residential segment, despite prevailing affordability constraints and a cautious investment environment. On a quarter-on-quarter basis, however, the sector showed signs of recovery, with growth accelerating by 1.4% points from 3.9% recorded in Q4'2025, suggesting improved market activity and renewed momentum at the beginning of the year. Real Estate contribution to GDP increased by 2.0% points to 10.1% in Q1’2026 from the 8.1% recorded in Q1’2025. On a quarter to quarter basis, Real Estate contribution to GDP decreased by 0.1%-points to 10.1% in Q1’2026 from the 10.2% recorded in Q4’2025.
The graph below shows the Real Estate sector contribution to GDP from Q1’2022 to Q1’2026.
Source: Kenya bureau of statistics (KNBS)
The graph below shows the Real Estate Sector growth rate from Q1’2022 to Q1’2026
Source: Kenya bureau of statistics (KNBS)
-
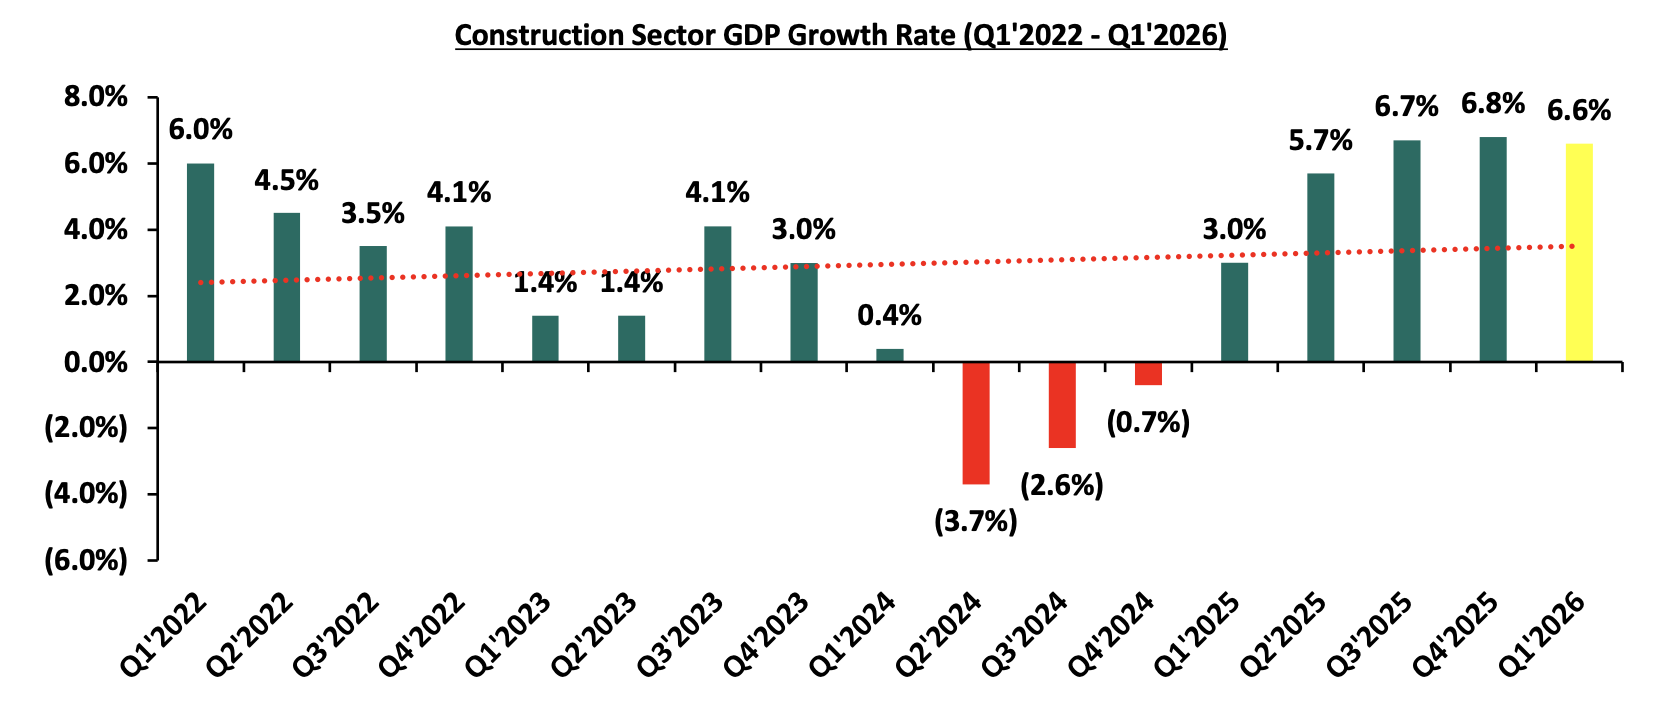
Continued growth in the construction sector - The construction sector grew by 6.6% in Q1’2026, which is 3.6% points higher than the 3.0% growth in Q1’2025, largely driven by (i) Government’s continued Focus on Affordable Housing: the Kenyan government has sustained its strong commitment to the Affordable Housing Program (AHP), a key pillar under the Bottom-Up Economic Transformation Agenda (BETA). (ii) Infrastructural development: Kenya sustained momentum in infrastructure development, with focus shifting to ongoing government and public-private partnership (PPP) projects aimed at improving connectivity and supporting construction activity and, (iii)Provision of affordable mortgage financing: Kenya Mortgage Refinance Company (KMRC) has continued to play a critical role in expanding access to affordable housing finance by offering single-digit fixed-rate, long-term refinancing to Primary Mortgage Lenders (PMLs) such as banks, SACCOs, and microfinance institutions. On a quarter-on-quarter basis, this performance represented a 0.2%-point decrease from the 6.8% increase recorded in Q4’2025. The graph below shows the Construction sector growth rates from Q1’2022 to Q1’2026;
Source: Kenya Bureau of Statistics (KNBS)
-
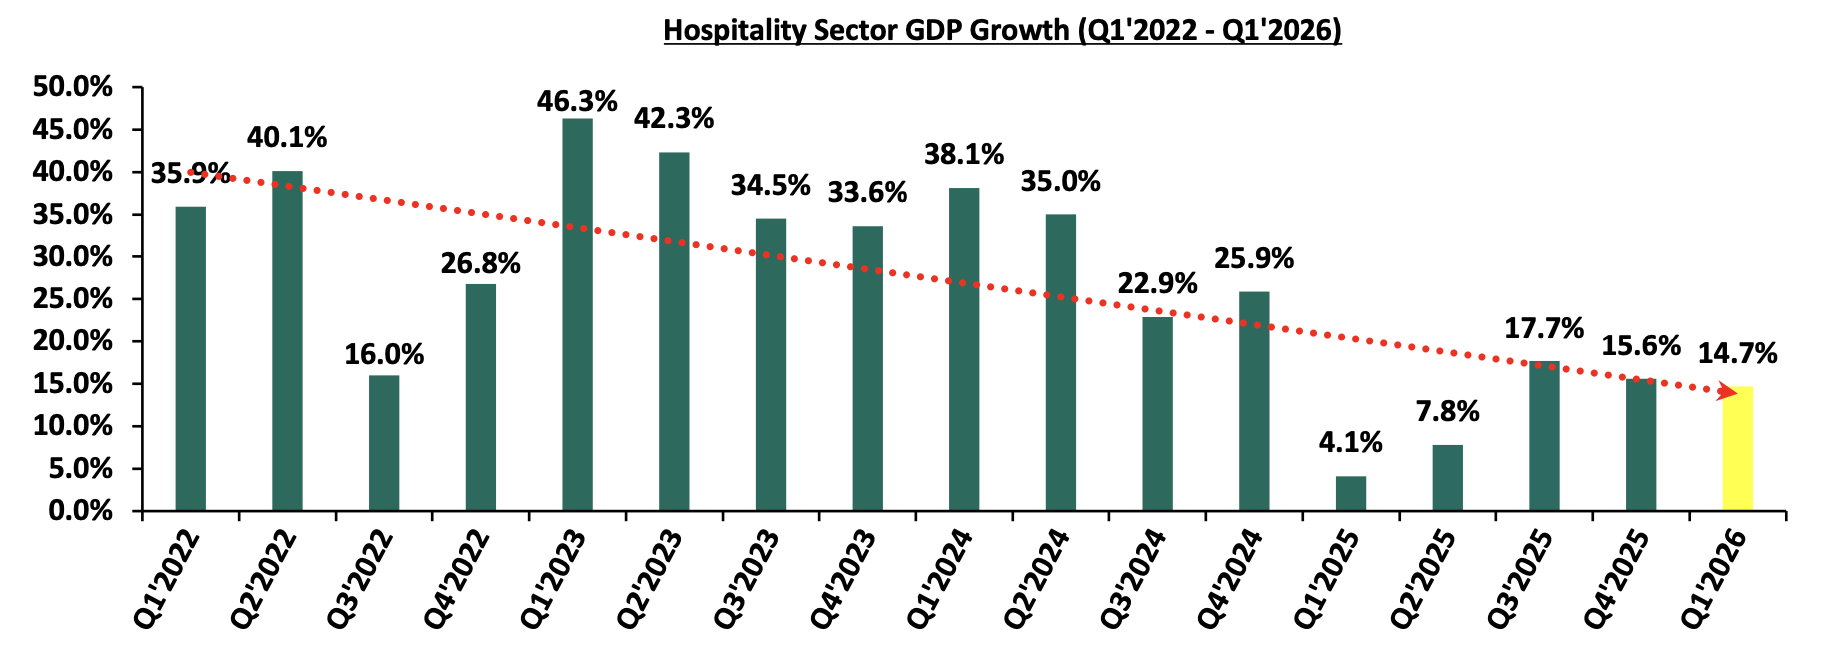
Sustained recovery in hospitality sector –The hospitality sector grew by 14.7% in Q1’2026, representing a 10.6%-points increase from the 4.1% growth recorded in Q1’2025. On a q/q basis, the performance reflected a 0.9% decrease from the 15.6% growth registered in Q4’2025. The growth compared to 2025 is mainly attributable to economic deceleration, high operational costs and constrained consumer spending arising from increased taxation and elevated living costs. The graph below shows the accommodation and restaurant sector contribution to GDP growth rates from Q1’2022 to Q1’2026;
Source: Kenya bureau of statistics (KNBS)
-
Infrastructure Sector
-
SGR extension to Nairobi CBD
During the week, the Kenya Railways Corporation (KRC) announced plans to extend the Standard Gauge Railway (SGR) by 15 kilometers from the Syokimau passenger terminus to Nairobi Central Station, closing the long-standing last-mile connectivity gap between the SGR and the Nairobi Central Business District (CBD). The project is meant to fit into the planned Nairobi Railway City, a Kshs 28.0 bn project by the State-owned corporation meant to transform 13 acres of underutilized land into a modern transit hub. The project will include the construction of new passenger platforms at Imara Daima, Makadara and Nairobi CBD, rehabilitation of flood-prone sections of the metre-gauge railway (MGR), and supporting infrastructure such as bridges and drainage improvements. The extension forms part of the broader Nairobi Railway City Programme, which seeks to transform Nairobi's railway precinct into a modern integrated transport hub.
Going forward, the project is expected to improve urban mobility by providing direct rail access between the CBD and the SGR network, reducing travel times and enhancing the overall commuter experience. Improved railway infrastructure is also likely to increase public transport uptake, support the growth of the Nairobi Railway City development, and stimulate economic activity along the railway corridor. For the Real Estate sector, enhanced connectivity could support transit-oriented developments, boost demand for commercial and mixed-use developments, and contribute to property value appreciation in areas surrounding the upgraded rail network.
-
Hospitality Sector
-
Kenya Airways secures second Dubai landing slot
During the week, Kenya Airways (KQ) secured a second landing slot at Dubai International Airport, enabling the national carrier to introduce a second daily flight between Nairobi and Dubai from September 1st 2026. The additional frequency follows growing passenger demand on the route and is expected to significantly increase KQ's passenger carrying capacity while enhancing connectivity between Kenya and one of the world's busiest international aviation hubs. The move also comes amid increased competition on the Nairobi–Dubai route following Emirates' introduction of a third daily service.
Going forward, the additional flights are expected to strengthen Kenya's aviation sector by improving connectivity, facilitating trade and tourism, and enhancing Nairobi's position as a regional transport hub. Increased passenger traffic could also support growth in the hospitality, retail, and commercial real estate sectors, particularly around Jomo Kenyatta International Airport (JKIA) and Nairobi's business districts, while reinforcing Kenya's role as a key gateway for international travel and investment.
-
Real Estate Investments Trusts
-
REITs Weekly Performance
On the Unquoted Securities Platform Acorn D-REIT and I-REIT traded at Kshs 29.6 and Kshs 23.8 per unit, respectively, as per the last updated data on 5th June 2026. The performance represented a 48.0% and 18.8% gain for the D-REIT and I-REIT, respectively, from the Kshs 20.0 inception price. The volumes traded for the D-REIT and I-REIT came in at 13.5 mn and 43.3 mn shares, respectively. Additionally, ILAM Fahari I-REIT traded at Kshs 13.8 per share as of 5th June 2026, representing a 31.0% loss from the Kshs 20.0 inception price. The volume traded to date came in at 1.2 mn shares for the I-REIT, REITs offer various benefits, such as tax exemptions, diversified portfolios, and stable long-term profits. However, the ongoing decline in the performance of Kenyan REITs and the restructuring of their business portfolios are hindering significant previous investments. Additional general challenges include:
-
Insufficient understanding of the investment instrument among investors leading to a slower uptake of REIT products,
-
Lengthy approval processes for REIT creation,
-
High minimum capital requirements of Kshs 100.0 mn for REIT trustees compared to Kshs 10.0 mn for pension funds Trustees, essentially limiting the licensed REIT Trustee to banks only
-
The rigidity of choice between either a D-REIT or and I-REIT forces managers to form two REITs, rather than having one Hybrid REIT that can allocate between development and income earning properties
-
Limiting the type of legal entity that can form a REIT to only a trust company, as opposed to allowing other entities such as partnerships, and companies,
-
We need to give time before REITS are required to list – they would be allowed to stay private for a few years before the requirement to list given that not all companies maybe comfortable with listing on day one, and,
-
Minimum subscription amounts or offer parcels set at Kshs 0.1 mn for D-REITs and Kshs 5.0 mn for restricted I-REITs. The significant capital requirements still make REITs relatively inaccessible to smaller retail investors compared to other investment vehicles like unit trusts or government bonds, all of which continue to limit the performance of Kenyan REITs.
We expect the performance of Kenya's Real Estate sector to remain resilient, supported by several factors: i) Real Estate and construction sectors recording improved growth in Q1'2026 projects ii) SGR extension to Nairobi CBD, and iii) Kenya Airways securing a second landing spot in Dubai. However, challenges such the weak investor appetite in listed REITs like ILAM Fahari I-REIT and high capital requirements will continue to constrain the sector's optimal performance
-
Visa Expands Smartphone Payment Tools for Small Businesses
During the week, Visa Inc. rolled out an upgraded suite of digital payment tools across its Visa Accept and Visa Direct platforms, transforming standard smartphones into full-stack point-of-sale infrastructure for small businesses. The solution allows merchants to securely accept contactless card payments directly on a mobile device while utilizing real-time payout capabilities to instantly distribute employee wages, supplier payments, and cross-border remittances without additional hardware. This move is important because it lowers the barrier to digital commerce by removing the high cost and logistical hassle of traditional card terminals for micro-merchants. By allowing standard smartphones to act as both a payment collector and a global remittance hub, Visa is aggressively capturing non-cash transactions in emerging markets, driving merchant digital inclusion, and offering commercial banks a highly scalable way to onboard small businesses into the formal financial ecosystem.
-
Mastercard Schedules Second Quarter 2026 Financial Results
During the week, Mastercard Inc announced that it will release its second quarter 2026 financial results on Thursday, July 30, 2026, followed by a live conference call to discuss its latest performance metrics with the investment community. The announcement comes at a crucial time as the company's stock experienced short-term technical pressure, slipping slightly below its long-term 200-day simple moving average despite posting strong underlying business fundamentals and a projected full-year earnings growth of 15.3%. This move is important because it sets the stage for the market to evaluate Mastercard's financial health and its recent high-profile strategic shifts, such as its massive scale expansion into enterprise blockchain networks, B2B agentic commerce, and digital asset infrastructure. Providing this transparency allows investors to gauge whether the network's steady transaction volume growth and aggressive innovation pipeline will successfully outpace ongoing macroeconomic headwinds and rising regulatory scrutiny over card merchant fees.
-
Circle Partners with Flutterwave to Expand in Africa
During the week, Circle Internet Group made a major cross-border expansion move by securing a strategic investment in African payments giant Flutterwave through its corporate venture arm, Circle Ventures. The partnership aims to integrate Circle’s USD Coin (USDC) settlement directly into Flutterwave’s payment infrastructure, allowing businesses across the continent to collect payments in local African currencies and settle them instantly in digital stablecoins outside traditional banking hours. By embedding a regulated stablecoin into one of the continent's largest fintech networks, the partnership drastically lowers the cost and time required for international corporate transactions and cross-border remittances. This positions digital assets as a practical, day-to-day tool for African B2B commerce rather than a speculative asset paving the way for faster, 24/7 internet-native capital flows across emerging markets.
-
Digital Payments Stock Performance
The table below presents a snapshot of NYSE-listed digital payments stocks, covering Visa, Mastercard, American Express (AXP), Circle, Block and PayPal.X
| Cytonn Report: Digital Payments NYSE stock performance | ||||||
| Company | Year Open 2026 | Price 7/3/2026 | Price 7/10/2027 | w/w change | YTD change | P/E |
| American Express | 372.7 | 352.0 | 350.6 | (0.4%) | (5.9%) | 28.4x |
| Visa | 346.5 | 362.1 | 348.9 | (3.7%) | 0.7% | 28.2x |
| Mastercard | 563.1 | 539.4 | 526.7 | (2.4%) | (6.5%) | 42.6x |
| Circle | 83.5 | 64.6 | 66.1 | 2.4% | (20.8%) | 5.4x |
| Block | 65.2 | 78.8 | 77.3 | (1.9%) | 18.6% | 6.3x |
| PayPal Holdings | 58.1 | 45.5 | 46.3 | 1.8% | (20.4%) | 3.7x |
| Average |
|
|
|
|
| 19.1x |
Source: Visa, AXP, Circle, Mastercard, Block and Paypal financials. NYSE
The stocks are currently trading at an average P/E multiple of 19.1x, indicating that investors are pricing in strong future earnings growth and are prepared to pay a substantial premium for current earnings. This also suggests that valuations may be stretched relative to near-term fundamentals.
We expect the global digital payments sector to continue evolving toward greater payment sovereignty, digital infrastructure modernization, and reduced reliance on traditional card-based payment networks as governments and financial institutions increasingly prioritize control over domestic payment ecosystems. Recent developments, particularly the European Central Bank’s progress toward launching the Digital Euro, signal a growing global shift toward central bank-backed digital payment infrastructure aimed at enhancing financial resilience, improving transaction efficiency, and strengthening monetary independence in an increasingly digital economy. This trend is likely to accelerate competition between public-sector digital currencies and established private payment networks such as Visa Inc. and Mastercard Incorporated, while driving broader innovation across digital finance infrastructure. However, despite these favorable long-term structural tailwinds, valuations within the sector remain relatively elevated, with the companies under coverage currently trading at an average P/E of 19.1x, suggesting that a significant portion of future growth expectations may already be priced in. As such, we expect near-term performance to remain sensitive to regulatory developments, execution risk, and the pace at which both incumbents and emerging digital payment infrastructure providers adapt to the rapidly changing payments landscape.
Disclaimer: The views expressed in this publication are those of the writers where particulars are not warranted. This publication, which follows Section 2 of the Capital Markets Authority Act Cap 485A, is meant for general information only and is not a warranty, representation, advice or solicitation of any nature. Readers are advised in all circumstances to seek the advice of a registered investment advisor
Introduction
Following the release of the FY’2025 results by Kenyan insurance firms, the Cytonn Financial Services Research Team undertook an analysis on the financial performance of the listed insurance companies and the key factors that drove the performance of the sector. In this report, we assess the main trends in the sector, and areas that will be crucial for growth and stability going forward, seeking to give a view on which insurance firms are the most attractive and stable for investment. As a result, we shall address the following:
-
Insurance Penetration in Kenya,
-
Key Themes that Shaped the Insurance Sector in FY’2025,
-
Interest rates
-
Industry Highlights and Challenges,
-
Performance of The Listed Insurance Sector in FY’2025, and,
-
Conclusion & Outlook of the Insurance Sector.
Section I: Insurance Penetration in Kenya
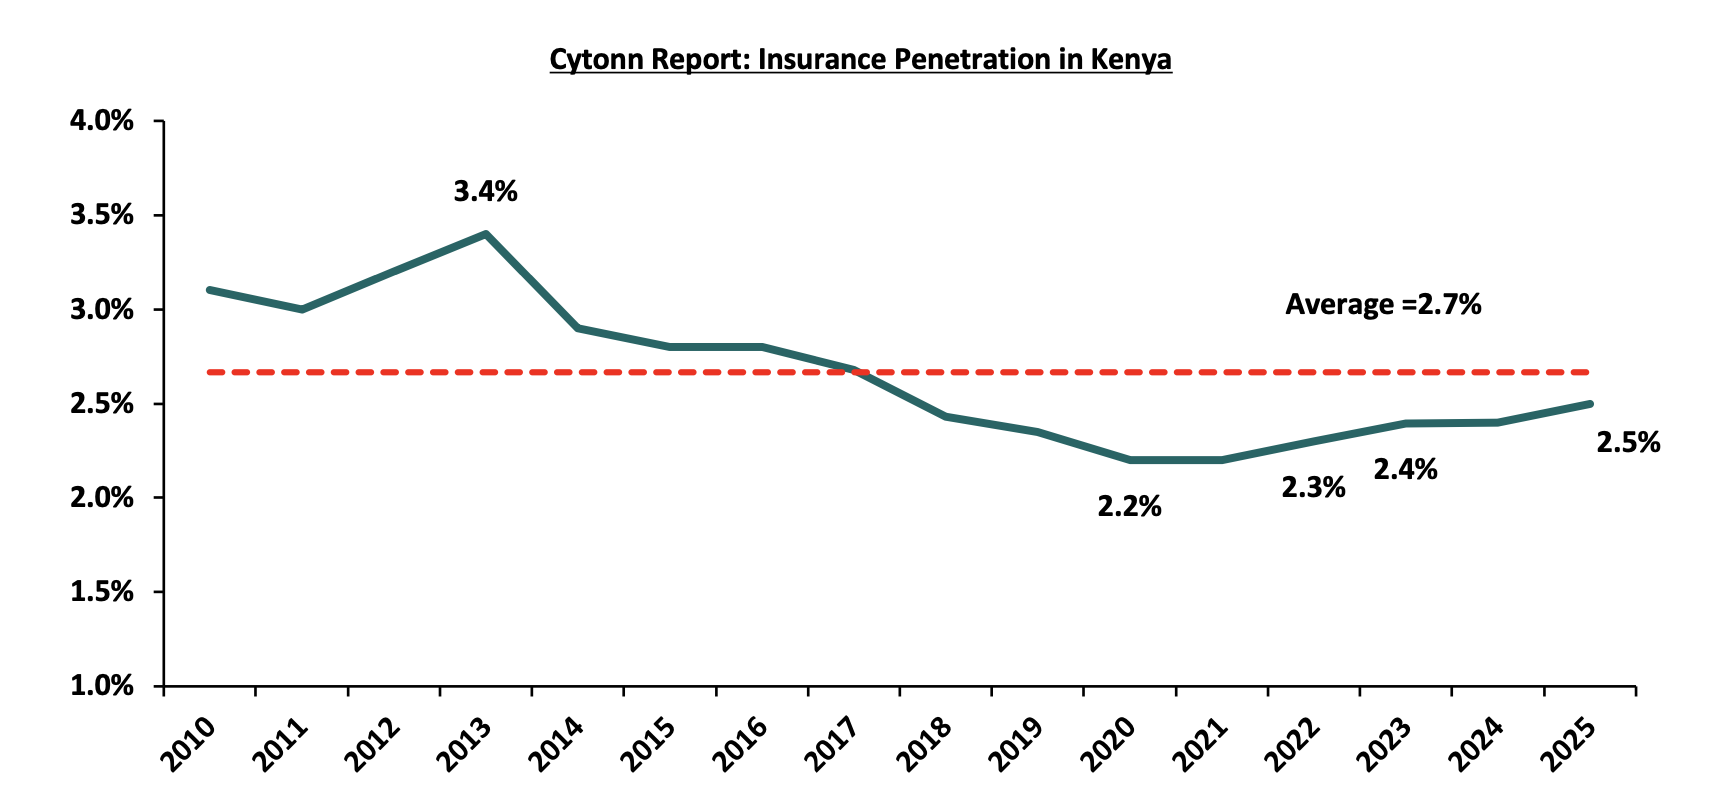
Insurance uptake in Kenya remains low compared to other key economies with the insurance penetration coming in at 2.5% as at end of FY’2025, according to Atlas Magazine. The low penetration rate, which is below the global average of 7.2%, according to Allianz Global Insurance Report 2026, is attributable to the fact that insurance uptake is still seen as a luxury and mostly taken when it is necessary or a regulatory requirement. Notably, Insurance penetration grew by 0.1% points to 2.5% in FY’2025, from 2.4% recorded in FY’2024, despite the mild economic recovery that saw a slight improved business environment in the country. The chart below shows Kenya’s insurance penetration for the last 15 years:
Source: Cytonn Research
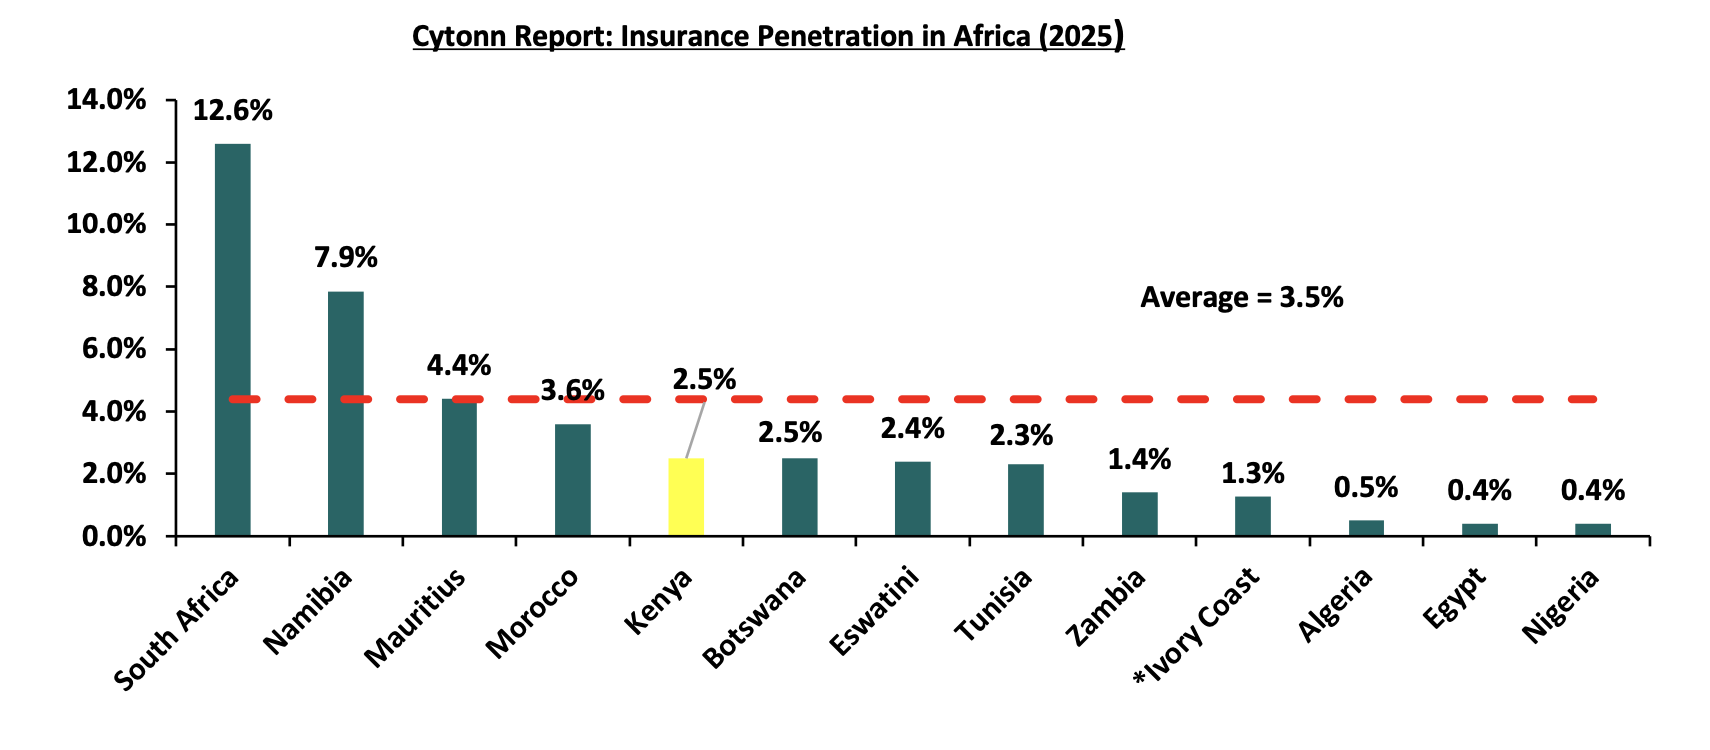
The chart below shows the insurance penetration in other economies across Africa:
*Data as of 2024
Source: Atlas Magazine
Insurance penetration in Africa has remained relatively low, averaging 3.5% in 2025. The below average figures indicate that while digital transformation and product innovation are advancing, they have not yet overcome structural barriers like low disposable income, limited awareness, and skepticism about insurers. South Africa remains the leading in the continent, but most of the continent continues to grapple with underinsurance, leaving households and businesses vulnerable to shocks as the gap between Africa and the rest of the world remans wide.
Section II: Key Themes that Shaped the Insurance Sector in FY’2025
In FY’2025, the country experienced a more favourable operating environment due to relatively stable inflation and a stronger Shilling. Notably, the inflation rate in FY’2025 averaged 4.1%, 0.4% points lower than the 4.5% average in FY’2024, with the Kenyan Shilling having appreciated by 22.9 bps against the USD in FY’2025. As such, according to the Q4’2025 Insurance Regulatory Authority Insurance industry report, the insurance sector showcased resilience recording a 17.6% growth in gross premium to Kshs 464.7 bn in Q4’2025, from Kshs 395.3 bn in Q4’2024. Insurance claims also increased by 12.8% to Kshs 108.7 bn in Q4’2025, from Kshs 95.7 bn in Q4’2024. On the other hand, the overall GDP growth rate improved to 5.3% in Q1’2026, from 4.9% recorded in a similar period last year according to Q1’2026 Quarterly Gross Domestic Product Report. Higher economic growth generally supports the insurance industry by increasing household incomes, business activity, and investment, which, in turn, boosts demand for insurance products and expands the industry's premium base. The strong performance of the insurance sector in 2025 therefore reflects not only favourable macroeconomic conditions but also the sector's ability to capitalize on the country's broader economic expansion.
Notably, the general insurance business contributed 50.7% of the industry’s premium income in Q4’2025 compared to 51.6% contribution, while long term insurance business contributed 48.9% of the industry’s premium income compared to the 48.4% contribution in the same period. During the period, long-term insurance premiums increased by 23.1% to Kshs 235.4 bn from Kshs 191.2 bn in 2024, while general insurance premiums grew by 11.4% to Kshs 227.2 bn from Kshs 203.9 bin in 2024. Microinsurance premiums amounted to Kshs 2.2 bn, bringing the industry's total gross premium income to Kshs 464.7 bn in Q4 2025. Additionally, motor insurance and medical insurance classes of insurance accounted for 68.2% of the gross premium income under the general insurance business, compared to 64.8% recorded in 2024. As for long-term insurance business, the major contributors to gross premiums were deposit administration and life assurance classes accounting for 33.9% and 19.7% respectively in Q4’2025, compared to the 57.5% contribution by the two classes in Q4’2024.
Key highlights from the industry performance:
-
The sector’s investments income increased in Q4’2025 by 21.5% to Kshs 151.7 bn from Kshs 124.9 bn in Q4’2024, mainly attributable to the 24.1% increase in investment income under the long-term insurance business to Kshs 131.1 bn from Kshs 105.6 bn in 2024, coupled with the 6.5% increase in investment income under the general insurance business to Kshs 20.5 bn from Kshs 19.3 bn in 2024, as well as growth in investments under the microinsurance business which amounted to Kshs 60.5 mn,
-
Insurance uptake improved in 2025, with industry gross premiums increasing by 17.6% to Kshs 464.7 bn from Kshs 395.3 bn in 2024. The growth was driven by increased activity in both the long-term and general insurance segments, reflecting the sector’s resilience amid improving macroeconomic conditions. Nevertheless, low insurance penetration and limited awareness of insurance products continue to constrain the industry's growth potential.
-
Enhanced convenience and operational efficiency driven by the increased adoption of alternative distribution and premium collection channels, including bancassurance, digital platforms, and strengthened agency networks. In 2025 and 2026, insurers continued to expand partnerships with banks and telecommunications companies to improve market reach and customer access. Notable examples include insurers such as Britam, CIC, Jubilee, and Sanlam, which have increasingly leveraged mobile platforms and digital channels, alongside Safaricom’s entry into insurance distribution, to streamline premium collection and widen insurance penetration, and
-
Technological advancements and innovation have transformed the insurance industry by enabling premium payments and policy servicing through mobile phones and digital platforms. The growing adoption of “Lipa Mdogo Mdogo” financing models for smartphones and other gadgets has accelerated smartphone penetration by allowing consumers to acquire devices through flexible instalment plans of up to twelve months. Increased smartphone ownership has, in turn, expanded access to digital insurance services, mobile premium payments, and embedded insurance products. This trend presents significant opportunities for insurers to develop device, health, and microinsurance products tailored to low-income consumers, many of whom are accessing insurance for the first time through digital ecosystems.
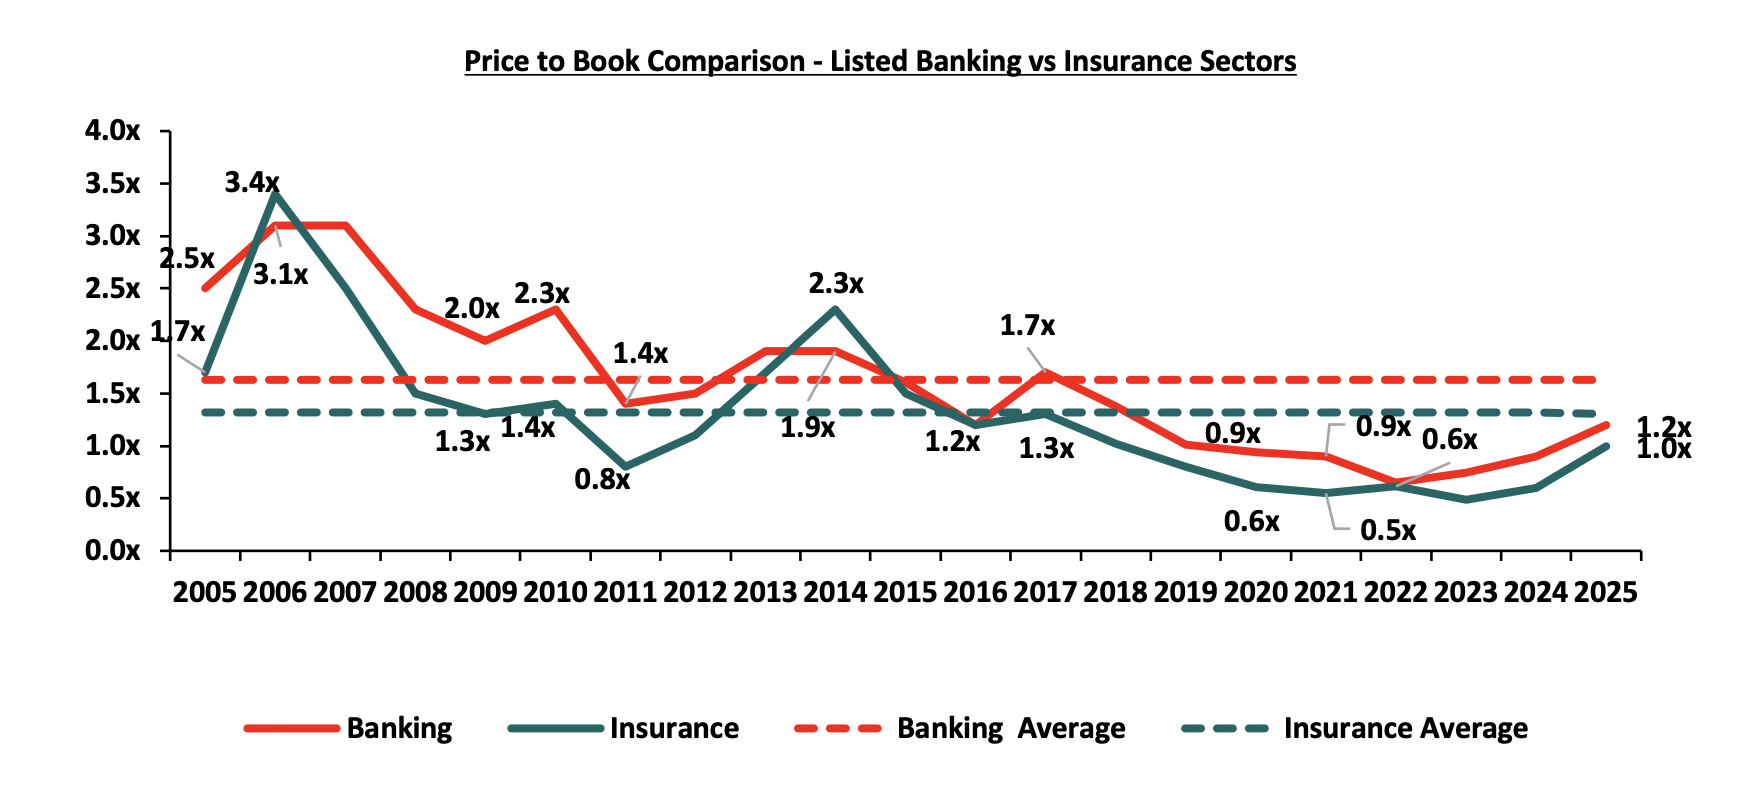
On valuations, listed insurance companies are trading at a price to book (P/Bv) of 1.0x, lower than listed banks at 1.2x, but both are lower than their 20-year historical averages of 1.3x and 1.6x, for the insurance and banking sectors respectively. These two sectors are attractive for long-term investors supported by the strong economic fundamentals. The chart below shows the price to book comparison for Listed Banking and Insurance Sectors:
Source: Cytonn Research
The key themes that have continued to drive the insurance sector include:
-
Technology and Innovation
The Kenyan insurance industry, once slow to embrace digital transformation, has in recent years accelerated its adoption of technology, reshaping how products are distributed and consumed. CIC Group set the pace in 2024 with the launch of Easy Bima, a digital motor insurance product that allowed customers to spread comprehensive premiums into equal monthly instalments. This innovation directly addressed affordability challenges, enabling middle‑income households and SMEs to maintain coverage without the burden of lump‑sum payments. Jubilee Insurance followed in 2025 with J‑Force, a fully digital distribution platform designed to simplify policy administration and client onboarding. By equipping agents with real‑time analytics and streamlined workflows, Jubilee improved efficiency and reduced issuance times, strengthening customer retention in a highly competitive market. As of 2026, the sector has moved beyond pilot projects into full‑scale digital integration. Britam introduced AI‑driven claims automation, cutting settlement times from weeks to mere hours while reducing fraud through predictive analytics. Sanlam Kenya began piloting blockchain technology for policy issuance and claims verification, enhancing transparency and reducing disputes, particularly in corporate insurance. Collectively, these innovations have transformed consumer expectations. Insurance is increasingly perceived as simple, digital, and responsive rather than opaque and complex. The industry’s embrace of AI, blockchain, and mobile platforms has not only boosted efficiency and trust but also extended coverage to previously underserved segments, marking a decisive shift in Kenya’s insurance landscape.
-
Regulation
To position the sector within a globally competitive financial services landscape, the regulator has been actively implementing regulations aimed at tackling both longstanding and emerging challenges. The COVID-19 environment proved challenging especially on the regulatory front, as it was a balance between remaining prudent as an underwriter and adhering to the set regulations given the negative effects the pandemic. Regulations used for the insurance sector in Kenya include the Insurance Act Cap 487 and its accompanying schedule and regulations, Retirement Benefits Act Cap 197 and The Companies Act. In FY’2025, regulation remained a key aspect affecting the insurance sector and the key themes in the regulatory environment include;
-
IFRS 17- IFRS 17, Insurance Contracts, replaced IFRS 4 and became effective for annual periods beginning on or after 1st January 2023. The standard establishes the principle for recognition, measurement, presentation and disclosure of insurance contracts with the objective of ensuring insurance companies provide relevant information that faithfully represents the contracts. Kenyan insurers have now reported under the standard for multiple financial years, and the sustained rise in claims-driven combined ratios seen across FY’2024 and FY’2025 results reflects, in part, the standard's more granular recognition of insurance service expenses. The standard continues to give better information on profitability by providing more insights about current and future profitability of insurance contracts. Separation of financial and insurance results in the income statement continues to allow for better analysis of core performance for the entities and better comparability of insurance companies, and,
-
Risk Based Supervision - IRA has been implementing risk-based supervision through guidelines that require insurers to maintain a capital adequacy ratio of at least 200.0% of the minimum capital, with insurers falling below the 100.0% floor subject to regulatory intervention by the Authority. The risk-based capital requirement is derived by aggregating the capital charges for insurance risk, market risk and credit risk using the square root of the sum of their squares to account for diversification benefits, with the operational risk charge then added to arrive at the total requirement. This sits above hard capital floors set out in the Insurance Act, which require general insurers to hold the highest of Kshs 600.0 mn, the IRA-determined risk-based capital, or 20.0% of net earned premiums from the preceding financial year, while life insurers must hold the highest of Kshs 400.0 mn, the risk-based capital, or 5.0% of life business liabilities for the year. The regulation requires insurers to monitor capital adequacy and solvency margins on a quarterly basis, with the main objective being to safeguard the insurer's ability to continue as a going concern and provide shareholders with adequate returns. Looking ahead, the IRA is set to roll out Risk-Based Supervision Phase II, which will further tie capital held to actual risk exposure. We expect more mergers within the industry as smaller companies struggle to meet the minimum capital adequacy ratios. We also expect insurance companies to adopt prudential practices in managing and taking on risk and reduction of premium undercutting in the industry as insurers will now have to price risk appropriately.
-
Kenya’s Stake in ATIDI: Kenya deepened its commitment to regional risk financing by increasing its shareholding in the African Trade & Investment Development Insurance (ATIDI) to Kshs 8.4 bn from Kshs 3.2 bn. The increased investment enhances the country's influence in shaping regional insurance and risk mitigation frameworks while reinforcing support for African-owned financial institutions that are mobilizing capital and de-risking investments to drive the continent's development agenda.
-
Regulatory Reforms and Compliance Requirements: In FY2025, regulation remained a key factor affecting the insurance sector. Key regulatory developments included the proposed strengthening of corporate governance, risk management, market conduct, claims handling, and consumer protection frameworks, alongside the introduction of new classes of business such as virtual-asset and index insurance. The reforms also proposed higher licensing fees for insurers, reinsurers, and intermediaries, thereby increasing compliance requirements across the industry. Further, the Insurance (Amendment) Regulations, 2025 increased the compulsory cession to the Kenya Reinsurance Corporation from 25.0% to 20.0% of each insurer's general business reinsurance treaties, with the requirement remaining in force until the corporation is privatized. In addition, the regulatory landscape in 2026 was shaped by the Insurance Regulatory Authority's circular on bancassurance remuneration structures, which clarified that commissions, administrative fees, profit-sharing arrangements, and other payments made to intermediaries must remain within the limits prescribed under the Insurance Act. The directive, which is currently being challenged in court by the Kenya Bankers Association, underscores the growing regulatory focus on transparency, compliance, and consumer protection within insurance distribution channels.
-
Capital Raising and Share Purchase
CIC Insurance’s decision to raise Kshs 1.8 bn through asset disposals, particularly land sales, was a strategic move aimed at strengthening its balance sheet. By converting non‑core assets into liquid capital, CIC improved its solvency margins and ensured compliance with risk‑based capital adequacy requirements. This injection of liquidity gave the company breathing room to expand its motor and microinsurance lines, positioning it more competitively in segments that serve middle‑income households and SMEs. The shift reflects a deliberate transition from asset‑heavy holdings to a leaner, more agile structure capable of supporting growth in a regulatory environment that demands stronger capital buffers. Equity Group Holdings, on the other hand, pursued an expansionary strategy by incorporating three new insurance subsidiaries, including a microinsurance company capitalized at Kshs 192.0. Leveraging its extensive mobile and agency banking network, Equity embedded insurance into everyday financial transactions, widening access to coverage for low‑income earners who had traditionally been underserved. This move not only diversified Equity’s revenue streams but also aligned insurance with its broader financial services ecosystem, reinforcing its position as a one‑stop financial solutions provider.
A Kshs 2.5 bn rights issue raised SanlamAllianz and Hubris Holdings' combined stake in Sanlam Kenya to 71.5%, with the CMA granting an exemption from the mandatory takeover rules and Jubilee Holdings completed the sale of its residual general insurance stakes to SanlamAllianz Africa: 34.0% in Kenya, Uganda and Mauritius, plus 19.0% in Burundi and 15.0% in Tanzania, for Kshs 4.5 bn. This closed a five-year exit that began in 2020, when Jubilee sold controlling stakes to Allianz SE for Kshs 10.8 bn. Sanlam Kenya then transferred its general insurance book (assets Kshs 2.78 bn, liabilities KSh 2.76 bn) to Jubilee Allianz Kenya, and rebranded to Sanlam Allianz Holdings (Kenya) Plc.
-
Section III: Interest rates
The interest rate environment has been on a declining trend in FY’2025, a reversal from the elevated rates recorded in 2024. With Central Bank rates declining through FY’2025, insurers capitalized on longer-tenor treasury bills and bonds. Despite the moderation in yields, the insurance sector maintained a strong preference for government securities, which accounted for 75.2% of insurers' investment portfolios in both the long-term and general insurance businesses. As a result, insurers continued to increase their allocations to government securities, with placements under long-term insurance rising by 24.4% to Kshs 804.2 bn in 2025 from Kshs 646.3 bn in 2024, while placements under general insurance grew by 18.5% to Kshs 113.2 billion from Kshs 95.5 bn over the same period. The sustained increase in holdings of government securities, despite the lower-yield environment, reflects insurers' continued preference for low-risk and liquid assets that are well suited to meeting policyholder obligations and matching long-term liabilities.
In H1’2026, The Central Bank of Kenya's Monetary Policy Committee (MPC) cut the Central Bank Rate (CBR) by 25.0 bps to 8.75% at its February 10, 2026 meeting, extending an easing cycle that had by then reduced the CBR by a cumulative 425.0 bps from its cycle high of 13.0% in June 2024. The Committee subsequently held the CBR at 8.75% at both its April 8, 2026 and June 9, 2026 meetings.
We expect the rate environment to weigh on insurers' investment income growth into H2’2026, given the sector's heavy skew toward government securities, which made up 78.2% of long-term insurers' investments and 59.3% of general insurers' investments as at Q4 2025. On the liability side, the lower rate environment reduces the discount rates typically applied to actuarial liabilities and annuity or guaranteed-return products, which could push up reserving requirements for life insurers with rate-sensitive guarantees, further compressing the net benefit of the easing cycle to date. We expect insurers to keep favouring government securities given this dominant allocation, but with growing incentive to extend duration on new purchases to lock in still-elevated long-end yields before any further easing resumes, and to watch the MPC's August 2026 meeting closely for signals on whether the current hold shifts toward a hike
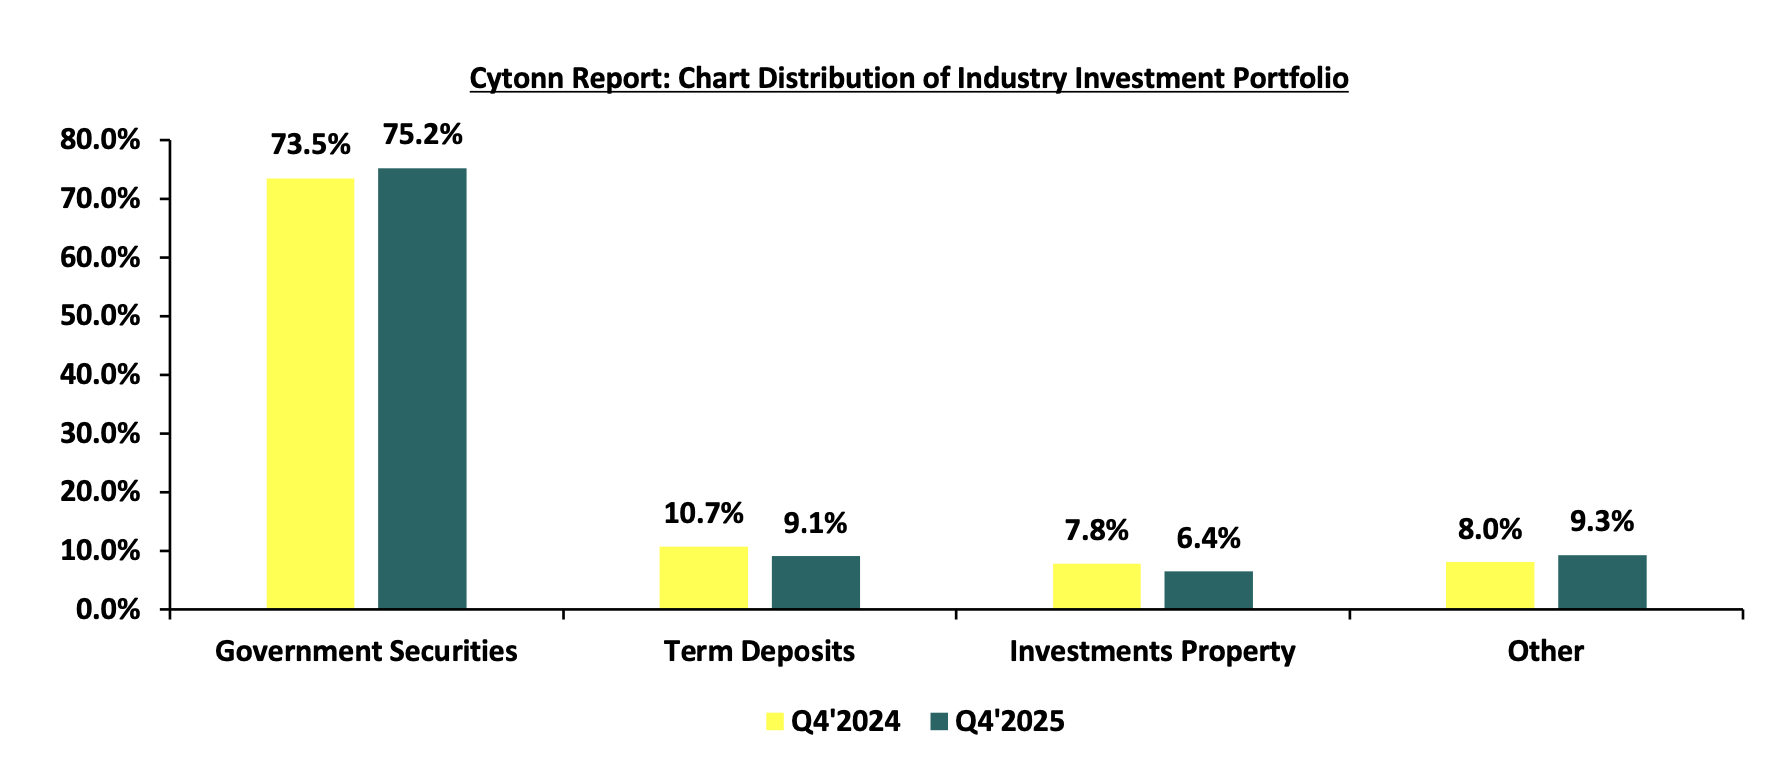
Source: IRA
Section IV: Industry Highlights and Challenges
The insurance sector has recorded consistent growth over the past ten years, though recent global uncertainties including the impact of regional conflicts and supply chain disruptions have introduced second guesses about the pace of expansion. Even so, the industry is expected to continue growing at a moderate rate, supported by Kenya’s improving economic fundamentals and a steady rise in insurance premiums, factors which are likely to enhance the sector’s capacity to maintain profitability.
On the regulatory front, the Finance Act 2026 introduced several provisions with direct implications for insurers. One of the most significant changes was the transfer of taxation from the life insurance fund to statutory funds, aligning the tax framework more closely with the Insurance Act and broadening the tax base for insurance companies. The Act also removed VAT exemptions on payment-processing services, subjecting digital premium collection channels and other related transactions to the standard 16% VAT rate, thereby increasing operational costs. In addition, the legislation introduced tighter tax administration and reporting requirements, compelling insurers to strengthen their compliance systems and internal controls. While these reforms are intended to enhance revenue collection and harmonize fiscal and regulatory frameworks, they impose additional financial and administrative burdens on insurers, making regulatory compliance an increasingly important challenge for the industry.
Industry Challenges:
-
Insolvency: A major challenge facing Kenya’s insurance industry is the financial instability and insolvency of key players, as evidenced by recent regulatory interventions involving insurers such as Trident Insurance Company and KUSCCO Mutual Assurance. Owing to prolonged financial difficulties, non-compliance with regulatory requirements, governance weaknesses, and liquidity constraints, these institutions have faced heightened scrutiny and intervention by the Insurance Regulatory Authority (IRA). The difficulties experienced by these companies reflect broader structural problems within the sector, including inadequate risk management practices, weak corporate governance, and exposure to unprofitable business lines. The exclusion of some insurers from recent industry reports due to non-compliance with statutory reporting requirements further highlights the challenges facing the industry. In the third-quarter 2025 industry release, Trident Insurance Company and KUSCCO Mutual Assurance Limited were omitted from the analysis because they had failed to meet submission requirements.
The financial distress affecting insurers undermines consumer confidence, disrupts policyholders who are forced to seek alternative coverage, and poses risks to the overall stability of the insurance market. To restore confidence and strengthen the resilience of the sector, industry stakeholders and regulators must address persistent weaknesses in corporate governance, enhance risk management frameworks, improve liquidity positions, and enforce stricter regulatory compliance. -
Insurance fraud: Insurance Fraud is an intentional deceit performed by an applicant or policyholder for financial advantage. In recent years, there has been an upsurge in fraudulent claims, particularly in medical and motor insurance, with estimates indicating that one in every five medical claims are fraudulent. This is mainly through exaggerating medical costs and hospitals by making patients undergo unnecessary tests. Fraudsters also collude with hospitals to file false claims, including fabricated surgeries and treatments, while some healthcare providers inflate charges for insured patients. To curb these challenges, the industry has adopted implementing blockchain technology and artificial intelligence to detect and prevent fraud. In 2025, the number of fraud cases reported to the Insurance Fraud Investigation Unit (IFIU) decreased by 21.7% to 224 cases, from 184 cases reported in 2024,
-
High Market competition: Despite Kenya’s relatively low insurance penetration, the insurance industry remains highly fragmented, with numerous insurers competing for a limited customer base. According to the Insurance Regulatory Authority (IRA), the sector comprises insurance companies, reinsurers, and micro insurers operating across life, general, and microinsurance segments. Competition has intensified with the entry and expansion of non-traditional players, particularly financial institutions and technology companies offering insurance products through digital platforms and bancassurance arrangements. Recent developments have further increased competitive pressure on traditional insurers. Telecommunications firms and banks have leveraged their extensive customer networks and technological capabilities to expand into the insurance market. Safaricom’s entry into insurance distribution and Equity Group’s expansion through Equity Life Assurance have accelerated the convergence between the insurance, banking, and telecommunications sectors. These developments have compelled traditional insurers to innovate and diversify their products in order to retain market share. The highly competitive environment has also encouraged aggressive pricing strategies, including premium undercutting, whereby insurers offer premiums below actuarially sustainable levels to attract and retain customers. While such practices may increase market share in the short term, they can negatively affect underwriting profitability and threaten the long-term financial sustainability of insurers. The challenge is compounded by persistently low insurance uptake in Kenya, which limits the industry’s ability to grow organically and intensifies competition among market participants. At the same time, insurers are increasingly investing in product innovation to expand coverage and attract new customers. During the third quarter of 2025 alone, the IRA approved forty-five new or repackaged insurance products across general insurance, long-term insurance, and microinsurance business lines, reflecting the industry's efforts to remain competitive in a rapidly evolving market.
-
Declining consumer confidence in the insurance industry: Consumer complaints against insurers remained elevated in 2025, reflecting persistent challenges in claims settlement and customer service. During the year, the Insurance Regulatory Authority (IRA) received 1,747 complaints from policyholders and beneficiaries, with general insurers accounting for 76.3% of the complaints and long-term insurers 23.7%. Most complaints related to delayed or disputed claims settlements, policy interpretation and other service delivery issues. Such experiences continue to erode consumer trust, undermining confidence in the insurance industry and slowing the uptake of insurance products,
-
Macroeconomic Uncertainty Global conflicts, commodity price volatility, and supply chain disruptions have created a fragile economic outlook. For insurers, this translates into unpredictable investment returns and slower premium growth. The uncertainty makes long‑term planning more difficult, forcing companies to adopt conservative strategies while still trying to meet growth targets, and,
Section V: Performance of the Listed Insurance Sector in FY’2025
The table below highlights the performance of the listed insurance sector, showing the performance using several metrics, and the key take-outs of the performance.
|
Listed Insurance Companies FY’2025 Earnings and Growth Metrics |
||||||||||
|
Insurance |
Core EPS Growth |
Claims growth |
Loss Ratio |
Expense Ratio |
Combined Ratio |
ROaE |
ROaA |
|||
|
Sanlam |
2.4% |
(3.2%) |
(11.4%) |
73.5% |
40.0% |
113.5% |
26.2% |
2.2% |
||
|
Liberty |
(51.9%) |
(55.1%) |
23.8% |
72.4% |
73.1% |
145.5% |
6.4% |
1.4% |
||
|
Jubilee Insurance |
17.6% |
16.5% |
11.9% |
89.9% |
61.0% |
150.8% |
10.4% |
2.2% |
||
|
Britam |
10.0% |
10.9% |
(8.5%) |
74.1% |
50.4% |
124.5% |
18.0% |
1.2% |
||
|
CIC |
(82.0%) |
11.8% |
(9.1%) |
95.8% |
104.4% |
200.2% |
4.5% |
1.3% |
||
|
*FY'2025 Weighted Average |
(4.9%) |
8.8% |
0.4% |
82.7% |
63.3% |
146.0% |
12.7% |
1.6% |
||
|
**FY'2024 Weighted Average |
52.3% |
32.3% |
7.0% |
82.3% |
45.0% |
127.3% |
9.0% |
1.9% |
||
|
*Market cap weighted as at 07/10/2026 |
||||||||||
|
**Market cap weighted as at 07/11/2025 |
||||||||||
The key take-outs from the above table include;
-
Core EPS growth recorded a weighted decline of 4.9% in FY’2025, a reversal from the weighted growth of 52.3% recorded in FY’2024. The decline in earnings was largely weighed down by the increase in the expense ratio to 63.3% in FY’2025, from 45.0% in FY’2024. CIC’s core EPS declined the most by 82.0% in FY'2025, followed by Liberty at 51.9%, attributable to a 104.4% expense ratio and 73.1% expense ratio, respectively.
-
Insurance revenue grew at a slower pace of 8.8% in FY’2025, compared to a growth of 32.3% in FY’2024, while claims growth also slowed markedly to 0.4% in FY’2025, from the 7.0% growth recorded in FY’2024 on a weighted average basis,
-
The loss ratio across the sector was relatively unchanged at 82.7% in FY’2025, from 82.3% in FY’2024,
-
The expense ratio increased to 63.3% in FY’2025, from 45.0% in FY’2024, pointing to reduced operating efficiency across the sector,
-
The insurance core business remained unprofitable, with the combined ratio worsening to 146.0% as at FY’2025, from 127.3% in FY’2024, and,
-
On average, the insurance sector delivered a Return on Average Equity (ROaE) of 12.7%, an increase from a weighted Return on Average Equity of 9.0% in FY’2024, even as Return on Average Assets (ROaA) declined to 1.6% in FY’2025, from 1.9% in FY’2024.
Section VI: Conclusion & Outlook of the Insurance Sector
Kenya's insurance industry enters 2026 against a relatively stable macroeconomic backdrop. Inflation remained within the Central Bank of Kenya's target range of 2.5%-7.5% throughout 2025, supported by lower food and energy prices, while the Monetary Policy Committee (MPC) maintained a measured approach to monetary policy to support economic activity and preserve price stability. At the same time, the Kenyan Shilling remained relatively stable against major international currencies, helping contain imported inflation and improve business planning. These macroeconomic conditions, coupled with continued digital transformation and regulatory reforms, provide a supportive environment for the insurance sector. However, insurance penetration remains low at 2.5%, highlighting significant untapped market potential. Going forward, insurers that strengthen consumer trust, improve operational efficiency and develop affordable, customer-centric products will be better positioned to capitalize on the sector's long-term growth opportunities.
The insurance sector should build on the following strategies to sustain growth and capitalize on the economic upturn:
The outlook for the insurance industry remains positive, supported by structural growth opportunities across retail insurance, health insurance, digital distribution and regional expansion. The increasing adoption of technology, changing consumer behaviour and growing demand for financial protection products are expected to reshape how insurers design, distribute and price insurance solutions. To sustain growth and improve profitability, insurers will need to focus on the following strategic priorities:
-
Strengthening consumer trust and improving claims experience - Improving customer confidence will remain central to expanding insurance uptake. Despite growth in premiums, complaints around claims delays, policy interpretation and service delivery continue to affect perceptions of the industry. Insurers will need to enhance transparency, simplify policy wording, improve claims turnaround times and adopt customer-centric approaches to rebuild trust and encourage greater voluntary uptake of insurance products.
-
Leveraging technology to expand insurance accessibility - Digital transformation will remain a key enabler of insurance growth, particularly in reaching underserved and informal market segments. Insurers are expected to increasingly adopt artificial intelligence, data analytics, automation and embedded insurance models to improve underwriting accuracy, reduce operational costs and deliver personalized products. Partnerships with fintechs, mobile network operators and digital platforms will provide opportunities to distribute affordable microinsurance and usage-based insurance products at scale.
-
Expanding alternative sources of capital and investment opportunities - The establishment of frameworks such as the National Infrastructure Fund presents opportunities for insurers, pension funds and other institutional investors to participate in long-term development financing. By diversifying investment portfolios into infrastructure, climate-related assets and other alternative investments, insurers can enhance investment returns while supporting broader economic development objectives.
-
Enhancing regulatory compliance and risk management - Regulatory expectations will continue to evolve as the industry adapts to emerging risks, including climate change, cybersecurity threats and changing accounting requirements under IFRS 17. Insurers will need to strengthen governance frameworks, improve capital management and adopt stronger enterprise risk management practices to remain resilient and competitive.
-
Developing innovative products for emerging consumer needs - Growth opportunities exist in segments such as health insurance, agriculture insurance, climate risk coverage, retirement solutions and small business protection. With changing demographics, rising healthcare costs and increased exposure to climate-related events, insurers that develop affordable and relevant products will be better positioned to capture new market segments.
-
Regional expansion and integration - Kenya's position as a financial hub in East Africa provides insurers with opportunities to diversify revenue streams through regional operations. Expanding into underserved markets across Africa can help insurers reduce concentration risks while benefiting from increasing demand for risk management solutions as economies continue to develop. Kenya's decision to increase its shareholding in the African Trade & Investment Development Insurance (ATIDI) to Kshs 8.4 bn
-
from Kshs 3.2 bn reinforces its commitment to strengthening African financial institutions. The move is expected to enhance Kenya's influence in regional risk financing frameworks and support the development of stronger African-led mechanisms for mobilising capital and de-risking investment across the continent.
Overall, Kenya's insurance sector has significant room for expansion, but unlocking this potential will require a shift from traditional insurance models towards more accessible, technology-driven and customer-focused solutions. The insurers that successfully address trust barriers, embrace innovation and diversify their sources of growth will be best positioned to capture the long-term opportunities presented by the evolving insurance landscape.
Disclaimer: The views expressed in this publication are those of the writers where particulars are not warranted. This publication is meant for general information only and is not a warranty, representation, advice or solicitation of any nature. Readers are advised in all circumstances to seek the advice of a registered investment advisor.

- Talk to us
- Kenya
- P.O Box 20695 - 00200, Nairobi, Kenya
- Cell +254709101200
- Tel +254709101200
- WhatsApp +254741676635
- United States
- +254709101200
- DOWNLOAD OUR APP
-


- Kenya
- 8th Floor, Pinetree Plaza, Kaburu Drive, Ngong Road, Nairobi, Kenya
- USA
- Suite 1150, 1775 Eye Street NW, USA, Washington DC 20006, USA
- Investments
- High Yield
- Private Equity
- Real Estate
- Real Estate
- RiverRun Estates
- Cytonn Towers
- The Ridge
- Taraji Heights
- The Alma