Kenya H1’2024 Insurance Report, & Cytonn Weekly #42/2024
By Investments, Oct 20, 2024
Executive Summary
Fixed Income
During the week, T-bills were oversubscribed for the third consecutive week, with the overall oversubscription rate coming in at 337.2%, higher than the oversubscription rate of 304.3% recorded the previous week. Investors’ preference for the shorter 91-day paper persisted, with the paper receiving bids worth Kshs 17.4 bn against the offered Kshs 4.0 bn, translating to an oversubscription rate of 434.3%, albeit lower than the oversubscription rate of 462.7% recorded the previous week. The subscription rates for the 182-day and 364-day papers increased significantly to 341.9% and 293.7% respectively from the 287.9% and 257.4% respectively recorded the previous week. The government accepted a total of Kshs 34.6 bn worth of bids out of Kshs 80.9 bn bids received, translating to an acceptance rate of 42.7%. The yields on the government papers were on a downward trajectory, with the yields on the 364-day, 182-day, and 91-day papers decreasing by 42.7 bps, 45.9 bps and 22.4 bps to 15.9%, 15.6% and 14.8% respectively from 16.3%, 16.1% and 15.0% respectively recorded the previous week;
Also, during the week, the Central Bank of Kenya released the auction results for the tap sale of FXD1/2022/010 with a tenor to maturity of 7.6 years, and a fixed coupon rate of 13.5%. The bond was oversubscribed with the overall subscription rate coming in at 110.0%, receiving bids worth Kshs 16.5 bn against the offered Kshs 15.0 bn. The government accepted bids worth Kshs 15.1 bn, translating to an acceptance rate of 91.5%. The weighted average yield of accepted bids for the bond came in at 17.0%, which was similar to the reopened sale yield earlier this month. With the Inflation rate at 3.6% as of September 2024, the real return of the bond is 13.4%;
During the week, the National Treasury published the Annual Borrowing Plan for FY’2024/25, with details of the government’s borrowing requirements for the fiscal year. The 2024 Annual Borrowing Plan outlines the requirements and sources of borrowing for FY’2024/25 as specified in Supplementary Estimates 1 for FY’2024/2025 and the 2024 Medium Term Debt Management Strategy (MTDS);
During the week, the National Treasury gazetted the revenue and net expenditures for the third month of FY’2024/2025, ending 30th September 2024, highlighting that the total revenue collected as at the end of September 2024 amounted to Kshs 592.0 bn, equivalent to 22.5% of the revised estimates of Kshs 2,631.4 bn for FY’2024/2025 and is 90.0% of the prorated estimates of Kshs 657.9 bn;
Equities
During the week, the equities market was on an upward trajectory, with NSE 10 gaining the most by 4.8%, while NSE 25, NASI, and NSE 20 gained by 4.7%, 4.0%, and 3.0% respectively, taking the YTD performance to gains of 34.4%, 31.6%, 24.5% and 23.4% for NSE 10, NSE 25, NASI and NSE 20 respectively. The equities market performance was mainly driven by gains recorded by EABL, KCB Group, and SCBK of 16.1%, 6.5%, and 6.3% respectively. The gains were however weighed down by losses recorded by large-cap stocks such as BAT of 0.1%;
Real Estate
On the Unquoted Securities Platform, Acorn D-REIT and I-REIT traded at Kshs 25.4 and Kshs 22.2 per unit, respectively, as per the last updated data on 18th October 2024. The performance represented a 27.0% and 11.0% gain for the D-REIT and I-REIT, respectively, from the Kshs 20.0 inception price. Additionally, ILAM Fahari I-REIT traded at Kshs 11.0 per share as of 18th October, 2024, representing a 45.0% loss from the Kshs 20.0 inception price;
Focus of the Week
Following the release of H1’2024 results by insurance companies, the Cytonn Financial Services Research Team undertook an analysis on the performance of the 5 listed insurance companies in Kenya, identified the key factors that influenced their performance, and gave our outlook for the insurance sector going forward;
Investment Updates:
- Weekly Rates:
- Cytonn Money Market Fund closed the week at a yield of 18.1% p.a. To invest, dial *809# or download the Cytonn App from Google Play store here or from the Appstore here;
- We continue to offer Wealth Management Training every Tuesdays, from 7:00 pm to 8:00 pm and Saturdays, from 10:00 am to 11:00 am. The training aims to grow financial literacy among the general public. To register for any of our Wealth Management Trainings, click here;
- If interested in our Private Wealth Management Training for your employees or investment group, please get in touch with us through wmt@cytonn.com;
- Cytonn Insurance Agency acts as an intermediary for those looking to secure their assets and loved ones’ future through insurance namely; Motor, Medical, Life, Property, WIBA, Credit and Fire and Burglary insurance covers. For assistance, get in touch with us through insuranceagency@cytonn.com;
- Cytonn Asset Managers Limited (CAML) continues to offer pension products to meet the needs of both individual clients who want to save for their retirement during their working years and Institutional clients that want to contribute on behalf of their employees to help them build their retirement pot. To more about our pension schemes, kindly get in touch with us through pensions@cytonn.com;
Real Estate Updates:
- For more information on Cytonn’s real estate developments, email us at sales@cytonn.com;
- Phase 3 of The Alma is now ready for occupation and the show house is open daily. To join the waiting list to rent, please email properties@cytonn.com;
- For Third Party Real Estate Consultancy Services, email us at rdo@cytonn.com;
- For recent news about the group, see our news section here;
Hospitality Updates:
- We currently have promotions for Staycations. Visit cysuites.com/offers for details or email us at sales@cysuites.com;
Money Markets, T-Bills Primary Auction:
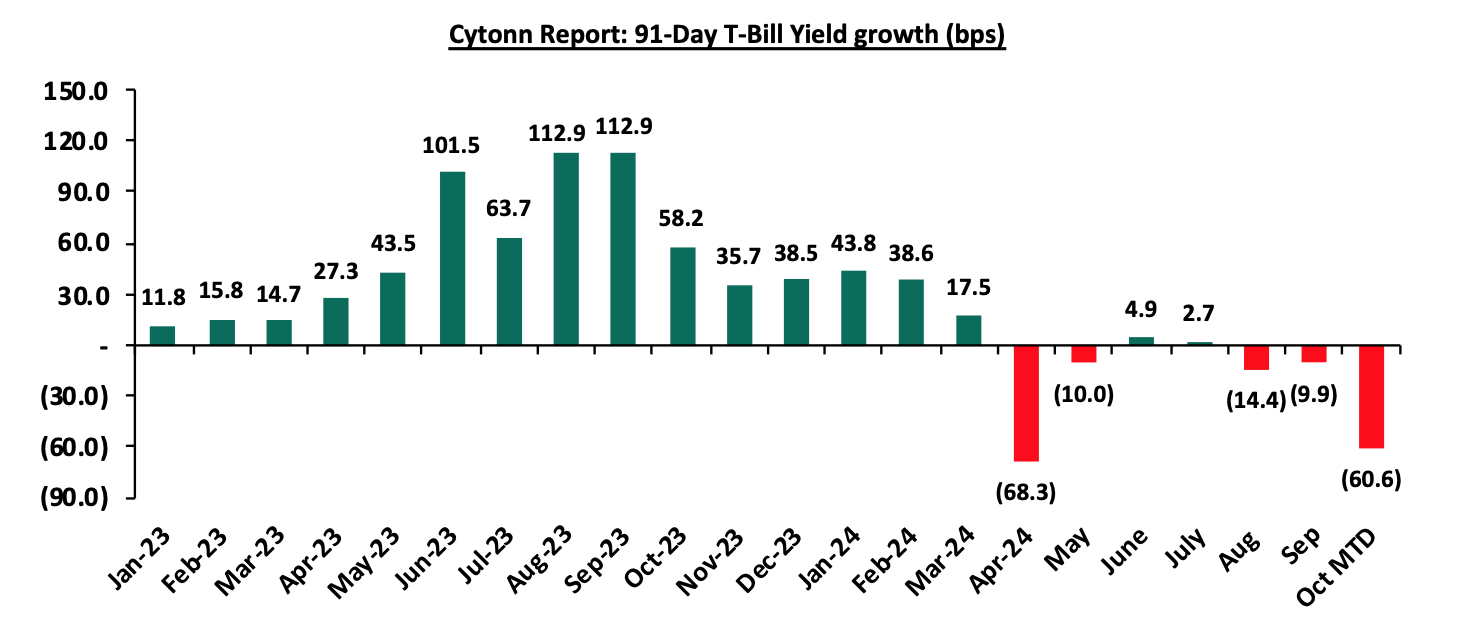
During the week, T-bills were oversubscribed for the third consecutive week, with the overall oversubscription rate coming in at 337.2%, higher than the oversubscription rate of 304.3% recorded the previous week. Investors’ preference for the shorter 91-day paper persisted, with the paper receiving bids worth Kshs 17.4 bn against the offered Kshs 4.0 bn, translating to an oversubscription rate of 434.3%, albeit lower than the oversubscription rate of 462.7% recorded the previous week. The subscription rates for the 182-day and 364-day papers increased significantly to 341.9% and 293.7% respectively from the 287.9% and 257.4% respectively recorded the previous week. The government accepted a total of Kshs 34.6 bn worth of bids out of Kshs 80.9 bn bids received, translating to an acceptance rate of 42.7%. The yields on the government papers were on a downward trajectory, with the yields on the 364-day, 182-day, and 91-day papers decreasing by 42.7 bps, 45.9 bps, and 22.4 bps to 15.9%, 15.6%, and 14.8% respectively from 16.3%, 16.1% and 15.0% respectively recorded the previous week. The chart below shows the yield growth rate for the 91-day paper over the period:
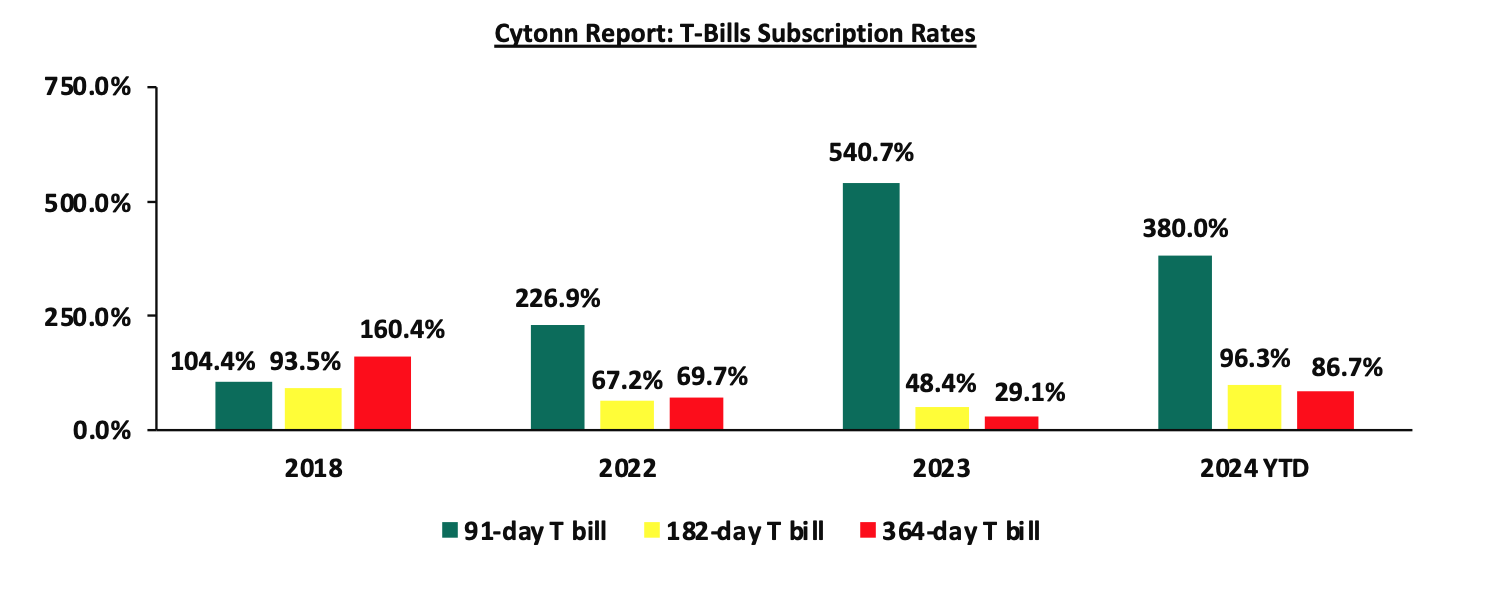
The chart below compares the overall average T-bill subscription rates obtained in 2018, 2022, 2023, and 2024 Year-to-date (YTD):
During the week, the Central Bank of Kenya released the auction results for the tap sale of FXD1/2022/010 with a tenor to maturity of 7.6 years, and a fixed coupon rate of 13.5%. The bond was oversubscribed with the overall subscription rate coming in at 110.0%, receiving bids worth Kshs 16.5 bn against the offered Kshs 15.0 bn. The government accepted bids worth Kshs 15.1 bn, translating to an acceptance rate of 91.5%. The weighted average yield of accepted bid for the bond came in at 17.0%, which was similar to the reopened sale yield earlier this month. With the Inflation rate at 3.6% as of September 2024, the real return of the bond is 13.4%.
Money Market Performance:
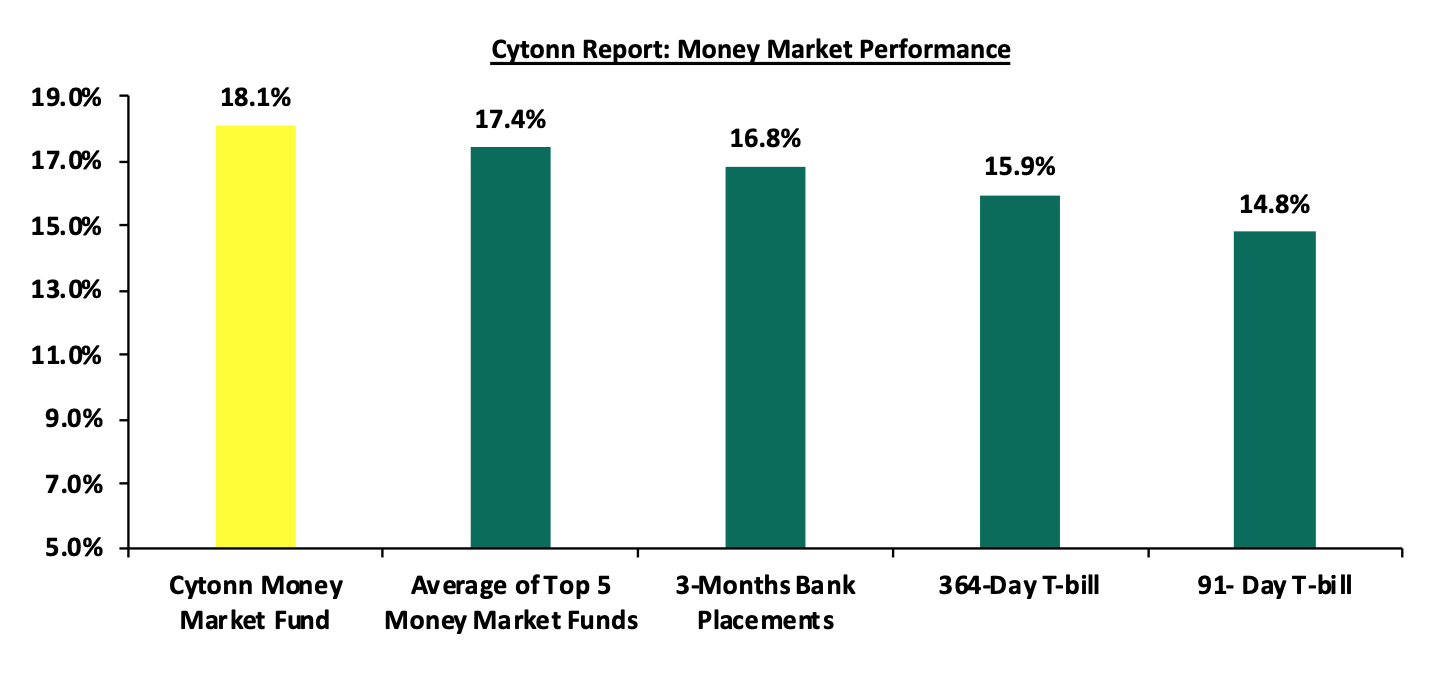
In the money markets, 3-month bank placements ended the week at 16.8% (based on what we have been offered by various banks), and the yields on the government papers were on a downward trajectory, with the yields on the 364-day and 91-day papers decreasing by 42.7 bps and 22.4 bps respectively, to 15.9% and 14.8% respectively from 16.3% and 15.0% respectively recorded the previous week. The yields on the Cytonn Money Market Fund decreased marginally by 3.0 bps to close the week at 18.1%, remaining relatively unchanged from the previous week, while the average yields on the Top 5 Money Market Funds decreased by 4.0 bps to 17.4% from the 17.5% recorded last week.
The table below shows the Money Market Fund Yields for Kenyan Fund Managers as published on 18th October 2024:
|
Cytonn Report: Money Market Fund Yield for Fund Managers as published on 18th October 2024 |
||
|
Rank |
Fund Manager |
Effective Annual Rate |
|
1 |
Cytonn Money Market Fund (Dial *809# or Download the Cytonn App) |
18.1% |
|
2 |
Lofty-Corban Money Market Fund |
18.0% |
|
3 |
Etica Money Market Fund |
17.1% |
|
4 |
Kuza Money Market fund |
17.1% |
|
5 |
Arvocap Money Market Fund |
16.8% |
|
6 |
GenAfrica Money Market Fund |
16.0% |
|
7 |
KCB Money Market Fund |
15.8% |
|
8 |
Nabo Africa Money Market Fund |
15.7% |
|
9 |
Jubilee Money Market Fund |
15.5% |
|
10 |
Ndovu Money Market Fund |
15.5% |
|
11 |
Co-op Money Market Fund |
15.4% |
|
12 |
Mali Money Market Fund |
15.2% |
|
13 |
Apollo Money Market Fund |
15.1% |
|
14 |
Sanlam Money Market Fund |
15.1% |
|
15 |
Enwealth Money Market Fund |
15.0% |
|
16 |
Absa Shilling Money Market Fund |
15.0% |
|
17 |
Madison Money Market Fund |
15.0% |
|
18 |
Faulu Money Market Fund |
15.0% |
|
19 |
Orient Kasha Money Market Fund |
14.8% |
|
20 |
Mayfair Money Market Fund |
14.5% |
|
21 |
Stanbic Money Market Fund |
14.4% |
|
22 |
Dry Associates Money Market Fund |
14.2% |
|
23 |
AA Kenya Shillings Fund |
14.2% |
|
24 |
Old Mutual Money Market Fund |
14.0% |
|
25 |
Genghis Money Market Fund |
14.0% |
|
26 |
CIC Money Market Fund |
13.7% |
|
27 |
ICEA Lion Money Market Fund |
13.6% |
|
28 |
Equity Money Market Fund |
13.3% |
|
29 |
British-American Money Market Fund |
13.2% |
Source: Business Daily
Liquidity:
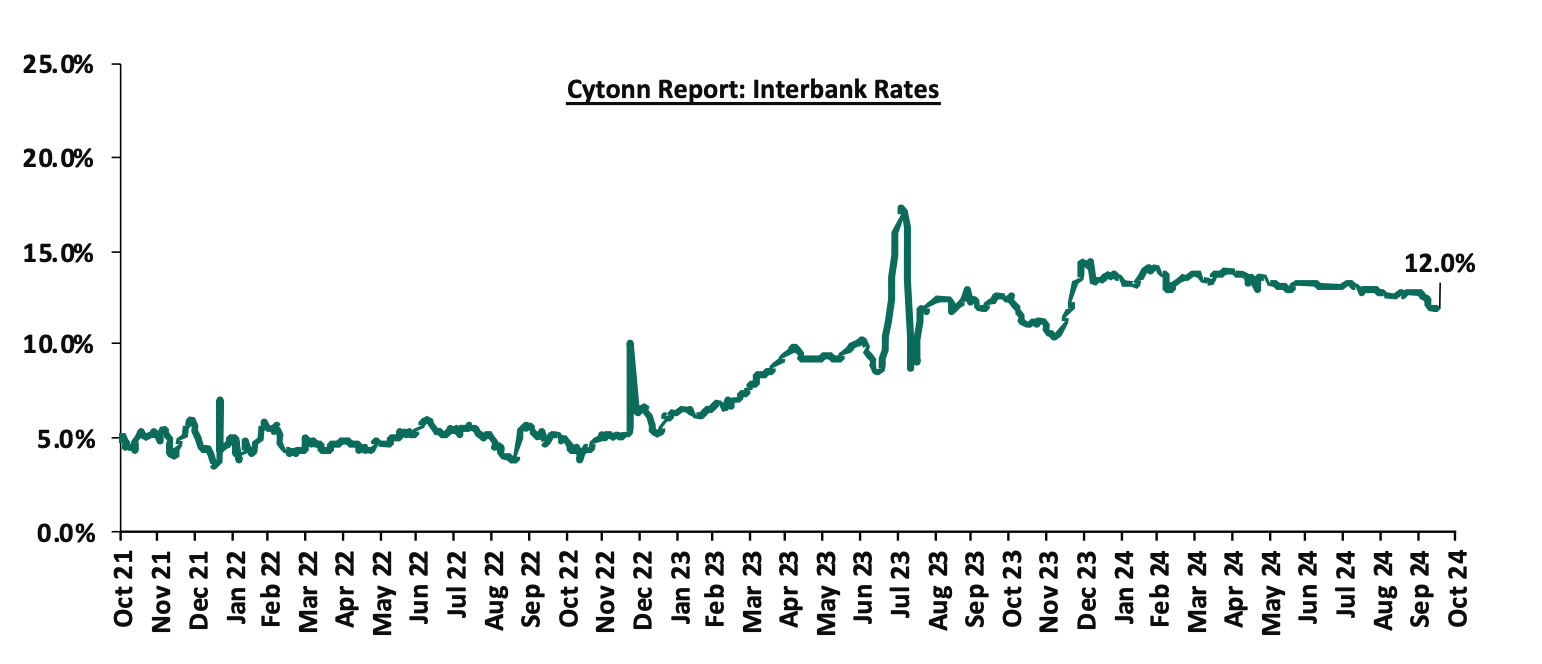
During the week, liquidity in the money markets eased, with the average interbank rate decreasing by 27.9 bps, to 11.9% from the 12.2% recorded the previous week, partly attributable to government payments that offset tax remittances. The average interbank volumes traded increased by 29.1% to Kshs 44.0 bn from Kshs 34.1 bn recorded the previous week. The chart below shows the interbank rates in the market over the years:
Kenya Eurobonds:
During the week, the yields on Eurobonds were on a downward trajectory, with the yields on the 7-year Eurobond issued in 2019 decreasing the most by 69.1 bps to 8.1% from 8.8% recorded the previous week. The table below shows the summary of the performance of the Kenyan Eurobonds as of 17th October 2024;
|
Cytonn Report: Kenya Eurobonds Performance |
||||||
|
|
2018 |
2019 |
2021 |
2024 |
||
|
Tenor |
10-year issue |
30-year issue |
7-year issue |
12-year issue |
13-year issue |
7-year issue |
|
Amount Issued (USD) |
1.0 bn |
1.0 bn |
0.9 bn |
1.2 bn |
1.0 bn |
1.5 bn |
|
Years to Maturity |
3.4 |
23.4 |
2.6 |
7.6 |
9.7 |
6.3 |
|
Yields at Issue |
7.3% |
8.3% |
7.0% |
7.9% |
6.2% |
10.4% |
|
1-Jan-24 |
9.8% |
10.2% |
10.1% |
9.9% |
9.5% |
|
|
1-Oct-24 |
8.6% |
9.9% |
8.3% |
9.6% |
9.4% |
9.5% |
|
10-Oct-24 |
9.2% |
10.3% |
8.8% |
10.0% |
9.9% |
10.0% |
|
11-Oct-24 |
9.1% |
10.3% |
8.7% |
10.0% |
9.9% |
10.0% |
|
14-Oct-24 |
9.1% |
10.2% |
8.6% |
9.9% |
9.8% |
9.9% |
|
15-Oct-24 |
9.0% |
10.2% |
8.4% |
9.9% |
9.7% |
9.9% |
|
16-Oct-24 |
9.0% |
10.1% |
8.2% |
9.9% |
9.7% |
9.8% |
|
17-Oct-24 |
8.9% |
10.1% |
8.1% |
9.8% |
9.6% |
9.7% |
|
Weekly Change |
(0.3%) |
(0.2%) |
(0.7%) |
(0.2%) |
(0.3%) |
(0.2%) |
|
MTD Change |
0.2% |
0.2% |
(0.2%) |
0.2% |
0.2% |
0.2% |
|
YTD Change |
(1.0%) |
(0.1%) |
(2.0%) |
(0.1%) |
0.1% |
- |
Source: Central Bank of Kenya (CBK) and National Treasury
Kenya Shilling:
During the week, the Kenya Shilling depreciated marginally against the US Dollar by 0.7 bps, to remain relatively unchanged at the Kshs 129.2 recorded the previous week. On a year-to-date basis, the shilling has appreciated by 17.7% against the dollar, a contrast to the 26.8% depreciation recorded in 2023.
We expect the shilling to be supported by:
- Diaspora remittances standing at a cumulative USD 4,644.5 mn in the 12 months to August 2024, 12.7% higher than the USD 4,119.7 mn recorded over the same period in 2023, which has continued to cushion the shilling against further depreciation. In the August 2024 diaspora remittances figures, North America remained the largest source of remittances to Kenya accounting for 58.5% in the period, and,
- The tourism inflow receipts which came in at USD 352.5 bn in 2023, a 31.5% increase from USD 268.1 bn inflow receipts recorded in 2022, and owing to tourist arrivals that improved by 21.0% in the 12 months to August 2024, compared to a similar period in 2023, and,
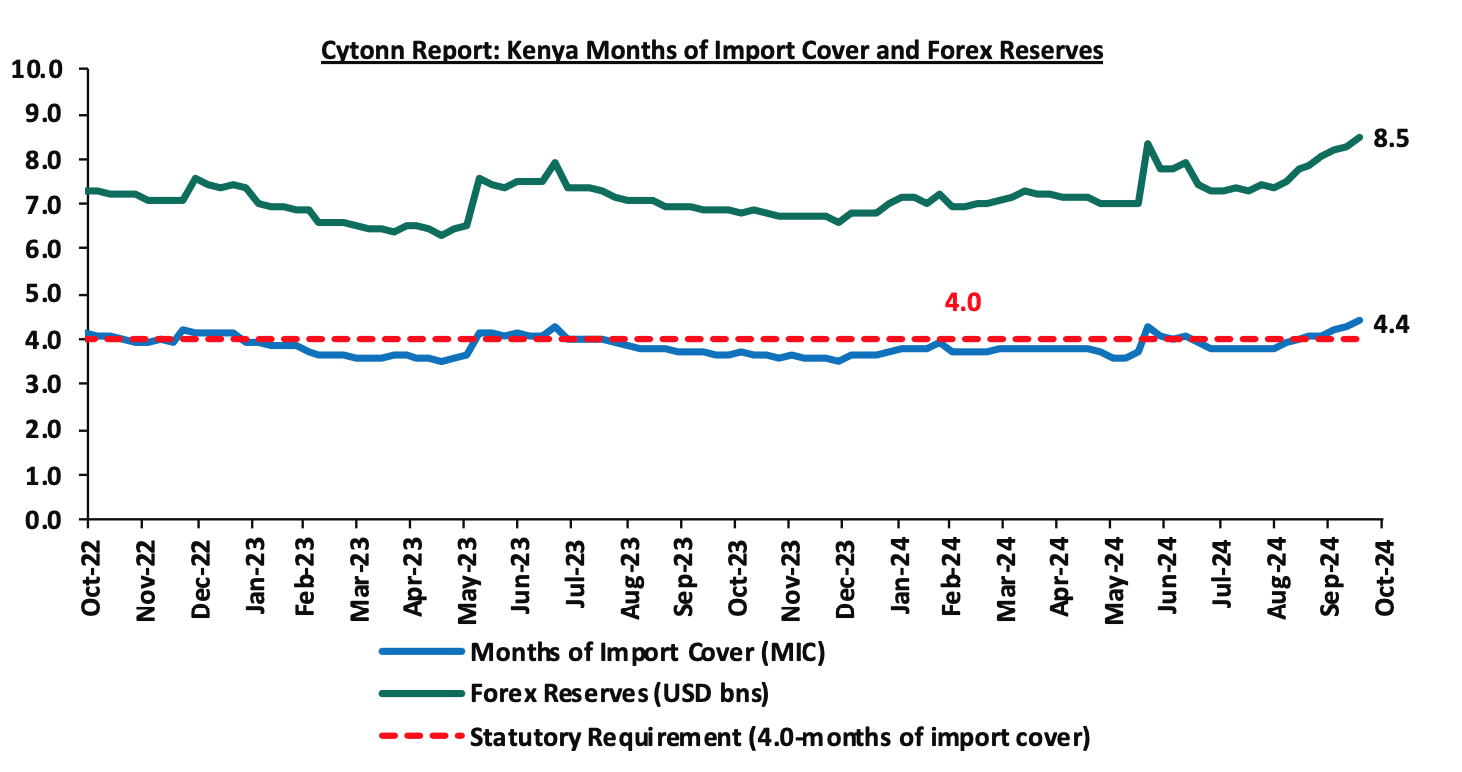
- Improved forex reserves currently at USD 8.5 bn (equivalent to 4.4-months of import cover), which is above the statutory requirement of maintaining at least 4.0-months of import cover, but slightly lower than the EAC region’s convergence criteria of 4.5-months of import cover.
The shilling is however expected to remain under pressure in 2024 as a result of:
- An ever-present current account deficit which came at 3.8% of GDP in Q2’2024 from 3.7% recorded in Q2’2023, and,
- The need for government debt servicing, continues to put pressure on forex reserves given that 67.9% of Kenya’s external debt is US Dollar-denominated as of March 2024.
Key to note, Kenya’s forex reserves increased by 2.3% during the week to close the week at USD 8.5 bn from the USD 8.3 bn recorded the previous week, equivalent to 4.4 months of import cover, up from the 4.3 months recorded last week, and above to the statutory requirement of maintaining at least 4.0-months of import cover. The chart below summarizes the evolution of Kenya's months of import cover over the years:
Weekly Highlights:
- Annual Borrowing Plan for FY’2024/25
During the week, the National Treasury published the Annual Borrowing Plan for FY’2024/25, with details of the government’s borrowing requirements for the fiscal year. Notably, the total financing requirement for the government in FY’2024/25 amounts to Kshs 1,669.2 bn, comprising of Kshs 768.6 bn as fiscal deficit and Kshs 900.6 bn for debt maturity refinancing. The 2024 Annual Borrowing Plan outlines the requirements and sources of borrowing for FY’2024/25 as specified in Supplementary Estimates No. 1 for FY’2024/2025 and the 2024 Medium Term Debt Management Strategy (MTDS).
The total financing requirements for the Government of Kenya in FY’2024/25 are projected to reach Kshs 1,669.2 bn, which represents 9.2% of the country’s GDP. These requirements include a fiscal deficit of Kshs 768.6 bn, equivalent to 4.3% of GDP and an additional Kshs 900.6 bn is required to refinance maturing debt securities and loans during the fiscal year. The government plans to address these financing needs through a combination of net external and domestic borrowings. Specifically, Kshs 355.5 bn (2.0% of GDP) will be sourced externally, while Kshs 413.1 bn (2.3% of GDP) will be financed through domestic sources. Of the Kshs 413.1 bn net domestic financing, Kshs 408.4 bn will be sourced from net domestic borrowing (Treasury Bills and T-Bonds) and Kshs 4.7 bn from net domestic loan repayments. Additionally, the Kshs 413.1 bn net domestic financing is a 24.0% decrease from the Kshs 543.7 bn domestic financing recorded in FY’2023/24.
The domestic borrowing plan prioritizes issuing medium to long-term debt securities, which are expected to help the government reduce the cost of debt while minimizing maturity risks. Specifically, fixed-rate bonds with tenors of 2, 5, 10, 15, 20, and 25 years will be re-opened throughout the fiscal year under the benchmark bond program, with no new issuances in the published schedule. Additionally, infrastructure bonds will be introduced as necessary to finance critical development projects. Treasury Bills will mainly be issued for liquidity management, maintaining short-term cash flow for government operations. Given the heightened cost of borrowing for the government, the government aims to maintain a lower priced and stable yield curve while fostering investor confidence and promoting a stable liquidity flow in the market. The chart below represents the increased cost of borrowing for the government over the period:
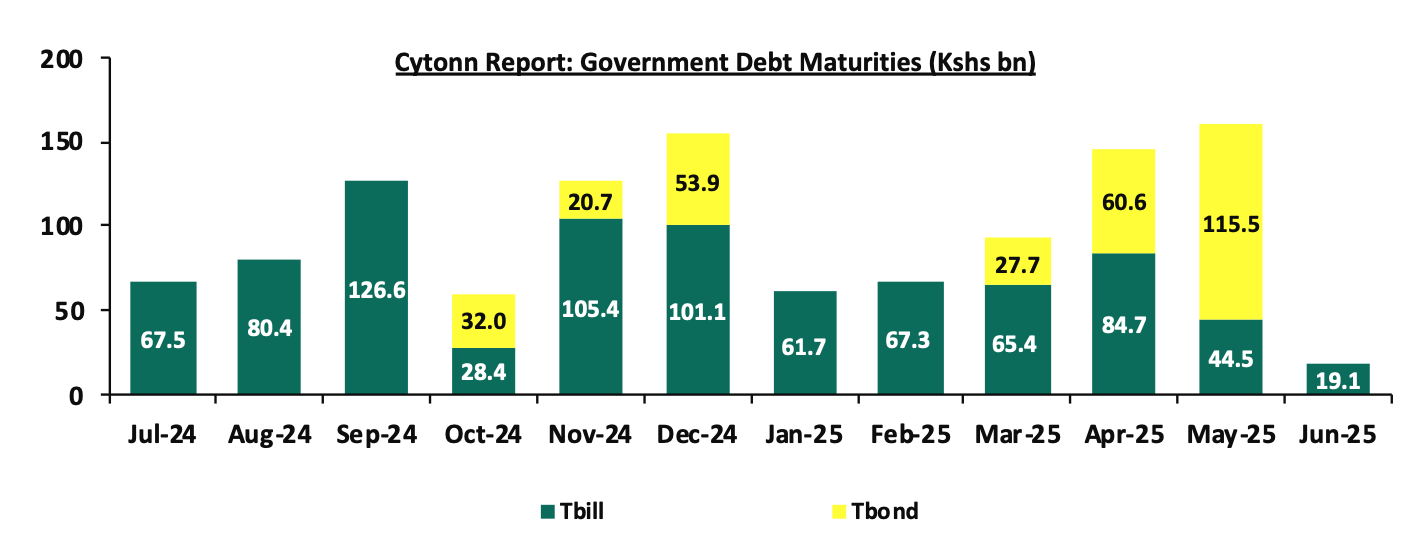
As of end of FY’2023/24, total treasury bill maturities amounted to Kshs 606.5 bn while treasury bonds maturities amounted to Kshs 178.5 bn. So far in the FY’2024/25 total treasury bills maturities have amounted to Kshs 576.7 bn while treasury bonds maturities have amounted to Kshs 310.4 bn. The graph below shows the government’s t-bill and t-bond maturities for FY’2024/25:
In FY’2024/25, the government will address significant domestic debt obligations through strategic measures such as debt refinancing and bond switches. The bond switch process involves replacing existing bonds with new ones, typically to manage the maturity profile of the debt or reduce financing costs, therefore introducing new products to attract investors, and incorporating features that make these bonds appealing. Key to note, there are two bond switch auctions lined up for FY’2024/25 including, FXD1/2022/3 with maturity on 7th April 2025 and IFB1/2020/9 with maturity on 5th May 2025. The switches for these bonds are set to be executed in November 2024 and January 2025, respectively.
The external borrowing strategy emphasizes concessional borrowing to minimize debt-servicing costs and manage repayment risks. This external borrowing will include a mix of commercial, project loans, and program loans. The table below shows the sources of net external financing for FY’2023/24 and FY’2024/25:
|
Cytonn Report: Net External Financing in FY’2023/24 and FY’2024/25 |
||
|
Source |
FY’2023/24 (Kshs bn) |
FY’2024/25 (Kshs bn) |
|
Commercial Financing |
268.9 |
168.8 |
|
Project Loans |
155.8 |
225.0 |
|
Program Loans |
317.8 |
292.4 |
|
Total Disbursements |
760.5 |
686.2 |
|
Principal Repayment of External Debt |
(537.8) |
(330.7) * |
|
Net External Financing |
222.7 |
355.5 |
Source: National Treasury, *estimated
By diversifying the borrowing mix, the government seeks to balance the needs of financing development projects with the imperative to keep debt at manageable levels.
The execution of the Annual Borrowing Plan for FY’2024/25 is intended to be transparent and flexible, reflecting the government's commitment to fiscal responsibility. Implementation began on July 1, 2024, and will run through June 30, 2025, supported by a strong monitoring and evaluation framework to ensure it remains on track. A performance review will be conducted quarterly to track the implementation of the plan and adjustments will be made to ensure the plan remains relevant, considering domestic and global economic trends.
Kenya’s FY’2024/25 Annual Borrowing Plan gives us a clear view of the government’s financial strategy, balancing ambition with caution. With the country's financing needs at 9.2% of GDP, the government faces the challenge of stimulating economic growth while keeping its debt in check. The decision to focus on longer-term domestic borrowing and prioritize concessional loans from external sources is a smart move to reduce the risks tied to currency fluctuations and debt refinancing. However, the continued reliance on borrowing, especially to manage existing debt, highlights the urgent need for deeper reforms to reduce the fiscal deficit in the long run. As global and local economic pressures rise, the success of this borrowing plan will depend on how effectively it is executed, how the market reacts, and whether the government can maintain investor confidence while keeping debt levels sustainable. The real challenge for Kenya is ensuring that these borrowed funds are invested in projects that drive economic growth and reduce the need for future borrowing.
- Exchequer Highlight
The National Treasury gazetted the revenue and net expenditures for the third month of FY’2024/2025, ending 30th September 2024. Below is a summary of the performance:
|
Cytonn Report: FY'2024/2025 Budget Outturn - As at 30th September 2024 |
||||||
|
Amounts in Kshs billions unless stated otherwise |
||||||
|
Item |
12-months Original Estimates |
Revised Estimates |
Actual Receipts/Release |
Percentage Achieved of the Revised Estimates |
Prorated |
% achieved of the Prorated |
|
Opening Balance |
1.2 |
|
|
|
||
|
Tax Revenue |
2,745.2 |
2,475.06 |
525.6 |
21.2% |
618.8 |
84.9% |
|
Non-Tax Revenue |
172.0 |
156.4 |
65.3 |
41.8% |
39.1 |
167.1% |
|
Total Revenue |
2,917.2 |
2,631.4 |
592.0 |
22.5% |
657.9 |
90.0% |
|
External Loans & Grants |
571.2 |
593.5 |
27.1 |
4.6% |
148.4 |
18.3% |
|
Domestic Borrowings |
828.4 |
978.3 |
153.4 |
15.7% |
244.6 |
62.7% |
|
Other Domestic Financing |
4.7 |
4.7 |
4.3 |
92.6% |
1.2 |
370.4% |
|
Total Financing |
1,404.3 |
1,576.5 |
184.8 |
11.7% |
394.1 |
46.9% |
|
Recurrent Exchequer issues |
1,348.4 |
1,307.9 |
280.1 |
21.4% |
327.0 |
85.7% |
|
CFS Exchequer Issues |
2,114.1 |
2,137.8 |
359.5 |
16.8% |
534.5 |
67.3% |
|
Development Expenditure & Net Lending |
458.9 |
351.3 |
68.5 |
19.5% |
87.8 |
78.0% |
|
County Governments + Contingencies |
400.1 |
410.8 |
63.6 |
15.5% |
102.7 |
61.9% |
|
Total Expenditure |
4,321.5 |
4,207.9 |
771.7 |
18.3% |
1,052.0 |
73.4% |
|
Fiscal Deficit excluding Grants |
1,404.3 |
1,576.5 |
179.7 |
11.4% |
394.1 |
45.6% |
|
Total Borrowing |
1,399.6 |
1,571.8 |
180.5 |
11.5% |
393.0 |
45.9% |
Amounts in Kshs bns unless stated otherwise
The Key take-outs from the release include;
- Total revenue collected as at the end of September 2024 amounted to Kshs 592.0 bn, equivalent to 22.5% of the revised estimates of Kshs 2,631.4 bn for FY’2024/2025 and is 90.0% of the prorated estimates of Kshs 657.9 bn. Cumulatively, tax revenues amounted to Kshs 525.6 bn, equivalent to 21.2% of the revised estimates of Kshs 2,475.1 bn and 84.9% of the prorated estimates of Kshs 618.8 bn,
- Total financing amounted to Kshs 184.8 bn, equivalent to 11.7% of the revised estimates of Kshs 1,576.5 bn and is equivalent to 46.9% of the prorated estimates of Kshs 394.1 bn. Additionally, domestic borrowing amounted to Kshs 153.4 bn, equivalent to 15.7% of the revised estimates of Kshs 978.3 bn and is 62.7% of the prorated estimates of Kshs 244.6 bn,
- The total expenditure amounted to Kshs 771.7 bn, equivalent to 18.3% of the revised estimates of Kshs 4,207.9 bn, and is 73.4% of the prorated target expenditure estimates of Kshs 1,052.0 bn. Additionally, the net disbursements to recurrent expenditures came in at Kshs 280.1 bn, equivalent to 21.4% of the revised estimates of Kshs 1,307.9 and 85.7% of the prorated estimates of Kshs 327.0 bn,
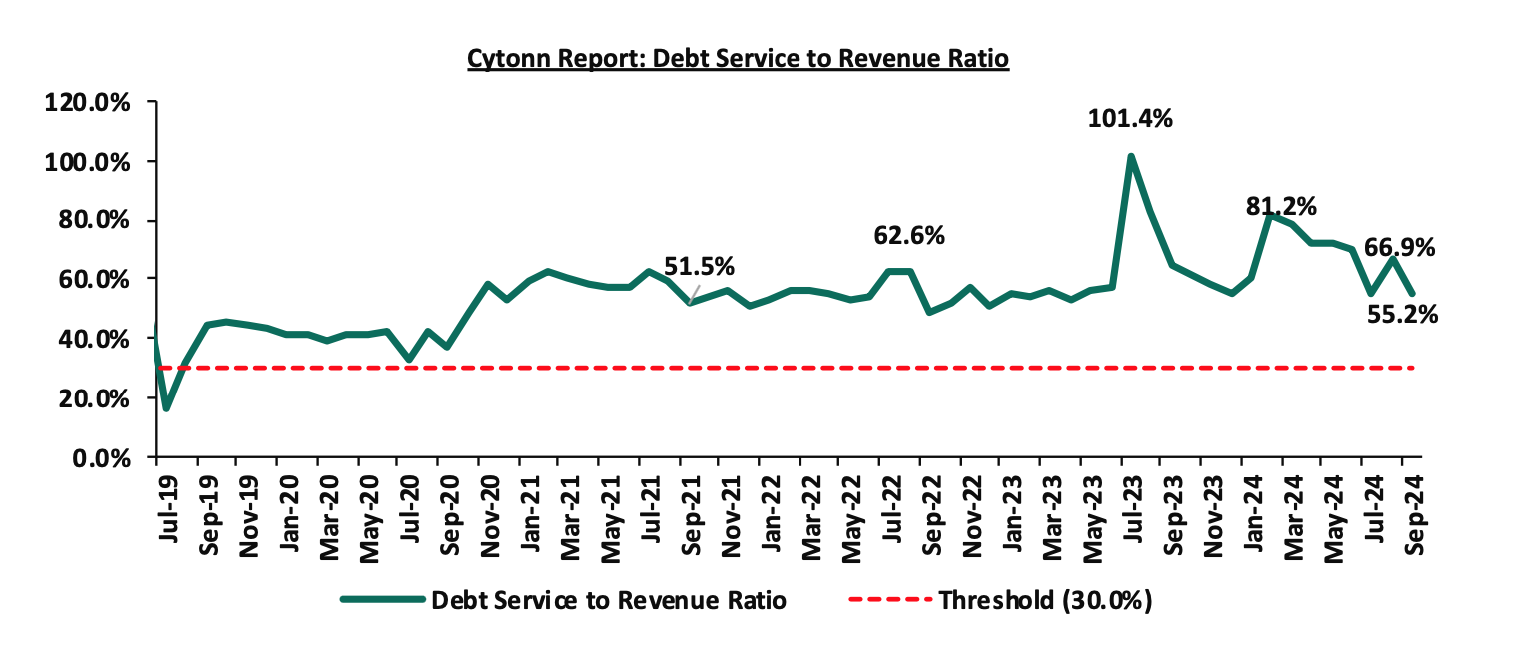
- Consolidated Fund Services (CFS) Exchequer issues came in at Kshs 359.5 bn, equivalent to 16.8% of the revised estimates of Kshs 2,137.8 bn, and are 67.3% of the prorated amount of Kshs 534.5 bn. The cumulative public debt servicing cost amounted to Kshs 326.7 bn which is 17.1% of the revised estimates of Kshs 1,910.5 bn, and is 68.4% of the prorated estimates of Kshs 477.6 bn. Additionally, the Kshs 326.7 bn debt servicing cost is equivalent to 55.2% of the actual cumulative revenues collected as at the end of September 2024. The chart below shows the debt servicing to revenue ratio;
- Total Borrowings as at the end of September 2024 amounted to Kshs 180.5 bn, equivalent to 11.5% of the revised estimates of Kshs 1,571.8 bn for FY’2024/2025 and are 45.9% of the prorated estimates of Kshs 393.0 bn. The cumulative domestic borrowing of Kshs 978.3 bn comprises of Net Domestic Borrowing Kshs 408.4 bn and Internal Debt Redemptions (Rollovers) Kshs 569.9 bn.
The government missed its prorated revenue targets for the third consecutive month in FY’2024/2025, achieving only 90% of the target in September 2024. This shortfall is largely due to the challenging economic environment, exacerbated by high taxes and the elevated cost of living, despite an easing of inflationary pressures, with the year-on-year inflation for September 2024 dropping by 0.8% points to 3.6%, down from 4.4% in August 2024. However, the cost of living remains high, negatively impacting revenue collection as seen in the deteriorating business environment, with the PMI declining to 49.7 in September from 50.6 in August 2024. Despite efforts to enhance revenue collection, such as broadening the tax base, curbing tax evasion, and suspending tax relief payments, the government has yet to fully benefit from these strategies. It is vital to note, however, that this drop in revenue collection was balanced by corresponding lag in expenditure, which currently stand at 18.3% of the revised estimates of Kshs 4,207.9 bn, and is 73.4% of the prorated target expenditure estimates of Kshs 1,052.0 bn. Future revenue collection will largely depend on the stabilization of the country’s business climate, which is expected to be supported by a stable Shilling, continued easing of inflation, and a reduction in the cost of credit. This is in line with the Monetary Policy Committee’s (MPC) recent decision to lower the Central Bank Rate (CBR) by 75.0 basis points to 12.00%, down from 12.75%, following their meeting on October 8, 2024.
Rates in the Fixed Income market have been on a downward trend given the continued low demand for cash by the government and the occasional liquidity easing in the money market. The government is 136.1% ahead of its prorated net domestic borrowing target of Kshs 125.7 bn, having a net borrowing position of Kshs 296.7 bn. However, we expect a downward readjustment of the yield curve in the short and medium term, with the government looking to increase its external borrowing to maintain the fiscal surplus, hence alleviating pressure in the domestic market. As such, we expect the yield curve to normalize in the medium to long-term and hence investors are expected to shift towards the long-term papers to lock in the high returns.
Market Performance:
During the week, the equities market was on an upward trajectory, with NSE 10 gaining the most by 4.8%, while NSE 25, NASI, and NSE 20 gained by 4.7%, 4.0%, and 3.0% respectively, taking the YTD performance to gains of 34.4%, 31.6%, 24.5% and 23.4% for NSE 10, NSE 25, NASI and NSE 20 respectively. The equities market performance was mainly driven by gains recorded by EABL, KCB Group, and SCBK of 16.1%, 6.5%, and 6.3% respectively. The gains were however weighed down by losses recorded by large-cap stocks such as BAT of 0.1%.
During the week, equities turnover declined by 10.5% to USD 6.2 mn from USD 6.9 mn recorded the previous week, taking the YTD turnover to USD 503.4 mn. Foreign investors remained net sellers for the second consecutive week, with a net selling position of USD 0.7 mn, from a net selling position of USD 1.5 mn recorded the previous week, taking the YTD net buying position to USD 1.0 mn.
The market is currently trading at a price-to-earnings ratio (P/E) of 5.7x, 51.6% below the historical average of 11.8x, and a dividend yield of 6.6%, 2.0% points above the historical average of 4.6%. Key to note, NASI’s PEG ratio currently stands at 0.7x, an indication that the market is undervalued relative to its future growth. A PEG ratio greater than 1.0x indicates the market may be overvalued while a PEG ratio less than 1.0x indicates that the market is undervalued.
The charts below indicate the historical P/E and dividend yields of the market;
Universe of Coverage:
|
Cytonn Report: Equities Universe of Coverage |
||||||||||
|
Company |
Price as at 11/10/2024 |
Price as at 18/10/2024 |
w/w change |
YTD Change |
Year Open 2024 |
Target Price* |
Dividend Yield*** |
Upside/ Downside** |
P/TBv Multiple |
Average |
|
Jubilee Holdings |
163.0 |
168.0 |
3.1% |
(9.2%) |
185.0 |
260.7 |
8.8% |
68.7% |
628.8 |
Buy |
|
Diamond Trust Bank |
50.8 |
51.0 |
0.5% |
14.0% |
44.8 |
65.2 |
9.9% |
38.3% |
262.6 |
Buy |
|
CIC Group |
2.1 |
2.2 |
1.9% |
(5.7%) |
2.3 |
2.8 |
6.1% |
38.2% |
3.2 |
Buy |
|
Co-op Bank |
13.6 |
13.9 |
2.2% |
22.5% |
11.4 |
17.2 |
11.0% |
37.5% |
21.7 |
Buy |
|
NCBA |
44.0 |
44.2 |
0.5% |
13.6% |
38.9 |
55.2 |
10.8% |
36.4% |
54.0 |
Buy |
|
Equity Group |
47.3 |
47.4 |
0.2% |
38.6% |
34.2 |
60.2 |
8.5% |
35.7% |
50.9 |
Buy |
|
Stanbic Holdings |
120.5 |
122.8 |
1.9% |
15.8% |
106.0 |
145.3 |
12.7% |
33.3% |
147.9 |
Buy |
|
ABSA Bank |
14.2 |
14.9 |
4.9% |
29.0% |
11.6 |
17.3 |
10.9% |
32.7% |
12.6 |
Buy |
|
Britam |
5.8 |
5.8 |
0.0% |
12.5% |
5.1 |
7.5 |
0.0% |
29.8% |
7.3 |
Buy |
|
KCB Group |
36.7 |
39.1 |
6.5% |
77.9% |
22.0 |
46.7 |
0.0% |
27.3% |
65.0 |
Buy |
|
Standard Chartered Bank |
215.3 |
228.8 |
6.3% |
42.7% |
160.3 |
235.2 |
13.5% |
22.7% |
149.6 |
Buy |
|
I&M Group |
24.0 |
27.5 |
14.4% |
57.3% |
17.5 |
26.5 |
10.6% |
21.0% |
48.8 |
Buy |
|
*Target Price as per Cytonn Analyst estimates **Upside/ (Downside) is adjusted for Dividend Yield ***Dividend Yield is calculated using FY’2023 Dividends |
||||||||||
We are “Neutral” on the Equities markets in the short term due to the current tough operating environment and huge foreign investor outflows, and, “Bullish” in the long term due to current cheap valuations and expected global and local economic recovery. With the market currently being undervalued for its future growth (PEG Ratio at 0.7x), we believe that investors should reposition towards value stocks with strong earnings growth and that are trading at discounts to their intrinsic value. We expect the current foreign investors’ sell-offs to continue weighing down the equities outlook in the short term.
- REITs Weekly Performance
On the Unquoted Securities Platform, Acorn D-REIT and I-REIT traded at Kshs 25.4 and Kshs 22.2 per unit, respectively, as per the last updated data on 18th October 2024. The performance represented a 27.0% and 11.0% gain for the D-REIT and I-REIT, respectively, from the Kshs 20.0 inception price. The volumes traded for the D-REIT and I-REIT came in at Kshs 12.3 mn and Kshs 31.6 mn shares, respectively, with a turnover of Kshs 311.5 mn and Kshs 702.7 mn, respectively, since inception in February 2021. Additionally, ILAM Fahari I-REIT traded at Kshs 11.0 per share as of 18th October, 2024, representing a 45.0% loss from the Kshs 20.0 inception price. The volume traded to date came in at 138,600 for the I-REIT, with a turnover of Kshs 1.5 mn since inception in November 2015.
REITs offer various benefits, such as tax exemptions, diversified portfolios, and stable long-term profits. However, the ongoing decline in the performance of Kenyan REITs and the restructuring of their business portfolios are hindering significant previous investments. Additional general challenges include; i) insufficient understanding of the investment instrument among investors, ii) lengthy approval processes for REIT creation, iii) high minimum capital requirements of Kshs 100.0 mn for trustees, and iv) minimum investment amounts set at Kshs 5.0 mn for the Investment REITs, all of which continue to limit the performance of the Kenyan REITs market.
We expect Kenya’s Real Estate sector to remain on a growth trend, supported by: i) the initiation and completion of major infrastructure projects, opening up areas for development, iii) demand for housing sustained by positive demographics, such as urbanization and population growth rates of 3.7% p.a and 2.0% p.a, respectively, against the global average of 1.7% p.a and 0.9% p.a, respectively, as at 2023, iv) activities by the government under the Affordable Housing Agenda (AHP), v) heightened activities by private players in the residential sector. However, challenges such as rising construction costs, strain on infrastructure development (including drainage systems), high capital requirements for REITs, and existing oversupply in select Real Estate sectors will continue to hinder the sector’s optimal performance by limiting developments and investments.
Following the release of the H1’2024 results by Kenyan insurance firms, the Cytonn Financial Services Research Team undertook an analysis on the financial performance of the listed insurance companies and the key factors that drove the performance of the sector. In this report, we assess the main trends in the sector, and areas that will be crucial for growth and stability going forward, seeking to give a view on which insurance firms are the most attractive and stable for investment. As a result, we shall address the following:
- Insurance Penetration in Kenya,
- Key Themes that Shaped the Insurance Sector in H1’2024,
- Industry Highlights and Challenges,
- Performance of the Listed Insurance Sector in H1’2024, and,
- Conclusion & Outlook of the Insurance Sector.
Section I: Insurance Penetration in Kenya
Insurance uptake in Kenya remains low compared to other key economies with the insurance penetration coming in at 2.4% as of H1’2024, according to the Q4’2023 Insurance Regulatory Authority (IRA) and the Kenya National Bureau of Statistics (KNBS) 2024 Economic Survey. The low penetration rate, which is below the global average of 7.0%, according to the Swiss RE institute, is attributable to the fact that insurance uptake is still seen as a luxury and mostly taken when it is necessary or a regulatory requirement. Notably, Insurance penetration increased by 0.1% points from 2.3% recorded in 2022, showcasing the economic recovery that saw an improved business environment in the country. The chart below shows Kenya’s insurance penetration for the last 13 years:
Source: Cytonn Research
The chart below shows the insurance penetration in other economies across Africa:
*Data as of 2023
Source: Swiss Re
Insurance penetration in Africa has remained relatively low, averaging 3.4% in 2023, mainly attributable to lower disposable income in the continent and slow growth of alternative distribution channels such as mobile phones to ensure wider reach of insurance products to the masses. South Africa remains the leader in insurance penetration in the continent, owing to a mature and highly competitive market, coupled with strong institutions and a sound regulatory environment.
Section II: Key Themes that Shaped the Insurance Sector in H1’2024
In H1’2024, the country witnessed an improved operating environment on the back of easing inflationary pressures and a strengthening Shilling. Notably, the inflation rate in H1’2024 averaged 5.6%, 2.9% points lower than the 8.5% average in H1’2023, with the Kenyan Shilling having appreciated by 17.2% against the USD in H1’2024. On the other hand, the overall GDP growth rate declined to 4.6% in Q2’2024, from 5.6% recorded in a similar period last year according to the Kenya National Bureau of Statistics. However, according to the Q4’2023 Insurance Regulatory Authority Insurance industry report, the insurance sector showcased resilience recording a 16.7% growth in gross premium to Kshs 361.4 bn in FY’2023, from Kshs 309.8 bn in FY’2022. Insurance claims also increased by 13.3% to Kshs 94.0 bn in FY’2023, from Kshs 82.9 bn in FY’2022.
Notably, the general insurance business contributed 52.9% of the industry’s premium income in FY’2023 compared to 47.1% contribution by long term insurance business in the same period. During the period, the long-term business premiums increased by 20.7% to Kshs 170.0 bn, from Kshs 140.8 bn in 2022 while the general business premiums grew by 13.3% to Kshs 191.3 bn, from Kshs 168.9 bn in 2022. Additionally, motor insurance and medical insurance classes of insurance accounted for 63.5% of the gross premium income under the general insurance business, compared to 64.4% recorded in 2022. As for the long-term insurance business, the major contributors to gross premiums were deposit administration and life assurance classes accounting for 59.8% in FY’2023, compared to the 61.1% contribution by the two classes in FY’2022.
Key highlights from the industry performance:
- Convenience and efficiency through the adoption of alternative channels for both distribution and premium collection such as Bancassurance and improved agency networks,
- Advancement in technology and innovation making it possible to make premium payments and through mobile phones,
- Continued recovery from the ripple effects of the pandemic witnessed in 2020 that saw both individuals and businesses seek insurance uptake to cover their activities, leading to growth in gross premiums which increased by 16.7% to Kshs 361.4 bn in 2023, from Kshs 309.8 bn in 2022 and,
- The sector’s investment income increased by 17.4% to Kshs 69.7 bn in 2023, from Kshs 59.3 bn in 2022, mainly attributable to the 28.1% increase in investment income in the general insurance business to Kshs 15.0 bn, from Kshs 11.7 bn in 2023, coupled with a 14.8% increase in the investment income in the long-term to Kshs 54.7 bn, from Kshs 47.6 bn in 2022.
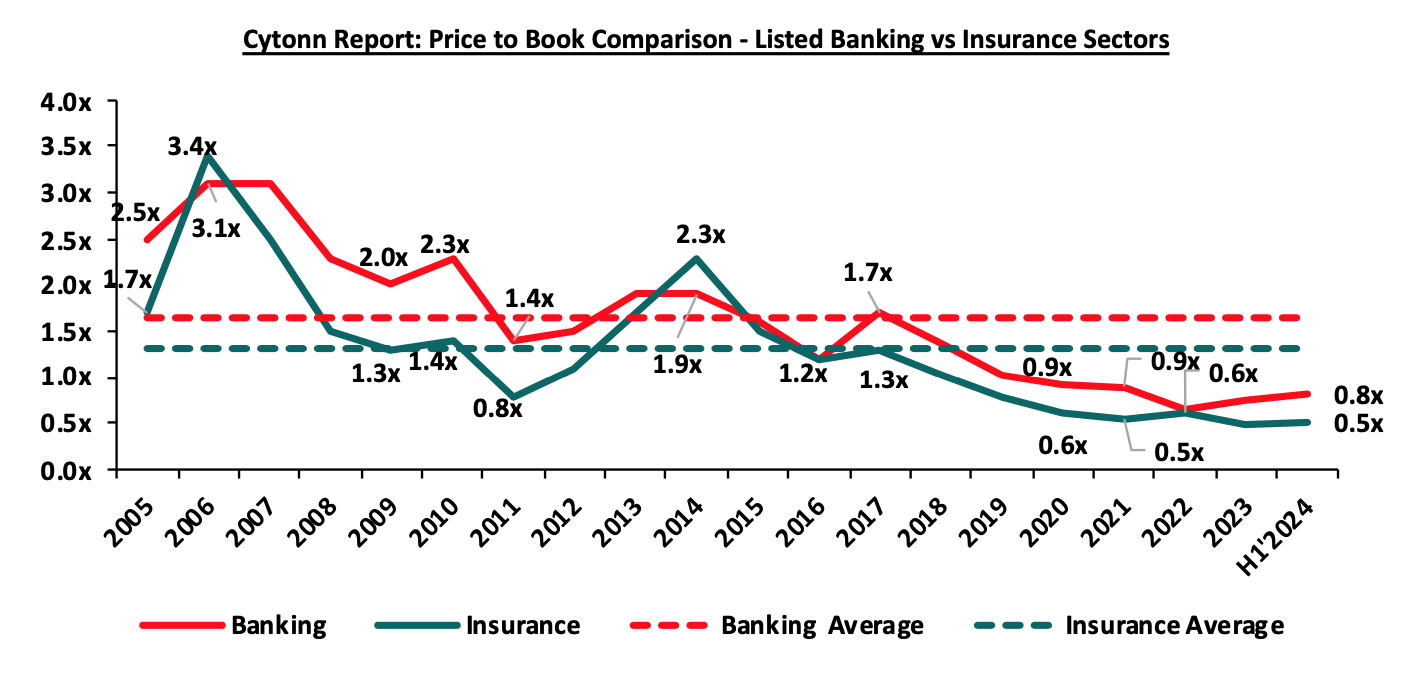
On valuations, listed insurance companies are trading at a price to book (P/Bv) of 0.5x, lower than listed banks at 0.8x, but both are lower than their 16-year historical averages of 1.3x and 1.6x, for the insurance and banking sectors respectively. These two sectors are attractive for long-term investors supported by the strong economic fundamentals. The chart below shows the price-to-book comparison for Listed Banking and Insurance Sectors:
Source: Cytonn Research
The key themes that have continued to drive the insurance sector include:
- Technology and Innovation
Although the industry has been slow in adopting digital trends, the onset of the COVID-19 pandemic in 2020 saw the adoption of digital distribution of insurance products as a matter of necessity. Consequently, majority of insurance companies continue to take advantage of the available digital channels to drive growth and increase insurance penetration in the country. In April 2024, CIC Group announced the launch of Easy Bima, a digital motor insurance product. This solution allows customers to pay comprehensive motor insurance premiums in equal monthly installments over 12 months, providing flexibility and affordability. The product leverages digital platforms to make insurance more accessible, especially for those who may struggle with upfront premium payments Consumers often term insurance as difficult and complex to understand. This sentiment has been established through various studies carried out to establish reasons for the low uptake of insurance, the latest being the 2021 FinAccess Survey. The survey found that there has been growth in insurance understanding with only 14.3% citing a lack of understanding in 2021 compared to 40.9% in 2016.
- Regulation
To ensure that the sector benefits from a globally competitive financial services sector, the regulator has been working through regulation implementations to address some of the perennial, as well as emerging problems in the sector. The COVID-19 environment proved challenging especially on the regulatory front, as it was a balance between remaining prudent as an underwriter and adhering to the set regulations given the negative effects of the pandemic. Regulations used for the insurance sector in Kenya include the Insurance Act Cap 487 and its accompanying schedule and regulations, the Retirement Benefits Act Cap 197, and The Companies Act. In H1’2024, regulation remained a key aspect affecting the insurance sector and the key themes in the regulatory environment include;
- IFRS 17 - IFRS 9, Financial Instruments was replaced with IFRS 17. The standard establishes the principle for recognition, measurement, presentation, and disclosure of insurance contracts with the objective of ensuring insurance companies provide relevant information that faithfully represents the contracts. However, as a way to protect the insurance industry from the negative effects of the pandemic the International Accounting Standards Board (IASB), the international body responsible for setting up financial reporting standards deferred its implementation effective from January 2023 or earlier. The standard, having replaced IFRS 4, is expected to give better information on profitability by providing more insights about the current and future profitability of insurance contracts. Separation of financial and insurance results in the income statement will allow for better analysis of core performance for the entities and allow for better comparability of insurance companies, and,
- Risk-Based Supervision - IRA has been implementing risk-based supervision through guidelines that require insurers to maintain a capital adequacy ratio of at least 200.0% of the minimum capital. The regulation requires insurers to monitor the capital adequacy and solvency margins on a quarterly basis, with the main objective being to safeguard the insurer’s ability to continue as a going concern and provide shareholders with adequate returns. We expect more mergers within the industry as smaller companies struggle to meet the minimum capital adequacy ratios. We also expect insurance companies to adopt prudential practices in managing and taking on risk and reduction of premium undercutting in the industry as insurers will now have to price risk appropriately.
- Capital Raising and Share Purchase
The move to a risk-based capital adequacy framework presented opportunities for capital raising initiatives mostly by the small players in the sector to shore up their capital and meet compliance measures. With the new capital adequacy assessment framework, capital is likely to be critical to ensuring stability and solvency of the sector to ensure the businesses are a going concern. In May 2022, Sanlam Limited, a South African financial services group listed on the Johannesburg Stock Exchange, announced that it had entered into a definitive Joint Venture agreement for a term of 10 years with Allianz SE, with the aim to leverage the two entities footprints in Africa and create a leading Pan-African financial services group, with an estimated equity value of Kshs 243.7 bn. Key to note, Sanlam Limited, indirectly owns 100.0% of Hubris Holdings Limited, which is the majority shareholder in Sanlam Kenya Plc, a listed insurance and financial services entity on the Nairobi Stock Exchange. The initial shareholding split of the Joint Venture was announced to be 60:40, Sanlam Limited to Allianz respectively, with the effective date of the proposed transaction being within 12-15 months of the announcement, subject to relevant approvals. However, given the length of the Agreement, we expect that the Joint Venture will provide for Sanlam Kenya Plc, Allianz General Insurance Kenya, and Jubilee General Insurance (which Allianz owns the majority stake in – 66.0%), to combine operations to grow their market share, asset base and bottom lines.
Section III: Industry Highlights and Challenges
The insurance industry has experienced steady growth over the last decade, as a result, we anticipate sustained moderate growth on the back of an improving economy and subsequent rise in insurance premiums, which will strengthen the sector's ability to sustain profitability.
On the regulatory front, the rejected Finance Bill 2024 included provisions that sought to expand taxes on insurance premiums and extend VAT to certain insurance services. These included a new 2.5% tax on the value of motor vehicles, payable when issuing insurance cover and limiting VAT exemptions to insurance and reinsurance premiums only, subjecting other related services to the standard VAT rate of 16.0%. These measures were aimed at increasing government revenue but were met with opposition from industry stakeholders, including the Association of Kenya Insurers (AKI) due to concerns over increased insurance costs. The rejection of the Finance Bill has provided a temporary reprieve for the insurance sector, though discussions on balancing fiscal policy and market growth continue to shape the regulatory landscape.
Industry Challenges:
- Insurance fraud: Insurance Fraud is an intentional deceit performed by an applicant or policyholder for financial advantage. In recent years, there has been an upsurge in fraudulent claims, particularly in medical and motor insurance, with estimates indicating that one in every five medical claims are fraudulent. This is mainly through exaggerating medical costs and hospitals by making patients undergo unnecessary tests. Notably, in 2023, 206 fraud instances were reported, with 56 cases reported in Q4’2023 alone. Fraudsters also collude with hospitals to make false claims, and fake surgeries and treatments, while healthcare providers overcharge insured patients. To combat fraud, the sector has adopted the usage of blockchain and artificial intelligence,
- Insolvency: A major challenge facing the insurance industry is the financial instability and insolvency of key players, as evidenced by recent cases like Xplico Insurance, Invesco Assurance and Resolution Insurance. These companies have been placed under statutory management and provisional liquidation by the Insurance Regulatory Authority (IRA). The issues stem from prolonged financial difficulties, boardroom conflicts, and eroding market share, particularly in loss-making segments like Public Service Vehicle (PSV) insurance. The collapse of these insurers affects customer trust, disrupts the industry’s stability, and forces policyholders to seek alternative coverage. The industry must address governance, risk management, and liquidity issues to restore stability and consumer confidence,
- Declining consumer confidence in the insurance industry: In 2023, IRA received 440 complaints from policyholders and beneficiaries lodged against insurers, the general insurance accounting for the majority of the complaints at 77.5%, while long-term insurers recorded 22.5%. The complaints range from insurance companies failing to settle claims and constant haggling over terms of insurance,
- High Market competition: Despite low insurance penetration in the country, the sector is served by 57 insurance companies offering the same products. Some insurers have resorted to shady tactics in the fight for market dominance, such as premium undercutting, which involves offering clients implausibly low premiums to gain a competitive advantage and protect their market share. This is a significant factor in the industry's underwriting losses. Plans to hire a consultant to review industry pricing in March 2021 were retaliated against by the regulator, but the plans are still in the works. However, this is against a background of weak insurance uptake, which could be made worse by higher premium prices. Industry participants have debated pricing, and,
- Regulation compliance: Due to laws on capital requirements, smaller insurance businesses have found it challenging to operate without raising capital or combining to expand their capital base. Additionally, the implementation of IFRS 17, is expensive since accounting and actuarial systems need to be updated and realigned.
Section IV: Performance of the Listed Insurance Sector in H1’2024
The table below highlights the performance of the listed insurance sector, showing the performance using several metrics, and the key take-outs of the performance.
|
Cytonn Report: Listed Insurance Companies H1’2024 Earnings and Growth Metrics |
||||||||
|
Insurance |
Core EPS Growth |
Net Premium growth |
Claims growth |
Loss Ratio |
Expense Ratio |
Combined Ratio |
ROaE |
ROaA |
|
Liberty |
196.7% |
403.1% |
(295.6%) |
70.6% |
104.4% |
175.0% |
6.7% |
1.4% |
|
Sanlam |
164.1% |
28.4% |
15.6% |
89.6% |
74.3% |
163.9% |
28.0% |
0.8% |
|
Jubilee Insurance |
22.7% |
28.4% |
15.6% |
89.6% |
74.3% |
163.9% |
4.8% |
1.3% |
|
Britam |
22.6% |
7.4% |
14.6% |
76.2% |
69.1% |
145.3% |
8.0% |
2.0% |
|
CIC |
0.6% |
(0.4%) |
(6.9%) |
81.0% |
29.1% |
110.1% |
7.9% |
1.3% |
|
*H1'2024 Weighted Average |
39.6% |
51.7% |
(18.2%) |
81.1% |
68.2% |
149.4% |
7.3% |
1.6% |
|
**H1'2023 Weighted Average |
(235.5%) |
6.7% |
(3.6%) |
57.8% |
56.4% |
114.2% |
3.2% |
1.0% |
|
*Market cap weighted as at 18/10/2024 |
||||||||
|
**Market cap weighted as at 27/10/2023 |
||||||||
The key take-outs from the above table include;
- Core EPS growth recorded a weighted growth of 39.6%, significantly higher compared to the weighted decline of 235.5%, in H1’2023. The improved growth in earnings was attributable to increased premiums during the period following continued recovery by the sector from the impacts of the COVID-19 pandemic, coupled with higher yields from government papers,
- The premiums grew at a significantly quicker pace of 51.7% in H1’2024, compared to a growth of 6.7% in H1’2023, while claims declined at a higher rate of 18.2% in H1’2024, from the 3.6% decline recorded in H1’2023 on a weighted average basis,
- The loss ratio across the sector increased to 81.1% in H1’2024 from 57.8% in H1’2023,
- The expense ratio increased to 68.1% in H1’2024, from 56.4% in H1’2023, owing to an increase in net premiums,
- The insurance core business still remains unprofitable, with a combined ratio of 149.4% as of H1’2024, higher than the 114.2% in H1’2023, and,
- On average, the insurance sector delivered a Return on Average Equity (ROaE) of 7.3%, an increase from a weighted Return on Average Equity of 3.2% in H1’2023.
Based on the Cytonn H1’2024 Insurance Report, we ranked insurance firms from a franchise value and from a future growth opportunity perspective with the former getting a weight of 40.0% and the latter a weight of 60.0%.
For the franchise value ranking, we included the earnings and growth metrics as well as the operating metrics shown in the table below in order to carry out a comprehensive review:
|
Cytonn Report: Listed Insurance Companies H1’2024 Franchise Value Score |
||||||
|
Insurance Co. |
Loss Ratio |
Expense Ratio |
Combined Ratio |
Tangible Common Ratio |
Franchise Value Score |
Ranking |
|
Britam |
76.2% |
69.1% |
145.3% |
13.1% |
13 |
1 |
|
Liberty |
70.6% |
104.4% |
175.0% |
18.0% |
15 |
2 |
|
CIC |
81.0% |
29.1% |
110.1% |
13.9% |
17 |
3 |
|
Jubilee Insurance |
89.6% |
74.3% |
163.9% |
25.8% |
21 |
4 |
|
Sanlam |
89.6% |
74.3% |
163.9% |
1.5% |
24 |
5 |
|
*H1'2024 Weighted Average |
81.1% |
68.2% |
149.4% |
17.6% |
|
|
The Intrinsic Valuation is computed through a combination of valuation techniques, with a weighting of 40.0% on Discounted Cash-flow Methods, 35.0% on Residual Income, and 25.0% on Relative Valuation. The overall H1’2023 ranking is as shown in the table below:
|
Cytonn Report: Listed Insurance Companies H1’2024 Comprehensive Ranking |
|||||
|
Bank |
Franchise Value Score |
Intrinsic Value Score |
Weighted Score |
H1’2024 Ranking |
H1’2023 Ranking |
|
Jubilee Holdings |
4 |
1 |
2.2 |
1 |
2 |
|
Britam Holdings |
1 |
4 |
2.8 |
2 |
5 |
|
CIC Group |
3 |
3 |
3.0 |
3 |
1 |
|
Sanlam Kenya |
5 |
2 |
3.2 |
4 |
4 |
|
Liberty Holdings |
2 |
5 |
3.8 |
5 |
3 |
Major Changes from the H1’2023 Ranking are;
- Jubilee Holdings improved to position 1 in H1’2024 mainly due to the strong intrinsic scores and an improvement in franchise score in H1’2024, driven by a decrease in loss ratio to 89.6% in H1’2024, from 114.5% recorded in H1’2023
- Britam Holdings improved to position 2 in H1’2024 driven by an improvement in franchise score, attributable to the improvement in return on average assets to 2.0%, from 1.0%, coupled with a decline in expense ratio to 69.1% in H1’2024 from 71.4% recorded in H1’2023,
- CIC Group declined to position 3 in H1’2024, mainly due to declines in franchise scores in H1’2024, driven by the deterioration in the net premium growth to a decline of 0.4%, from the 19.9% growth recorded in H1’2023, and,
- Liberty Holdings declined to position 5 in H1’2024 driven by a deterioration in franchise score, attributable to the increase in the expense ratio to 104.4%, from a 71.2% recorded in H1’2023.
Section V: Conclusion & Outlook of the Insurance Sector
With the recent improvements in the Kenyan economy, the insurance industry is poised for a more positive outlook. As inflationary pressures continue to ease and the currency stabilizes, households are expected to have higher disposable income, which can help boost insurance penetration rates. While the industry continues to face challenges, it also benefits from ongoing digital transformation and innovation, which began to accelerate during the pandemic. Regulatory improvements and customer-centric approaches remain key areas of focus. The improved economic conditions provide a more stable environment for insurers to grow, with opportunities to enhance product offerings, improve customer engagement, and tailor policies that cater to the shifting financial capabilities of consumers.
The insurance sector should build on the following strategies to sustain growth and capitalize on the economic upturn:
- Partnerships and alternative distribution channels: We anticipate that underwriters will continue to form alliances and offer additional distribution channels in the future. This can be accomplished by collaborating with other financial services providers, such as fund managers who have moved into delivering insurance-linked products, in addition to the present bancassurance connection with banks. The insurance business can also use the penetration of bank products to promote their own products. For instance, in July 2024, NCBA Group announced the completion of a 100.0% acquisition of AIG Kenya Insurance Company (AIG Kenya). This move allows NCBA to leverage its physical and digital platforms to boost insurance penetration in Kenya and the wider East African region. This acquisition aligns with the broader trend of partnerships and alternative distribution channels, as NCBA’s collaboration with AIG Kenya demonstrates how banks and insurance providers can work together to broaden access to insurance products,
- Regional Diversification - As insurers look to expand their portfolios and mitigate risks, entering new markets can provide growth opportunities and help spread exposure across multiple economies. This strategy allows companies to tap into underpenetrated regions, improving overall revenue streams and reducing dependence on local markets. By entering emerging and underserved markets, insurers can gain access to new customer bases, diversify their product offerings, and strengthen their positions across Africa and beyond. For instance, in June 2024, Britam announced its plans to expand into the Democratic Republic of Congo (DRC) as part of its five-year strategy to grow regionally. This expansion builds on its success in international markets, which contributed 29.0% of its total insurance revenue in 2023. With strong performance driving a 65.0% increase in profit before tax, Britam continues to focus on growth and customer-centric transformation,
- Regulations - To ensure the sector's solvency and sustainability, we anticipate more regulation from the regulatory body and other international stakeholders. Insurers must modify their insurance contract recognition techniques in advance of the implementation of IFRS 17. The regulator's quest for the targeted capital adequacy levels will almost certainly result in further consolidations as insurers struggle to achieve the capital requirements, particularly for small firms. Furthermore, regulators, governments, and policymakers are working harder to make Environmental, Social, and Governance (ESG) standards a requirement in the insurance industry,
- Innovation: To aid portfolio expansion and growth, insurers must harness the digital insurance solutions at their disposal in order to improve internal efficiency and accelerate time to market. As such, we anticipate cooperation between insurers and InsurTechs. For instance, in July 2024, the Insurance Regulatory Authority (IRA) launched The BimaLab Africa Accelerator Programme 2024. This program aims to offer hands-on support to startups developing insurance solutions for underserved, climate-vulnerable communities. The accelerator fosters innovation by connecting investors, building capacity, and unlocking capital, creating a strong ecosystem for InsurTechs to collaborate with traditional insurers in developing tailored solutions for these communities,
- Investment diversification - To improve earnings and reduce losses, underwriters should focus more on investment diversification through routes such as pension plans, unit trusts, fund management, and investment advisories. As indicated by rising combined ratios, insurers have suffered losses in their core business, with increases in underwriting expenditures and claims exceeding increases in premiums. In addition, we anticipate insurers will continue to investigate non-traditional asset types such as infrastructure, and,
- Insurance awareness campaigns – Low insurance penetration is significantly impacted by the persistent information gap about insurance products and their significance. Insurance is still largely assumed to be regulatory compliance rather than a necessity. The regulators, insurers, and other stakeholders should enhance insurance awareness campaigns to increase understanding of insurance products. According to a survey commissioned by the Association of Kenya Insurers (AKI), the second largest contributor to low insurance uptake at 27.0% is a lack of knowledge of the various insurance products and their benefits. As such, there is a lot of headroom for insurers to educate, repackage, and tailor their products to different potential clients.
For more information, please read our H1’2024 Listed Insurance Sector full report.
Disclaimer: The views expressed in this publication are those of the writers where particulars are not warranted. This publication is meant for general information only and is not a warranty, representation, advice, or solicitation of any nature. Readers are advised in all circumstances to seek the advice of a registered investment advisory.

- Talk to us
- Kenya
- P.O Box 20695 - 00200, Nairobi, Kenya
- Cell +254709101200
- Tel +254709101200
- WhatsApp +254741676635
- United States
- +254709101200
- DOWNLOAD OUR APP
-


- Kenya
- 8th Floor, Pinetree Plaza, Kaburu Drive, Ngong Road, Nairobi, Kenya
- USA
- Suite 1150, 1775 Eye Street NW, USA, Washington DC 20006, USA
- Investments
- High Yield
- Private Equity
- Real Estate
- Real Estate
- RiverRun Estates
- Cytonn Towers
- The Ridge
- Taraji Heights
- The Alma