Kenya H1'2025 Listed Insurance Report, & Cytonn Weekly #41/2025
By Research Team, Oct 12, 2025
Executive Summary
Fixed Income
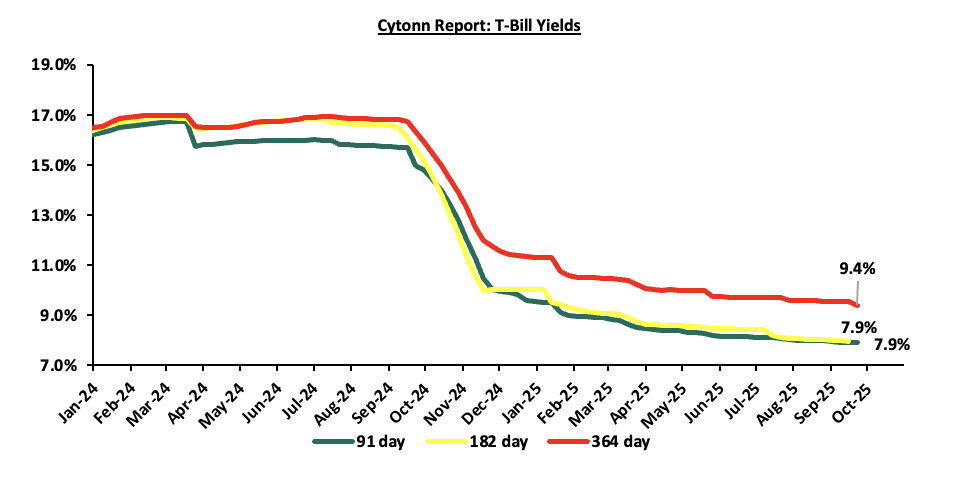
During the week, T-bills were oversubscribed for the first time in four weeks, with the overall subscription rate coming in at 106.9%, higher than the subscription rate of 63.1% recorded the previous week. Investors’ preference for the shorter 91-day paper increased, with the paper receiving bids worth Kshs 3.6 bn against the offered Kshs 4.0 bn, translating to a subscription rate of 90.0%, higher than the subscription rate of 40.4%, recorded the previous week. The subscription rates for the 182-day paper decreased to 28.5% from the 61.3% recorded the previous week, while that of the 364-day paper increased to 192.0% from the 73.8% recorded the previous week. The government accepted a total of Kshs 25.58 bn worth of bids out of Kshs 25.64 bn bids received, translating to an acceptance rate of 99.8%.The yields on the government papers were on a downward trajectory with the yields on the 364-day paper decreasing the most by 15.0 bps to 9.39% from the 9.54% recorded the previous week, while the yields on the 182-day and 91-day papers decreased by 5.5 bps and 3.3 bps respectively to 7.93% and 7.89% from the 7.98% and 7.92% respectively recorded the previous week;
During the week, the monetary policy committee met on October 7th, 2025, to review the outcome of its previous policy decisions against a backdrop of elevated uncertainties in the global economic outlook. The global economic growth is being shaped be much lower sticky growth in advanced economies due to heightened trade tensions and persistent geopolitical tensions. The MPC decided to lower the CBR rate by 25.0 bps to 9.25%, from 9.50% in August 2025;
Equities
During the week, the equities market was on a downward trajectory, with NASI, NSE 20, NSE 25 and NSE 10 losing by 3.3%, 2.9%, 1.8%, and 1.8%, respectively, taking the YTD performance to gains of 42.9%, 37.7%, 32.6% and 32.4% for NSE 20, NASI, NSE 25, and NSE 10 respectively. The equities market performance was mainly driven by losses recorded by large-cap stocks such as Safaricom, Cooperative Bank and NCBA of 6.2%, 3.4%, and 2.5%, respectively. The losses were, however, supported by gains recorded by large cap stocks such as EABL, Equity and Stanbic of 1.9%, 1.3% and 0.5% respectively;
Additionally, in the regional equities market, the East African Exchanges 20 (EAE 20) share index declined by 1.2%, attributable to losses recorded by large cap stocks such as Tanga Cement, Safaricom Plc and Cooperative of 15.0%, 5.2% and 4.0% respectively. The performance was however supported by gains recorded by large cap stocks such as CRDB, MTN Uganda and Airtel Uganda of 5.3%, 2.5% and 2.2% respective;
During the week, Kenya Power & Lighting Company Plc (KPLC) released its FY’2025 financial results, recording an 18.7% decline in profitability. The company posted a profit after tax (PAT) of Kshs 24.5 bn, down from Kshs 30.1 bn in FY’2024. The decline in performance was mainly attributable to a 7.3% decline in gross profit to Kshs 74.6 bn, from Kshs 80.5 bn in FY’2024, following a 5.1% decrease in revenue to Kshs 219.3 bn from Kshs 231.1 which outpaced the 3.9% reduction in cost of sales to Kshs 144.7 bn from Kshs 150.6 bn;
Real Estate
During the week, the National Treasury announced a plan to raise Kshs 540.0 bn through infrastructure bonds for expansion of the Standard Gauge Railway (SGR) and the Jomo Kenyatta International Airport, less than a year after it cancelled a deal with the Adani Group. The breakdown of the bonds will be as follows; Kshs 387.0 bn will be for the extension of the SGR line from Naivasha to Malaba and Kshs 154.8 bn for the expansion of JKIA through a securitised bond;
On the Unquoted Securities Platform, Acorn D-REIT and I-REIT traded at Kshs 27.4 and Kshs 23.2 per unit, respectively, as per the last updated data on 26th September 2025. The performance represented a 37.0% and 16.0% gain for the D-REIT and I-REIT, respectively, from the Kshs 20.0 inception price. Additionally, ILAM Fahari I-REIT traded at Kshs 11.0 per share as of 26th September 2025, representing a 45.0% loss from the Kshs 20.0 inception price;
Focus of the Week
Following the release of H1’2025 results by insurance companies, the Cytonn Financial Services Research Team undertook an analysis on the performance of the 5 listed insurance companies in Kenya, identified the key factors that influenced their performance, and gave our outlook for the insurance sector going forward.
Money Markets, T-Bills Primary Auction:
This week, T-bills were oversubscribed for the first time in four weeks, with the overall subscription rate coming in at 106.9%, higher than the subscription rate of 63.1% recorded the previous week. Investors’ preference for the shorter 91-day paper increased, with the paper receiving bids worth Kshs 3.6 bn against the offered Kshs 4.0 bn, translating to a subscription rate of 90.0%, higher than the subscription rate of 40.4%, recorded the previous week. The subscription rates for the 182-day paper decreased to 28.5% from the 61.3% recorded the previous week, while that of the 364-day paper increased to 192.0% from the 73.8% recorded the previous week. The government accepted a total of Kshs 25.58 bn worth of bids out of Kshs 25.64 bn bids received, translating to an acceptance rate of 99.8%.The yields on the government papers were on a downward trajectory with the yields on the 364-day paper decreasing the most by 15.0 bps to 9.39% from the 9.54% recorded the previous week, while the yields on the 182-day and 91-day papers decreased by 5.5 bps and 3.3 bps respectively to 7.93% and 7.89% from the 7.98% and 7.92% respectively recorded the previous week.
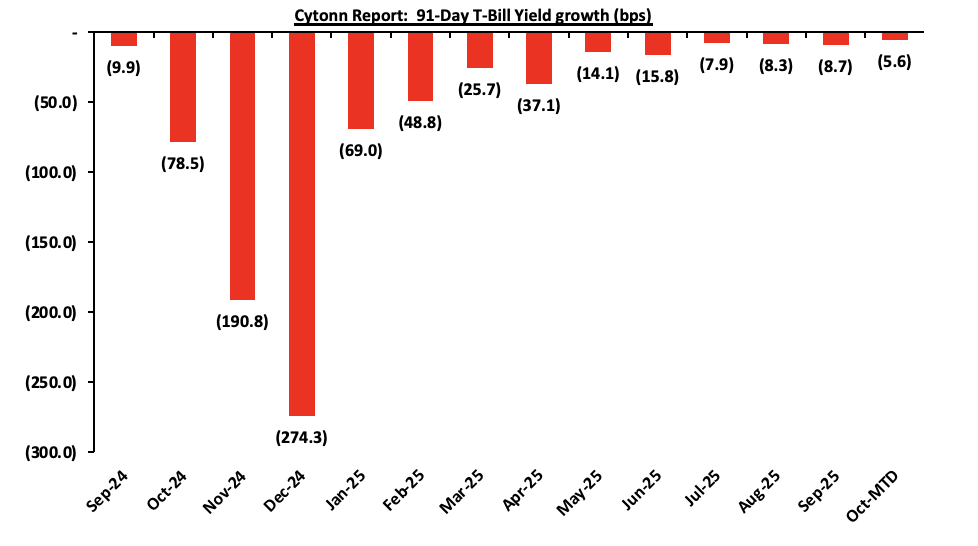
The chart below shows the yield evolution of the 91-day t-bill in the year to September 2025 and month-to-date:
The charts below show the performance of the 91-day, 182-day and 364-day papers from January 2024 to October 2025:
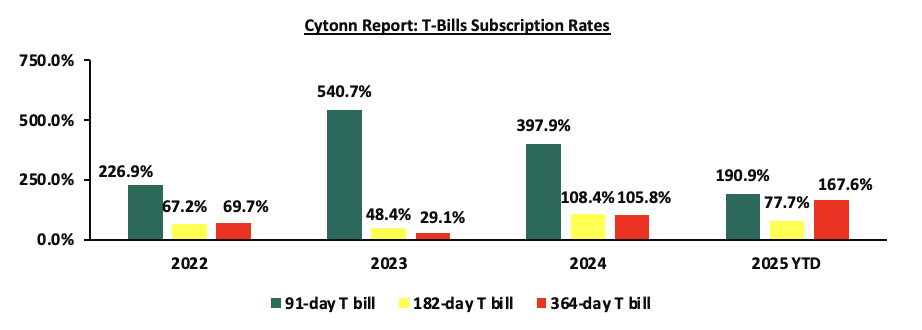
The chart below compares the overall average T-bill subscription rates obtained in 2022,2023, 2024 and 2025 Year-to-date (YTD):
Money Market Performance:
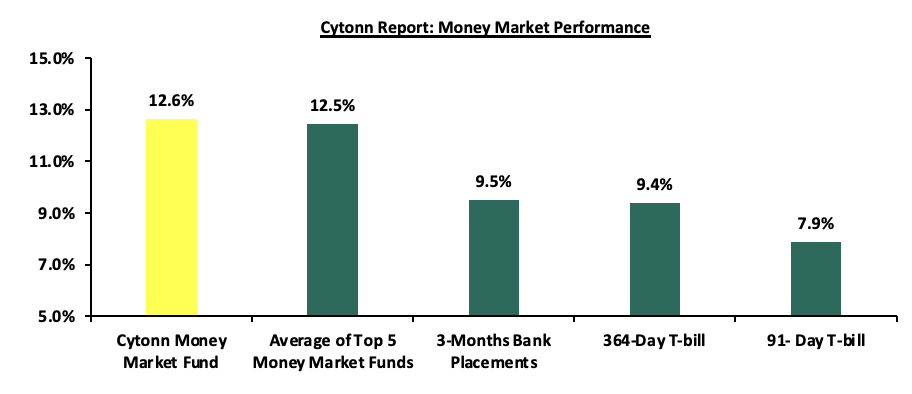
In the money markets, 3-month bank placements ended the week at 9.5% (based on what we have been offered by various banks). The yield on the 364-day and 91-day papers decreased by 15.0 bps and 3.3 bps to 9.39% and 7.89% from the 9.54% and 7.92% respectively recorded the previous week. The yield on the Cytonn Money Market Fund decreased by 7.0 bps to 12.6%, from 12.7% recorded in the previous week, while the average yields on the Top 5 Money Market Funds decreased by 1.0 bps to remain relatively unchanged from the 12.5% recorded the previous week.
The table below shows the Money Market Fund Yields for Kenyan Fund Managers as published on 10th October 2025:
|
Money Market Fund Yield for Fund Managers as published on 10th October 2025 |
||
|
Rank |
Fund Manager |
Effective Annual Rate |
|
1 |
Ndovu Money Market Fund |
13.1% |
|
2 |
Cytonn Money Market Fund (Dial *809# or download Cytonn App) |
12.6% |
|
3 |
Nabo Africa Money Market Fund |
12.4% |
|
4 |
Gulfcap Money Market Fund |
12.2% |
|
5 |
Etica Money Market Fund |
12.0% |
|
6 |
Lofty-Corban Money Market Fund |
11.9% |
|
7 |
Kuza Money Market fund |
11.1% |
|
8 |
Enwealth Money Market Fund |
11.1% |
|
9 |
Orient Kasha Money Market Fund |
10.9% |
|
10 |
Jubilee Money Market Fund |
10.9% |
|
11 |
British-American Money Market Fund |
10.8% |
|
12 |
Old Mutual Money Market Fund |
10.7% |
|
13 |
GenAfrica Money Market Fund |
10.6% |
|
14 |
Arvocap Money Market Fund |
10.6% |
|
15 |
Madison Money Market Fund |
10.3% |
|
16 |
Apollo Money Market Fund |
10.0% |
|
17 |
Dry Associates Money Market Fund |
10.0% |
|
18 |
Faulu Money Market Fund |
9.6% |
|
19 |
Sanlam Money Market Fund |
9.4% |
|
20 |
Mali Money Market Fund |
9.3% |
|
21 |
CPF Money Market Fund |
9.0% |
|
22 |
KCB Money Market Fund |
9.0% |
|
23 |
Co-op Money Market Fund |
8.8% |
|
24 |
ICEA Lion Money Market Fund |
8.7% |
|
25 |
CIC Money Market Fund |
8.5% |
|
26 |
Genghis Money Market Fund |
8.5% |
|
27 |
Mayfair Money Market Fund |
8.5% |
|
28 |
Absa Shilling Money Market Fund |
8.0% |
|
29 |
AA Kenya Shillings Fund |
7.4% |
|
30 |
Stanbic Money Market Fund |
6.5% |
|
31 |
Ziidi Money Market Fund |
6.3% |
|
32 |
Equity Money Market Fund |
5.0% |
Source: Business Daily
Liquidity:
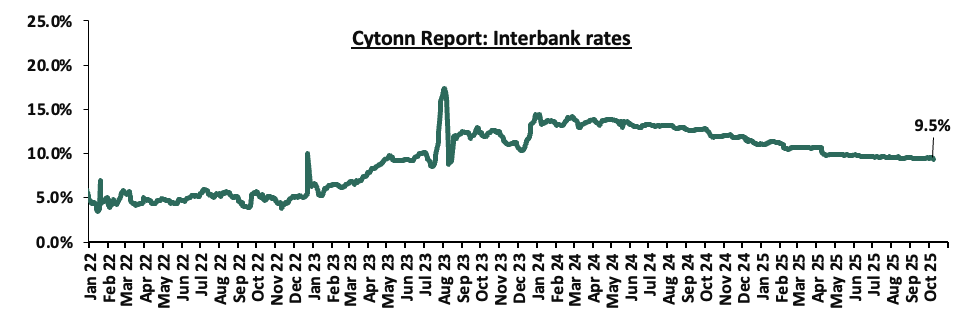
During the week, liquidity in the money markets marginally eased with the average interbank rate decreasing by 3.8 bps, to remain relatively unchanged from the 9.5% recorded the previous week, partly attributable to government payments that offset tax remittances. The average interbank volumes traded increased significantly by 5.5% to Kshs 15.9 bn from Kshs 15.1 bn recorded the previous week. The chart below shows the interbank rates in the market over the years:
Kenya Eurobonds:
During the week, the yields on Kenya’s Eurobonds were on an upward trajectory with the yields on the 13-year Eurobond issued in 2021 increasing the most by 17.4 bps to 8.6% from 8.4% recorded the previous week. The table below shows the summary performance of the Kenyan Eurobonds as of 9th October 2025;
|
Cytonn Report: Kenya Eurobond Performance |
|||||||
|
|
2018 |
2019 |
2021 |
2024 |
2025 |
||
|
Tenor |
10-year issue |
30-year issue |
7-year issue |
12-year issue |
13-year issue |
7-year issue |
11-year issue |
|
Amount Issued (USD) |
1.0 bn |
1.0 bn |
0.9 bn |
1.2 bn |
1.0 bn |
1.5 bn |
1.5 bn |
|
Years to Maturity |
2.5 |
22.5 |
1.7 |
6.7 |
8.8 |
5.5 |
10.5 |
|
Yields at Issue |
7.3% |
8.3% |
7.0% |
7.9% |
6.2% |
10.4% |
9.9% |
|
2-Jan-25 |
9.1% |
10.3% |
8.5% |
10.1% |
10.1% |
10.1% |
|
|
1-Oct-25 |
5.8% |
9.3% |
- |
8.1% |
8.4% |
7.9% |
|
|
2-Oct-25 |
5.8% |
9.3% |
- |
8.1% |
8.4% |
7.9% |
|
|
3-Oct-25 |
5.8% |
9.3% |
- |
8.1% |
8.4% |
7.9% |
|
|
6-Oct-25 |
5.9% |
9.4% |
- |
8.3% |
8.6% |
8.0% |
|
|
7-Oct-25 |
5.9% |
9.4% |
- |
8.3% |
8.6% |
8.0% |
|
|
8-Oct-25 |
5.9% |
9.4% |
- |
8.3% |
8.6% |
8.1% |
10.0% |
|
9-Oct-25 |
5.9% |
9.4% |
- |
8.3% |
8.6% |
8.1% |
|
|
Weekly Change |
0.0% |
0.2% |
- |
0.1% |
0.2% |
0.2% |
- |
|
MTD Change |
0.0% |
0.2% |
- |
0.1% |
0.2% |
0.2% |
0.0% |
|
YTD Change |
(3.2%) |
(0.8%) |
- |
(1.8%) |
(1.5%) |
(2.0%) |
0.0% |
Source: Central Bank of Kenya (CBK) and National Treasury
Kenya Shilling:
During the week, the Kenya Shilling appreciated marginally by 0.02 bps to remain relatively unchanged from the Kshs.129.2 recorded previous week. On a year-to-date basis, the shilling has appreciated by 5.1 bps against the dollar, compared to the 17.6% appreciation recorded in 2024.
We expect the shilling to be supported by:
- Diaspora remittances standing at a cumulative USD 5,078.8 mn in the twelve months to August 2025, 9.4% higher than the USD 4,644.5 mn recorded over the same period in 2024. These has continued to cushion the shilling against further depreciation. In the August 2025 diaspora remittances figures, North America remained the largest source of remittances to Kenya accounting for 60.6% in the period,
- The tourism inflow receipts which came in at Kshs 452.2 bn in 2024, a 19.8% increase from Kshs 377.5 bn inflow receipts recorded in 2023, and owing to tourist arrivals that improved by 9.9% to 2,424,382 in the 12 months to June 2025 from 2,206,469 in the 12 months to June 2024, and,
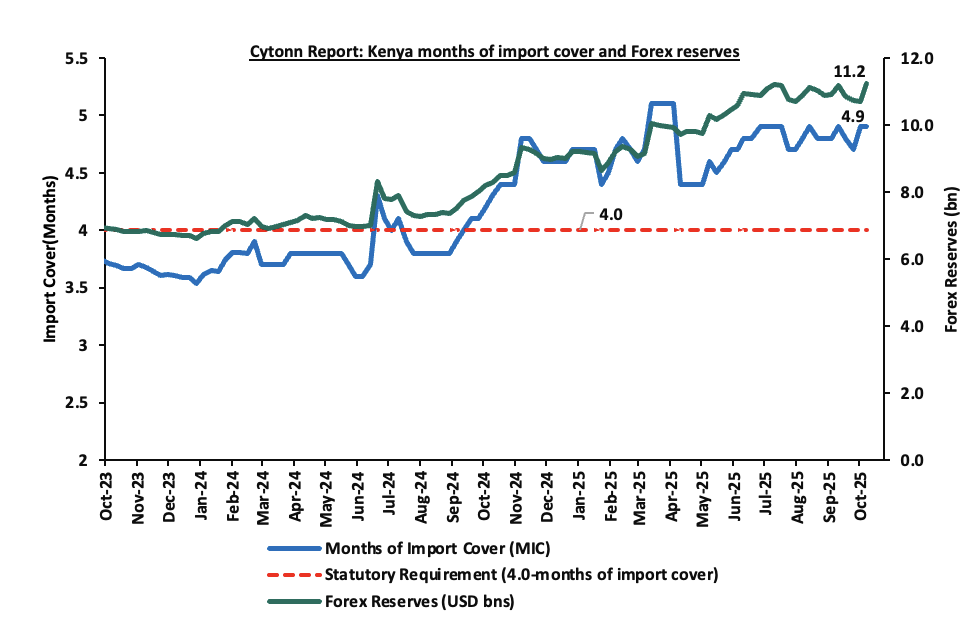
- Improved forex reserves currently at USD 11.2 bn (equivalent to 4.9-months of import cover), which is above the statutory requirement of maintaining at least 4.0-months of import cover and above the EAC region’s convergence criteria of 4.5 months of import cover.
The shilling is however expected to remain under pressure in 2025 as a result of:
- An ever-present current account deficit which came at 2.1% of GDP in the twelve months to August 2025, and,
- The need for government debt servicing, continues to put pressure on forex reserves given that 61.4% of Kenya’s external debt is US Dollar-denominated as of March 2025.
Key to note, Kenya’s forex reserves decreased by 4.8% during the week, to USD 11.2 bn from the USD 10.7 bn recorded in the previous week, equivalent to 4.9 months of import cover, and above the statutory requirement of maintaining at least 4.0-months of import cover and above the EAC region’s convergence criteria of 4.5 months of import cover.
The chart below summarizes the evolution of Kenya's months of import cover over the years:
Weekly Highlights
- Monetary policy committee October meeting
The monetary policy committee met on October 7th, 2025, to review the outcome of its previous policy decisions against a backdrop of elevated uncertainties to the global outlook for growth, lower but sticky inflation in advanced economies, heightened trade tensions as well as persistent geopolitical tensions. The MPC decided to lower the CBR rate by 25.0 bps to 9.25%, from 9.50% in August 2025 in line with our forecast which predicted a cut to 9.00 -9,25%. Notably, inflation rates remain anchored and remained within the CBK preferred range of 2.5%-7.5% for the twenty seventh consecutive month, with an increase of 0.1% points to 4.6% in September 2025, from 4.5% in August 2025. Key to note, the MPC had cut the CBR rate to 9.50% in the previous meeting in August from 9.75% in June 2025. Below are some of the key highlights from the October meeting:
- The overall inflation increased by 0.1% points to 4.6% in September 2025, from 4.5% in August 2025, remaining below the mid-point of the preferred CBK range of 2.5%-7.5%. Core inflation decreased to 2.9% in September 2025, from 3.0% in August, largely attributable to lower prices of processed foods particularly maize flour. Additionally, non-core inflation rose to 9.6% in September 2025, from 9.2% in August, driven by higher prices of vegetables, particularly tomatoes, carrots, onions, and cabbages. Overall inflation is expected to remain below the midpoint of the target range in the near term, supported by stable energy prices, and continued exchange rate stability.
- The recently released Quarterly Gross Domestic Product Report, for Q2’2025 showed a resilience in the performance of the Kenyan economy, with real GDP growing by 5.0%, compared to a growth of 4.6% recorded in Q2’2024. This was attributable to expansion in growth activity in the industrial sector, stable growth of the agriculture sector, and resilience of key service sectors particularly transport and storage, finance and insurance, information and communication, and wholesale and retail trade. The economy is expected to continue to strengthen in 2025 with real GDP growth projected at 5.2% and 5.5% in 2025 and 2026 respectively, supported by continued resilience of key service sectors and agriculture, and continued recovery of the industry sector.However, this positive outlook is tempered by the elevated trade policy uncertainties and geopolitical tensions.
- Based on the revised balance of payments data goods exports increased by 3.6% in the 12 months to August 2025, compared to 2024, due to higher domestic exports which increased by 8.5% driven by horticulture, coffee, manufactured goods and apparel. Goods imports rose by 9.2% reflecting increases in intermediate and capital goods imports. Additionally, services receipts increased by 10.6%, driven by increased receipts from travel services, while diaspora remittances increased by 9.4%. The current account deficit in 12 months to August 2025 is estimated at 2.1% of GDP, up from 1.6% in similar period in 2024. For 2025, the current account deficit is projected at 1.7% of GDP, up from 1.3% in 2024 and is expected to be fully financed by financial account inflows, yielding a balance of payments surplus of USD 674.0 mn.
- The CBK foreign exchange reserves, which currently stand at USD 11,228.0 mn representing 4.7 months of import cover, which is above the statutory requirement of maintaining at least 4.0-months of import cover, continue to provide adequate cover and a buffer against any short-term shocks in the foreign exchange market,
- The banking sector remains stable and resilient, with strong liquidity and capital adequacy ratios. The ratio of gross non-performing loans (NPLs) to gross loans decreased to 17.1% in September 2025 from the 17.6% recorded in June 2025. Decreases in NPLs were noted in the building and construction, real estate, tourism, restaurant and hotels, and trade sectors. Banks have continued to make adequate provisions for the NPLs.
- The CEOs Survey and Market Perceptions Survey conducted in September 2025 revealed sustained optimism about business activity and economic growth prospects for the next 12 months. The optimism was attributed to improved agricultural production supported by favorable weather conditions, the stable macroeconomic environment with low inflation and stable exchange rate, declining interest rates, and resilient performance of tourism and the digital economy. Nevertheless, respondents expressed concerns about subdued consumer demand, high cost of doing business, and increased global uncertainties attributed to higher tariffs and geopolitical tensions.
- The Survey of the Agriculture Sector for September 2025 revealed an expectation that the onset of the harvest season for key crops particularly maize, stable fuel prices, and exchange rate stability will support a stable inflation rate. Nevertheless, most respondents expect higher prices of some food items, particularly vegetables, to exert moderate upward pressure on inflation in the near term due to seasonal factors.
- Global economic growth has remained resilient in 2025, supported by front-loading of exports to the United States ahead of implementation of higher tariff rates on trade, improved financial conditions, and strong consumer spending. Growth is however projected to slow down in 2026 due to higher effective tariff rates and elevated trade policy uncertainty. Additionally, weak global demand and heightened geopolitical tensions in the Middle East and the Russia-Ukraine conflict, continue to threaten global growth prospects.
- Inflation in the major economies has increased modestly in recent months, driven by higher food prices and effects of higher tariffs. Global inflation is projected to decline in 2025 and 2026, mainly driven by lower energy prices, and reduced global demand. Central banks in the major economies have remained cautious in lowering interest rates, depending on their inflation and growth outlooks. International oil prices have moderated due to increased production and subdued global demand but have remained volatile due to elevated global uncertainties. Food inflation has declined, mainly driven by lower cereals and sugar prices inflation, but edible oils price inflation remained elevated.
- The MPC noted that the revised banking sector Risk-Based Credit Pricing (RBCP) model, which will be fully operational by March 2026, will improve the transmission of monetary policy decisions to commercial banks’ lending interest rates, and enhance transparency in the pricing of loans by banks.
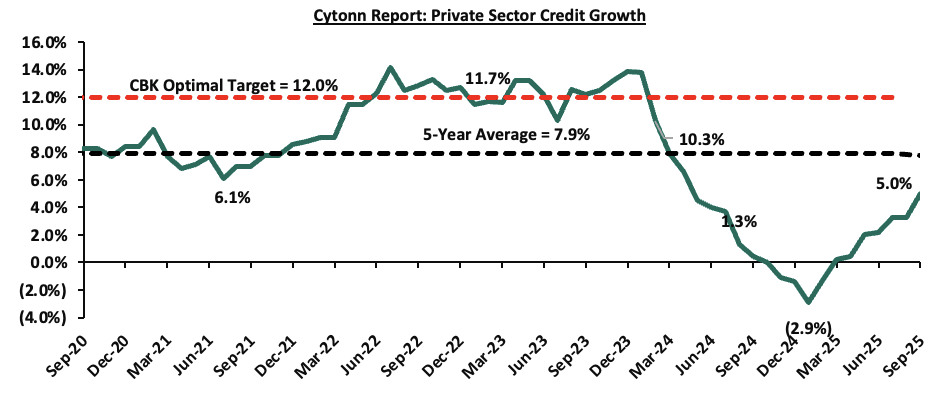
- Growth in private sector credit grew by 5.0% in September 2025 from 3.3% in August and a contraction of 2.9% in January 2025, mainly attributed to increased demand attributable to declining lending interest rates. Notably, the growth in credit was recorded in key sectors such as manufacturing, building and construction, and consumer durables since the last MPC meeting in August. Average commercial banks’ lending rates declined to 15.1% in September from 15.2% in August 2025 and 17.2% in November 2024. The chart below shows growth in private sector growth over the last five years:
- The Committee noted the ongoing implementation of the FY2025/26 Budget, which reinforces the Government’s fiscal consolidation strategy, and thereby reduces debt vulnerabilities.
The MPC noted that overall inflation is expected to remain below the midpoint of the 2.5%-5.0% target range in the near term, supported by low food prices, stable energy prices, and exchange rate stability. Additionally, central banks in major economies have continued to lower interest rates at a cautious pace. The Committee also noted that the recent economic developments, created room for further easing of monetary policy to support economic activity while maintaining exchange rate stability. The MPC noted that it will continue to monitor the effects of these policy measures, as well as global and domestic economic developments, and will remain ready to take additional action if necessary. Going forward, we expect the MPC to adopt a more cautious approach to rate adjustments in the coming meetings in a bid to continue supporting the private sector, while also keeping an eye on the effect on the inflation and exchange rate. The next MPC meeting is scheduled for December 2025.
Rates in the Fixed Income market have been on a downward trend due to high liquidity in the money market which allowed the government to front load most of its borrowing. The government is 124.9% ahead of its prorated net domestic borrowing target of Kshs 181.4 bn, having a net borrowing position of Kshs 407.9 bn (inclusive of T-bills). However, we expect stabilization of the yield curve in the short and medium term, with the government looking to increase its external borrowing to maintain the fiscal surplus, hence alleviating pressure in the domestic market. As such, we expect the yield curve to stabilize in the short to medium-term and hence investors are expected to shift towards the long-term papers to lock in the high returns
Market Performance:
During the week, the equities market was on a downward trajectory, with NASI, NSE 20, NSE 25 and NSE 10 losing by 3.3%, 2.9%, 1.8%, and 1.8%, respectively, taking the YTD performance to gains of 42.9%, 37.7%, 32.6% and 32.4% for NSE 20, NASI, NSE 25, and NSE 10 respectively. The equities market performance was mainly driven by losses recorded by large-cap stocks such as Safaricom, Cooperative Bank and NCBA of 6.2%, 3.4%, and 2.5%, respectively. The losses were, however, supported by gains recorded by large cap stocks such as EABL, Equity and Stanbic of 1.9%, 1.3% and 0.5% respectively;
Additionally, in the regional equities market, the East African Exchanges 20 (EAE 20) share index declined by 1.2%, attributable to losses recorded by large cap stocks such as Tanga Cement, Safaricom Plc and Cooperative of 15.0%, 5.2% and 4.0% respectively. The performance was however supported by gains recorded by large cap stocks such as CRDB, MTN Uganda and Airtel Uganda of 5.3%, 2.5% and 2.2% respective
During the week, equities turnover declined by 17.3% to USD 13.4 mn from USD 16.2 mn recorded the previous week, taking the YTD turnover to USD 808.5 mn. Foreign investors became sellers for the first time in two weeks, with a selling position of USD 0.7 mn, from a net buying position of USD 0.9 mn recorded the previous week, taking the YTD net selling position to USD 55.1 mn.
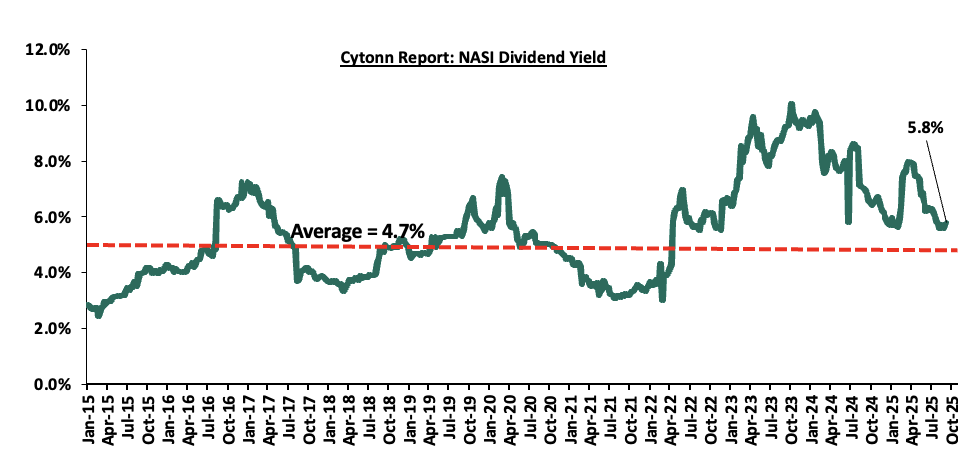
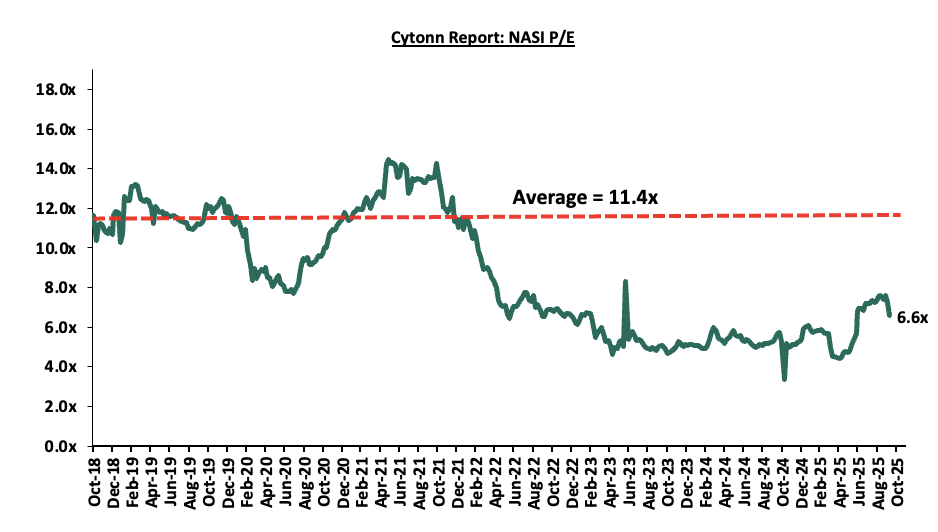
The market is currently trading at a price to earnings ratio (P/E) of 6.6x, 42.2% below the historical average of 11.4x, and a dividend yield of 5.8%, 1.1% points above the historical average of 4.7%. Key to note, NASI’s PEG ratio currently stands at 0.8x, an indication that the market is undervalued relative to its future growth. A PEG ratio greater than 1.0x indicates the market may be overvalued while a PEG ratio less than 1.0x indicates that the market is undervalued. The charts below indicate the historical P/E and dividend yields of the market;
Universe of Coverage:
|
Cytonn Report: Equities Universe of Coverage |
||||||||||||
|
Company |
Price as at 03/10/2025 |
Price as at 09/10/2025 |
w/w change |
q/q change |
YTD Change |
Year Open 2025 |
Target Price* |
Dividend Yield |
Upside/ Downside** |
P/TBv Multiple |
Recommendation |
|
|
Diamond Trust Bank |
105.00 |
103.25 |
(1.7%) |
35.3% |
54.7% |
66.8 |
128.3 |
6.8% |
31.0% |
0.4x |
Buy |
|
|
Standard Chartered Bank |
284.00 |
280.50 |
(1.2%) |
(5.3%) |
(1.7%) |
285.3 |
314.1 |
16.0% |
28.0% |
1.6x |
Buy |
|
|
NCBA |
70.75 |
69.00 |
(2.5%) |
16.0% |
35.3% |
51.0 |
79.0 |
8.0% |
22.5% |
1.1x |
Buy |
|
|
I&M Group |
42.95 |
42.90 |
(0.1%) |
20.3% |
19.2% |
36.0 |
48.2 |
7.0% |
19.3% |
0.8x |
Accumulate |
|
|
ABSA Bank |
22.05 |
21.90 |
(0.7%) |
12.0% |
16.2% |
18.9 |
24.1 |
8.0% |
17.9% |
1.4x |
Accumulate |
|
|
KCB Group |
57.00 |
57.00 |
0.0% |
21.8% |
34.4% |
42.4 |
63.6 |
5.3% |
16.8% |
0.7x |
Accumulate |
|
|
Equity Group |
58.25 |
56.50 |
(3.0%) |
18.6% |
17.7% |
48.0 |
61.2 |
7.5% |
15.8% |
1.0x |
Accumulate |
|
|
Co-op Bank |
20.70 |
20.00 |
(3.4%) |
19.6% |
14.6% |
17.5 |
21.1 |
7.5% |
13.2% |
0.7x |
Accumulate |
|
|
Britam |
8.92 |
8.50 |
(4.7%) |
10.7% |
46.0% |
5.8 |
9.5 |
0.0% |
12.0% |
0.8x |
Accumulate |
|
|
Stanbic Holdings |
197.50 |
198.50 |
0.5% |
12.0% |
42.0% |
139.8 |
194.8 |
10.4% |
8.6% |
1.2x |
Hold |
|
|
Jubilee Holdings |
322.75 |
320.00 |
(0.9%) |
39.7% |
83.1% |
174.8 |
312.9 |
4.2% |
2.0% |
0.5x |
Lighten |
|
|
CIC Group |
4.87 |
4.56 |
(6.4%) |
62.8% |
113.1% |
2.1 |
4.0 |
2.9% |
(8.8%) |
1.2x |
Sell |
|
|
*Target Price as per Cytonn Analyst estimates **Upside/ (Downside) is adjusted for Dividend Yield ***Dividend Yield is calculated using FY’2024 Dividends |
||||||||||||
Weekly highlights
- Kenya Power & Lighting Company Plc (KPLC) FY’2025 Financial Performance
During the week, Kenya Power & Lighting Company Plc (KPLC) released its FY’2025 financial results, recording an 18.7% decline in profitability. The company posted a profit after tax (PAT) of Kshs 24.5 bn, down from Kshs 30.1 bn in FY’2024. The decline in performance was mainly attributable to a 7.3% decline in gross profit to Kshs 74.6 bn, from Kshs 80.5 bn in FY’2024, following a 5.1% decrease in revenue to Kshs 219.3 bn from Kshs 231.1 which outpaced the 3.9% reduction in cost of sales to Kshs 144.7 bn from Kshs 150.6 bn. Additionally, net finance costs increased significantly to a loss of Kshs 4.7 bn from a gain of Kshs 0.7 bn in FY’2024, further weighing down overall profitability. On the balance sheet side, total assets increased by 8.6% to Kshs 389.0 bn, driven by a 25.8% growth in current assets, while total equity rose by 25.2% to Kshs 109.3 bn, indicating an improvement in the company’s net worth despite the dip in earnings.
The tables below summarize the company’s financial performance:
|
Cytonn Report: Kenya Power and Lighting Company (KPLC) Summarized Income Statement |
|||
|
Income Statement |
FY'2024 |
FY'2025 |
Y/Y Change |
|
Kshs (bn) |
Kshs (bn) |
||
|
Revenue from contracts with customers |
231.1 |
219.3 |
(5.1%) |
|
Cost of Sales |
(150.6) |
(144.7) |
(3.9%) |
|
Gross Profit |
80.5 |
74.6 |
(7.3%) |
|
Other Income |
7.3 |
7.3 |
0.2% |
|
Operating Costs |
(46.3) |
(42.4) |
(8.3%) |
|
Operating Profit |
41.5 |
39.5 |
(4.9%) |
|
Interest income |
1.5 |
0.6 |
(58.2%) |
|
Net Finance Costs |
0.7 |
(4.7) |
(791.6%) |
|
Profit Before Income Tax |
43.7 |
35.4 |
(19.0%) |
|
Income Tax Expenses |
(13.6) |
(10.9) |
(19.7%) |
|
Profit After Tax |
30.1 |
24.5 |
(18.7%) |
|
Earnings Per Share (Kshs) |
15.4 |
12.5 |
(18.6%) |
|
Dividend Per share (Kshs) |
0.7 |
1.0 |
42.9% |
|
Dividend Yield |
20.2% |
7.5% |
|
|
Dividend Payout Ratio |
4.5% |
8.0% |
|
Source: Kenya Power and Lighting Company (KPLC) FY’2025 financial statements
|
Cytonn Report: Kenya Power and Lighting Company (KPLC) Summarized Balance sheet |
|||
|
Balance Sheet |
FY'2024 |
FY'2025 |
Y/Y Change |
|
Kshs (bn) |
Kshs (bn) |
||
|
Property and equipment |
275.8 |
287.5 |
4.2% |
|
Current Assets |
78.1 |
98.2 |
25.8% |
|
Non-Current Assets |
4.3 |
3.3 |
(21.4%) |
|
Total Assets |
358.1 |
389.0 |
8.6% |
|
Current Liabilities |
105.5 |
117.4 |
11.3% |
|
Other Non-Current Liabilities |
165.3 |
162.3 |
(1.8%) |
|
Total Liabilities |
270.8 |
279.7 |
3.3% |
|
Total Equity |
87.3 |
109.3 |
25.2% |
|
Total Equity and liabilities |
358.1 |
389.0 |
8.6% |
Source: Kenya Power and Lighting Company (KPLC) FY’2025 financial statements
Key take outs from the financial performance include;
- Total revenue fell by 5.1% to Kshs 219.3 bn in FY’2025, from Kshs 231.1 bn in FY’2024, mainly attributed to reduced foreign exchange recoveries following the sustained stability of the Kenya Shilling and the application of a lower base tariff aligned to the approved tariff reduction path.
- Operating expenses declined by 8.3% to Kshs 42.4 bn, from Kshs 46.3 bn in FY’2024, mainly due to improved operational efficiency and lower expected credit losses following refinements to the IFRS 9 provisioning model.
- Net finance costs increased sharply to a loss of Kshs 4.7 bn in FY’2025, from a gain of Kshs 0.7 bn in FY’2024, mainly driven by the reversal of unrealised foreign exchange gains of Kshs 7.9 bn recorded in the previous year, which turned into an exchange loss of Kshs 0.8 bn in the current period following the strengthening of the Kenya Shilling. Similarly, interest income declined by 58.2% to Kshs 0.6 bn, from Kshs 1.5 bn in FY’2024, reflecting reduced investment returns and lower cash balances.
- Profit after tax (PAT) declined by 18.7% to Kshs 24.5 bn, from Kshs 30.1 bn in FY’2024, while earnings per share dropped by 18.6% to Kshs 12.5 from Kshs 15.4, attributed to lower gross margins and the adverse impact of unrealised foreign exchange movements on financing costs.
- The company’s balance sheet recorded an expansion as total assets grew by 8.6% to Kshs 389.0 bn in FY’2025, from Kshs 358.1 bn in FY’2024, mainly attributable to a 4.2% increase in property and equipment to Kshs 287.5 bn, from Kshs 275.8 bn in FY’2024, and a 25.8% growth in current assets to Kshs 98.2 bn, reflecting improved liquidity management and efficient resource utilisation.
- The company’s total liabilities recorded an increase of 3.3% to Kshs 279.7 bn in FY’2025, from Kshs 270.8 bn in FY’2024. This was mainly driven by an 11.3% rise in current liabilities to Kshs 117.4 bn, from Kshs 105.5 bn in FY’2024, which outpaced the 1.8% decline in non-current liabilities to Kshs 162.3 bn, from Kshs 165.3 bn in FY’2024, reflecting reduced long-term obligations and improved debt management.
The Board of Directors recommended a final dividend of Kshs 0.8 per share for the year ended 30th June 2025, subject to shareholder approval, to shareholders on the register as of 2nd December 2025, payable on or about 30th January 2026 in addition to the interim dividend of Kshs 0.2 per share paid earlier this year. This translates to a dividend yield of 7.5% and a dividend payout ratio of 8.0%, underscoring the company’s strengthened profitability, improved financial health, and enhanced balance sheet stability.
KPLC has maintained a resilient financial performance, supported by prudent cost management, improved operational efficiency, and strengthened liquidity. However, declining revenue, subdued interest income, and elevated finance costs present short-term challenges. The company’s strategic initiatives and government-backed projects provide opportunities for long-term growth and financial stability. KPLC’s strong balance sheet position improved financial health, and commitment to dividend payout signal a positive investment outlook, though investors should monitor cost control and revenue trends in the coming periods.
Going forward, Kenya Power aims to sustain its performance by enhancing operational efficiency, diversifying revenue streams, and leveraging strategic projects such as the Digital Superhighway and the Green Financing Program. The anticipated lifting of the moratorium on new power generation contracts is expected to boost electricity sales growth, while continued investments in infrastructure will underpin long-term financial resilience.
We are “Bullish” on the Equities markets in the short term due to current cheap valuations, lower yields on short-term government papers and expected global and local economic recovery, and, “Neutral” in the long term due to persistent foreign investor outflows. With the market currently trading at a discount to its future growth (PEG Ratio at 0.8x), we believe that investors should reposition towards value stocks with strong earnings growth and that are trading at discounts to their intrinsic value. We expect the current high foreign investors sell-offs to continue weighing down the economic outlook in the short term.
- Infrastructure Sector
Expansion of the SGR and the JKIA
During the week, the National Treasury announced a plan to raise Kshs 540.0 bn through infrastructure bonds for expansion of the Standard Gauge Railway (SGR) and the Jomo Kenyatta International Airport (JKIA), less than a year after it cancelled a deal with the Adani Group. The breakdown of the bonds will be as follows; Kshs 387.0 bn will be for the extension of the SGR line from Naivasha to Malaba and Kshs 154.8 bn for the expansion of JKIA through a securitised bond.
The government is seeking for other funding alternatives to finance its infrastructure projects due to sharply rising debt, with a focus on the Public-Private Partnerships and securitization, where bonds are by income-generating assets. Initially, the government had informed development agencies such as the Japan International Co-operation Agency, European Investment Bank and the African Development Bank of the opportunity to build the airport, borrowing on its balance sheet.
This will have immense benefits on the Real Estate sector such as
- Increased demand for land along transport corridors: whereas the SGR extends from Naivasha to Malaba, areas along that route will become more accessible and there will be value appreciation.
- Improved interest from institutional and foreign investors: With bonds backing the projects, risk will be reduced which in turn will raise investor confidence. Real Estate developers can partner in developments tied to the new infrastructure.
- Urban expansion and spillover growth where upgraded infrastructure tends to shift population and business concentrations. New growth towns may emerge along the extended railway line and real estate demand will surge.
Going forward, success will depend on integrating infrastructure with sustainable urban planning, ensuring that growth around the SGR and JKIA is not just speculative but creates livable, efficient, and economically vibrant communities.
- Real Estate Investments Trusts (REITs)
On the Unquoted Securities Platform, Acorn D-REIT and I-REIT traded at Kshs 27.4 and Kshs 23.2 per unit, respectively, as per the last updated data on 26th September 2025. The performance represented a 37.0% and 16.0% gain for the D-REIT and I-REIT, respectively, from the Kshs 20.0 inception price. The volumes traded for the D-REIT and I-REIT came in at Kshs 12.8 mn and Kshs 39.8 mn shares, respectively, with a turnover of Kshs 323.5 mn and Kshs 791.5 mn, respectively, since inception in February 2021. Additionally, ILAM Fahari I-REIT traded at Kshs 11.0 per share as of 26th September 2025, representing a 45.0% loss from the Kshs 20.0 inception price. The volume traded to date came in at 1,235,285 shares for the I-REIT, with a turnover of Kshs 1.5 mn since inception in November 2015.
REITs offer various benefits, such as tax exemptions, diversified portfolios, and stable long-term profits. However, the ongoing decline in the performance of Kenyan REITs and the restructuring of their business portfolios are hindering significant previous investments. Additional general challenges include:
- Insufficient understanding of the investment instrument among investors leading to a slower uptake of REIT products,
- Lengthy approval processes for REIT creation,
- High minimum capital requirements of Kshs 100.0 mn for REIT trustees compared to Kshs 10.0 mn for pension funds Trustees, essentially limiting the licensed REIT Trustee to banks only
- The rigidity of choice between either a D-REIT or and I-REIT forces managers to form two REITs, rather than having one Hybrid REIT that can allocate between development and income earning properties
- Limiting the type of legal entity that can form a REIT to only a trust company, as opposed to allowing other entities such as partnerships, and companies,
- We need to give time before REITS are required to list – they would be allowed to stay private for a few years before the requirement to list given that not all companies may be comfortable with listing on day one, and,
- Minimum subscription amounts or offer parcels set at Kshs 0.1 mn for D-REITs and Kshs 5.0 mn for restricted I-REITs. The significant capital requirements still make REITs relatively inaccessible to smaller retail investors compared to other investment vehicles like unit trusts or government bonds, all of which continue to limit the performance of Kenyan REITs.
We expect Kenya’s Real Estate sector to remain resilient, supported by continued investor interest across key segments such as infrastructure, as well as government initiatives like the Affordable Housing Program (AHP), and large-scale infrastructure projects such as the expansion of JKIA and the extention of the SGR from Naivasha to Malaba. These developments are expected to spur demand for housing, industrial parks, logistics facilities, and complementary commercial and social infrastructure. However, challenges such as high capital requirements and regulatory hurdles for REITs, rising construction costs, infrastructure bottlenecks, and oversupply in select market segments will continue to weigh on the sector’s optimal performance by slowing project pipelines and deterring some investor participation.
Following the release of the H1’2025 results by Kenyan insurance firms, the Cytonn Financial Services Research Team undertook an analysis on the financial performance of the listed insurance companies and the key factors that drove the performance of the sector. In this report, we assess the main trends in the sector, and areas that will be crucial for growth and stability going forward, seeking to give a view on which insurance firms are the most attractive and stable for investment. As a result, we shall address the following:
- Insurance Penetration in Kenya,
- Key Themes that Shaped the Insurance Sector in H1’2025,
- Interest rates
- Industry Highlights and Challenges,
- Performance of The Listed Insurance Sector in H1’2025, and,
- Conclusion & Outlook of the Insurance Sector.
Section I: Insurance Penetration in Kenya
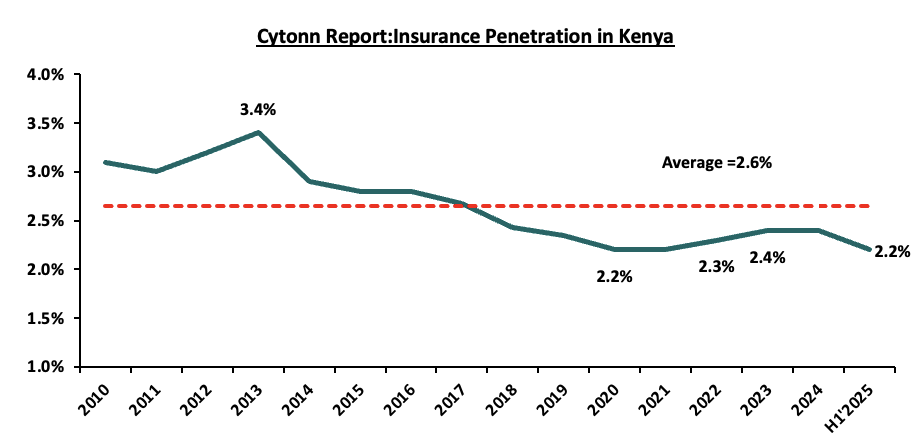
Insurance uptake in Kenya remains low compared to other key economies with the insurance penetration coming in at 2.2% as at H1’2025, according to Q2’2025 Insurance Regulatory Authority (IRA) and Central Bank of Kenya. The low penetration rate, which is below the global average of 7.4%, according to Allianz Global Insurance Report 2025, is attributable to the fact that insurance uptake is still seen as a luxury and mostly taken only when it is necessary or a regulatory requirement. Notably, insurance penetration declined by 0.2% points from 2.4% recorded in 2024, despite the mild economic recovery that saw a slight improved business environment in the country with the Stanbic Purchasing Managers Index for H1’2025 coming in at 50.5, up from 50.0 in H1’2024. The chart below shows Kenya’s insurance penetration for the last 15 years:
Source: Cytonn Research
The chart below shows the insurance penetration in other economies across Africa:
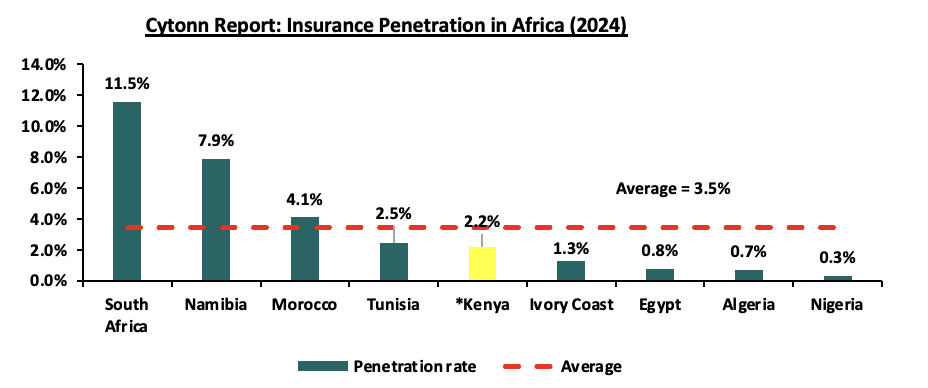
*Data as of H1’2025
Source: Atlas Magazine
Insurance penetration in Africa has remained relatively low, averaging 3.5% in 2024, mainly attributable to lower disposable income in the continent and slow growth of alternative distribution channels such as mobile phones to ensure wider reach of insurance products to the masses. South Africa remains the leader in insurance penetration in the continent, owing to a mature and highly competitive market, coupled with strong institutions and a sound regulatory environment.
Section II: Key Themes that Shaped the Insurance Sector in H1’2025
In H1’2025, the country experienced a more favourable operating environment due to relatively stable inflation and stronger Shilling. Notably, the inflation rate in H1’2025 averaged 3.7%, 1.9% points lower than the 5.6% average in H1’2024, with the Kenyan Shilling having appreciated by 5.5 bps against the USD in H1’2025 to close at Kshs 129.2, from Kshs 129.3 at the beginning of the year. As such, according to the Q2’2025 Insurance Regulatory Authority Insurance industry report, the insurance sector showcased resilience recording a 13.4% growth in gross premium to Kshs 241.3 bn in H1’2025, from Kshs 212.8 bn in H1’2024. This was supported by improved economy as the overall GDP growth rate improved to 5.0% in Q2’2025, from 4.6% recorded in a similar period last year according to Q2’2025 Quarterly Gross Domestic Product Report. Insurance claims also increased by 34.6% to Kshs 67.6 bn in H1’2025, from Kshs 50.2 bn in H1’2024.
Notably, the general insurance business contributed 53.8% of the industry’s premium income in H1’2025 compared to 45.7% contribution by long term insurance business in the same period. During the period, the long-term business premiums increased by 17.7% to Kshs 110.4 bn, from Kshs 93.8 bn in H1’2024 while the general business premiums grew by 10.4% to Kshs 129.9 bn, from Kshs 117.7 bn in 2024. Additionally, motor insurance and medical insurance classes of insurance accounted for 67.6% of the gross premium income under the general insurance business, compared to 64.0% recorded in H1’2024. As for long-term insurance business, the major contributors to gross premiums were deposit administration and life assurance classes accounting for 54.8% in H1’2025, compared to the 54.6% contribution by the two classes in H1’2024.
Microinsurance is also shaping Kenya’s insurance landscape, expanding coverage to low-income and informal sector groups. Licensed underwriters are using mobile platforms, SACCOs, and cooperatives to reach underserved populations. Governed by the Insurance (Microinsurance) Regulations, 2020, the framework caps premiums at Kshs 40.0 per day, the insured amount at Kshs 500,000.0, and limits policies to 12 months. The number of licensed microinsurers stands at six with Britam Microinsurance Kenya having the highest market share of 79.4%. In H1’2025 microinsurance premiums amounted to Kshs 1.07 bn, with the general class contributing the majority share at 97.1% while the microinsurers incurred claims amounting to Kshs 304.8 mn during the same period. The total investments under microinsurance business as at end of Q2’2025 amounted to Kshs 540.6 mn with term deposits having the highest allocations of 67.0%.
Key highlights from the industry performance:
- The sector’s investments income increased by 19.3% to Kshs 1,205.1 bn in H1’2025, from Kshs 1,010.5 bn in H1’2024, mainly attributable to the 22.6% increase in the investment income in the long-term to Kshs 933.8 bn, from Kshs 761.6 bn in 2023, coupled with the 12.5% increase in investment income in the general insurance business to Kshs 189.8 bn, from Kshs 168.7 bn in H1’2024,
- Continued recovery from the ripple effects of the pandemic witnessed in 2020 that saw both individuals and businesses seek insurance uptake to cover for their activities, leading to growth in gross premiums which increased by 13.4% to Kshs 241.3 bn in H1’2025, from Kshs 212.8 bn in H1’2024,
- The insurance industry’s asset base grew by 18.4% to Kshs 1.4 tn at the end of Q2’2025, up from Kshs 1.2 tn in Q2’2024. Of this total,87.8% was invested in income-generating investments.
- Enhanced convenience and operational efficiency driven by the use of alternative distribution and premium collection channels, including Bancassurance and strengthened agency networks, and,
- Technological advancements and innovation have enabled premium payments to be made easily via mobile phones.
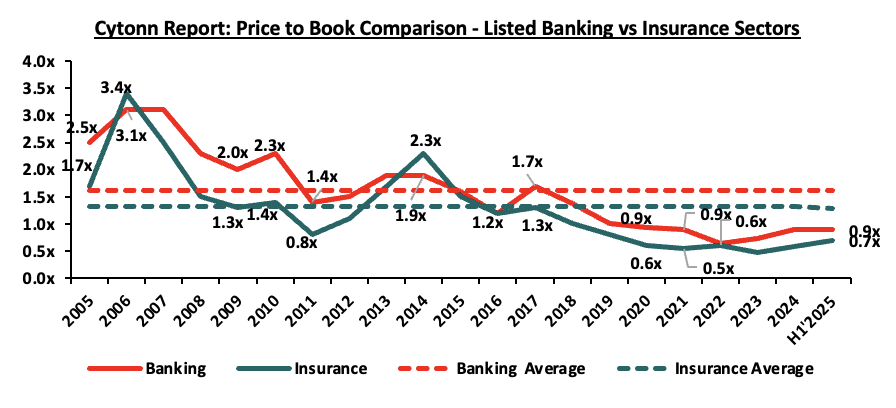
On valuations, listed insurance companies are trading at a price to book (P/Bv) of 0.7x, lower than listed banks at 0.9x, but both are lower than their 16-year historical averages of 1.3x and 1.6x, for the insurance and banking sectors respectively. These two sectors are attractive for long-term investors supported by the strong economic fundamentals. The chart below shows the price to book comparison for Listed Banking and Insurance Sectors:
 \
\
Source: Cytonn Research
The key themes that have continued to drive the insurance sector include:
- Technology and Innovation
The insurance industry was slow to adopt digital solutions, but the COVID-19 pandemic in 2020 made online distribution essential. Since then, many insurers have turned to digital platforms to drive growth and expand insurance coverage nationwide. In April 2024, CIC Group announced the launch of Easy Bima, a digital motor insurance product. This solution enables customers to spread the cost of their comprehensive motor insurance premiums into equal monthly instalments over a 12-month period, offering greater flexibility and affordability. By utilizing digital platforms, it enhances accessibility to insurance, particularly for individuals who find it challenging to make lump-sum payments. Consumers often term insurance as difficult and complex to understand. This sentiment has been established through various studies carried out to establish reasons for low uptake of insurance, the latest being the 2024 Fin Access Survey. The survey found that 63.2% of the respondents do not afford premiums while 19.4% lacks awareness of the products. Additionally in February 2025, Jubilee insurance launched J-Force a digital solution aimed at improving efficiency in insurance distribution by simplifying policy administration, client interaction, and transaction handling. In addition to providing real-time business analytics, J-Force empowers intermediaries to work faster and more accurately facilitating client onboarding, lead management, policy issuance, and renewal tracking in a smooth, fully digital environment.
- Regulation
To position the sector within a globally competitive financial services landscape, the regulator has been actively implementing regulations aimed at tackling both longstanding and emerging challenges. The COVID-19 environment proved challenging especially on the regulatory front, as it was a balance between remaining prudent as an underwriter and adhering to the set regulations given the negative effects the pandemic. Regulations used for the insurance sector in Kenya include the Insurance Act Cap 487 and its accompanying schedule and regulations, Retirement Benefits Act Cap 197 and The Companies Act. In H1’2025, regulation remained a key aspect affecting the insurance sector and the key themes in the regulatory environment include;
- IFRS 17- IFRS 9, Financial Instruments was replaced with IFRS 17. The adoption of IFRS 17 has reshaped financial reporting in the insurance sector by emphasizing transparency, consistency, and market-based valuation of insurance contracts. Insurers are now experiencing more volatile earnings due to the recognition of contractual service margins and the impact of changing discount rates. Balance sheets have been restructured as liabilities and reserves are reassessed to reflect future obligations, while disclosures have become more detailed to explain performance drivers across insurance service results, investment income, and reinsurance. The transition has also increased compliance costs and reporting complexity as firms adjust systems and data frameworks.
- Risk Based Supervision - IRA has been implementing risk-based supervision through guidelines that require insurers to maintain a capital adequacy ratio of at least 200.0% of the minimum capital. The regulation requires insurers to monitor the capital adequacy and solvency margins on a quarterly basis, with the main objective being to safeguard the insurer’s ability to continue as a going concern and provide shareholders with adequate returns. We expect more mergers within the industry as smaller companies struggle to meet the minimum capital adequacy ratios. We also expect insurance companies to adopt prudential practices in managing and taking on risk and reduction of premium undercutting in the industry as insurers will now have to price risk appropriately.
- Insurance Professionals- The Insurance Professionals Act, 2025 introduced mandatory licensing, examinations, and a code of conduct for all insurance practitioners through the Insurance Institute of Kenya and the Insurance Professionals Examinations Board. It aims to enhance accountability, professionalism, and consumer confidence. Alongside the Insurance (Amendment) Act, 2023, which raised penalties for management misconduct and failure to settle claims, the reform framework emphasizes stricter oversight, ethical practice, and better protection for policyholders.
- Capital Raising and share purchase.
The move to a risk-based capital adequacy framework presented opportunities for capital raising initiatives mostly by the small players in the sector to shore up their capital and meet compliance measures. With the new capital adequacy assessment framework, capital is likely to be critical to ensuring stability and solvency of the sector to ensure the businesses are a going concern. According to the updated Insurance act 2022,General insurers are required to have at least Kshs 600 mn while life insurance providers are required to have Kshs 400 mn in minimum capital and Kshs 50.0 mn for microinsurers. In May 2022, Sanlam Limited, a South African financial services group listed on the Johannesburg Stock Exchange, announced that it had entered into a definitive Joint Venture agreement for a term of 10 years with Allianz SE, with the aim to leverage on the two entities footprints in Africa and create a leading Pan-African financial services group, with an estimated equity value of Kshs 243.7 bn. Key to note, Sanlam Limited, indirectly owns 100.0% in Hubris Holdings Limited, which is the majority shareholder in Sanlam Kenya Plc, a listed insurance and financial services entity on the Nairobi Stock Exchange. The initial shareholding split of the Joint Venture was announced to be 60:40, Sanlam Limited to Allianz respectively, with the effective date of the proposed transaction being within 12-15 months of the announcement, subject to relevant approvals. However, given the length of the Agreement we expect that the Joint Venture will provide for Sanlam Kenya Plc, Allianz General Insurance Kenya and Jubilee General Insurance (which Allianz owns the majority stake in – 66.0%), to combine operations to grow their market share, asset base and bottom lines.
Additionally, insurance companies have increasingly turned to capital raising initiatives such as rights issues to strengthen their financial positions. A recent example is Sanlam Kenya, which undertook a rights issue offering 500.0 mn new shares at an offer price of Kshs 5.00 per share. The capital raised is to direct towards key strategic areas, primarily aimed at reducing the Group’s long-term debt exposure and supporting its return to profitability.
Section III: Interest rates
The interest rate environment has been declining in H1’2025.With Central Bank rates declining in 2025, insurers capitalized on longer tenor higher-yielding treasury bills and bonds, with 364-day, 182-day, and 91-day papers decreased by 6.2% points, 7.5% points, and 7.4% points to 10.4%, 9.1%, and 8.8% in H1’2025, respectively, from 16.7%, 16.6%, and 16.2%, respectively, in H1’2024. According to the IRA report, Investments in income-generating assets registered growth, increasing by 19.3% to Kshs 1.2 tn in Q2’2025, up from Kshs 1.0 tn recorded in Q2’2024. The table below shows insurance industry investments:
|
Cytonn Report: Insurance Industry Investments |
||||
|
Investments |
Q2'2025 |
Q2'2024 |
y/y Change |
Q2'2025 % Distribution |
|
Government Securities |
855.6 |
711.5 |
20.3% |
71.0% |
|
Term Deposits |
147.8 |
113.6 |
30.1% |
12.3% |
|
Investments Property |
94.7 |
93.0 |
1.8% |
7.9% |
|
Investment in Related Companies |
30.6 |
28.4 |
7.9% |
2.5% |
|
Ordinary Shares Quoted |
30.6 |
22.2 |
37.5% |
2.5% |
|
Loans & Mortgages |
10.4 |
7.9 |
31.6% |
0.9% |
|
Other Securities |
35.4 |
33.9 |
4.6% |
2.9% |
|
Total |
1,205.1 |
1,010.5 |
19.3% |
100.0% |
|
* Figures in Kshs Bns |
||||
Source: IRA
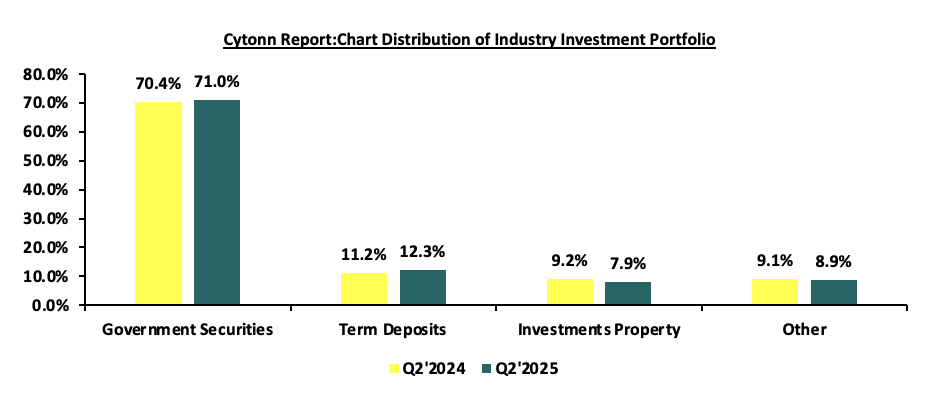
Government securities grew by 20.3% to Kshs 855.6 bn in Q2’2025, up from Kshs 711.5 bn in Q2’2025. Insurers increased their portfolios to in government securities despite the declining yields. The share of government securities rose 0.6% points year-on-year to 71.0% in Q2’2025 from 70.4% in Q2’2024 attributable to low risk profile from government securities. Investments in term deposits increased by 30.1% points to Kshs 147.8 bn in Q2’2025, up from 113.6 bn in Q2’2024 with the allocation increasing by 1.1% to 12.3%, from 11.2% in Q2’2024.Investment property increased by 1.8% to Kshs 94.7 bn in Q2’2025 ,up from Kshs 93.0 bn in Q2’2024 ,while the allocation of the portfolio declined by 1.3% points to 7.9%, from 9.2% in Q2’2024. The chart below shows comparison of investments portfolio allocations for the industry:
Source: IRA
Section IV: Industry Highlights and Challenges
The insurance sector has grown steadily over the past decade, and this momentum is expected to continue at a moderate pace. The outlook is supported by stronger economic outlook and a corresponding increase in insurance premiums, factors which are likely to enhance the industry's capacity to maintain profitability.
On the regulatory front, the rejected Finance Bill 2024 included provisions that sought to expand taxes on insurance premiums and extend VAT to certain insurance services. These included a new 2.5% tax on the value of motor vehicles, payable when issuing insurance cover and limiting VAT exemptions to insurance and reinsurance premiums only, subjecting other related services to the standard VAT rate of 16.0%. These measures were aimed at increasing government revenue but were met with opposition from industry stakeholders, including the Association of Kenya Insurers (AKI) due to concerns over increased insurance costs. The rejection of the Finance Bill has provided a temporary reprieve for the insurance sector, though discussions on balancing fiscal policy and market growth continue to shape the regulatory landscape.
Industry Challenges:
- Insolvency: A major challenge facing the insurance industry is the financial instability and insolvency of key players, as evidenced by cases in 2024 like Resolution Insurance and United Insurance Company. These companies have been placed under statutory management like Xplico Insurance Company and provisional liquidation by the Insurance Regulatory Authority (IRA) and through court orders. The issues arise from extended financial struggles, internal boardroom disputes, and declining market share, especially in unprofitable areas such as Public Service Vehicle (PSV) insurance. The collapse of these insurers undermines customer trust, destabilizes the industry, and compels policyholders to find alternative coverage. To regain stability and rebuild consumer confidence, the sector must tackle issues related to governance, risk management, and liquidity,
- High Market competition: Despite low insurance penetration in the country, the sector is served by 57 insurance companies offering the same products. The sector is increasingly facing competition from banking institutions and telecommunications companies, which pose a growing threat to its market share. New players like Safaricom, which was recently licensed by the Insurance Regulatory Authority (IRA) as an insurance broker, along with Equity Group’s ongoing expansion into the insurance space through the launch of Equity Life Assurance, are intensifying competition for traditional insurers. Some insurers have resorted to shady tactics in the fight for market dominance, such as premium undercutting, which involves offering clients implausibly low premiums in order to gain competitive advantage and protect their market share. This is a significant factor in the industry's underwriting losses. Plans to hire a consultant to review industry pricing in March 2021 were retaliated against by the regulator, but the plans are still in the works. However, this is against a background of weak insurance uptake, which could be made worse by higher premium prices. Industry participants have debated pricing,
- Insurance fraud: Insurance Fraud is an intentional deceit performed by an applicant or policyholder for financial advantage. In recent years, there has been an upsurge in fraudulent claims, particularly in medical and motor insurance, with estimates indicating that one in every five medical claims are fraudulent. This is mainly through exaggerating medical costs and hospitals by making patients undergo unnecessary tests. Fraudsters also collude with hospitals to file false claims, including fabricated surgeries and treatments, while some healthcare providers inflate charges for insured patients. To curb these challenges, the industry has adopted implementing blockchain technology and artificial intelligence to detect and prevent fraud. In Q2’2025, the number of fraud cases reported to the Insurance Fraud Investigation Unit (IFIU) increased by 11.1% to 50 cases, from 45 cases reported in Q2’2024,
- Regulation compliance: Due to updates on the laws governing insurance sector, such as capital requirements, smaller insurance businesses and new market entrants have found it challenging to operate without raising capital or combining to expand their capital base. Additionally, the implementation of IFRS 17, is expensive since accounting and actuarial systems need to be updated and realigned. There is lack of adequate skilled professionals due to the complexity of IFRS 17 which requires a solid grasp of both accounting and actuarial concepts. This skills gap has resulted in difficulties in fully understanding and applying the requirements of the framework, and,
- Declining consumer confidence in the insurance industry: In Q2’2025, IRA received 423 complaints from policyholders and beneficiaries lodged against insurers. The general insurance accounting for majority of the complaints at 78.7%, while long-term insurers recording 21.3%. The complaints range from insurance companies failing to settle claims and constant haggling over terms of insurance. Such experiences have led to scepticism toward insurers thus leading to declined consumer confidence.
Section V: Performance of the Listed Insurance Sector in H1’2025
The table below highlights the performance of the listed insurance sector, showing the performance using several metrics, and the key take-outs of the performance.
|
Listed Insurance Companies H1’2025 Earnings and Growth Metrics |
|||||||||
|
Insurance |
Core EPS Growth |
Insurance revenue growth |
Claims growth |
Loss Ratio |
Expense Ratio |
Combined Ratio |
ROaE |
ROaA |
|
|
Sanlam |
(94.7%) |
6.1% |
5.3% |
89.1% |
60.0% |
149.1% |
1.2% |
0.1% |
|
|
Liberty |
(29.8%) |
(37.4%) |
(20.0%) |
73.6% |
80.0% |
153.6% |
4.4% |
0.9% |
|
|
Jubilee Insurance |
20.4% |
32.6% |
36.6% |
92.2% |
108.4% |
200.7% |
5.5% |
1.4% |
|
|
Britam |
(15.0%) |
10.6% |
11.4% |
76.8% |
96.4% |
173.2% |
6.0% |
1.2% |
|
|
CIC |
(23.3%) |
8.4% |
23.4% |
92.2% |
117.2% |
209.4% |
6.0% |
1.3% |
|
|
*H1'2025 Weighted Average |
(6.6%) |
13.7% |
19.8% |
85.2% |
102.5% |
187.7% |
5.6% |
1.3% |
|
|
**H1'2024 Weighted Average |
39.6% |
51.7% |
(18.2%) |
81.1% |
68.2% |
149.4% |
7.3% |
1.6% |
|
|
*Market cap weighted as at 09/10/2025 |
|
||||||||
|
**Market cap weighted as at 18/10/2024 |
|
||||||||
The key take-outs from the above table include;
- Core EPS growth recorded a weighted decline of 6.6%, lower compared to the weighted growth of 39.6%, in H1’2024. The decline in earnings was attributable to decreased premiums during the period following declined yields from government papers during the period,
- Insurance revenue grew at a slower pace of 13.7% in H1’2025, compared to a growth of 51.7% in H1’2024, while claims also grew at a rate of 19.8% in H1’2025, a reversal from the 18.2% decline recorded in H1’2024 on a weighted average basis,
- The loss ratio across the sector increased to 85.1% in H1’2025 from 81.1% in H1’2024,
- The expense ratio increased to 102.5% in H1’2025, from 68.2% in H1’2024, owing to increase in operating expenses, a sign of decreased efficiency,
- The insurance core business still remains unprofitable, with a combined ratio of 187.8% as at H1’2025, higher than the 149.4% in H1’2024, and higher than the desired ratio of 100.0%, and,
- On average, the insurance sector delivered a Return on Average Equity (ROaE) of 5.6%, a decrease from a weighted Return on Average Equity of 7.6% in H1’2024.
Based on the Cytonn H1’2025 Insurance Report, we ranked insurance firms from a franchise value and from a future growth opportunity perspective with the former getting a weight of 40.0% and the latter a weight of 60.0%.
For the franchise value ranking, we included the earnings and growth metrics as well as the operating metrics shown in the table below in order to carry out a comprehensive review:
|
Listed Insurance Companies H1’2025 Franchise Value Score |
||||||
|
Insurance Co. |
Loss Ratio |
Expense Ratio |
Combined Ratio |
Tangible Common Ratio |
Franchise Value Score |
Ranking |
|
Sanlam Kenya |
89.1% |
60.0% |
149.1% |
8.3% |
15 |
1 |
|
Britam Holdings |
76.8% |
96.4% |
173.2% |
12.9% |
15 |
1 |
|
Jubilee Holdings |
92.2% |
108.4% |
200.7% |
21.6% |
18 |
3 |
|
Liberty Holdings |
73.6% |
80.0% |
153.6% |
19.2% |
19 |
4 |
|
CIC Group |
92.2% |
117.2% |
209.4% |
15.6% |
23 |
5 |
|
* H1’2025 Weighted Average |
85.2% |
102.5% |
187.7% |
17.0% |
|
|
The Intrinsic Valuation is computed through a combination of valuation techniques, with a weighting of 40.0% on Discounted Cash-flow Methods, 35.0% on Residual Income and 25.0% on Relative Valuation. The overall H1’2025 ranking is as shown in the table below:
|
Listed Insurance Companies H1’2025 Comprehensive Ranking |
|||||
|
Bank |
Franchise Value Score |
Intrinsic Value Score |
Weighted Score |
H1’2025 Ranking |
H1’2024 Ranking |
|
Sanlam Kenya |
1 |
2 |
1.6 |
1 |
4 |
|
CIC Group |
5 |
3 |
3.8 |
2 |
1 |
|
Britam Holdings |
1 |
4 |
2.8 |
3 |
5 |
|
Liberty Holdings |
4 |
5 |
4.6 |
4 |
3 |
|
Jubilee Holdings |
3 |
1 |
1.8 |
5 |
2 |
Major Changes from the H1’2025 Ranking are;
- Sanlam Kenya improved to position 1 in H1’2025 driven by strong intrinsic and franchise score, attributable to the low combined ratio of 149.1%,
- CIC Group declined to position 2 in H1’2025 driven by declined franchise score, attributable to the increase in the claims growth to 23.4%, from a 6.9% decline recorded in H1’2025.
- Liberty Holdings declined to position 4 in H1’2025 mainly due to weakened intrinsic score in H1’2025,
- Britam Holdings improved to position 3 in H1’2025, mainly due to increase in franchise scores in H1’2025, driven by the decrease in claims growth to 11.4%, from the 14.6% growth recorded in H1’2024, and,
Section VI: Conclusion & Outlook of the Insurance Sector
Kenya’s improving economic conditions have created a more positive outlook for the insurance sector. With easing inflation and a stabilizing shilling, households are likely to have more disposable income, supporting higher insurance uptake. Although challenges persist, the industry continues to gain from the digital transformation and innovation that accelerated during the pandemic. Ongoing regulatory reforms and a stronger focus on customer needs remain central priorities. The more favourable economic environment offers insurers a solid foundation for growth, with opportunities to refine product offerings, strengthen customer relationships, and develop policies that reflect the evolving financial needs and capabilities of consumers.
The insurance sector should build on the following strategies to sustain growth and capitalize on the economic upturn:
- Partnerships and alternative distribution channels - We expect underwriters to keep forming strategic partnerships and expanding their distribution channels in the future. This can be accomplished by collaborating with other financial service providers such as fund managers who have ventured into offering insurance-related products alongside existing bancassurance arrangements with banks. Additionally, insurers can leverage the penetration of banking products to increase awareness and uptake of their own offerings. For instance, in July 2024, NCBA Group announced the completion of 100% acquisition of AIG Kenya Insurance Company (AIG Kenya). This move allows NCBA to leverage its physical and digital platforms to boost insurance penetration in Kenya and the wider East African region. This acquisition aligns with the broader trend of partnerships and alternative distribution channels, as NCBA’s collaboration with AIG Kenya demonstrates how banks and insurance providers can work together to broaden access to insurance products. According to AKI released state of the Bancassurance Market in Kenya 2024 report, Bancassurance distribution channel market share grew to 10.0% with the channels gross written premium growing to Kshs 35.0 bn in 2023,
- Regulations - To ensure the sector's solvency and sustainability, we anticipate more regulation from the regulatory body and other international stakeholders. The regulator's quest for the targeted capital adequacy levels will almost certainly result in further consolidations as insurers struggle to achieve the capital requirements, particularly for small firms. Furthermore, regulators, governments, and policymakers are working harder to make Environmental, Social, and Governance (ESG) standards a requirement in the insurance industry,
- Diversification - As insurers look to expand their portfolios and mitigate risks, entering new markets can provide growth opportunities and help spread exposure across multiple economies. This strategy allows companies to tap into underpenetrated regions, improving overall revenue streams and reducing dependence on local markets. By entering emerging and underserved markets, insurers can gain access to new customer bases, diversify their product offerings, and strengthen their positions across Africa and beyond. For instance, in June 2025, Britam announced successful entry into the Ugandan market through new life insurance operations, coupled with the rollout of microinsurance products targeting underserved markets. Additionally, the Insurance Regulatory Authority (IRA) should review the current Kshs 50.0 mn minimum capital requirement for microinsurers under the 2020 regulations that limits existing insurers who wish to expand into microinsurance, as they are required to set up separate licensed entities to do so. Allowing insurers to offer microinsurance under their existing licenses, would ease regulatory barriers, promote innovation, and accelerate insurance inclusion across underserved markets,
- Technology and Innovation: To aid portfolio expansion and growth, insurers must harness the digital insurance solutions at their disposal in order to improve internal efficiency and accelerate time to market. As such, we anticipate cooperation between insurers and InsurTechs. For instance, in February 2024, Britam launched BetaLab a new insurance innovation hub, as it aims to nurture budding InsurTech and fintech start-ups, and fast track product development in the industry. The lab’s mission is to incubate, innovate, and accelerate start-ups, nurturing and empowering innovation among internal staff, while also exploring innovation opportunities with insuretechs and fintechs. Additionally, insurers should embrace use of artificial intelligence to improve efficiency by integrating Artificial Intelligence (AI) into underwriting, automating claims processes, and using chatbots for customer support, thereby streamlining overall operations. For instance, in April 2024, M-tiba announce the successful integration of AI into their claims processing system, leading to significant reductions in claims approval process to just hours. Additionally, use of AI enhances their efficiency and fraud management resulting in low administrative and healthcare costs for health insurers,
- Insurance awareness campaigns – Low insurance penetration is significantly impacted by the persistent information gap about insurance products and their significance. Insurance is still largely assumed to be regulatory compliance rather than a necessity. The regulators, insurers, and other stakeholders should enhance insurance awareness campaigns to increase understanding of insurance products. According to Finaccess survey 2024, the second largest contributor to low insurance uptake at 19.4% is a lack of awareness of the various insurance products and their benefits. As such, there is a lot of headroom for insurers to educate, repackage, and tailor their products to different potential clients, and,
- Investment diversification – To enhance profitability and minimize losses, underwriters should prioritize diversifying their investments through avenues like pension schemes, unit trusts, fund management, and investment advisory services. The combined ratios were 108.3% and 102.1% in H1’2025 for general insurance businesses and Microinsurance business respectively, pointing toward losses in insurers' core operations, as rising underwriting costs and claims have outpaced insurance revenue growth. In addition, we anticipate insurers will continue to investigate non-traditional asset types such as infrastructure.
For more information, please read our H'12024 Listed Insurance Sector full report
Disclaimer: The views expressed in this publication are those of the writers where particulars are not warranted. This publication is meant for general information only and is not a warranty, representation, advice or solicitation of any nature. Readers are advised in all circumstances to seek the advice of a registered investment advisor.

- Talk to us
- Kenya
- P.O Box 20695 - 00200, Nairobi, Kenya
- Cell +254709101200
- Tel +254709101200
- WhatsApp +254741676635
- United States
- +254709101200
- DOWNLOAD OUR APP
-


- Kenya
- 8th Floor, Pinetree Plaza, Kaburu Drive, Ngong Road, Nairobi, Kenya
- USA
- Suite 1150, 1775 Eye Street NW, USA, Washington DC 20006, USA
- Investments
- High Yield
- Private Equity
- Real Estate
- Real Estate
- RiverRun Estates
- Cytonn Towers
- The Ridge
- Taraji Heights
- The Alma