Kenya Listed Insurance FY’2022 Report, & Cytonn Weekly #23/2023
By Research Team, Jun 11, 2023
Executive Summary
Fixed Income
During the week, T-bills were oversubscribed for the first time in three weeks, with the overall subscription rate coming in at 138.0%, up from the subscription rate of 98.2% recorded the previous week. Investor’s preference for the shorter 91-day paper persisted as they sought to avoid duration risk, with the paper receiving bids worth Kshs 29.0 bn against the offered Kshs 4.0 bn, translating to an oversubscription rate of 725.5%, higher than the 511.3% recorded the previous week. The subscription rates for the 182-day increased to 18.9% from 5.5% recorded the previous week. However, the subscription rate for the 364-day decreased to 22.0% from 25.6% recorded the previous week. The government accepted bids worth Kshs 32.1 bn out of the Kshs 33.1 bn total bids received, translating to an acceptance rate of 97.1%. The yields on the government papers were on an upward trajectory, with the yields on the 364-day paper, 182-day and 91-day papers increasing by 11.1 bps, 43.6 bps and 31.1 bps to 11.6%, 11.5% and 11.4%, respectively;
Additionally, during the week, Stanbic Bank released its monthly Purchasing Manager’s Index (PMI), highlighting that the index for the month of May 2023 came in at 49.2, up from 47.4 in April 2023, showing some slight improvement in business environment but still a contraction. This is the fourth consecutive month of sustained deterioration in the business environment;
Also, recently, the government of Kenya secured a commercial loan of USD 500.0 million (Kshs 69.6 billion) to ease its financial distress According to the director-in-charge of debt management at the National Treasury, the loan was tapped from a syndicate of global banks consisting of American Citibank, British Standard Chartered Bank, Stanbic Bank, and South Africa’s RMB Holdings Ltd;
Equities
During the week, the equities market was on an upward trajectory with NASI, NSE 20 and NSE 25 gaining by 0.7%, 2.4% and 1.4% respectively, taking the YTD performance to losses of 16.9%, 4.9% and 12.7% for NASI, NSE 20 and NSE 25, respectively. The equities market performance was mainly driven by gains recorded by large-cap stocks such as NCBA, EABL and Diamond Trust Bank (DTB-K) of 7.8%, 6.8% and 4.6% respectively. The gains were however weighed down by losses recorded by stocks such as Safaricom and Equity Group of 2.1% and 0.7%, respectively;
Real Estate
During the week, Fahari I-REIT closed the week trading at an average price of Kshs 6.1 per share in the Nairobi Securities Exchange, representing a 1.0% increase from Kshs 6.0 per share recorded the previous week. On the Unquoted Securities Platform, as at 9 June 2023, Acorn D-REIT and I-REIT closed the week trading at Kshs 23.9 and Kshs 21.6 per unit, respectively, a 19.4% and 7.9% gain for the D-REIT and I-REIT, respectively, from the Kshs 20.0 inception price. In addition, Cytonn High Yield Fund (CHYF) closed the week with an annualized yield of 13.6%, remaining unchanged from the 13.6% yield recorded the previous week;
Focus of the Week
Following the release of FY’2022 results by insurance companies, this week we analyze the performance of the 5 listed insurance companies in Kenya, identify the key factors that influenced their performance, and give our outlook for the insurance sector going forward;
Investment Updates:
- Weekly Rates:
- Cytonn Money Market Fund closed the week at a yield of 11.61%. To invest, dial *809# or download the Cytonn App from Google Playstore here or from the Appstore here;
- Cytonn High Yield Fund closed the week at a yield of 13.62% p.a. To invest, email us at sales@cytonn.com and to withdraw the interest, dial *809# or download the Cytonn App from Google Playstore here or from the Appstore here;
- We continue to offer Wealth Management Training every Wednesday, from 9:00 am to 11:00 am. The training aims to grow financial literacy among the general public. To register for any of our Wealth Management Trainings, click here;
- If interested in our Private Wealth Management Training for your employees or investment group, please get in touch with us through wmt@cytonn.com;
- Cytonn Insurance Agency acts as an intermediary for those looking to secure their assets and loved ones’ future through insurance namely; Motor, Medical, Life, Property, WIBA, Credit and Fire and Burglary insurance covers. For assistance, get in touch with us through insuranceagency@cytonn.com;
- Cytonn Asset Managers Limited (CAML) continues to offer pension products to meet the needs of both individual clients who want to save for their retirement during their working years and Institutional clients that want to contribute on behalf of their employees to help them build their retirement pot. To more about our pension schemes, kindly get in touch with us through pensions@cytonn.com;
Real Estate Updates:
- For more information on Cytonn’s real estate developments, email us at sales@cytonn.com;
- Phase 3 of The Alma is now ready for occupation and the show house is open daily. To join the waiting list to rent, please email properties@cytonn.com;
- For Third Party Real Estate Consultancy Services, email us at rdo@cytonn.com;
- For recent news about the group, see our news section here;
Hospitality Updates:
- We currently have promotions for Staycations. Visit cysuites.com/offers for details or email us at sales@cysuites.com;
Money Markets, T-Bills Primary Auction:
During the week, T-bills were oversubscribed for first time in three weeks, with the overall subscription rate coming in at 138.0%, up from th subscription rate of 98.2% recorded the previous week. Investor’s preference for the shorter 91-day paper persisted as they sought to avoid duration risk and as the yield curve flattened, with the paper receiving bids worth Kshs 29.0 bn against the offered Kshs 4.0 bn, translating to an oversubscription rate of 725.5%, higher than the 511.3% recorded the previous week. The subscription rates for the 182-day increased to 18.9% from 5.5% recorded the previous week. However, the subscription rate for the 364-day decreased to 22.0% from 25.6% recorded the previous week. The government accepted bids worth Kshs 32.1 bn out of the Kshs 33.1 bn total bids received, translating to an acceptance rate of 97.1%. The yields on the government papers were on an upward trajectory, with the yields on the 364-day paper, 182-day and 91-day papers increasing by 11.1 bps, 43.6 bps and 31.1 bps to 11.6%, 11.5% and 11.4%, respectively.
The chart below compares the overall average T- bills subscription rates obtained in 2017, 2022 and 2023 Year to Date (YTD):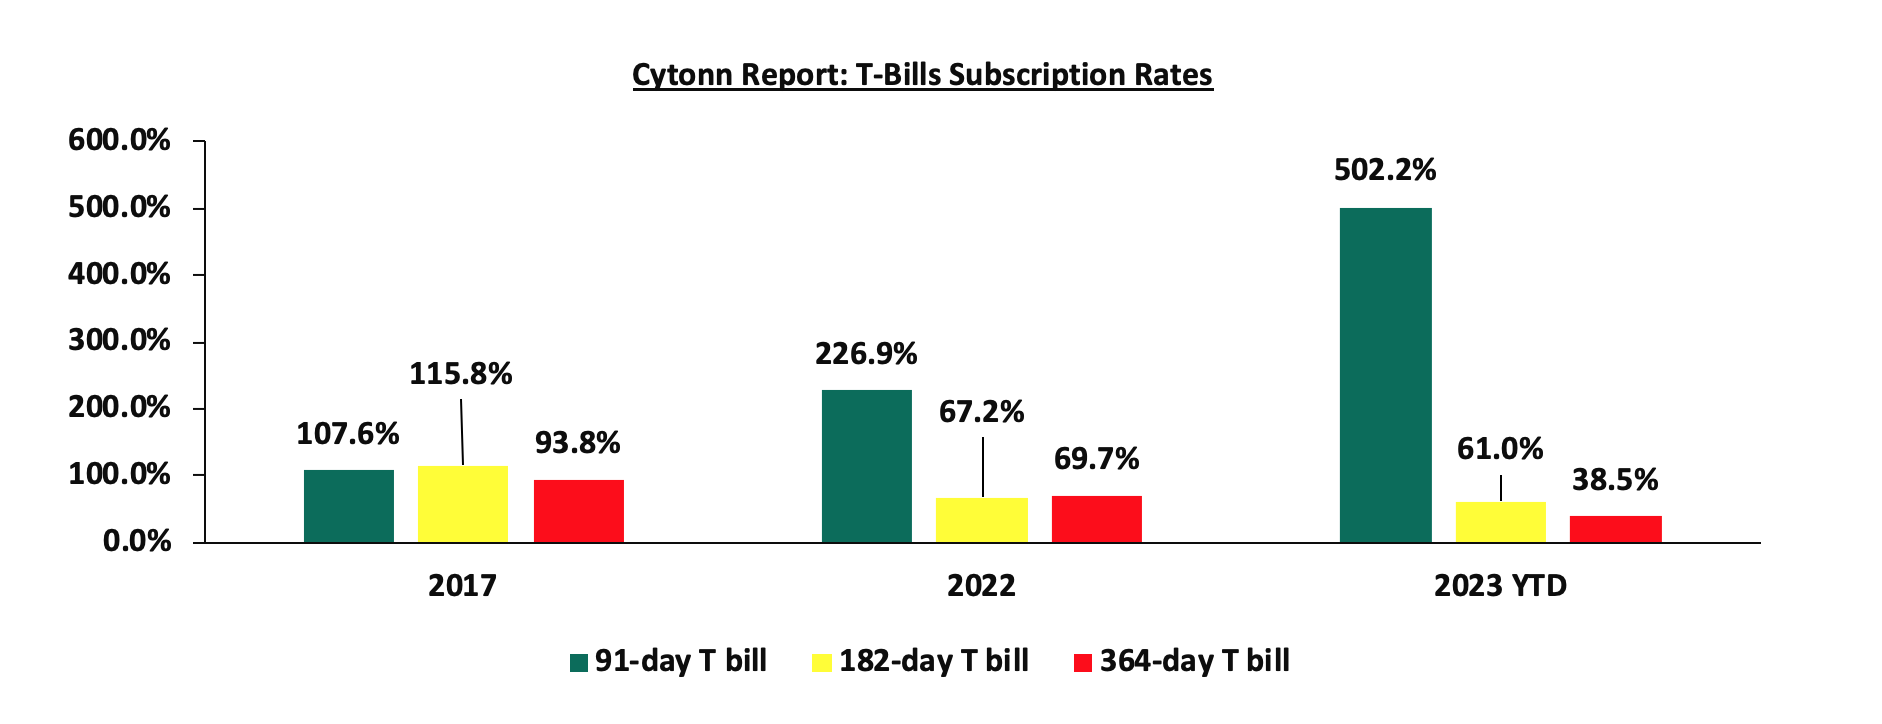
Money Market Performance:
In the money markets, 3-month bank placements ended the week at 9.8% (based on what we have been offered by various banks), while the yields on the 364-day and 91-day paper increased by 11.1 bps and 31.1 bps to 11.6% and 11.4% respectively. The yield of Cytonn Money Market Fund increased by 45.0 bps to 11.6%, up from 11.2% recorded in the previous week, while the average yields of Top 5 Money Market Funds increased by 8.4 bps to 11.3%, up from 11.2% recorded the previous week.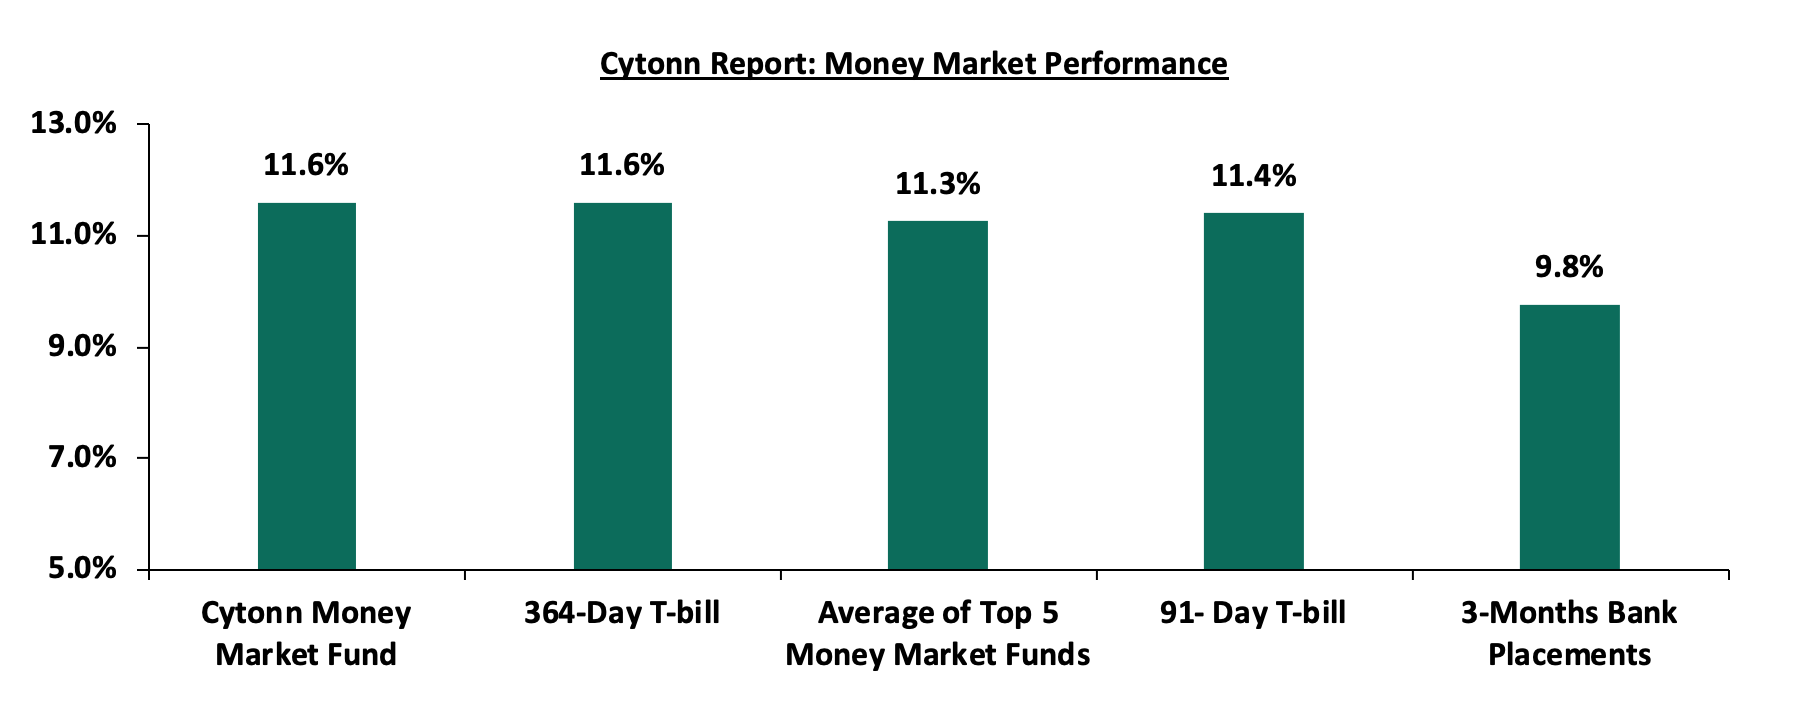
The table below shows the Money Market Fund Yields for Kenyan Fund Managers as published on 9 June 2023:
|
Cytonn Report: Money Market Fund Yield for Fund Managers as published on 9 June 2023 |
||
|
Rank |
Fund Manager |
Effective Annual Rate |
|
1 |
Etica Money Market Fund |
12.1% |
|
2 |
Cytonn Money Market Fund (dial *809# or download the Cytonn app) |
11.6% |
|
3 |
Madison Money Market Fund |
10.9% |
|
4 |
Apollo Money Market Fund |
10.9% |
|
5 |
GenAfrica Money Market Fund |
10.9% |
|
6 |
Dry Associates Money Market Fund |
10.8% |
|
7 |
Jubilee Money Market Fund |
10.7% |
|
8 |
Kuza Money Market fund |
10.7% |
|
9 |
AA Kenya Shillings Fund |
10.6% |
|
10 |
Co-op Money Market Fund |
10.4% |
|
11 |
NCBA Money Market Fund |
10.4% |
|
12 |
Old Mutual Money Market Fund |
10.3% |
|
13 |
Enwealth Money Market Fund |
10.3% |
|
14 |
Sanlam Money Market Fund |
10.2% |
|
15 |
Nabo Africa Money Market Fund |
10.0% |
|
16 |
KCB Money Market Fund |
10.0% |
|
17 |
Zimele Money Market Fund |
9.9% |
|
18 |
GenCap Hela Imara Money Market Fund |
9.9% |
|
19 |
British-American Money Market Fund |
9.7% |
|
20 |
CIC Money Market Fund |
9.6% |
|
21 |
ICEA Lion Money Market Fund |
9.5% |
|
22 |
Orient Kasha Money Market Fund |
9.3% |
|
23 |
Absa Shilling Money Market Fund |
8.6% |
|
24 |
Mali Money Market Fund |
8.4% |
|
25 |
Equity Money Market Fund |
8.2% |
Source: Business Daily
Liquidity:
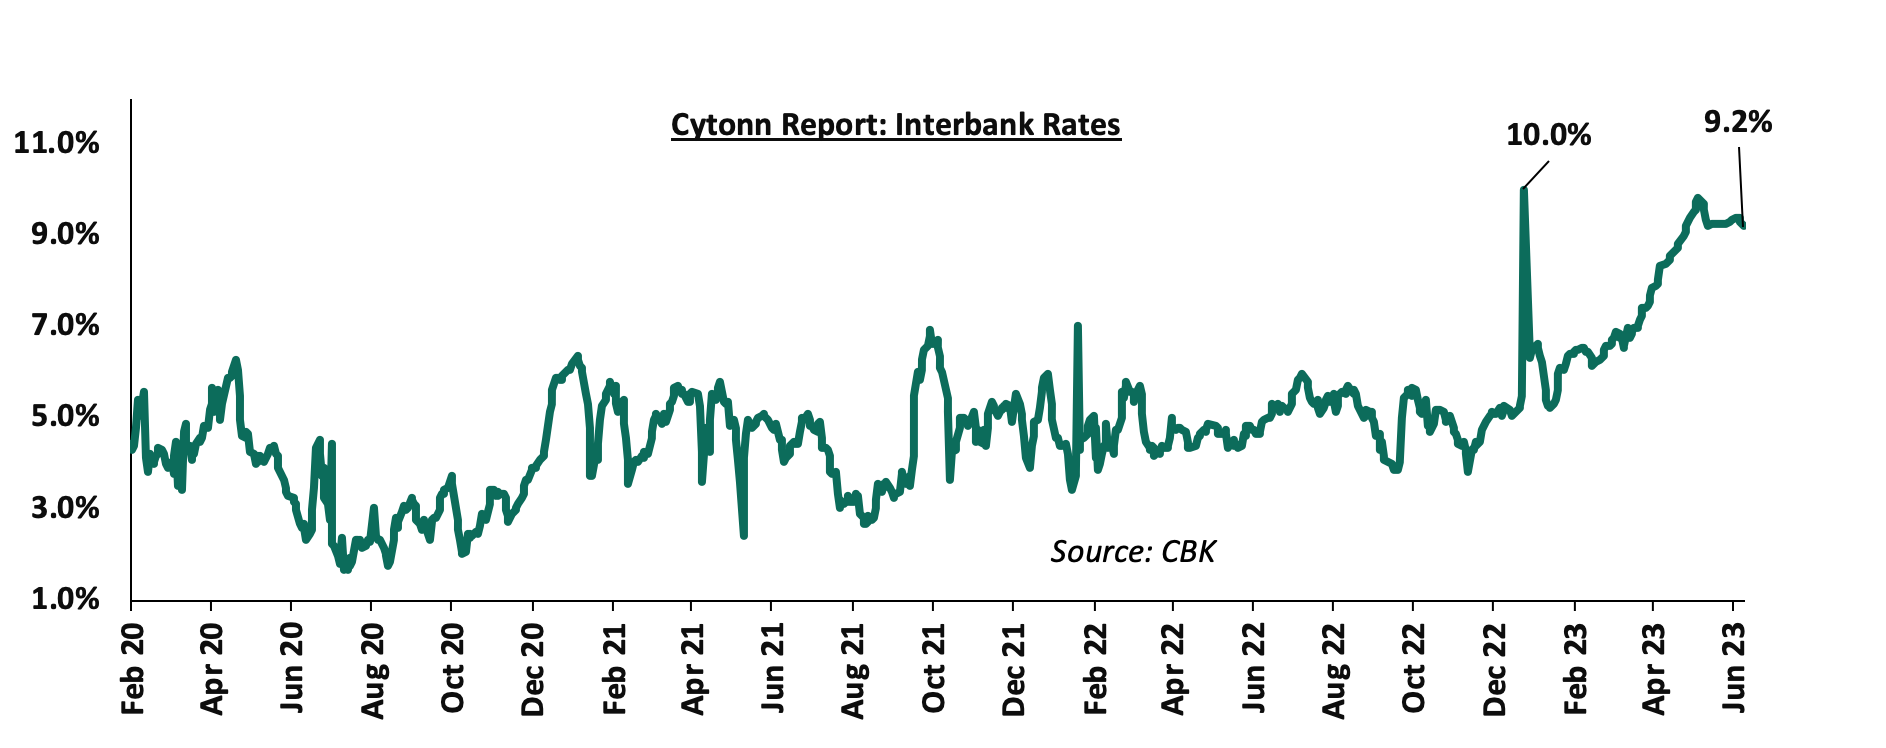
During the week, liquidity in the money markets remained tight, with the average interbank rate remaining relatively unchanged at 9.3% similar to what was recorded the previous week, partly attributable to tax remittances that offset government payments. The average interbank volumes traded declined by 0.1% to Kshs 22.88 bn, from Kshs 22.91 bn recorded the previous week. The chart below shows the interbank rates in the market over the years:
Kenya Eurobonds:
During the week, the yields on Eurobonds were on a downward trajectory, with the yield on the 10-year Eurobond issued in 2014 declining the most, having declined by 1.1% points to 14.4% from 15.5% recorded the previous week. The downward trajectory of the Eurobond yields is partly attributable to the enhanced fiscal consolidation measures taken by the government. This comes after the World Bank approved a USD 1.0 billion (Kshs 138.6 billion) loan under the Development Policy Operation (DPO) last week to provide low-cost budget financing and support key policy and institutional reforms . The table below shows the summary of the performance of the Kenyan Eurobonds as of 8 June 2023;
|
Cytonn Report: Kenya Eurobonds Performance |
||||||
|
|
2014 |
2018 |
2019 |
2021 |
||
|
Date |
10-year issue |
10-year issue |
30-year issue |
7-year issue |
12-year issue |
12-year issue |
|
Amount Issued (USD) |
2.0 bn |
1.0 bn |
1.0 bn |
0.9 bn |
1.2 bn |
1.0 bn |
|
Years to Maturity |
1.1 |
4.8 |
24.8 |
4.0 |
9.0 |
11.1 |
|
Yields at Issue |
6.6% |
7.3% |
8.3% |
7.0% |
7.9% |
6.2% |
|
02-Jan-23 |
12.9% |
10.5% |
10.9% |
10.9% |
10.8% |
9.9% |
|
01-Jun-23 |
15.5% |
11.9% |
11.5% |
13.0% |
11.9% |
11.0% |
|
02-Jun-23 |
14.4% |
11.7% |
11.3% |
12.5% |
11.7% |
10.8% |
|
05-Jun-23 |
14.2% |
11.6% |
11.2% |
12.3% |
11.5% |
10.7% |
|
06-Jun-23 |
14.3% |
11.6% |
11.2% |
12.3% |
11.5% |
10.7% |
|
07-Jun-23 |
14.2% |
11.6% |
11.2% |
12.2% |
11.5% |
10.7% |
|
08-Jun-23 |
14.4% |
11.6% |
11.2% |
12.3% |
11.5% |
10.7% |
|
Weekly Change |
(1.1%) |
(0.3%) |
(0.3%) |
(0.7%) |
(0.4%) |
(0.3%) |
|
MTD change |
(1.1%) |
(0.3%) |
(0.3%) |
(0.7%) |
(0.4%) |
(0.3%) |
|
YTD Change |
1.5% |
1.1% |
0.3% |
1.4% |
0.7% |
0.8% |
Source: Central Bank of Kenya (CBK) and National Treasury
Kenya Shilling:
During the week, the Kenya Shilling depreciated by 0.4% against the US dollar to close the week at Kshs 139.2, from Kshs 138.6 recorded the previous week, partly attributable to the persistent dollar demand from importers, especially in the oil and energy sectors. On a year-to-date basis, the shilling has depreciated by 12.8% against the dollar, adding to the 9.0% depreciation recorded in 2022. We expect the shilling to remain under pressure in 2023 as a result of:
- High global crude oil prices on the back of persistent supply chain bottlenecks coupled with high demand,
- An ever-present current account deficit estimated at 4.9% of GDP in twelve months to January 2023, from 5.6% recorded in a similar period last year, and,
- The need for government debt servicing, which continues to put pressure on forex reserves given that 67.3% of Kenya’s external debt was US Dollar denominated as of March 2023, and,
The shilling is however expected to be supported by:
- The strong diaspora remittances which stood at USD 1,335.9 mn in 2023 as of April 2023, albeit 3.1% lower than the USD 1,378.9 mn recorded over the same period in 2022, and,
- The tourism inflow receipts that came in at USD 268.1 bn in 2022, a significant 82.9% increase from USD 146.5 bn inflow receipts recorded in 2021.
Key to note is that Kenya’s forex reserves increased significantly during the week by 15.7% to USD 7.5 bn as of June 8, 2023, from USD 6.5 bn as of May 31, 2023, partly attributable to the receipt of a USD 1.0 bn (Kshs 138.6 bn) loan from the World Bank approved last week under the Development Policy Operation (DPO) to provide low-cost budget financing and support key policy and institutional reforms. As a result, the country’s month of import cover increased to 4.2 months of import cover, which is above the statutory requirement of maintaining at least 4.0 months of import cover and a notable increase from the 3.6 months of import cover recorded the previous week. The chart below summarizes the evolution of Kenya months of import cover over the last 10 years: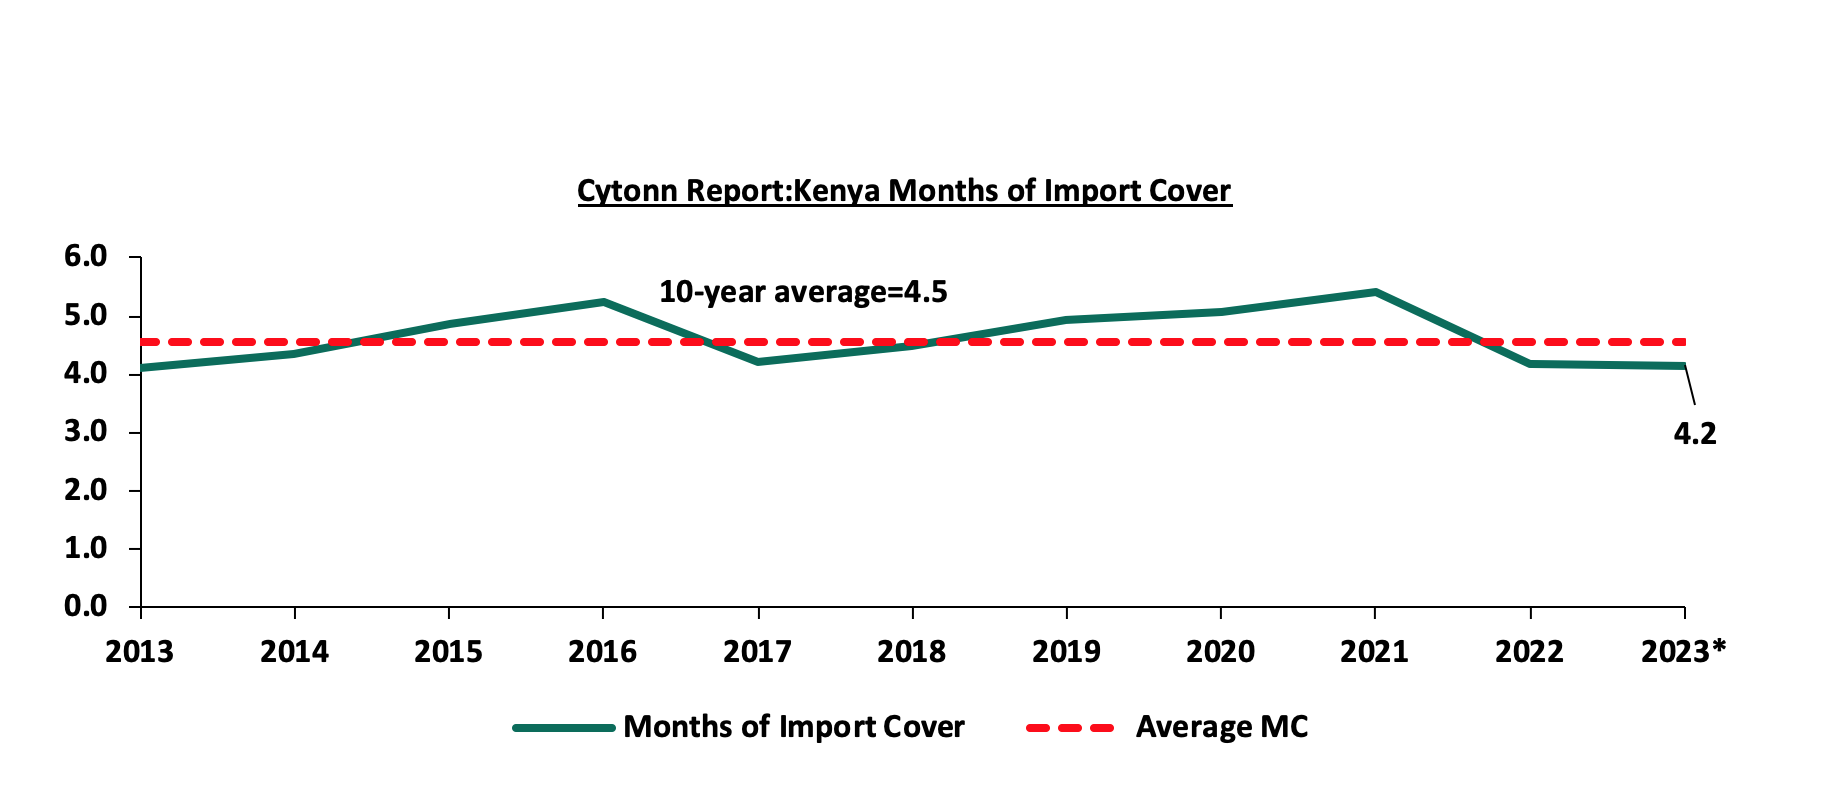
*Figure as at 8 June 2023
Weekly Highlights:
- Stanbic Bank’s May 2023 Purchasing Manger’s Index (PMI)
During the week, Stanbic Bank released its monthly Purchasing Manager’s Index (PMI), highlighting that the index for the month of May 2023 came in at 49.4, up from 47.2 in April 2023, signaling the slowest deterioration of the business environment in the fourth consecutive month. The sustained deterioration of the general business environment is mainly attributable to the elevated inflationary pressure experienced in the country, which has remained above the Central Bank of Kenya (CBK) target range of 2.5%–7.5% in the past twelve months, with the inflation rate in May 2023 increasing to 8.0%, from 7.9% recorded in April 2023. As a result, consumer wallets have been put under pressure, which has led to a reduction in demand for commodities.
Notably, business costs during the month recorded the sharpest increase since the series began in 2014. The uptick was mainly driven by a rise in purchase costs attributable to increased fuel prices, which have made production very expensive given that fuel is a major input in most businesses. Additionally, the high cost of purchase is also attributable to the sustained depreciation of the Kenya shilling against major currencies, which has made imports very expensive. Therefore, manufacturers and producers transfer the high costs to consumers through hikes in consumer prices in order to maintain their profit margins.
Despite the poor business environment, inventories of input continued to grow modestly as firms looked to keep unused items in case of further price rises and supply shortages. Additionally, hiring activities during the month picked, which led to the fastest rise in employment numbers since November 2021, with firms attributing the rise to efforts to improve client services.
Key to note, a PMI reading of above 50.0 indicates an improvement in the business conditions, while readings below 50.0 indicate a deterioration. The chart below summarizes the evolution of PMI over the last 24 months: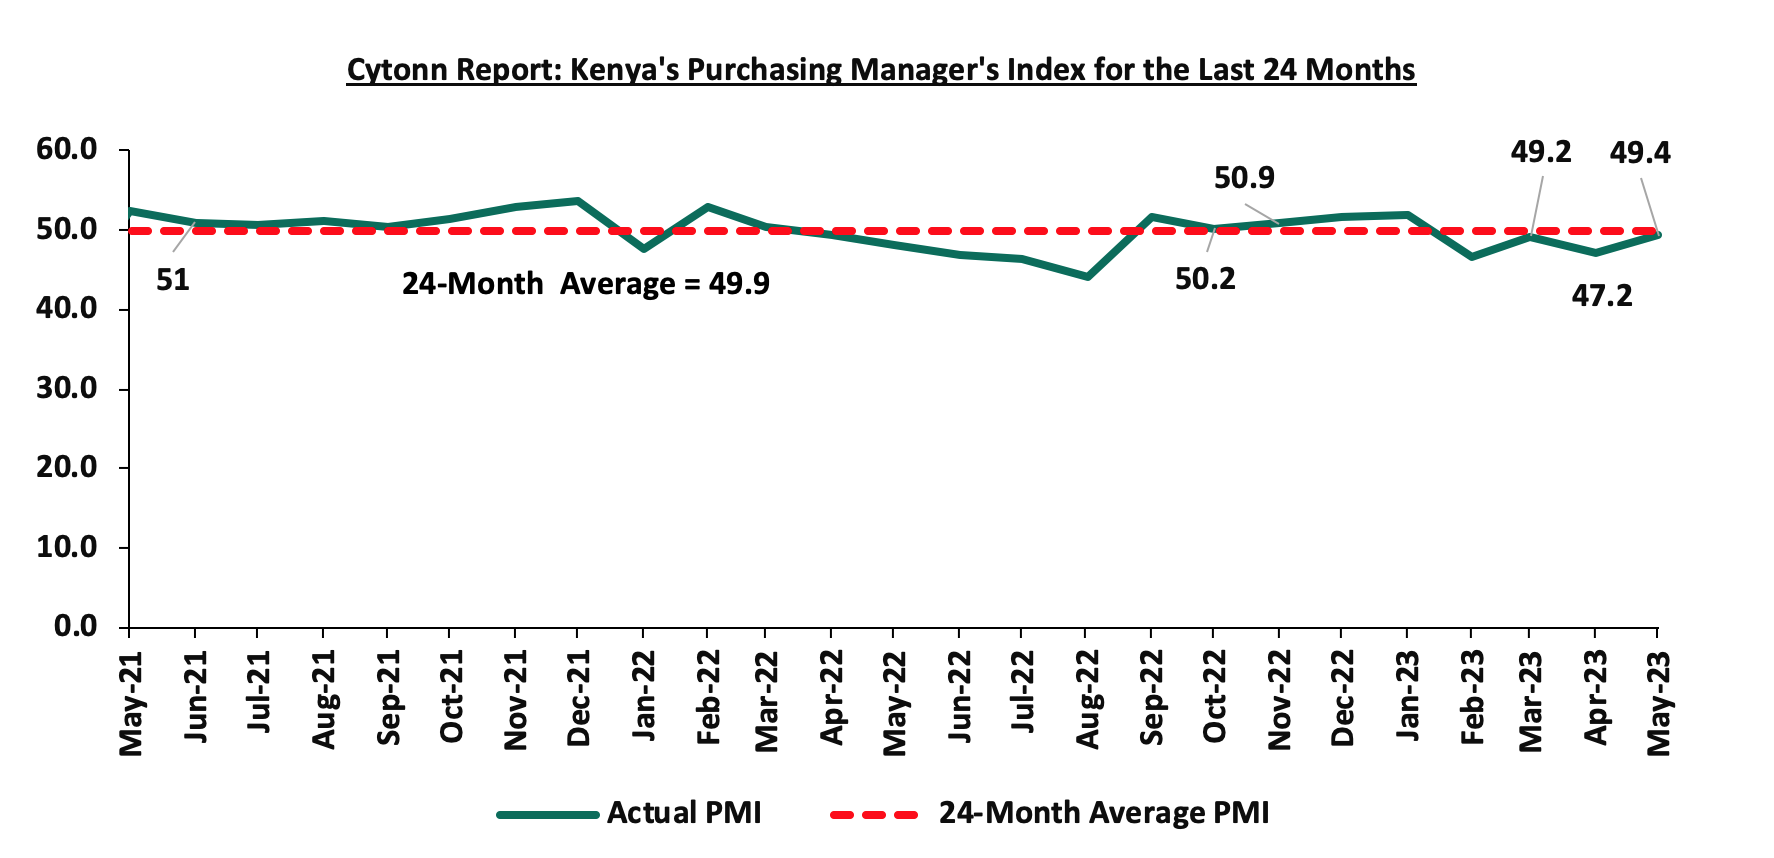
Going forward, we are project that the general business environment will remain subdued in the short to medium term on the back of reduced consumer purchasing power owing to elevated inflationary pressures and the sustained depreciation of the Kenya shilling. However, we expect inflationary pressures to ease to the CBK’s target range of 2.5% to 7.5%, in the medium to long term aided by an easing in global commodity prices and an easing of domestic food prices on account of favourable weather conditions. Key to note is that the general improvement in business conditions is partly pegged on the stability of the global economy.
- Kenya Secured USD 500.0 mn Commercial Loan
Recently, the government of Kenya secured a commercial loan of USD 500.0 mn (Kshs 69.6 bn) aimed at easing the country’s financial distress. According to the director-in-charge of debt management at the national Treasury, the loan was tapped from a syndicate of global banks consisting of American Citibank, British Standard Chartered Bank, Stanbic Bank, and South Africa’s RMB Holdings Ltd. This move follows the approval by the World Bank of a USD 1.0 bn (Kshs 138.6 bn) loan under the Development Policy Operation (DPO) to provide low-cost budget financing and support key policy and institutional reforms for Kenya’s near-term fiscal consolidation objectives. Additionally, the government of Kenya had also reached a staff-level agreement with the International Monetary Fund to conclude the fifth review of Kenya’s economic program under the Extended Fund Facility (EFF) and Extended Credit Facility (ECF) arrangements, which will allow Kenya to have immediate access to financing of USD 410.0 mn (Kshs 56.7 bn) once the formal review is completed by July 2023.
The syndicated loan has two tranches: the first tranche matures in 3 years, while the second tranche matures in 5 years. The 3-year tranche will be paid in full upon maturity, while the 5-year tranche will be offset by the government making regular payments. Additionally, part of the loan is in US dollars, while the other is in euros. The loan is expected to reduce the demand pressure on the US dollar, which has continued to weigh down on the Kenya shilling, as well as boost the foreign exchange reserves to remain above the statutory minimum requirement of at least 4.0 months of import cover. However, with the loan facility being US Dollar (USD) denominated, we expect debt servicing costs to rise on the back of sustained depreciation of the Kenya shilling, with the shilling having depreciated by 12.8% on a year-to-date basis against the US Dollar to close the week trading at 139.2 against the US Dollar, from Kshs 123.2 recorded at the beginning of 2023.
Rates in the Fixed Income market have been on upward trend given the continued government’s demand for cash and the highly tightened liquidity in the money market. The government is 3.7% behind its prorated borrowing target of Kshs 404.1 bn having borrowed Kshs 389.3 bn of the revised domestic borrowing target of Kshs 425.1 bn for the FY’2022/2023. We believe that the projected budget deficit of 5.7% is relatively ambitious given the downside risks and deteriorating business environment occasioned by high inflationary pressures. Further, revenue collections are lagging behind, with total revenue as at April 2023 coming in at Kshs 1.6 tn in the FY’2022/2023, equivalent to 74.8% of its revised target of Kshs 2.2 tn and 89.8% of the prorated target of Kshs 1.8 tn. Therefore, we expect a continued upward readjustment of the yield curve in the short and medium term, with the government looking to bridge the fiscal deficit through the domestic market. Owing to this, our view is that investors should be biased towards short-term fixed-income securities to reduce duration risk
Market Performance:
During the week, the equities market was on an upward trajectory with NASI, NSE 20 and NSE 25 gaining by 0.7%, 2.4% and 1.4% respectively, taking the YTD performance to losses of 16.9%, 4.9% and 12.7% for NASI, NSE 20 and NSE 25, respectively. The equities market performance was mainly driven by gains recorded by large cap stocks such as NCBA, EABL and Diamond Trust Bank (DTB-K) of 7.8%, 6.8% and 4.6% respectively. The gains were however weighed down by losses recorded by stocks such as Safaricom and Equity Group of 2.1% and 0.7%, respectively.
During the week, equities turnover declined by 37.1% to USD 4.4 mn, from USD 7.0 mn, recorded the previous week, taking the YTD turnover to USD 430.3 mn. Foreign investors remained net sellers with a net selling position of USD 0.4 mn, from a net selling position of USD 1.0 mn recorded the previous week, taking the YTD net selling position to USD 53.8 mn.
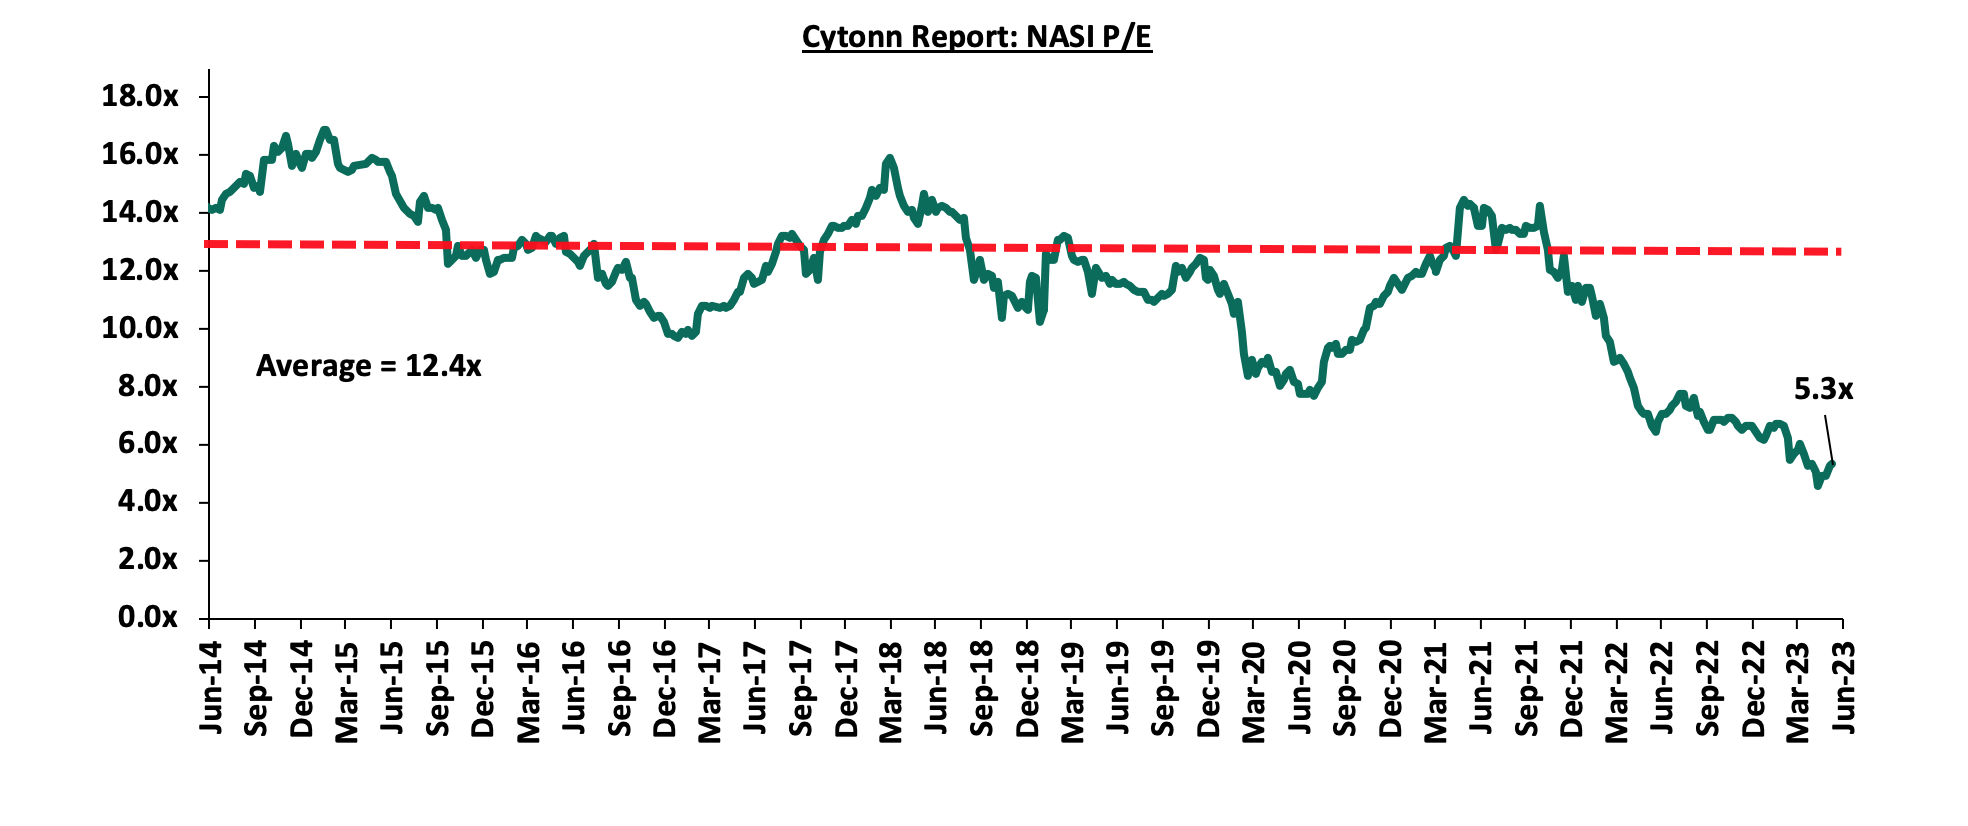
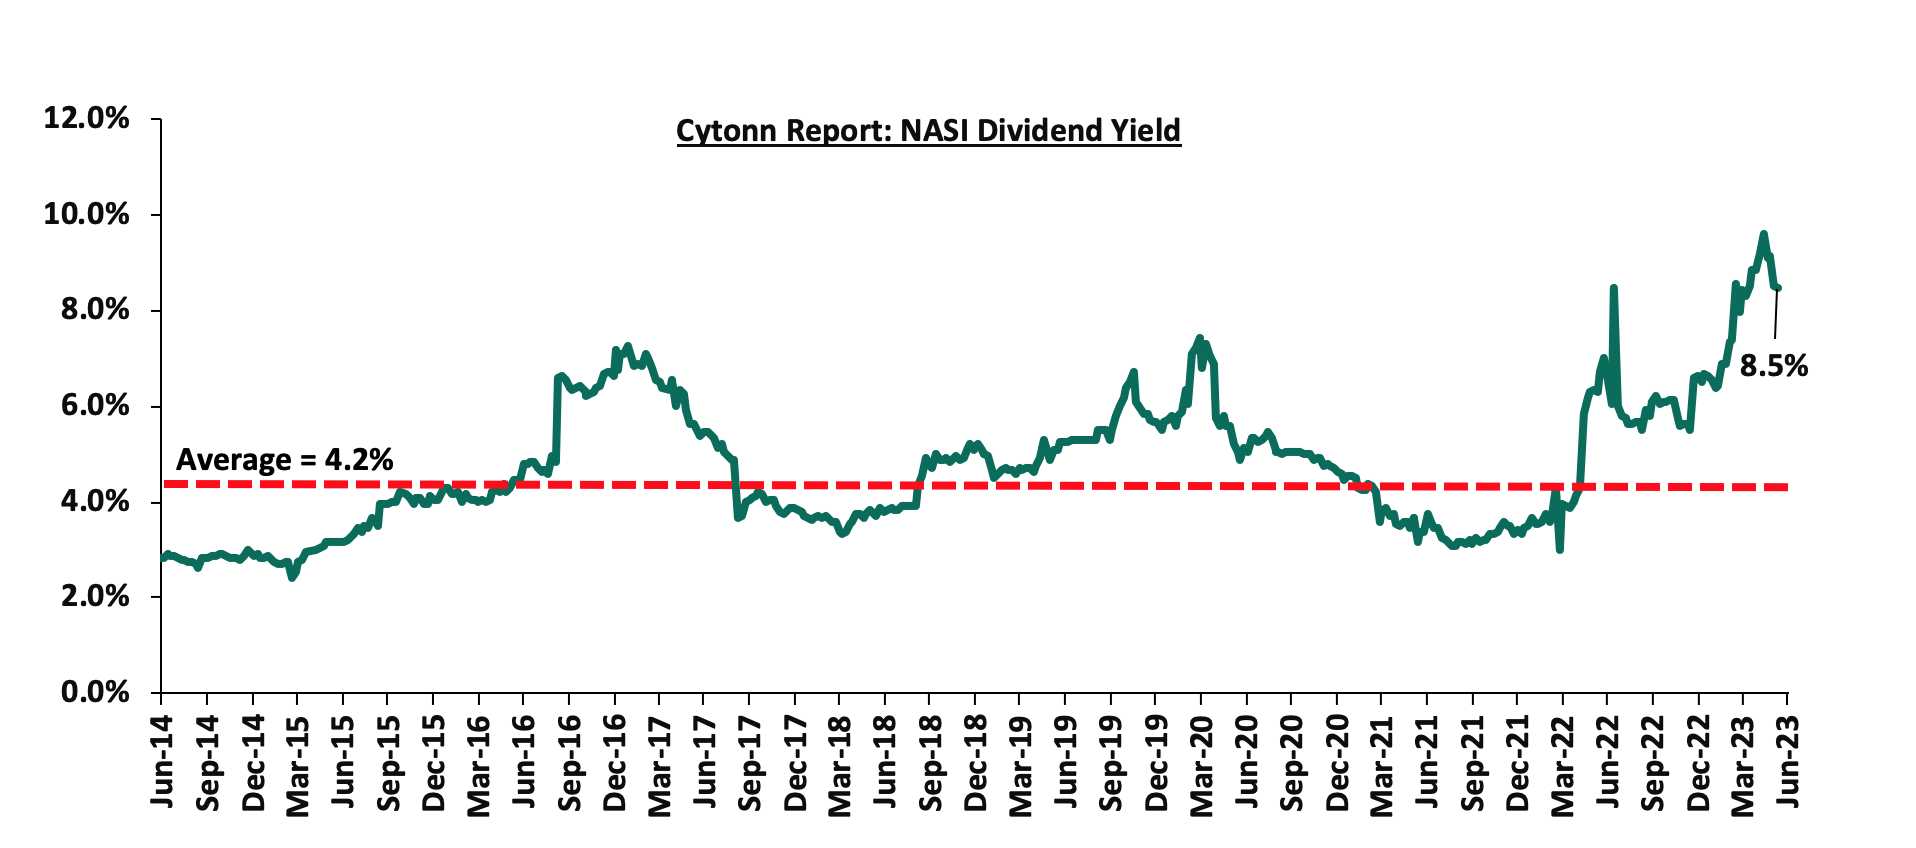
The market is currently trading at a price to earnings ratio (P/E) of 5.3x, 56.8% below the historical average of 12.4x. The dividend yield stands at 8.5%, 4.3% points above the historical average of 4.2%. Key to note, NASI’s PEG ratio currently stands at 0.7x, an indication that the market is undervalued relative to its future growth. A PEG ratio greater than 1.0x indicates the market is overvalued while a PEG ratio less than 1.0x indicates that the market is undervalued. The charts below indicate the historical P/E and dividend yields of the market;
Universe of coverage:
|
Company |
Price as at 2/06/2023 |
Price as at 9/06/2024 |
w/w change |
YTD Change |
Target Price* |
Dividend Yield |
Upside/ Downside** |
P/TBv Multiple |
Recommendation |
|
Equity Group*** |
38.2 |
37.9 |
(0.7%) |
(15.9%) |
56.3 |
10.6% |
59.2% |
0.7x |
Buy |
|
I&M Group*** |
16.9 |
17.0 |
0.6% |
(0.6%) |
24.5 |
13.3% |
57.8% |
0.4x |
Buy |
|
KCB Group*** |
31.9 |
31.8 |
(0.3%) |
(17.1%) |
45.5 |
6.3% |
49.4% |
0.5x |
Buy |
|
Jubilee Holdings |
180.0 |
187.5 |
4.2% |
(5.7%) |
260.7 |
6.4% |
45.4% |
0.3x |
Buy |
|
Diamond Trust Bank*** |
45.9 |
48.0 |
4.6% |
(3.7%) |
64.6 |
10.4% |
45.0% |
0.2x |
Buy |
|
ABSA Bank*** |
11.6 |
11.6 |
(0.4%) |
(5.3%) |
15.1 |
11.7% |
42.8% |
0.9x |
Buy |
|
Co-op Bank*** |
12.1 |
12.2 |
0.8% |
0.8% |
15.9 |
12.3% |
42.6% |
0.5x |
Buy |
|
Kenya Reinsurance |
1.9 |
2.0 |
2.6% |
6.4% |
2.5 |
10.1% |
36.2% |
0.2x |
Buy |
|
Liberty Holdings |
4.0 |
4.4 |
8.7% |
(13.7%) |
5.9 |
0.0% |
36.1% |
0.3x |
Buy |
|
Standard Chartered*** |
159.0 |
160.3 |
0.8% |
10.5% |
195.4 |
13.7% |
35.7% |
1.0x |
Buy |
|
CIC Group |
1.9 |
2.0 |
4.3% |
2.1% |
2.5 |
6.7% |
34.9% |
0.6x |
Buy |
|
NCBA*** |
37.0 |
39.9 |
7.8% |
2.4% |
48.7 |
10.7% |
32.8% |
0.8x |
Buy |
|
Stanbic Holdings |
104.8 |
110.0 |
5.0% |
7.8% |
131.8 |
11.5% |
31.2% |
0.7x |
Buy |
|
Sanlam |
7.1 |
7.9 |
10.6% |
(17.5%) |
10.3 |
0.0% |
30.3% |
2.2x |
Buy |
|
Britam |
4.6 |
5.0 |
8.5% |
(4.2%) |
6.0 |
0.0% |
19.9% |
0.7x |
Accumulate |
|
HF Group |
4.3 |
4.5 |
4.9% |
43.5% |
4.5 |
0.0% |
(1.5%) |
0.2x |
Sell |
|
Target Price as per Cytonn Analyst estimates **Upside/ (Downside) is adjusted for Dividend Yield ***For Disclosure, these are stocks in which Cytonn and/or its affiliates are invested in |
|||||||||
We are “Neutral” on the Equities markets in the short term due to the current tough operating environment and huge foreign investor outflows, and, “Bullish” in the long term due to current cheap valuations and expected global and local economic recovery.
With the market currently trading at a discount to its future growth (PEG Ratio at 0.7x), we believe that investors should reposition towards value stocks with strong earnings growth and that are trading at discounts to their intrinsic value. We expect the current high foreign investors sell-offs to continue weighing down the equities outlook in the short term.
- Regulated Real Estate Funds
- Real Estate Investment Trusts (REITs)
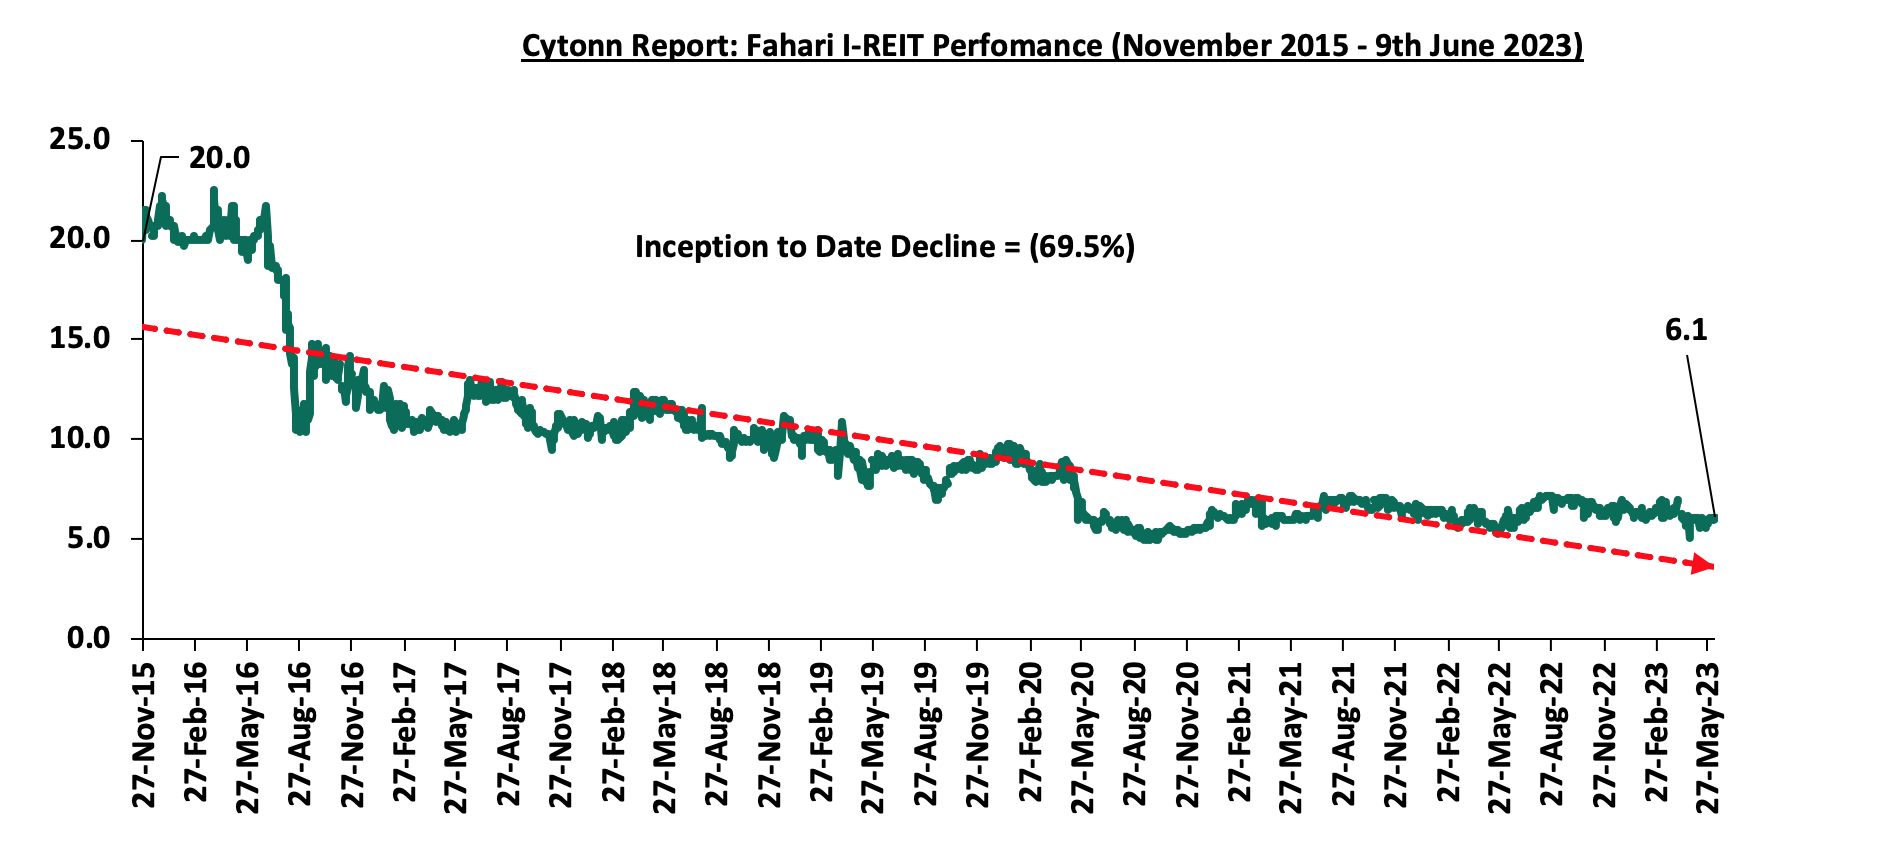
In the Nairobi Securities Platform, ILAM Fahari I-REIT closed the week trading at an average price of Kshs 6.1 per share. The performance represented a 1.0% increase from Kshs 6.0 per share recorded the previous week, taking it to a 10.0% Year-to-Date (YTD) decline from Kshs 6.8 per share recorded on 3 January 2023. In addition, the performance represented a 69.5% Inception-to-Date (ITD) loss from the Kshs 20.0 price. The dividend yield currently stands at 10.7%. The graph below shows Fahari I-REIT’s performance from November 2015 to 9 June 2023;
In the Unquoted Securities Platform, Acorn D-REIT and I-REIT traded at Kshs 23.9 and Kshs 21.6 per unit, respectively, as at 9 June 2023. The performance represented a 19.4% and 7.9% gain for the D-REIT and IREIT, respectively, from the Kshs 20.0 inception price. The volumes traded for the D-REIT and I-REIT came in at 12.3 mn and 30.1 mn shares, respectively, with a turnover of Kshs 257.5 mn and Kshs 620.7 mn, respectively, since inception in February 2021.
REITs provide numerous advantages, including; access to more capital pools, consistent and prolonged profits, tax exemptions, diversified portfolios, transparency, liquidity, and flexibility as an asset class. Despite these benefits, the performance of the Kenyan REITs market remains limited by several factors such as; i) insufficient investor understanding of the investment instrument, ii) time-consuming approval procedures for REIT creation, iii) high minimum capital requirements of Kshs 100.0 mn for trustees, and, iv) high minimum investment amounts set at Kshs 5.0 mn discouraging investments.
- Cytonn High Yield Fund (CHYF)
Cytonn High Yield Fund (CHYF) closed the week with an annualized yield of 13.6%, remaining unchanged from the 13.6% yield recorded the previous week. The performance also represented a 0.3% points Year-to-Date (YTD) decline from 13.9% yield recorded on 1 January 2023, and 2.1% points Inception-to-Date (ITD) loss from the 15.7% yield. The graph below shows Cytonn High Yield Fund’s performance from October 2019 to 9 June 2023;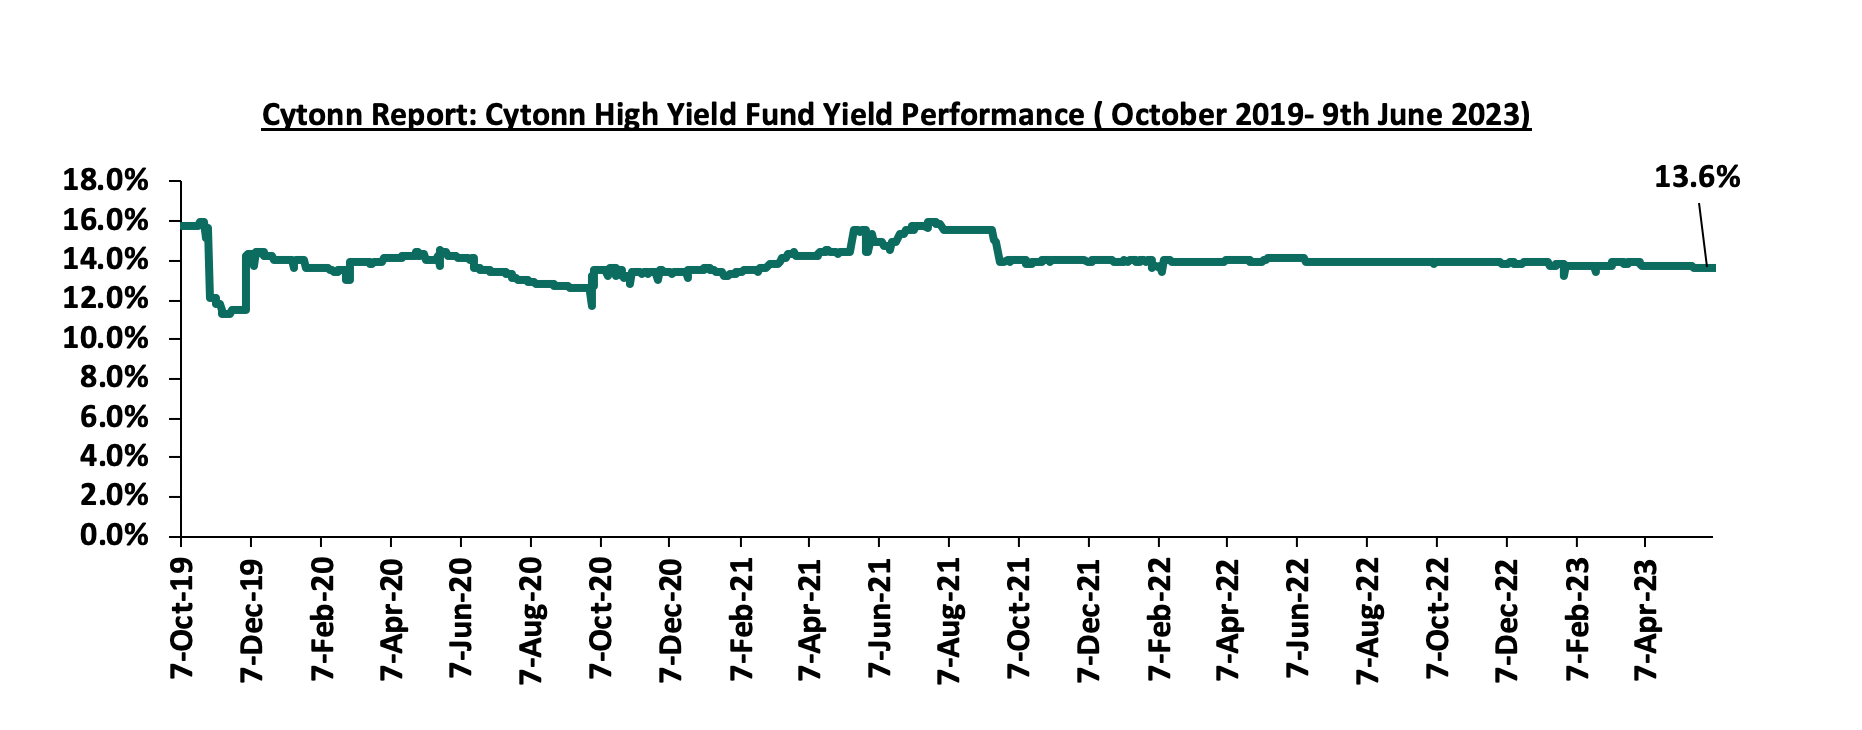
Notably, the CHYF has outperformed other regulated Real Estate funds with an annualized yield of 13.6%, as compared to Fahari I-REIT and Acorn I-REIT with yields of 10.7%, and 6.8% respectively. As such, the higher yields offered by CHYF makes the fund one of the best alternative investment resource in the Real Estate sector. The graph below shows the yield performance of the Regulated Real Estate Funds:
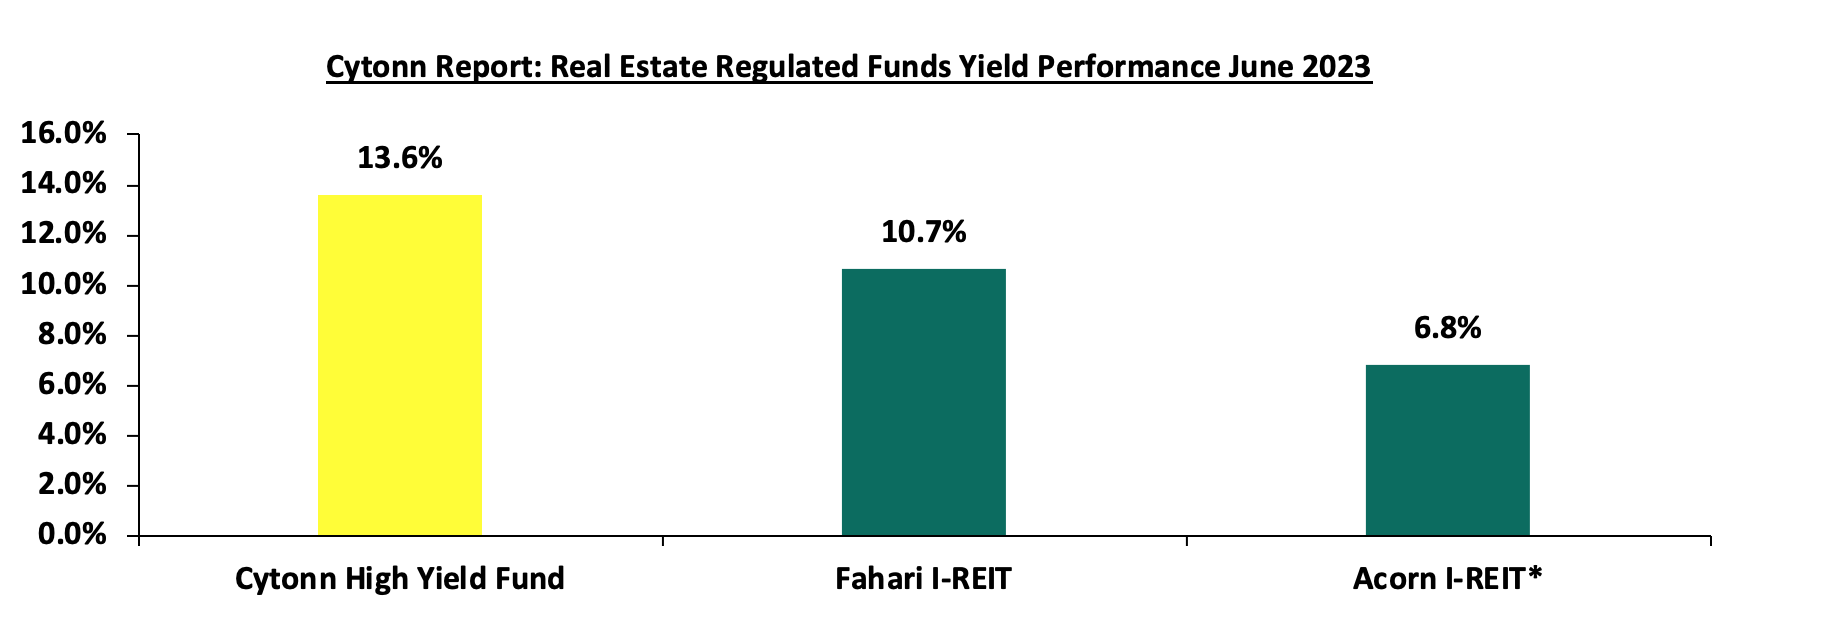
*FY’2022
Source: Cytonn Research
We expect the performance of Kenya’s Real Estate sector to remain on an upward trajectory, supported by factors such as; i) ongoing efforts by both the government and private sector to prioritize affordable housing, ii) infrastructural advancements supporting investments, iii) aggressive expansion strategies pursued by both local and international retailers, and, iv) relatively positive demographics in the country increasing demand for housing. However, the shift by companies to scale down physical operations in favour of hybrid and remote work policies, existing oversupply of physical space in select sectors, rising costs of construction on the back of rising inflation, and low investor appetite for REITs are expected to continue hindering optimal the performance of the sector.
Following the release of the FY’2022 results by Kenyan insurance firms, the Cytonn Financial Services Research Team undertook an analysis on the financial performance of the listed insurance companies and the key factors that drove the performance of the sector. The report themed “Sustained Growth in Earnings on the back of improved Efficiency”, where we assess the main trends in the sector, and areas that will be crucial for growth and stability going forward, seeking to give a view on which insurance firms are the most attractive and stable for investment. As a result, we shall address the following:
- Insurance Penetration in Kenya,
- Key Themes that Shaped the Insurance Sector in FY’2022,
- Industry Highlights and Challenges,
- Performance of The Listed Insurance Sector in FY’2022, and,
- Conclusion & Outlook of the Insurance Sector.
Section I: Insurance Penetration in Kenya
Insurance uptake in Kenya remains low compared to other key economies with the insurance penetration at 2.3% as at FY’2022, according to the Q4’2022 Insurance Regulatory Authority (IRA) and the Kenya National Bureau of Statistics (KNBS) 2023 Economic Survey. The low penetration rate, which is below the global average of 7.0%, according to Swiss RE institute, is attributable to the fact that insurance uptake is still seen as a luxury and mostly taken when it is necessary or a regulatory requirement. Notably, Insurance penetration remained unchanged at 2.3% in 2022, similar to what was recorded in 2021 and 2020. The chart below shows Kenya’s insurance penetration for the last 12 years: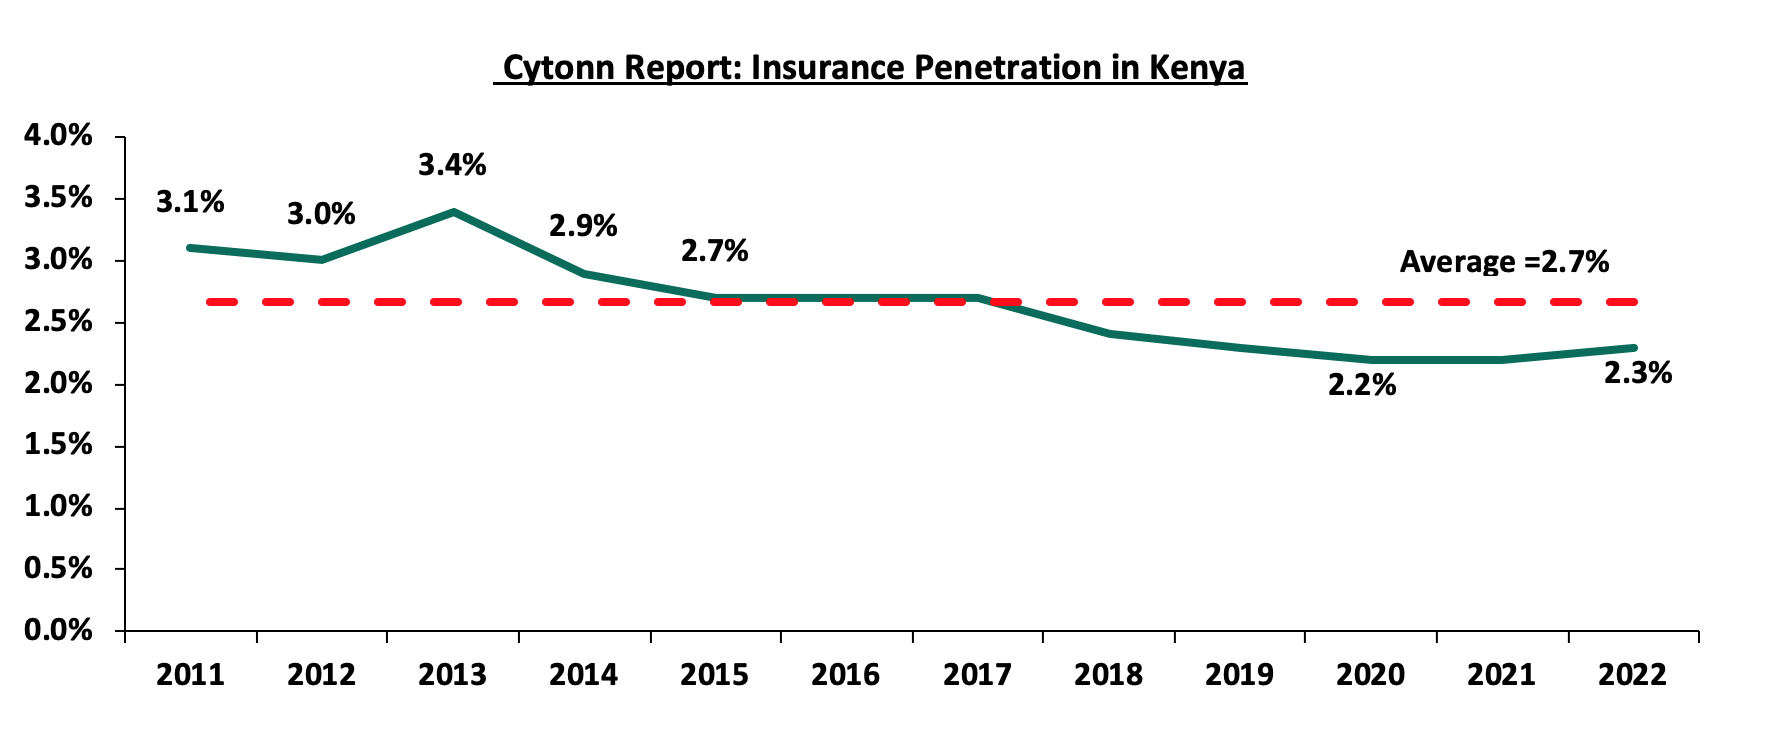
Source: CBK Financial Stability Reports
The chart below shows the insurance penetration in other economies across Africa: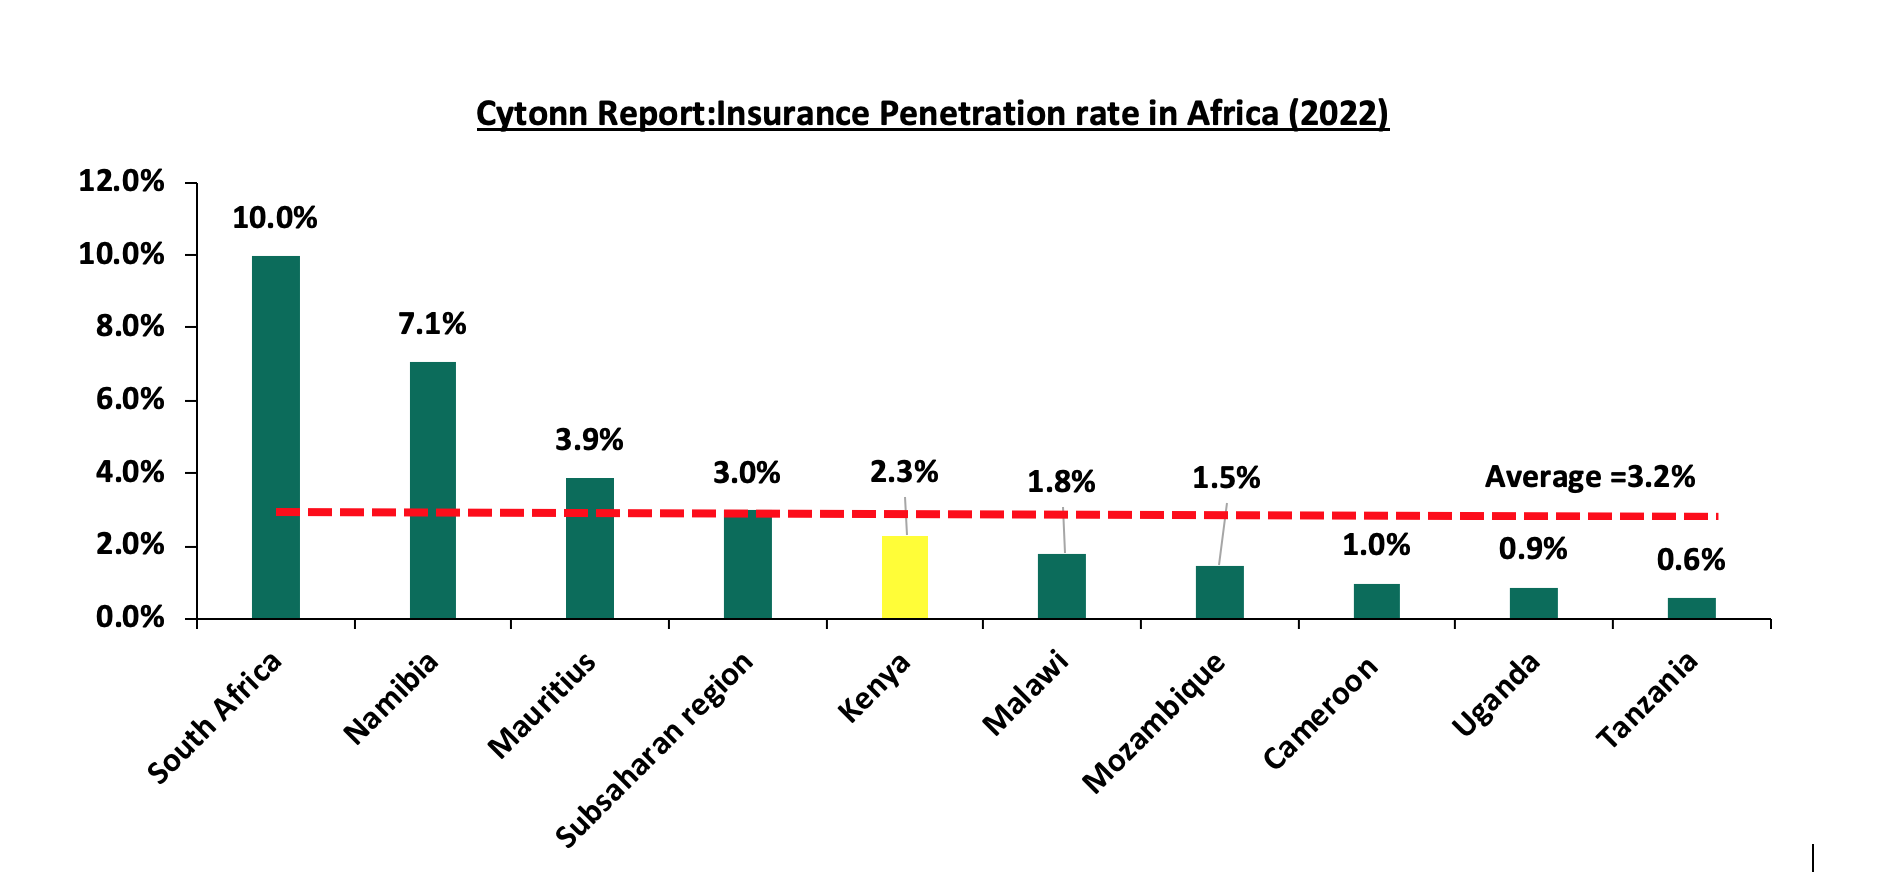
Source: Swiss Re, GCR Research, KNBS
Insurance penetration in Africa has remained relatively low, averaging 3.2% in 2022, mainly attributable to lower disposable income in the continent and slow growth of alternative distribution channels such as mobile phones to ensure wider reach of insurance products to the masses. South Africa remains the leader in insurance penetration in the continent, owing to a mature and highly competitive market, coupled with strong institutions and a sound regulatory environment.
Section II: Key Themes that Shaped the Insurance Sector in FY’2023
In FY’2022, the country witnessed a tough economic environment occasioned by elevated inflationary pressures with the overall GDP growth rate declining to 4.8% in 2022, from 7.6% recorded in 2021 according to the Central Bank of Kenya. However, according to the Q4’2022 Insurance Regulatory Authority Insurance industry report, the insurance sector showcased resilience recording a 12.2% growth in gross premium to Kshs 309.8 bn in FY’2022, from Kshs 276.1 bn in FY’2021. Insurance claims also increased by 2.4% to Kshs 82.9 bn in FY’2022, from Kshs 81.0 bn in FY’2021 and this was lower than the 19.5% growth recorded in FY’2021.
Notably, the general insurance business contributed 54.5% of the industry’s premium income compared to 45.5% contribution by long-term insurance business. During the period, the long-term business premiums grew by 13.8% to Kshs 140.8 bn, from Kshs 123.7 bn in FY’2021 while the general business premiums grew by 10.9% to Kshs 168.9 bn, from Kshs 152.4 bn in FY’2021. Additionally, motor insurance and medical insurance classes of insurance accounted for 64.4% of the gross premium income under the general insurance business, compared to 64.8% recorded in FY’2021. As for the long-term insurance business, the major contributors to gross premiums were deposit administration and life assurance classes accounting for 61.1% in FY’2022, compared to the 61.8% contribution by the two classes in FY’2021.
The NASI index declined by 23.7% in FY’2022, from a 9.5% gain recorded in FY’2021, leading to the deterioration of the insurance sector’s bottom line as a result of fair value losses in equities investments. As such, the sector’s allocation to quoted continue to reduce, with the proportion of quoted equities to total industry assets declining to 3.2% in FY’2022, from 5.5% in FY’2021.
Some of the key drivers of the industry performance included:
- Convenience and efficiency through the adoption of alternative channels for both distribution and premium collection such as Bancassurance and improved agency networks,
- Advancements in technology and innovation making it possible to make premium payments and through mobile phones,
- Continued recovery from the ripple effects of the pandemic witnessed in 2020 saw both individuals and businesses seek insurance uptake to cover their activities, leading to growth in gross premiums which increased by 12.2% to Kshs 309.8 bn, from Kshs 276.1 bn in FY’2021 and,
- The sector’s investments income decreased by 6.4% to Kshs 59.3 bn in FY’2022, from Kshs 63.3 bn in FY’2021, mainly attributable to the 8.0% decline in investment income in the long-term insurance business to Kshs 47.6 bn, from Kshs 51.8 bn in FY’2022. However, the investment income in the general business increased by 0.9% to Kshs 11.7 bn, from Kshs 11.6 bn in FY’2021.
On valuations, listed insurance companies are trading at a price to book (P/Bv) of 0.5x, lower than listed banks at 0.9x, but both are lower than their 16-year historical averages of 1.4x and 1.8x, for the insurance and banking sectors respectively. These two sectors are attractive for long-term investors supported by strong economic fundamentals. The chart below shows the price-to-book comparison for Listed Banking and Insurance Sectors: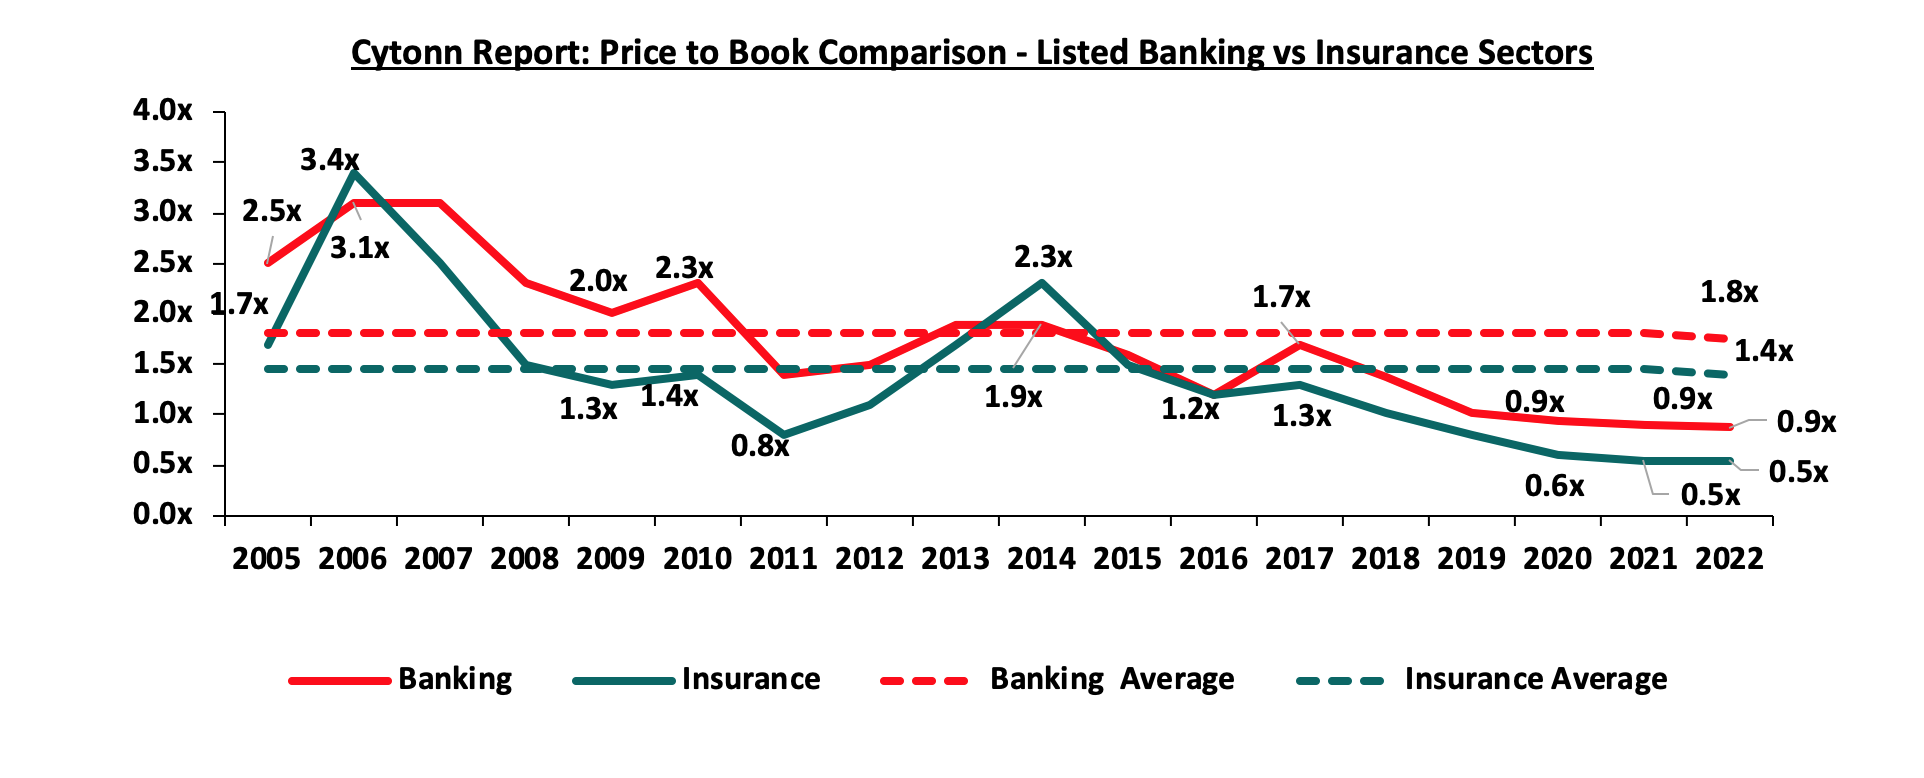
The key themes that have continued to drive the insurance sector include:
- Technology and Innovation
Although the industry has been slow in adopting digital trends, the onset of the COVID-19 pandemic in 2020 saw the adoption of digital distribution of insurance products as a matter of necessity. Consequently, the majority of insurance companies continue to take advantage of the available digital channels to drive growth and increase insurance penetration in the country. According to the Q1’2023 Communications Authority of Kenya industry release, mobile subscribers as at September 2022 stood at 65.5 mn against a population of 48.8 mn, translating to a mobile penetration of 134.2%. The high mobile penetration implies that mobile phones provide headroom and increased opportunities to distribute insurance products to the younger generation of consumers and those consumers that have not been served through traditional distribution methods. Given that the process of handling and inspecting claims manually is cumbersome and imperfect, the use of Artificial Intelligence (AI) assists in investigating the legitimacy of claims and identifying those that are fraudulent. An example is Jubilee Holdings which has rolled out a digital virtual assistant, through which clients can receive real-time services that include the end-to-end purchase of insurance products and access to services free of human intervention.
- Regulation
To ensure that the sector benefits from a globally competitive financial services sector, the regulator has been working through regulatory implementations to address some of the perennial, as well as emerging problems in the sector. The COVID-19 environment proved challenging especially on the regulatory front, as it was a balance between remaining prudent as an underwriter and adhering to the set regulations given the negative effects of the pandemic. Regulations used for the insurance sector in Kenya include the Insurance Act Cap 487 and its accompanying schedule and regulations, Retirement Benefits Act Cap 197 and The Companies Act. In FY’2022, regulation remained a key aspect affecting the insurance sector and the key themes in the regulatory environment include;
- IFRS 9 - IAS 39, Financial Instruments Recognition and Measurement was replaced with IFRS 9, Financial Instruments to address the classification and measurement of financial instruments, impairment, and hedge accounting. The guidelines introduce new classifications and measurements especially for financial assets, necessitating insurers to make judgments to determine whether financial investments are measured at amortized cost or fair value and whether gains and losses are included in the profit or loss or other comprehensive income. The new impairment model under IFRS 9 is based on expected credit losses and subsequently, all financial assets will carry a loss allowance, meaning that insurers will have to provide higher for impairment losses. Many insurance companies have opted to use the temporary exemption from the implementation of IFRS 9, by continuing to apply IAS 39, but the temporary exemption expired January 2023. IFRS 9 will enable insurance companies to develop appropriate models for their customer debtors and develop plans that will help them lower their credit risk in the future,
- IFRS 17- The standard establishes the principle for recognition, measurement, presentation, and disclosure of insurance contracts with the objective of ensuring insurance companies provide relevant information that faithfully represents the contracts. However, as a way to protect the insurance industry from the negative effects of the pandemic the International Accounting Standards Board (IASB), the international body responsible for setting up financial reporting standards deferred its implementation effective from January 2023 or earlier. The standard, having replaced IFRS 4, is expected to give better information on profitability by providing more insights into the current and future profitability of insurance contracts. Separation of financial and insurance results in the income statement will allow for better analysis of core performance for the entities and allow for better comparability of insurance companies, and,
- Risk Based Supervision - IRA has been implementing risk-based supervision through guidelines that require insurers to maintain a capital adequacy ratio of at least 200.0% of the minimum capital by 2020. The regulation requires insurers to monitor the capital adequacy and solvency margins on a quarterly basis, with the main objective being to safeguard the insurer’s ability to continue as a going concern and provide shareholders with adequate returns. We expect more mergers within the industry as smaller companies struggle to meet the minimum capital adequacy ratios. We also expect insurance companies to adopt prudential practices in managing and taking on risk and reduction of premium undercutting in the industry as insurers will now have to price risk appropriately.
- Capital Raising and share purchase
The move to a risk-based capital adequacy framework presented opportunities for capital raising initiatives mostly by the small players in the sector to shore up their capital and meet compliance measures. With the new capital adequacy assessment framework, capital is likely to be critical to ensuring stability and solvency of the sector to ensure the businesses are a going concern. In May 2022, Sanlam Limited, a South African financial services group listed on the Johannesburg Stock Exchange, announced that it had entered into a definitive Joint Venture agreement for a term of 10 years with Allianz SE, with the aim to leverage the two entities footprints in Africa and create a leading Pan-African financial services group, with an estimated equity value of Kshs 243.7 bn. Key to note, Sanlam Limited, indirectly owns 100.0% in Hubris Holdings Limited, which is the majority shareholder in Sanlam Kenya Plc, a listed insurance and financial services entity on the Nairobi Stock Exchange. The initial shareholding split of the Joint Venture was announced to be 60:40, Sanlam Limited to Allianz respectively, with the effective date of the proposed transaction being within 12-15 months of the announcement, subject to relevant approvals. However, given the length of the Agreement, we expect that the Joint Venture will provide for Sanlam Kenya Plc, Allianz General Insurance Kenya and Jubilee General Insurance (which Allianz owns the majority stake in – 66.0%), to combine operations to grow their market share, asset base and bottom lines.
Section III: Industry Highlights and Challenges
The insurance industry has experienced steady growth over the last decade, as a result, we anticipate sustained moderate growth on the back of an improving economy and subsequent rise in insurance premiums, which will strengthen the sector's ability to sustain profitability.
In FY’2022, the Insurance Regulatory Authority (IRA) accepted 12 new or repackaged insurance products filed by various insurance companies in accordance with their duty of regulating and supporting the development of the insurance sector. In the new products, bundled products accounted for 2 or 16.7% of the 12 products, medical plans accounted for 3 or 25.0% of the 12 products, micro-insurance accounted for 8.3% of the 12 products, non-linked insurance accounted for 8.3% of the 12 products, and miscellaneous accounted for 3 or 25.0% of the total new/repackaged products.
Industry Challenges:
- Insurance fraud: Insurance Fraud is an intentional deceit performed by an applicant or policyholder for financial advantage. In recent years, there has been an upsurge in fraudulent claims, particularly in medical and motor insurance, with estimates indicating that one in every five medical claims are fraudulent. This is mainly through exaggerating medical costs and hospitals by making patients to undergo unnecessary tests. According to Insurance Regulatory Authority Insurance industry report, 150 fraud instances were reported in FY’2022, with fraudulent motor accident injury claims accounting for 22.0% of the total. Fraudsters also collude with hospitals to make false claims fake surgeries and treatments, while health-care providers overcharge insured patients. To combat fraud, the sector has adopted the usage of block chain and artificial intelligence,
- High loss ratios: Core insurance business performance has been dwindling, mainly attributable to the high loss ratios. In FY’2022, loss ratios under the long-term insurance business increased by 3.9% points to 53.2%, from 49.3% recorded in FY’2021, mainly attributable to 21.4% increase in claims to Kshs 68.5 bn, from Kshs 56.4 bn in FY’2021, that outpaced the 12.4% increase in net premiums to Kshs 128.8 bn, from Kshs 114.6 bn in FY’2021. However, the loss ratios under the general insurance business eased, with the ratio declining to 64.6%, from 68.9% in FY’2021, largely attributable to the 18.5% increase in net premiums to Kshs 120.1 bn, from Kshs 101.4 bn in FY’2021, which outpaced the 11.2% growth in net claims to Kshs 77.6 bn, from Kshs 69.8 bn in FY’2021,
- Declining consumer confidence in the insurance industry: In FY2022, IRA received 1870 complaints from policyholders and beneficiaries lodged against insurers. The general insurance accounted for majority of the complaints at 80.5%, while long-term insurers recorded 19.5%. The complaints range from insurance companies failing to settle claims and constant haggling over terms of insurance,
- High Market competition: Despite low insurance penetration in the country, the sector is served by 57 insurance companies offering the same products. Some insurers have resorted to shady tactics in the fight for market dominance, such as premium undercutting, which involves offering clients implausibly low premiums in order to gain a competitive advantage and protect their market share. This is a significant factor in the industry's underwriting losses. Plans to hire a consultant to review industry pricing in March 2021 were retaliated against by the regulator, but the plans are still in the works. However, this is against a background of weak insurance uptake, which could be made worse by higher premium prices. Industry participants have debated pricing, and,
- Regulation compliance: Due to laws on capital requirements, smaller insurance businesses have found it challenging to operate without raising capital or combining to expand their capital base. For instance, the joint venture agreement between Sanlam Limited and Allianz SE with an estimated equity value of Kshs 243.7 bn, was aimed at leveraging the two entities footprints in Africa and create a leading Pan-African financial services group. Additionally, the implementation of IFRS 17, are expensive since accounting and actuarial systems need to be updated and realigned.
Section IV: Performance of the Listed Insurance Sector in FY’2022
The table below highlights the performance of the listed insurance sector, showing the performance using several metrics, and the key take-outs of the performance.
|
Listed Insurance Companies FY’2022 Earnings and Growth Metrics |
||||||||
|
Insurance Company |
Core EPS Growth |
Net Premium growth |
Claims growth |
Loss Ratio |
Expense Ratio |
Combined Ratio |
ROaE |
ROaA |
|
Britam |
962.1% |
2.4% |
5.3% |
71.4% |
66.1% |
137.5% |
2.0% |
0.5% |
|
Liberty |
362.9% |
9.4% |
(13.5%) |
61.9% |
71.2% |
133.1% |
4.2% |
0.9% |
|
CIC |
63.6% |
18.8% |
10.8% |
70.6% |
50.4% |
121.0% |
3.8% |
2.5% |
|
Jubilee Holdings |
(3.8%) |
(5.9%) |
(0.7%) |
114.5% |
38.5% |
153.0% |
14.5% |
4.0% |
|
Sanlam |
(90.0%) |
(11.1%) |
(15.0%) |
89.2% |
40.8% |
130.0% |
(8.7%) |
(0.2%) |
|
*FY'2022 Weighted Average |
377.4% |
1.6% |
1.9% |
88.1% |
52.5% |
140.6% |
7.0% |
2.2% |
|
FY'2021 Weighted Average |
89.2% |
8.9% |
11.9% |
87.9% |
59.5% |
147.4% |
6.6% |
2.1% |
|
*Market cap weighted as at 09/06/2023 |
||||||||
|
**Market cap weighted as at 03/06/2022 |
||||||||
The key take-outs from the above table include;
- Core EPS growth recorded a weighted growth of 377.4%, compared to a weighted growth of 89.2%, in FY’2021. The sustained growth in earnings was attributable to increased premiums during the period following continued recovery by the sector from the impacts of the COVID-19 pandemic, coupled with higher yields from government papers;
- Britam recorded a significant growth of 962.1% in their Core Earnings Per Share in FY’2022 compared to a growth of 100.8% recorded in FY’2021. The performance was mainly driven by a 2.4% increase in net earned premiums to Kshs 26.3 bn, from Kshs 25.7 bn recorded in FY’2021, coupled with a 7.1% decline in total operating expenses to Kshs 36.2 bn, from Kshs 38.9 bn recorded in FY’2021,
- Similarly, Liberty’s Core Earnings Per Share increased significantly by 362.9%% in FY’2022 compared to a decline of 87.9% recorded in FY’2021. The performance during the period under review was driven by a 9.4% increase in net earned premiums to Kshs 7.4 bn, from Kshs 6.7 bn recorded in FY’2021, coupled with a 13.5% decline in net insurance benefits and claims to Kshs 4.6 bn, from Kshs 5.3 bn recorded in FY’2021, and,
- Sanlam recorded the highest decline of 90.0% in their Core Earnings Per Share in FY’2022 compared to a growth of 13.7% recorded in FY’2021. The performance was mainly driven by a 11.1% decrease in net earned premiums to Kshs 8.2 bn, from Kshs 9.2 bn recorded in FY’2021,
- The premiums grew at a slower pace of 1.6% in FY’2022, compared to a growth of 8.9% in FY’2021, while claims also grew at slower rate of 1.9% in FY’2022, from the 11.9% recorded in FY’2021 on a weighted average basis,
- The loss ratio across the sector increased slightly to 88.1% in FY’2022 from 87.9% in FY’2021,
- The expense ratio eased to 52.5% in FY’2022, from 59.5% in FY’2021, owing to a decline in operating expenses, a sign of increased efficiency,
- The insurance core business still remains unprofitable, with a combined ratio of 140.6% as at FY’2022, compared to 147.4% in FY’2021, and,
- On average, the insurance sector delivered a Return on Average Equity (ROaE) of 7.0%, an increase from a weighted Return on Average Equity of 6.6% in FY’2021.
Based on the Cytonn FY’2022 Insurance Report, we ranked insurance firms from a franchise value and from a future growth opportunity perspective with the former getting a weight of 40.0% and the latter a weight of 60.0%.
For the franchise value ranking, we included the earnings and growth metrics as well as the operating metrics shown in the table below in order to carry out a comprehensive review:
|
Listed Insurance Companies FY’2022 Franchise Value Score |
|||||||
|
Insurance Company |
Loss Ratio |
Expense Ratio |
Combined Ratio |
Return on Average Capital Employed |
Tangible Common Ratio |
Franchise Value Score |
Ranking |
|
CIC Group |
70.6% |
50.4% |
121.0% |
23.7% |
17.8% |
14 |
1 |
|
Sanlam |
89.2% |
40.8% |
130.0% |
60.5% |
1.4% |
20 |
2 |
|
Jubilee |
114.5% |
38.5% |
153.0% |
16.5% |
26.7% |
21 |
3 |
|
Liberty |
61.9% |
71.2% |
133.1% |
7.5% |
18.4% |
23 |
4 |
|
Britam |
71.4% |
66.1% |
137.5% |
9.7% |
11.8% |
27 |
5 |
|
*FY'2022 Weighted Average |
88.1% |
52.5% |
140.6% |
16.0% |
18.6% |
|
|
The Intrinsic Valuation is computed through a combination of valuation techniques, with a weighting of 40.0% on Discounted Cash-flow Methods, 35.0% on Residual Income and 25.0% on Relative Valuation. The overall FY’2022 ranking is as shown in the table below:
|
Listed Insurance Companies FY’2022 Comprehensive Ranking |
|||||
|
Insurance Company |
Franchise Value Score |
Intrinsic Value Score |
Weighted Score |
FY’2022 Ranking |
FY'2021 Ranking |
|
Jubilee Holdings |
3 |
1 |
1.8 |
1 |
1 |
|
CIC Group |
1 |
3 |
2.2 |
2 |
5 |
|
Liberty Holdings |
4 |
2 |
2.8 |
3 |
2 |
|
Sanlam Kenya |
2 |
4 |
3.2 |
4 |
4 |
|
Britam |
5 |
5 |
5 |
5 |
3 |
Major Changes from the FY’2022 Ranking are;
- Jubilee Holdings maintained position 1 in FY’2022 as was in FY’2021 mainly due to the strong the franchise and intrinsic scores in FY’2022, driven by reduction in expense ratio to 38.5% in FY’2022, from 41.3% in FY’2021. However, the combined ratio deteriorated slightly to 153.0% in FY’2022, from 149.7% in FY’2021
- CIC Group improved to position 2 in FY’2022 from position 5 in FY’2021 driven by an improvement in both franchise and intrinsic scores, attributable to the improvement in the expense ratio to 50.4%, from 52.2%, taking the combined ratio to 121.0%, an improvement from the 123.8% recorded in FY’2021,
- Britam Holdings declined to position 5 in FY’2022, from position 3 in FY’2021 mainly due to declines in both the franchise and intrinsic scores in FY’2022, driven by the deterioration in the loss ratio to 71.4%, from 69.4% in FY’2021. However, the combined ratio improved to 137.4%, from the 151.5% in FY’2021, and,
- Liberty declined to position 3 in FY’2022 from position 2 in FY’2021 mainly due to deterioration in both the franchise score and intrinsic value score.
Section V: Conclusion & Outlook of the Insurance Sector
The insurance industry has continued to struggle with low penetration rates, as well as a deteriorating business environment caused by rising interest rates, higher inflationary pressures, and persistent currency depreciation. As a result, the level of disposable income among households has decreased. However, the sector continues to undergo transition where traditional models have been disrupted, mainly on the digital transformation, innovation, and regulation front, which have positively impacted the outlook. We also expect the insurance sector to maintain the culture of innovation achieved during the pandemic period while maintaining the customer-centricity as the main focus of the sector’s operating model. As a result, we believe that in order to maintain and improve profitability, the insurance industry will need to engage in careful balancing acts. Some of these things the industry can take to grow significantly and raise penetration in the nation include:
- Partnerships and alternative distribution channels: We anticipate that underwriters will continue to form alliances and offer additional distribution channels in the future. This can be accomplished by collaborating with other financial services providers, such as fund managers who have moved into delivering insurance-linked products, in addition to the present bancassurance connection with banks. The insurance business can also use the penetration of bank products to promote its own products. Integration of mobile money payments to allow for policy payments is also predicted to continue due to the ease it provides, as well as the country's high mobile phone penetration; thus, insurance companies would wish to exploit this to improve penetration,
- Regulations - To ensure the sector's solvency and sustainability, we anticipate more regulation from the regulatory body and other international stakeholders. Insurers must modify their insurance contract recognition techniques in advance of the implementation of IFRS 9 and IFRS 17. The regulator's quest for the targeted capital adequacy levels will almost certainly result in further consolidations as insurers struggle to achieve the capital requirements, particularly for small firms. Furthermore, regulators, governments, and policymakers are working harder to make Environmental, Social, and Governance (ESG) standards a requirement in the insurance industry,
- Portfolio Optimization. To maintain the sector's recovery and achieve profitability, insurance companies should optimize their portfolio by re-evaluating their services. The sale of business divisions deemed to be unproductive can help insurers focus on their core and profitable products while eliminating non-core offers. For instance, in 2022, Jubilee Insurance obtained Kshs 270.0 million from the sale of a 52.4% share in its Mauritian subsidiary to insurance provider Allianz SE. As insurers focus more on profitable goods, portfolio optimization will eventually include reducing holdings in unprofitable subsidiaries and affiliates and impact underwriters' products,
- Innovation: To aid portfolio expansion and growth, insurers must harness the digital insurance solutions at their disposal in order to improve internal efficiency and accelerate time to market. As such, we anticipate cooperation between insurers and InsurTechs,
- Investment diversification - To improve earnings and reduce losses, underwriters should focus more on investment diversification through routes such as pension plans, unit trusts, fund management, and investment advisories. As indicated by rising combined ratios, insurers have suffered losses in their core business, with increases in underwriting expenditures and claims exceeding increases in premiums. In addition, we anticipate insurers will continue to investigate non-traditional asset types such as infrastructure. One illustration is Jubilee Holdings' investment in companies including Uganda's Bujagali hydropower plant, PDM Holdings Ltd., and IPS Cable Systems Ltd., whose earnings have improved its cash flow, and,
- Insurance awareness campaigns – Low insurance penetration is significantly impacted by the persistent information gap about insurance products and their significance. Insurance is still largely assumed to be regulatory compliance rather than a necessity. The regulators, insurers, and other stakeholders should enhance insurance awareness campaigns to increase understanding of insurance products. According to a survey commissioned by the Association of Kenya Insurers (AKI), the second largest contributor to low insurance uptake at 27.0% is a lack of knowledge of the various insurance products and their benefits. As such, there is a lot of headroom for insurers to educate, repackage, and tailor their products to different potential clients.
To read the FY’2022 Insurance Report, please download it here
Disclaimer: The views expressed in this publication are those of the writers where particulars are not warranted. This publication is meant for general information only and is not a warranty, representation, advice or solicitation of any nature. Readers are advised in all circumstances to seek the advice of a registered investment advisor.

- Talk to us
- Kenya
- P.O Box 20695 - 00200, Nairobi, Kenya
- Cell +254709101200
- Tel +254709101200
- WhatsApp +254741676635
- United States
- +254709101200
- DOWNLOAD OUR APP
-


- Kenya
- 8th Floor, Pinetree Plaza, Kaburu Drive, Ngong Road, Nairobi, Kenya
- USA
- Suite 1150, 1775 Eye Street NW, USA, Washington DC 20006, USA
- Investments
- High Yield
- Private Equity
- Real Estate
- Real Estate
- RiverRun Estates
- Cytonn Towers
- The Ridge
- Taraji Heights
- The Alma