Kenya National Social Security Fund (NSSF), & Cytonn Weekly #12/2025
By Research Team, Mar 23, 2025
Executive Summary
Fixed Income
During the week, T-bills were oversubscribed for the seventh consecutive week, with the overall subscription rate coming in at 129.0%, higher than the subscription rate of 122.7% recorded the previous week. Investors’ preference for the shorter 91-day paper waned, with the paper receiving bids worth Kshs 1.7 bn against the offered Kshs 4.0 bn, translating to an undersubscription rate of 43.2%, from the oversubscription rate of 188.1% recorded the previous week. The subscription rates for the 182-day paper decreased to 84.0% from the 98.0% recorded the previous week while the 364-day paper increased to 208.2% from the 121.1% recorded the previous week. The government accepted a total of Kshs 24.5 bn worth of bids out of Kshs 31.0 bn bids received, translating to an acceptance rate of 79.0%. The yields on the government papers were on a downward trajectory with the yields on the 91-day paper decreasing the most by 7.8 bps to 8.8% from 8.9% recorded the previous week. The yields on the 182-day and 364-day papers decreased by 2.9 bps and 1.2 bps to remain relatively unchanged from 9.1% and 10.5% respectively recorded the previous week;
During the week, the National Treasury gazetted the revenue and net expenditures for the eighth month of FY’2024/2025, ending 28th February 2025, highlighting that the total revenue collected as at the end of February 2025 amounted to Kshs 1,403.7 bn, equivalent to 56.7% of the revised estimates of Kshs 2,475.1 bn for FY’2024/2025 and is 85.1% of the prorated estimates of Kshs 1,650.0 bn.
Equities
During the week, the equities market was on an upward trajectory, with NASI gaining the most by 0.5%, while NSE 20, NSE 25 and NSE 10 gained by 0.4%, 0.2% and 0.1% respectively, taking the YTD performance to gains of 9.1%, 3.9%, 2.2% and 0.6% for NSE 20, NASI, NSE 25 and NSE 10, respectively. The equities market performance was driven by gains recorded by large-cap stocks such as Standard Chartered, Cooperative Bank and NCBA of 12.3%, 6.0%, and 1.0%, respectively. The performance was however weighed down by losses recorded by large cap stocks such as Equity bank, Absa Bank and KCB group of 2.0%, 1.3% and 0.4% respectively;
During the week Standard Chartered Bank Kenya released its FY’2024 financial results, Standard Chartered Bank Kenya’s Profit After Tax (PAT) increased by 45.0% to Kshs 20.1 bn, from Kshs 13.8 bn in FY’2023. The performance was mainly driven by a 21.4% increase in total operating income to Kshs 50.7 bn, from Kshs 41.7 bn in FY’2023, which outpaced the 1.9% increase in total operating expense to Kshs 22.5 bn in FY’2024, from Kshs 22.1 bn in FY’2023.
During the week Co-operative Bank released its FY’2024 financial results, Cooperative Bank Kenya’s Profit After Tax (PAT) increased by 9.8% to Kshs 25.5 bn, from Kshs 23.2 bn in FY’2023. The performance was mainly driven by a 12.5% increase in total operating income to Kshs 80.6 bn, from Kshs 71.7 bn in FY’2023, which was however weighed down by the 17.7% increase in total operating expense to Kshs 46.7 bn in FY’2024, from Kshs 39.7 bn in FY’2023.
During the week Absa Bank Kenya released its FY’2024 financial results, Absa Bank Kenya’s Profit After Tax (PAT) increased by 27.5% to Kshs 20.9 bn, from Kshs 16.4 bn in FY’2023. The performance was mainly driven by a 14.2% increase in total operating income to Kshs 62.3 bn, from Kshs 54.6 bn in FY’2023, which outpaced the 5.5% increase in total operating expense to Kshs 32.6 bn in FY’2024, from Kshs 30.9 bn in FY’2023.
Real Estate
During the week, Radisson Blu Arboretum Hotel in Nairobi announced a Kshs 1.4 bn renovation plan to upgrade its facilities and enhance guest experiences. The refurbishment will focus on modernizing guest rooms, meeting spaces, dining areas, and recreational facilities to align with contemporary hospitality standards. This initiative underscores Radisson Hotel Group's commitment to maintaining its competitive edge in Nairobi's burgeoning hospitality sector.
During the week, Centum Real Estate, a subsidiary of Centum Investment Company, signed a deal with Pan-African developer ARISE to jointly establish a Kshs 388.2 bn industrial park within the Vipingo Special Economic Zone (SEZ) in kilifi town starting within the next quarter. The development will sit on a 2,000-acre Vipingo SEZ land and the business park will have manufacturing and logistic hubs potentially creating 500,000 jobs.
On the Unquoted Securities Platform, Acorn D-REIT and I-REIT traded at Kshs 25.4 and Kshs 22.2 per unit, respectively, as per the last updated data on 14th March 2025. The performance represented a 27.0% and 11.0% gain for the D-REIT and I-REIT, respectively, from the Kshs 20.0 inception price. Additionally, ILAM Fahari I-REIT traded at Kshs 11.0 per share as of 14th March 2025, representing a 45.0% loss from the Kshs 20.0 inception price;
Focus of the Week
National Social Security schemes are created by governments to form the first pillar of social security. In Africa, Kenya was the second country after Ghana to form a national security scheme, The National Social Security Fund (NSSF), done in 1965 through an Act of Parliament (Cap 258). In recent years, discussions around the growth and reform of the NSSF have gained momentum, with key considerations on how to increase coverage, especially for the informal sector, and improve service delivery. The fund has also faced a number of challenges in recent years, with concerns about mismanagement, corruption, and inefficiencies often overshadowing the fund’s broader mission and leading to a decline in public confidence. As such, this week we turn our focus to the Kenyan National Social Security Fund to shed light on its latest financial results, recent developments and what needs to be done improve efficiency;
Investment Updates:
- Weekly Rates:
- Cytonn Money Market Fund closed the week at a yield of 15.58% p.a. To invest, dial *809# or download the Cytonn App from Google Play store here or from the Appstore here;
- We continue to offer Wealth Management Training every Tuesday, from 7:00 pm to 8:00 pm. The training aims to grow financial literacy among the general public. To register for any of our Wealth Management Trainings, click here;
- If interested in our Private Wealth Management Training for your employees or investment group, please get in touch with us through wmt@cytonn.com;
- Cytonn Insurance Agency acts as an intermediary for those looking to secure their assets and loved ones’ future through insurance namely; Motor, Medical, Life, Property, WIBA, Credit and Fire and Burglary insurance covers. For assistance, get in touch with us through insuranceagency@cytonn.com;
- Cytonn Asset Managers Limited (CAML) continues to offer pension products to meet the needs of both individual clients who want to save for their retirement during their working years and Institutional clients that want to contribute on behalf of their employees to help them build their retirement pot. To more about our pension schemes, kindly get in touch with us through pensions@cytonn.com;
Hospitality Updates:
- We currently have promotions for Staycations. Visit cysuites.com/offers for details or email us at sales@cysuites.com;
Money Markets, T-Bills Primary Auction:
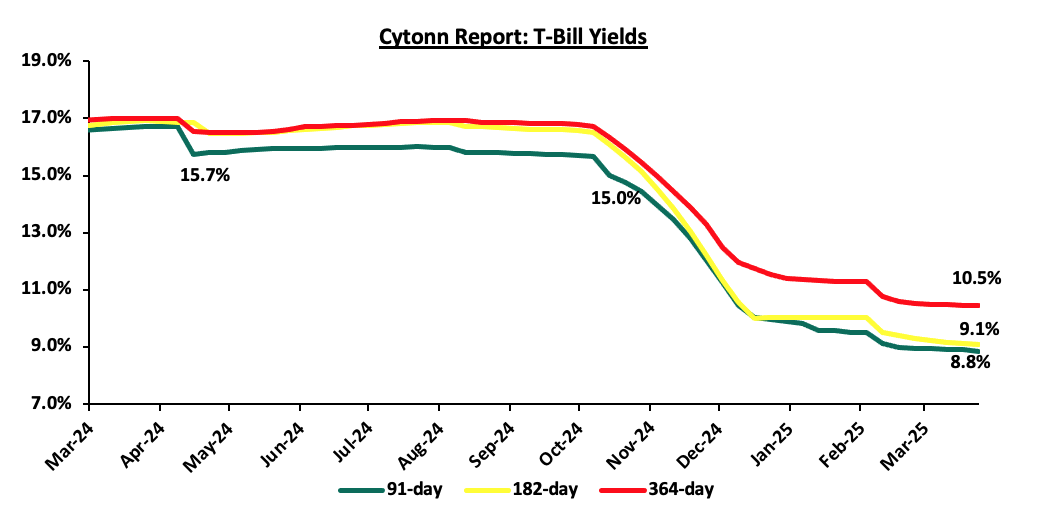
During the week, T-bills were oversubscribed for the seventh consecutive week, with the overall subscription rate coming in at 129.0%, higher than the subscription rate of 122.7% recorded the previous week. Investors’ preference for the shorter 91-day paper waned, with the paper receiving bids worth Kshs 1.7 bn against the offered Kshs 4.0 bn, translating to an undersubscription rate of 43.2%, from the oversubscription rate of 188.1% recorded the previous week. The subscription rates for the 182-day paper decreased to 84.0% from the 98.0% recorded the previous week while the 364-day paper increased to 208.2% from the 121.1% recorded the previous week. The government accepted a total of Kshs 24.5 bn worth of bids out of Kshs 31.0 bn bids received, translating to an acceptance rate of 79.0%. The yields on the government papers were on a downward trajectory with the yields on the 91-day paper decreasing the most by 7.8 bps to 8.8% from 8.9% recorded the previous week. The yields on the 182-day and 364-day papers decreased by 2.9 bps and 1.2 bps to remain relatively unchanged from 9.1% and 10.5%, respectively, recorded the previous week.
The charts below show the yield performance of the 91-day, 182-day and 364-day papers from March 2024 to March 2025:
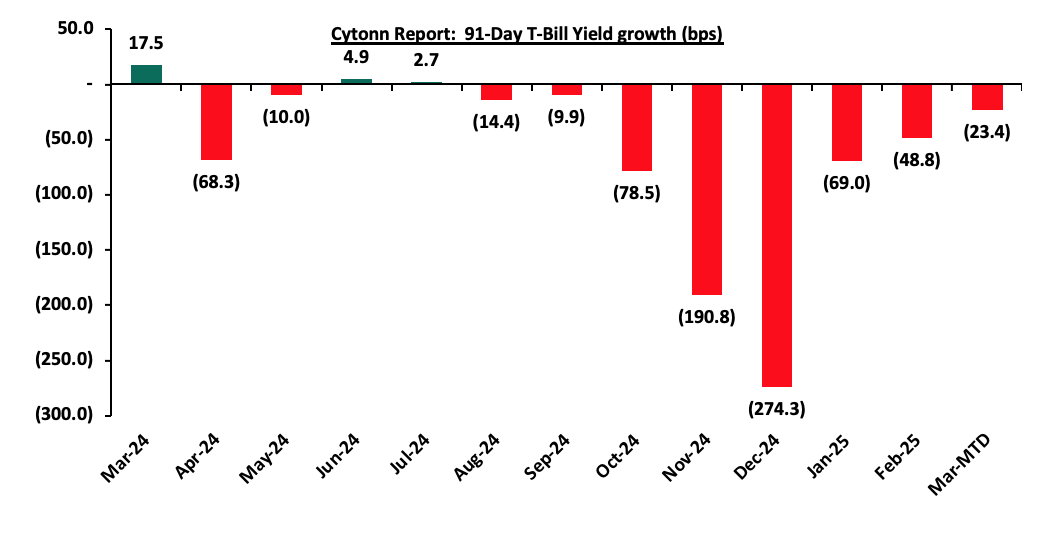
The chart below shows the yield growth for the 91-day T-bill:
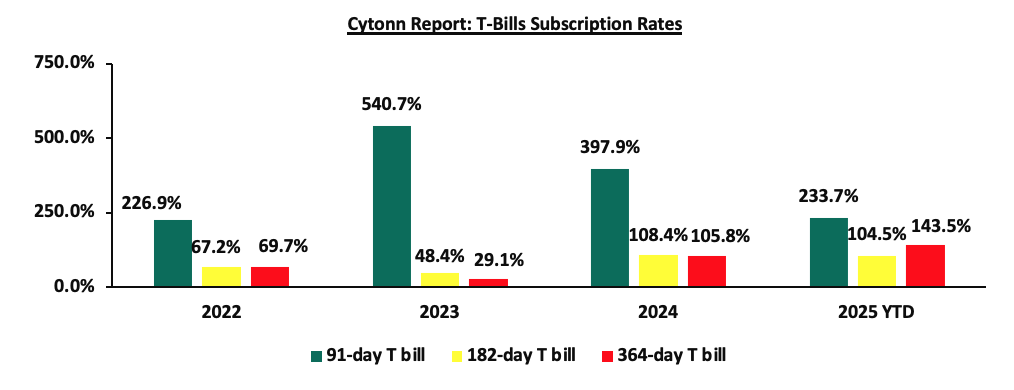
The chart below compares the overall average T-bill subscription rates obtained in 2022,2023, 2024 and 2025 Year-to-date (YTD):
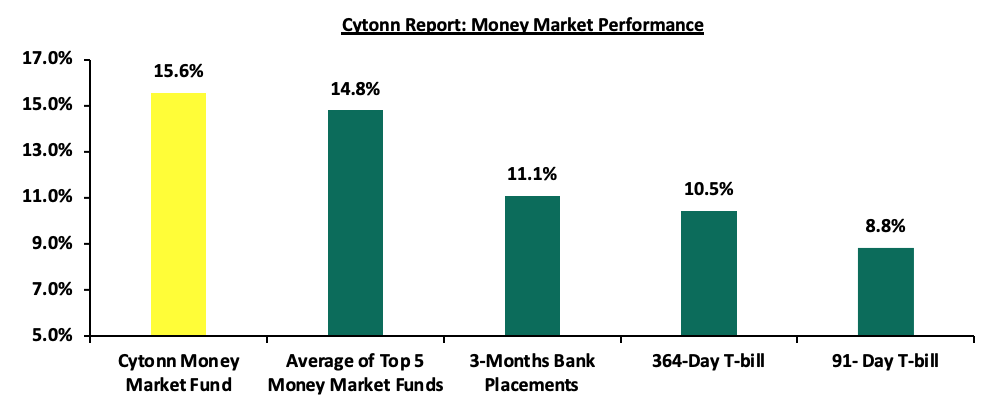
Money Market Performance:
In the money markets, 3-month bank placements ended the week at 11.1% (based on what we have been offered by various banks), and the yields on the government papers were on a downward trajectory with the yields on the 91-day paper decreasing by 7.8 bps to 8.8% from the 8.9% recorded the previous week while the 364-day paper decreased by 1.2 bps to remain relatively unchanged from the 10.5% recorded the previous week. The yield on the Cytonn Money Market Fund decreased by 12.0 bps to 15.6% from the 15.7% recorded the previous week, while the average yields on the Top 5 Money Market Funds decreased by 10.6 bps to close the week at 14.8%, from the 14.9% recorded the previous week.
The table below shows the Money Market Fund Yields for Kenyan Fund Managers as published on 21st March 2025:
|
Cytonn Report: Money Market Fund Yield for Fund Managers as published on 21stMarch 2025 |
||
|
Rank |
Fund Manager |
Effective Annual Rate |
|
1 |
Gulfcap Money Market Fund |
16.3% |
|
2 |
Cytonn Money Market Fund (Dial *809# or download the Cytonn app) |
15.6% |
|
3 |
Kuza Money Market fund |
14.2% |
|
4 |
Etica Money Market Fund |
14.1% |
|
5 |
Lofty-Corban Money Market Fund |
14.0% |
|
6 |
Arvocap Money Market Fund |
14.0% |
|
7 |
Ndovu Money Market Fund |
13.1% |
|
8 |
Enwealth Money Market Fund |
12.9% |
|
9 |
Orient Kasha Money Market Fund |
12.7% |
|
10 |
Old Mutual Money Market Fund |
12.5% |
|
11 |
British-American Money Market Fund |
12.5% |
|
12 |
Apollo Money Market Fund |
12.4% |
|
13 |
Dry Associates Money Market Fund |
12.3% |
|
14 |
GenAfrica Money Market Fund |
12.2% |
|
15 |
Madison Money Market Fund |
12.0% |
|
16 |
Sanlam Money Market Fund |
11.9% |
|
17 |
Genghis Money Market Fund |
11.9% |
|
18 |
Nabo Africa Money Market Fund |
11.8% |
|
19 |
Faulu Money Market Fund |
11.7% |
|
20 |
Jubilee Money Market Fund |
11.7% |
|
21 |
Co-op Money Market Fund |
11.5% |
|
22 |
ICEA Lion Money Market Fund |
11.3% |
|
23 |
CIC Money Market Fund |
11.2% |
|
24 |
Mali Money Market Fund |
11.1% |
|
25 |
KCB Money Market Fund |
11.0% |
|
26 |
Absa Shilling Money Market Fund |
10.7% |
|
27 |
AA Kenya Shillings Fund |
10.7% |
|
28 |
Mayfair Money Market Fund |
9.7% |
|
29 |
Stanbic Money Market Fund |
8.8% |
|
30 |
Ziidi Money Market Fund |
7.6% |
|
31 |
Equity Money Market Fund |
5.8% |
Source: Business Daily
Liquidity:
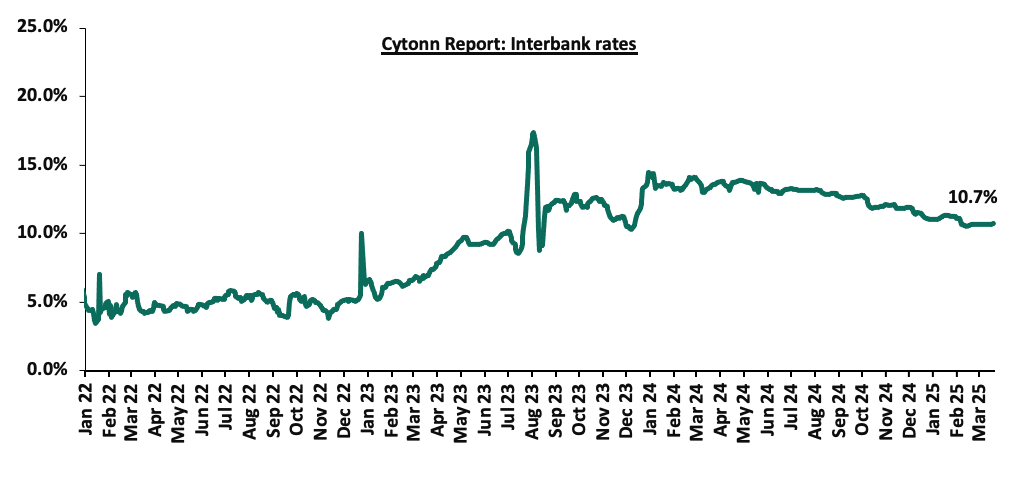
During the week, liquidity in the money markets marginally tightened, with the average interbank rate increasing by 1.3 bps, to remain unchanged from the 10.7% recorded the previous week, partly attributable government payments that were offset by tax remittances. The average interbank volumes traded decreased by 60.4% to Kshs 8.7 bn from Kshs 21.8 bn recorded the previous week. The chart below shows the interbank rates in the market over the years:
Kenya Eurobonds:
During the week, the yields on Kenya’s Eurobonds recorded a mixed performance, with the yield on the13-year issued in 2021 increasing the most by 0.2% to 10.3% from the 10.1% recorded the previous week, while the 7-year Eurobond issued in 2024 decreased the most by 0.2% to 9.7% from the 9.9% recorded the previous week. The table below shows the summary performance of the Kenyan Eurobonds as of 20th March 2025;
|
Cytonn Report: Kenya Eurobonds Performance |
|
||||||
|
|
2018 |
2019 |
2021 |
2024 |
2025 |
||
|
Tenor |
10-year issue |
30-year issue |
7-year issue |
12-year issue |
13-year issue |
7-year issue |
11-year issue |
|
Amount Issued (USD) |
1.0 bn |
1.0 bn |
0.3 bn |
1.2 bn |
1.0 bn |
1.5 bn |
1.5 bn |
|
Years to Maturity |
3.0 |
23.0 |
2.2 |
7.2 |
9.3 |
5.9 |
11.0 |
|
Yields at Issue |
7.3% |
8.3% |
7.0% |
7.9% |
6.2% |
10.4% |
9.9% |
|
02-Jan-25 |
9.1% |
10.3% |
8.5% |
10.1% |
10.1% |
10.1% |
|
|
03-Mar-25 |
8.0% |
10.0% |
7.3% |
9.5% |
9.6% |
9.4% |
|
|
13-Mar-25 |
8.5% |
10.4% |
7.3% |
10.0% |
10.1% |
9.9% |
|
|
14-Mar-25 |
8.5% |
10.4% |
7.3% |
9.9% |
10.4% |
9.9% |
|
|
17-Mar-25 |
8.5% |
10.5% |
7.4% |
10.1% |
10.5% |
10.1% |
|
|
18-Mar-25 |
8.7% |
10.4% |
7.3% |
9.9% |
10.4% |
9.9% |
|
|
19-Mar-25 |
8.5% |
10.3% |
7.3% |
9.9% |
10.3% |
9.9% |
|
|
20-Mar-25 |
8.5% |
10.3% |
7.2% |
9.8% |
10.3% |
9.7% |
|
|
Weekly Change |
0.0% |
(0.1%) |
(0.1%) |
(0.2%) |
0.2% |
(0.2%) |
- |
|
MTD Change |
0.5% |
0.2% |
(0.1%) |
0.3% |
0.6% |
0.3% |
- |
|
YTD Change |
(0.5%) |
(0.0%) |
(1.3%) |
(0.3%) |
0.2% |
(0.4%) |
- |
Source: Central Bank of Kenya (CBK) and National Treasury
Kenya Shilling:
During the week, the Kenyan Shilling appreciated marginally against the US Dollar by 8.6 bps, to Kshs 129.4 from the Kshs 129.5 recorded the previous week. On a year-to-date basis, the shilling has depreciated by 6.8 bps against the dollar, compared to the 17.4% appreciation recorded in 2024.
We expect the shilling to be supported by:
- Diaspora remittances standing at a cumulative USD 4,956.5 mn in the twelve months to February 2025, 14.5% higher than the USD 4,329.7 mn recorded over the same period in 2024. These has continued to cushion the shilling against further depreciation. In the February 2025 diaspora remittances figures, North America remained the largest source of remittances to Kenya accounting for 53.0% in the period,
- The tourism inflow receipts which came in at Kshs 452.2 bn in 2024, a 19.8% increase from Kshs 377.5 bn inflow receipts recorded in 2023, and owing to tourist arrivals that improved by 14.6% to 2,394,376 in 2024 from 2,089,259 in 2023, and,
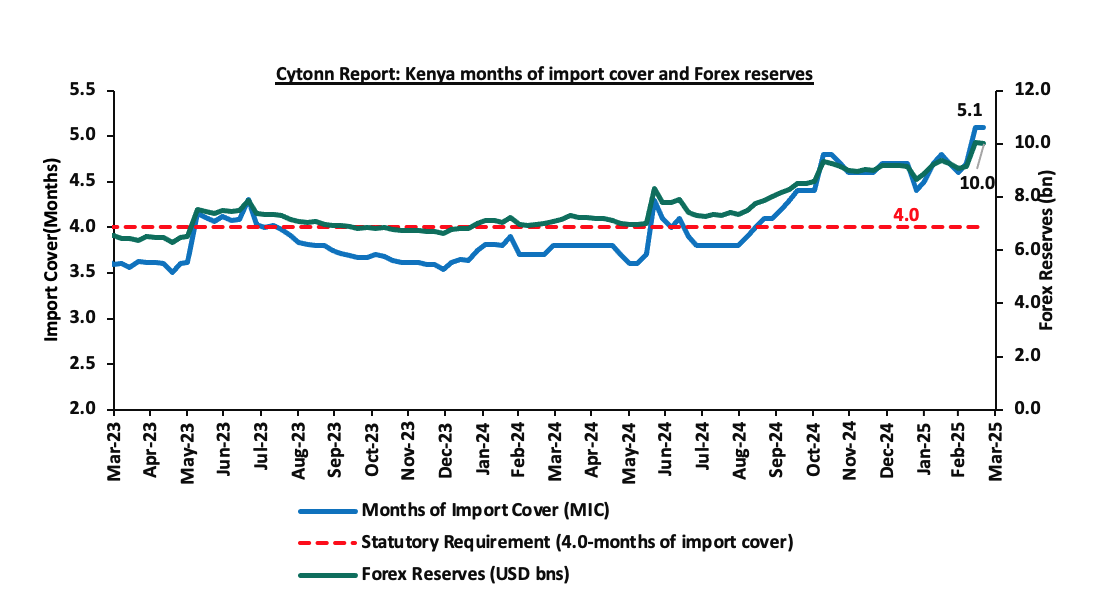
- Improved forex reserves currently at USD 10.0 bn (equivalent to 5.1-months of import cover), which is above the statutory requirement of maintaining at least 4.0-months of import cover and above the EAC region’s convergence criteria of 4.5-months of import cover.
The shilling is however expected to remain under pressure in 2025 as a result of:
- An ever-present current account deficit which came at 4.0% of GDP in Q3’2024, and,
- The need for government debt servicing, continues to put pressure on forex reserves given that 62.1% of Kenya’s external debt is US Dollar-denominated as of September 2024.
Key to note, Kenya’s forex reserves decreased by 0.5% during the week, to USD 10.0 bn from the USD 10.1 bn recorded in the previous week, equivalent to 5.1 months of import cover to remain relatively unchanged from the months of import cover recorded last week, and above the statutory requirement of maintaining at least 4.0-months of import cover.
The chart below summarizes the evolution of Kenya's months of import cover over the years:
Weekly Highlights
- February 2025 Exchequer Release
During the week, the National Treasury gazetted the revenue and net expenditures for the eighth month of FY’2024/2025, ending 28th February 2025, highlighting that the total revenue collected as at the end of February 2025 amounted to Kshs 1,403.7 bn, equivalent to 56.7% of the revised estimates of Kshs 2,475.1 bn for FY’2024/2025 and is 85.1% of the prorated estimates of Kshs 1,650.0 bn. Below is a summary of the performance:
|
FY'2024/2025 Budget Outturn - As at 28th February 2025 |
||||||
|
Amounts in Kshs Billions unless stated otherwise |
||||||
|
Item |
12-months Original Estimates |
Revised Estimates |
Actual Receipts/Release |
Percentage Achieved of the Revised Estimates |
Prorated |
% achieved of the Prorated |
|
Opening Balance |
|
|
1.2 |
|
|
|
|
Tax Revenue |
2,745.2 |
2,475.1 |
1,403.7 |
56.7% |
1,650.0 |
85.1% |
|
Non-Tax Revenue |
172.0 |
156.4 |
113.5 |
72.6% |
104.2 |
108.9% |
|
Total Revenue |
2,917.2 |
2,631.4 |
1,518.3 |
57.7% |
1,754.3 |
86.6% |
|
External Loans & Grants |
571.2 |
593.5 |
120.5 |
20.3% |
395.7 |
30.5% |
|
Domestic Borrowings |
828.4 |
978.3 |
675.1 |
69.0% |
652.2 |
103.5% |
|
Other Domestic Financing |
4.7 |
4.7 |
4.4 |
94.8% |
3.1 |
142.2% |
|
Total Financing |
1,404.3 |
1,576.5 |
800.0 |
50.7% |
1,051.0 |
76.1% |
|
Recurrent Exchequer issues |
1,348.4 |
1,307.9 |
859.8 |
65.7% |
872.0 |
98.6% |
|
CFS Exchequer Issues |
2,114.1 |
2,137.8 |
1,059.2 |
49.5% |
1,425.2 |
74.3% |
|
Development Expenditure & Net Lending |
458.9 |
351.3 |
156.1 |
44.4% |
234.2 |
66.7% |
|
County Governments + Contingencies |
400.1 |
410.8 |
240.9 |
58.6% |
273.9 |
88.0% |
|
Total Expenditure |
4,321.5 |
4,207.9 |
2,316.1 |
55.0% |
2,805.3 |
82.6% |
|
Fiscal Deficit excluding Grants |
1,404.3 |
1,576.5 |
797.7 |
50.6% |
1,051.0 |
75.9% |
|
Total Borrowing |
1,399.6 |
1,571.8 |
795.6 |
50.6% |
1,047.9 |
75.9% |
Amounts in Kshs bn unless stated otherwise
The Key take-outs from the release include;
- Total revenue collected as at the end of February 2025 amounted to Kshs 1,403.7 bn, equivalent to 56.7% of the revised estimates of Kshs 2,475.1 bn for FY’2024/2025 and is 85.1% of the prorated estimates of Kshs 1,650.0 bn. Cumulatively, tax revenues amounted to Kshs 1,518.3 bn, equivalent to 57.7% of the revised estimates of Kshs 2,631.4 bn and 86.6% of the prorated estimates of Kshs 1,754.3 bn,
- Total financing amounted to Kshs 800.0 bn, equivalent to 50.7% of the revised estimates of Kshs 1,576.5 bn and is equivalent to 76.1% of the prorated estimates of Kshs 1,051.0 bn. Additionally, domestic borrowing amounted to Kshs 675.1 bn, equivalent to 69.0% of the revised estimates of Kshs 978.3 bn and is 103.5% of the prorated estimates of Kshs 652.2 bn,
- The total expenditure amounted to Kshs 2,316.1 bn, equivalent to 55.0% of the revised estimates of Kshs 4,207.9 bn, and is 82.6% of the prorated target expenditure estimates of Kshs 2,805.3 bn. Additionally, the net disbursements to recurrent expenditures came in at Kshs 859.8 bn, equivalent to 65.7% of the revised estimates of Kshs 1,307.9 and 98.6% of the prorated estimates of Kshs 872.0 bn,
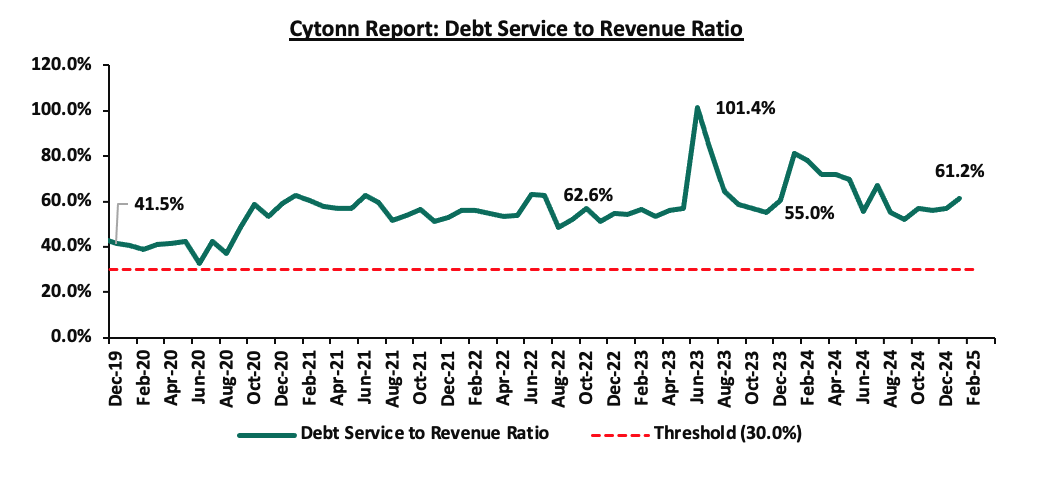
- Consolidated Fund Services (CFS) Exchequer issues came in at Kshs 1,059.2 bn, equivalent to 49.5% of the revised estimates of Kshs 2,137.8 bn, and are 74.3% of the prorated amount of Kshs 1,425.2 bn. The cumulative public debt servicing cost amounted to Kshs 928.9 bn which is 48.6% of the revised estimates of Kshs 1,910.5 bn, and is 72.9% of the prorated estimates of Kshs 1,273.7 bn. Additionally, the Kshs 928.9 bn debt servicing cost is equivalent to 61.2% of the actual cumulative revenues collected as at the end of February 2025. The chart below shows the debt servicing cost to revenue ratio over the period;
- Total Borrowings as at the end of February 2025 amounted to Kshs 795.6 bn, equivalent to 50.6% of the revised estimates of Kshs 1,571.8 bn for FY’2024/2025 and are 75.9% of the prorated estimates of Kshs 1,047.9 bn. The cumulative domestic borrowing of Kshs 978.3 bn comprises of Net Domestic Borrowing Kshs 408.4 bn and Internal Debt Redemptions (Rollovers) Kshs 569.9 bn.
The government missed its prorated revenue targets for the eighth consecutive month in FY’2024/2025, achieving only 85.1% of the revenue targets in February 2025. This shortfall is largely due to the challenging business environment experienced in previous months, exacerbated by high taxes and an elevated cost of living. Despite an improvement in the business climate, inflationary pressures persist, with year-on-year inflation for February 2025 rising by 0.2 percentage points to 3.5%, up from 3.3% in January 2025. However, the cost of credit has declined, providing some relief to businesses and households. The improved business environment is reflected in the Purchasing Managers’ Index (PMI), which increased marginally to 50.6 in February from 50.5 in January 2025. While efforts to enhance revenue collection, such as broadening the tax base, curbing tax evasion, and suspending tax relief payments, are yet to yield full benefits, future revenue performance will depend on how quickly private sector activity gains momentum. This is expected to be supported by a stable Shilling, lower borrowing costs, and continued efforts to enhance economic growth. The reduction in the Central Bank Rate (CBR) by 50 basis points to 10.75% from 11.25%, following the Monetary Policy Committee’s (MPC) meeting on February 5th, 2025, is expected to further ease credit conditions and support private sector expansion.
Rates in the Fixed Income market have been on a downward trend due to high liquidity in the money markets, enabling the government to front load most of its borrowing. The government is 70.7% ahead of its prorated net domestic borrowing target of Kshs 433.9 bn, and 24.8% ahead of the total FY’2024/25 net domestic borrowing target of Kshs 593.7 bn, having a net borrowing position of Kshs 740.7 bn (inclusive of T-bills). However, we expect a continued downward readjustment of the yield curve in the short and medium term, with the government looking to increase its external borrowing to maintain the fiscal surplus, hence alleviating pressure in the domestic market. As such, we expect the yield curve to stabilize in the short to medium-term and hence investors are expected to shift towards the long-term papers to lock in the high returns
Market Performance
During the week, the equities market was on an upward trajectory, with NASI gaining the most by 0.5%, while NSE 20, NSE 25 and NSE 10 gained by 0.4%, 0.2% and 0.1% respectively, taking the YTD performance to gains of 9.1%, 3.9%, 2.2% and 0.6% for NSE 20, NASI, NSE 25 and NSE 10, respectively. The equities market performance was driven by gains recorded by large-cap stocks such as Standard Chartered, Cooperative Bank and NCBA of 12.3%, 6.0%, and 1.0% respectively, the performance was however weighed down by losses recorded by large cap stocks such as Equity bank, Absa Bank and KCB group of 2.0%, 1.3% and 0.4% respectively;
During the week, equities turnover increased by 14.0% to USD 17.7 mn, from USD 15.5 mn recorded the previous week, taking the YTD total turnover to USD 192.4 mn. Foreign investors remained net sellers for the fourth consecutive week, with a net selling position of USD 1.2 mn, from a net selling position of USD 0.6 mn recorded the previous week, taking the YTD foreign net selling position to USD 24.5 mn, compared to a net selling position of USD 16.9 mn in 2024,
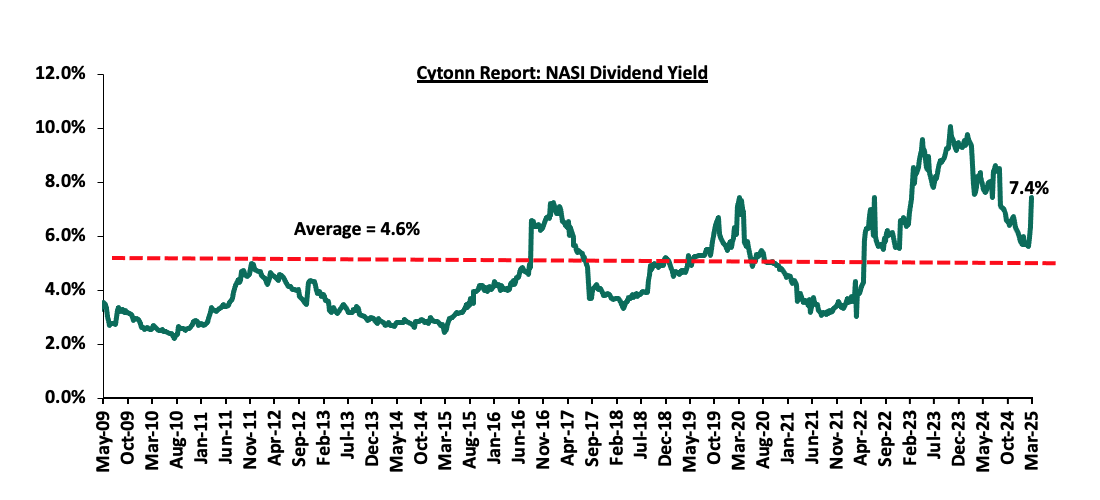
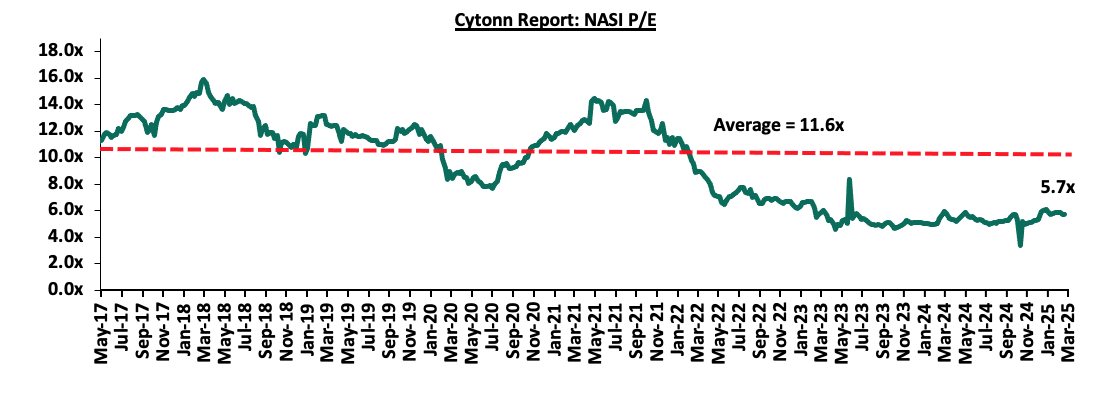
The market is currently trading at a price-to-earnings ratio (P/E) of 5.7x, 50.9% below the historical average of 11.6x. The dividend yield stands at 7.4%, 2.8% points above the historical average of 4.6%. Key to note, NASI’s PEG ratio currently stands at 0.7x, an indication that the market is undervalued relative to its future growth. A PEG ratio greater than 1.0x indicates the market is overvalued while a PEG ratio less than 1.0x indicates that the market is undervalued. The charts below indicate the historical P/E and dividend yields of the market;
Universe of Coverage:
|
Cytonn Report: Equities Universe of Coverage |
||||||||||
|
Company |
Price as at 14/03/2025 |
Price as at 21/03/2025 |
w/w change |
YTD Change |
Year Open 2025 |
Target Price* |
Dividend Yield |
Upside/ Downside** |
P/TBv Multiple |
Recommendation |
|
Equity Group*** |
47.6 |
46.7 |
(2.0%) |
(2.8%) |
48.0 |
60.2 |
8.6% |
37.6% |
0.9x |
Buy |
|
ABSA Bank |
19.1 |
18.8 |
(1.3%) |
(0.3%) |
18.9 |
24.2 |
8.2% |
37.0% |
1.5x |
Buy |
|
Co-op Bank |
15.1 |
16.0 |
6.0% |
(8.6%) |
17.5 |
20.3 |
9.4% |
36.6% |
0.7x |
Buy |
|
Jubilee Holdings*** |
225.3 |
216.3 |
(4.0%) |
23.7% |
174.8 |
260.7 |
6.6% |
27.1% |
0.3x |
Buy |
|
KCB Group |
42.2 |
42.0 |
(0.4%) |
(0.9%) |
42.4 |
50.4 |
7.1% |
27.1% |
0.6x |
Buy |
|
Stanbic Holdings |
160.5 |
160.0 |
(0.3%) |
14.5% |
139.8 |
171.2 |
13.0% |
20.0% |
1.0x |
Accumulate |
|
Standard Chartered Bank |
270.8 |
304.0 |
12.3% |
6.6% |
285.3 |
328.6 |
9.5% |
17.6% |
2.0x |
Accumulate |
|
CIC Group*** |
2.9 |
2.9 |
(2.4%) |
33.2% |
2.1 |
3.1 |
4.6% |
13.3% |
0.9x |
Accumulate |
|
NCBA*** |
51.8 |
52.3 |
1.0% |
2.5% |
51.0 |
53.2 |
9.1% |
10.9% |
1.0x |
Accumulate |
|
Diamond Trust Bank*** |
79.3 |
79.8 |
0.6% |
19.5% |
66.8 |
78.1 |
6.3% |
4.2% |
0.3x |
Lighten |
|
I&M Group*** |
35.1 |
35.0 |
(0.3%) |
(2.9%) |
36.0 |
32.3 |
7.3% |
(0.3%) |
0.7x |
Sell |
|
Britam*** |
7.7 |
7.7 |
(1.5%) |
31.6% |
5.8 |
7.5 |
0.0% |
(2.1%) |
1.1x |
Sell |
|
*Target Price as per Cytonn Analyst estimates **Upside/ (Downside) is adjusted for Dividend Yield ***Dividend Yield is calculated using FY’2023 Dividends |
||||||||||
Weekly Highlights
- Standard Chartered Bank Kenya FY’2024 results
During the week, Standard Chartered Kenya released their FY’2024 financial results. Below is a summary of the performance
|
Balance Sheet Items |
FY’2023 |
FY’2024 |
y/y change |
|
Net loans |
163.2 |
151.6 |
(7.1%) |
|
Government Securities |
69.6 |
93.7 |
34.7% |
|
Total Assets |
429.0 |
384.6 |
(10.3%) |
|
Customer Deposits |
342.9 |
295.7 |
(13.8%) |
|
Deposits per Branch |
9.5 |
9.2 |
(3.0%) |
|
Total Liabilities |
367.4 |
312.8 |
(14.9%) |
|
Shareholder's Funds |
61.5 |
71.8 |
16.6% |
|
Balance Sheet Ratios |
FY’2023 |
FY’2024 |
% points change |
|
Loan to deposit ratio |
47.6% |
51.3% |
3.7% |
|
Government securities to deposit ratio |
20.3% |
31.7% |
11.4% |
|
Return on Average Equity |
23.5% |
30.1% |
6.6% |
|
Return on Average Assets |
3.4% |
4.9% |
1.5% |
|
Income Statement |
FY’2023 |
FY’2024 |
y/y change |
|
Net Interest Income |
29.3 |
33.3 |
13.4% |
|
Net non-Interest Income |
12.4 |
17.4 |
40.4% |
|
Total Operating income |
41.7 |
50.7 |
21.4% |
|
Loan Loss provision |
3.4 |
2.4 |
(29.6%) |
|
Total Operating expenses |
22.1 |
22.5 |
1.9% |
|
Profit before tax |
19.7 |
28.2 |
43.4% |
|
Profit after tax |
13.8 |
20.1 |
45.0% |
|
Core EPS (Kshs) |
36.6 |
53.1 |
45.0% |
|
Dividend Per Share (Kshs) |
29.0 |
45.0 |
55.2% |
|
Dividend Yield |
15.6% |
14.8% |
(5.2%) |
|
Dividend Payout Ratio |
79.2% |
84.8% |
7.0% |
|
Income Statement Ratios |
FY’2023 |
FY’2024 |
% points change |
|
Yield from interest-earning assets |
9.1% |
11.2% |
2.0% |
|
Cost of funding |
1.0% |
1.7% |
0.7% |
|
Net Interest Spread |
8.2% |
9.5% |
1.3% |
|
Net Interest Margin |
8.3% |
9.6% |
1.3% |
|
Cost of Risk |
8.1% |
4.7% |
(3.4%) |
|
Net Interest Income as % of operating income |
70.3% |
65.6% |
(4.6%) |
|
Non-Funded Income as a % of operating income |
29.7% |
34.4% |
4.6% |
|
Cost to Income Ratio |
52.9% |
44.3% |
(8.5%) |
|
Cost to Income Ratio without LLP |
44.8% |
39.6% |
(5.1%) |
|
Capital Adequacy Ratios |
FY’2023 |
FY’2024 |
% points change |
|
Core Capital/Total Liabilities |
14.9% |
18.3% |
3.4% |
|
Minimum Statutory ratio |
8.0% |
8.0% |
|
|
Excess |
6.9% |
10.3% |
3.4% |
|
Core Capital/Total Risk Weighted Assets |
17.8% |
19.5% |
1.7% |
|
Minimum Statutory ratio |
10.5% |
10.5% |
0.0% |
|
Excess |
7.3% |
9.0% |
1.7% |
|
Total Capital/Total Risk Weighted Assets |
17.8% |
19.6% |
1.7% |
|
Minimum Statutory ratio |
14.5% |
14.5% |
|
|
Excess |
3.3% |
5.1% |
1.7% |
|
Liquidity Ratio |
66.3% |
67.6% |
1.3% |
|
Minimum Statutory ratio |
20.0% |
20.0% |
|
|
Excess |
46.3% |
47.6% |
1.3% |
Key Take-Outs:
- Strong earnings growth - Core earnings per share increased by 45.0% to Kshs 53.1, from Kshs 36.6 in FY’2023, mainly driven by the 21.4% increase in total operating income to Kshs 50.7 bn, from Kshs 41.7 bn in FY’2023 which outpaced the 1.9% increase in total operating expenses to Kshs 22.5 bn, from Kshs 22.1 bn in FY’2023. The notable 40.4% increase in net non-interest income to Kshs 17.4 bn from Kshs 12.4 bn in FY’2023 was mainly driven by a 13.8% increase in income from other fees and commissions to Kshs 6.4 bn from Kshs 5.7 bn in FY’2023.
- Improved asset quality – The bank’s Asset Quality improved, with Gross NPL ratio decreasing to 7.4% in FY’2024, from 9.7% in FY’2023, attributable to the 30.3% decrease in gross non-performing loans to Kshs 12.0 bn, from Kshs 17.2 bn in FY’2023, relative to the slower 8.9% decrease in gross loans to Kshs 161.5 bn, from Kshs 177.2 bn recorded in FY’2023
- Decreased Lending – The bank’s loan book decreased by 7.1% to Kshs 151.6 bn, from Kshs 163.2 bn in FY’2023, and,
- Declaration of dividends – The Board of Directors recommended a final dividend of Kshs 29.0 per share for FY’2024, in addition to the interim dividend of Kshs 16.0 during the year, bringing the total dividend to Kshs 45.0 per share compared to Kshs 29.0 per share FY’2023. This translates to a dividend payout ratio of 84.8% and a dividend yield of 14.8% as of 21st March 2025, compared to a dividend payout ratio of 79.2% and a dividend yield of 15.6% in a similar period for FY’2023.
For a more detailed analysis, please see the Standard Chartered Banks ’s FY’2024 Earnings Note
- Co-operative Bank FY’2024 financial results
During the week, Co-operative bank released their FY’2024 financial results. Below is a summary of the performance
|
Balance Sheet Items |
FY'2023 |
FY'2024 |
y/y change |
|
Government Securities |
189.0 |
217.6 |
15.1% |
|
Net Loans and Advances |
374.2 |
373.7 |
(0.1%) |
|
Total Assets |
671.1 |
743.2 |
10.7% |
|
Customer Deposits |
451.6 |
506.1 |
12.1% |
|
Deposits per branch |
2.4 |
2.5 |
3.3% |
|
Total Liabilities |
557.5 |
597.6 |
7.2% |
|
Shareholders’ Funds |
113.6 |
145.4 |
28.0% |
|
Balance Sheet Ratios |
FY'2023 |
FY'2024 |
y/y change |
|
Loan to Deposit Ratio |
82.9% |
73.8% |
(9.0%) |
|
Government Securities to Deposits Ratio |
41.9% |
43.0% |
1.1% |
|
Return on average equity |
21.0% |
19.7% |
(1.3%) |
|
Return on average assets |
3.6% |
3.6% |
(0.0%) |
|
Income Statement |
FY'2023 |
FY'2024 |
y/y change |
|
Net Interest Income |
45.2 |
51.5 |
13.9% |
|
Non-Interest Income |
26.5 |
29.1 |
10.1% |
|
Total Operating income |
71.7 |
80.6 |
12.5% |
|
Loan Loss provision |
(6.0) |
(8.7) |
44.2% |
|
Total Operating expenses |
(39.7) |
(46.7) |
17.7% |
|
Profit before tax |
32.4 |
34.8 |
7.5% |
|
Profit after tax |
23.2 |
25.5 |
9.8% |
|
Core EPS |
4.0 |
4.3 |
9.8% |
|
Dividend per Share |
1.5 |
1.5 |
0.0% |
|
Dividend Payout Ratio |
38.3% |
34.6% |
(9.5%) |
|
Dividend Yield |
13.3% |
9.4% |
(29.2%) |
|
Income Statement Ratios |
FY'2023 |
FY'2024 |
Y/Y Change |
|
Yield from interest-earning assets |
12.4% |
13.9% |
1.5% |
|
Cost of funding |
4.8% |
6.4% |
1.6% |
|
Net Interest Spread |
7.6% |
7.6% |
(0.1%) |
|
Net Interest Income as % of operating income |
63.1% |
63.9% |
0.8% |
|
Non-Funded Income as a % of operating income |
36.9% |
36.1% |
(0.8%) |
|
Cost to Income |
55.3% |
57.9% |
2.6% |
|
CIR without provisions |
47.0% |
47.2% |
0.2% |
|
Cost to Assets |
5.0% |
5.1% |
0.1% |
|
Net Interest Margin |
8.1% |
8.3% |
0.2% |
|
Capital Adequacy Ratios |
FY'2023 |
FY'2024 |
% points change |
|
Core Capital/Total deposit Liabilities |
23.4% |
24.2% |
0.8% |
|
Minimum Statutory ratio |
8.0% |
8.0% |
|
|
Excess |
15.4% |
16.2% |
0.8% |
|
Core Capital/Total Risk Weighted Assets |
18.2% |
18.3% |
0.1% |
|
Minimum Statutory ratio |
10.5% |
10.5% |
|
|
Excess |
7.7% |
7.8% |
0.1% |
|
Total Capital/Total Risk Weighted Assets |
22.5% |
21.2% |
(1.3%) |
|
Minimum Statutory ratio |
14.5% |
14.5% |
|
|
Excess |
8.0% |
6.7% |
(1.3%) |
|
Liquidity Ratio |
52.0% |
59.9% |
7.9% |
|
Minimum Statutory ratio |
20.0% |
20.0% |
|
|
Excess |
32.0% |
39.9% |
7.9% |
Key Take-Outs:
- Increased earnings - Core earnings per share (EPS) grew by 9.8% to Kshs 4.3, from Kshs 4.0 in FY’2023, driven by the 12.5% increase in total operating income to Kshs 80.6 bn, from Kshs 71.7 bn in FY’2023.However the performance was weighed down by a 17.7% increase in total operating expenses to Kshs 46.7 bn from Kshs 39.7 bn in FY 2023
- Deteriorated asset quality –The bank’s Asset Quality deteriorated, with Gross NPL ratio increasing to 17.0% in FY’2024, from 16.2% in FY’2023, attributable to a 6.2% increase in Gross non-performing loans to Kshs 71.1 bn, from Kshs 66.9 bn in FY’2023, relative to the 1.6% increase in gross loans to Kshs 419.2 bn, from Kshs 412.5 bn recorded in FY’2023
- Expanded Balanced sheet - The balance sheet recorded an expansion as total assets increased by 10.7% to Kshs 743.2 bn, from Kshs 671.1 bn in FY’2023, mainly driven by a 15.1% increase in governments securities holdings to Kshs 217.6 bn, from 189.0 bn in FY’2023, Notably Net loans and advances declined by 0.1% to Kshs 373.7 bn, from Kshs 374.2 bn in FY’2023.
- Declaration of dividends - The Board of Directors recommended a final dividend of Kshs 1.5 for FY’ 2024, unchanged from FY’2023. The Dividend yield and Payout ratio decreased to 9.3% and 34.6% respectively from 13.3% and 38.3% respectively in FY’ 2023, and,
- Reduced lending- Customer net loans and advances decreased by 0.1% to Kshs 373.7 bn in FY’2024, from Kshs 374.2 bn in FY’2023 attributed to increased credit risk with high NPLs in the industry, with the lender preferring to limit customer lending.
For a more detailed analysis, please see the Co-operative Bank’s FY’2024 Earnings Note
- Absa Bank Kenya released its FY’2024 financial results
During the week, Absa Bank Kenya released their FY’2024 financial results. Below is a summary of the performance
|
Balance Sheet Items |
FY’2023 |
FY’2024 |
y/y change |
|
Government Securities |
95.2 |
130.6 |
37.2% |
|
Net Loans and Advances |
335.7 |
309.1 |
(7.9%) |
|
Total Assets |
519.8 |
506.5 |
(2.6%) |
|
Customer Deposits |
362.7 |
367.1 |
1.2% |
|
Deposit per Branch |
4.8 |
4.3 |
(9.5%) |
|
Total Liabilities |
450.6 |
421.3 |
(6.5%) |
|
Shareholder's Funds |
69.2 |
85.2 |
23.1% |
|
Balance Sheet Ratios |
FY’2023 |
FY’2024 |
% points change |
|
Loan to Deposit Ratio |
92.5% |
84.2% |
(8.4%) |
|
Govt Securities to Deposit ratio |
26.2% |
35.6% |
9.3% |
|
Return on average equity |
24.6% |
27.0% |
2.4% |
|
Return on average assets |
3.3% |
4.1% |
0.8% |
|
Income Statement |
FY’2023 |
FY’2024 |
y/y change |
|
Net Interest Income |
40.0 |
46.2 |
15.4% |
|
Net non-Interest Income |
14.5 |
16.1 |
10.8% |
|
Total Operating income |
54.6 |
62.3 |
14.2% |
|
Loan Loss provision |
(9.2) |
(9.1) |
(1.6%) |
|
Total Operating expenses |
(30.9) |
(32.6) |
5.5% |
|
Profit before tax |
23.7 |
29.7 |
25.5% |
|
Profit after tax |
16.4 |
20.9 |
27.5% |
|
Core EPS |
3.0 |
3.8 |
27.5% |
|
Dividend per Share |
1.55 |
1.75 |
12.9% |
|
Dividend Yield |
11.3% |
9.3% |
(17.4%) |
|
Dividend Payout Ratio |
51.4% |
45.5% |
(11.5%) |
|
Income Statement Ratios |
FY’2023 |
FY’2024 |
% points change |
|
Yield from interest-earning assets |
12.7% |
14.6% |
1.9% |
|
Cost of funding |
4.1% |
4.8% |
0.7% |
|
Net Interest Spread |
3.8% |
4.9% |
1.1% |
|
Net Interest Margin |
9.4% |
10.4% |
1.0% |
|
Cost of Risk |
16.9% |
14.6% |
(2.3%) |
|
Net Interest Income as % of operating income |
73.4% |
74.2% |
0.8% |
|
Non-Funded Income as a % of operating income |
26.6% |
25.8% |
(0.8%) |
|
Cost to Income |
56.6% |
52.3% |
(4.3%) |
|
Cost to Income (Without LLPs) |
39.7% |
37.7% |
(2.0%) |
|
Capital Adequacy Ratios |
FY’2023 |
FY’2024 |
% points change |
|
Core Capital/Total Liabilities |
16.7% |
19.9% |
3.2% |
|
Minimum Statutory ratio |
8.0% |
8.0% |
0.0% |
|
Excess |
8.7% |
11.9% |
3.2% |
|
Core Capital/Total Risk Weighted Assets |
13.6% |
17.0% |
3.4% |
|
Minimum Statutory ratio |
10.5% |
10.5% |
0.0% |
|
Excess |
3.1% |
6.5% |
3.4% |
|
Total Capital/Total Risk Weighted Assets |
18.1% |
20.7% |
2.6% |
|
Minimum Statutory ratio |
14.5% |
14.5% |
0.0% |
|
Excess |
3.6% |
6.2% |
2.6% |
|
Liquidity Ratio |
31.1% |
42.5% |
11.4% |
|
Minimum Statutory ratio |
20.0% |
20.0% |
0.0% |
|
Excess |
11.1% |
22.5% |
11.4% |
Key Take-Outs:
- Increased earnings - Core earnings per share increased by 27.5% to Kshs 3.8, from Kshs 3.0 in FY’2023, mainly driven by the 14.2% increase in total operating income to Kshs 46.2 bn, from Kshs 40.0 bn in FY’2023 which outpaced the 5.5% increase in total operating expenses to Kshs 32.6 bn, from Kshs 30.9 bn in FY’2023.
- Declined asset quality – The bank’s Asset Quality deteriorated, with Gross NPL ratio increasing to 12.6% in FY’2024, from 9.9% in FY’2023, attributable to the 20.1% increase in gross non-performing loans to Kshs 42.5 bn, from Kshs 35.4 bn in FY’2023, relative to the 6.1% decrease in gross loans to Kshs 337.1 bn, from Kshs 358.9 bn recorded in FY’2023.
- Decreased Lending – The bank’s loan book recorded a contraction of 7.9% to Kshs 309.1 bn, from Kshs 335.7 bn in FY’2023.
- Declaration of dividends - The Board of Directors recommended a final dividend of Kshs 1.55 per share for FY’2024, in addition to the interim dividend of Kshs 0.2 during the year, bringing the total dividend to Kshs 1.75 per share compared to Kshs 1.55 per share FY’2023. This translates to a dividend payout ratio of 45.5% and a dividend yield of 9.3% as of 21st March 2025, compared to a dividend payout ratio of 51.4% and a dividend yield of 11.3% in a similar period for FY’2023.
For a more detailed analysis, please see the Absa Bank’s FY’2024 Earnings Note
Asset Quality:
The table below shows the asset quality of listed banks that have released their FY’2024 results using several metrics:
|
Cytonn Report: Listed Banks Asset Quality in FY’2024 |
||||||
|
|
FY'2024 NPL Ratio* |
FY'2023 NPL Ratio** |
% point change in NPL Ratio |
FY'2024 NPL Coverage* |
FY’2023 NPL Coverage** |
% point change in NPL Coverage |
|
Stanbic Bank |
9.1% |
9.5% |
(0.4%) |
78.4% |
70.4% |
8.0% |
|
KCB Group |
19.8% |
17.0% |
2.8% |
65.1% |
62.5% |
2.6% |
|
Standard Chartered Bank |
7.4% |
9.7% |
(2.3%) |
81.8% |
81.6% |
0.3% |
|
Co-operative Bank of Kenya |
17.0% |
16.2% |
0.7% |
63.9% |
57.2% |
6.8% |
|
Absa Bank Kenya |
12.6% |
9.9% |
2.7% |
66.0% |
65.6% |
0.4% |
|
Mkt Weighted Average* |
13.7% |
13.1% |
0.6% |
70.5% |
62.0% |
8.5% |
|
*Market cap weighted as at 14/03/2025 |
||||||
|
**Market cap weighted as at 18/04/2024 |
||||||
Key take-outs from the table include;
- Asset quality for the listed banks that have released results declined during FY’2024, with market-weighted average NPL ratio increasing by 0.6% points to 13.7% from 13.1% in FY’2023 largely due to KCB’s and Co-operative numbers, and,
- Market-weighted average NPL Coverage for the five listed banks increased by 8.5% points to 70.5% in FY’2024 from 62.0% recorded in FY’2023. The increase was attributable to Stanbic Bank’s coverage ratio increasing by 8.0% points to 78.4% from 70.4% in FY’2023, coupled with Co-operative Bank and KCB Group’s NPL coverage ratio increasing by 6.8% and 2.6% points respectively to 63.9% and 65.1% from 57.2% and 62.5% respectively in FY’2023.
Summary Performance
The table below shows the performance of listed banks that have released their FY’2024 results using several metrics:
|
Cytonn Report: Listed Banks Performance in FY’2024 |
||||||||||||||
|
Bank |
Core EPS Growth |
Interest Income Growth |
Interest Expense Growth |
Net Interest Income Growth |
Net Interest Margin |
Non-Funded Income Growth |
NFI to Total Operating Income |
Growth in Total Fees & Commissions |
Deposit Growth |
Growth in Government Securities |
Loan to Deposit Ratio |
Loan Growth |
Return on Average Equity |
|
|
KCB Group |
64.9% |
26.9% |
25.0% |
28.0% |
7.8% |
16.6% |
33.0% |
0.9% |
(18.3%) |
(13.2%) |
71.7% |
(9.6%) |
24.6% |
|
|
Standard Chartered Bank |
45.0% |
20.0% |
83.4% |
13.4% |
9.6% |
40.4% |
34.4% |
11.9% |
(13.8%) |
34.7% |
51.3% |
(7.1%) |
30.1% |
|
|
Absa Bank Kenya |
27.5% |
15.4% |
30.1% |
15.4% |
10.5% |
10.8% |
25.8% |
27.5% |
1.2% |
30.0% |
84.2% |
(7.9%) |
27.0% |
|
|
Stanbic Holdings |
12 .8% |
37.8% |
105.7% |
(5.1%) |
5.9% |
(1.7%) |
38.8% |
(13.1%) |
(2.8%) |
70.6% |
71.6% |
(11.6%) |
19.1% |
|
|
Co-operative Bank of Kenya |
9.8% |
24.9% |
45.7% |
13.9% |
8.4% |
24.5% |
36.1% |
3.2% |
12.1% |
15.1% |
73.8% |
(0.1%) |
19.7% |
|
|
FY'24 Mkt Weighted Average* |
36.3% |
24.0% |
53.1% |
15.5% |
8.6% |
20.0% |
33.2% |
7.4% |
(5.9%) |
21.9% |
69.9% |
(7.2%) |
24.7% |
|
|
FY'23 Mkt Weighted Average** |
11.4% |
30.5% |
52.4% |
20.6% |
7.5% |
16.4% |
37.0% |
25.0% |
2.2% |
69.0% |
21.2% |
9.5% |
38.3% |
|
|
*Market cap weighted as at 14/03/2025 |
||||||||||||||
|
**Market cap weighted as at 18/04/2024 |
||||||||||||||
Key take-outs from the table include:
- The listed banks that have released their FY’2024 results recorded a 36.3% growth in core Earnings per Share (EPS) in FY2024, compared to the weighted average growth of 11.4% in FY’2023, an indication of improved performance attributable to the improved operating environment experienced during FY’2024,
- Interest income recorded a weighted average growth of 24.0% in FY’2024, compared to 30.5% in FY’2023. Similarly, interest expenses recorded a market-weighted average growth of 53.1% in FY’2024 compared to a growth of 52.4% in FY’2023,
- The Banks’ net interest income recorded a weighted average growth of 15.5% in FY’2024, a decline from the 20.6% growth recorded over a similar period in 2023, while the non-funded income grew by 20.0% in FY’2024 faster than the 16.4% growth recorded in FY’2023 due the revenue diversification strategies implemented by most banks, and,
- The Banks recorded a weighted average deposit decline of 5.9%, compared to the market-weighted average deposit growth of 2.2% in FY’2023.
We are “Bullish” on the Equities markets in the short term due to current cheap valuations, lower yields on short-term government papers and expected global and local economic recovery, and, “Neutral” in the long term due to persistent foreign investor outflows. With the market currently trading at a discount to its future growth (PEG Ratio at 0.7x), we believe that investors should reposition towards value stocks with strong earnings growth and that are trading at discounts to their intrinsic value. We expect the current high foreign investors sell-offs to continue weighing down the economic outlook in the short term.
- Hospitality Sector
During the week, Radisson Blu Arboretum Hotel in Nairobi announced a Kshs 1.4 bn renovation plan to upgrade its facilities and enhance guest experiences. The refurbishment will focus on modernizing guest rooms, meeting spaces, dining areas, and recreational facilities to align with contemporary hospitality standards. This initiative underscores Radisson Hotel Group's commitment to maintaining its competitive edge in Nairobi's burgeoning hospitality sector. The expansion will feature two basement floors, two lower ground levels, a ground floor, and three upper floors, adding 80 guest rooms, indoor and outdoor restaurants, four ballrooms, four exhibition spaces, four meeting rooms, four board rooms, a multipurpose hall, gym, spa, changing rooms, 328 parking spaces, and more. The renovation is estimated to take approximately 3 years.
The planned upgrade is expected to boost the hotel's appeal to both business and leisure travelers, offering state-of-the-art amenities and services. By investing in these enhancements, Radisson Blu aims to strengthen its position in the market and attract a diverse clientele seeking quality accommodations in Nairobi. The upgrade aims to provide more affordable, modern, and accessible accommodation and conference facilities for local and international guests, tapping into the growing tourism sector.
In 2024, Kenya received 2.4 mn international visitors, a 15.0% growth from the previous year, with inbound tourism revenue increasing from Kshs 377.5 bn in 2023 to Ksh 452.2 bn, a 19.8% growth. Additionally, Kenya's hospitality sector has experienced notable growth, with domestic bed occupancy rising by 12.0%, from Kshs 4.6 mn in 2023 to 5.1 mn in 2024. This increase reflects a robust recovery in domestic tourism, likely driven by improved economic conditions and effective marketing strategies promoting local travel. In response to this heightened demand, the industry is set to expand significantly, with 31 new hotels planned, adding a total of 4,268 rooms to the market.
This expansion indicates strong investor confidence in Kenya's tourism sector and is expected to enhance the country's capacity to accommodate both domestic and international tourists. The additional rooms will likely alleviate pressure during peak seasons, improve service delivery, and potentially lead to more competitive pricing. However, this growth also presents challenges, such as the need for adequate infrastructure development, workforce training, and sustainable practices to ensure the long-term viability of the tourism industry.
We expect this development to reflect a positive trend in Nairobi's real estate sector, signaling renewed investor confidence and a focus on quality improvements. Such investments are anticipated to stimulate further growth in the hospitality industry and contribute to the overall economic development of the region.
- Industrial Sector
During the week, Centum Real Estate, a subsidiary of Centum Investment Company, signed a deal with Pan-African developer ARISE to jointly establish a Kshs 388.2 bn industrial park within the Vipingo Special Economic Zone (SEZ) in kilifi town starting within the next quarter. The development will sit on a 2,000-acre Vipingo SEZ land and the business park will have manufacturing and logistic hubs potentially creating 500,000 jobs.
The Vipingo Model City offers a diverse array of investment opportunities, including residential homes, fully serviced residential and industrial plots, as well as prospects in commercial, hospitality, and institutional sectors. Notable residential projects within the development include Awali Estate Phases 1 & 2, 1255 Palm Ridge Phases 1 & 2, and Kingswood Park Vipingo homes. The development is equipped with key urban infrastructure, such as a 3 mn-liter capacity per day seawater desalination plant and an on-site power substation, ensuring reliable utilities for residents and businesses.
The establishment of the SEZ is a significant milestone, as it positions Vipingo as a major access point to Kenya and the broader East and Central African region. This designation is expected to attract both local and foreign enterprises seeking to capitalize on the logistical advantages and incentives associated with operating within an SEZ.
We expect that the development of the Vipingo Model City will have a transformative impact on the real estate sector in the region. By providing a well-planned, mixed-use community with modern infrastructure and amenities, it sets a benchmark for future developments. The SEZ status is likely to spur industrial growth, create employment opportunities, and stimulate economic activities, thereby enhancing the overall attractiveness of Kilifi County as a destination for investment and settlement. This project exemplifies a strategic approach to urban development, integrating residential, commercial, and industrial components to foster sustainable growth.
- Real Estate Investments Trusts (REITs)
On the Unquoted Securities Platform, Acorn D-REIT and I-REIT traded at Kshs 25.4 and Kshs 22.2 per unit, respectively, as per the last updated data on 14th March 2025. The performance represented a 27.0% and 11.0% gain for the D-REIT and I-REIT, respectively, from the Kshs 20.0 inception price. The volumes traded for the D-REIT and I-REIT came in at Kshs 12.8 mn and Kshs 35.6 mn shares, respectively, with a turnover of Kshs 323.5 mn and Kshs 791.5 mn, respectively, since inception in February 2021. Additionally, ILAM Fahari I-REIT traded at Kshs 11.0 per share as of 14th March 2025, representing a 45.0% loss from the Kshs 20.0 inception price. The volume traded to date came in at 138,600 shares for the I-REIT, with a turnover of Kshs 1.5 mn since inception in November 2015.
REITs offer various benefits, such as tax exemptions, diversified portfolios, and stable long-term profits. However, the ongoing decline in the performance of Kenyan REITs and the restructuring of their business portfolios are hindering significant previous investments. Additional general challenges include:
- Insufficient understanding of the investment instrument among investors leading to a slower uptake of REIT products,
- Lengthy approval processes for REIT creation,
- High minimum capital requirements of Kshs 100.0 mn for REIT trustees compared to Kshs 10.0 mn for pension funds Trustees, essentially limiting the licensed REIT Trustee to banks only
- The rigidity of choice between either a D-REIT or and I-REIT forces managers to form two REITs, rather than having one Hybrid REIT that can allocate between development and income earning properties
- Limiting the type of legal entity that can form a REIT to only a trust company, as opposed to allowing other entities such as partnerships, and companies,
- We need to give time before REITS are required to list – they would be allowed to stay private for a few years before the requirement to list given that not all companies maybe comfortable with listing on day one, and,
- Minimum subscription amounts or offer parcels set at Kshs 0.1 mn for D-REITs and Kshs 5.0 mn for restricted I-REITs. The significant capital requirements still make REITs relatively inaccessible to smaller retail investors compared to other investment vehicles like unit trusts or government bonds, all of which continue to limit the performance of Kenyan REITs.
We expect Kenya’s Real Estate sector to remain on a growth trend, supported by: i) demand for housing sustained by positive demographics, such as urbanization and population growth rates of 3.8% p.a and 2.0% p.a, respectively, against the global average of 1.7% p.a and 0.9% p.a, respectively, as at 2023,, ii) activities by the government under the Affordable Housing Program (AHP) iii) heightened activities by private players in the residential sector iv) increased investment by local and international investors in the hospitality and industrial sector,v) improved infrastructure throughout the country. However, challenges such as rising construction costs, strain on infrastructure development (including drainage systems), high capital requirements for REITs, and existing oversupply in select Real Estate sectors will continue to hinder the sector’s optimal performance by limiting developments and investments.
National Social Security schemes are created by governments to form the first pillar of social security. In Africa, Kenya was the second country after Ghana to form a national security scheme, The National Social Security Fund (NSSF), done in 1965 through an Act of Parliament (Cap 258). It is a provident fund, which provides benefits to retiring members as a lump sum rather than through periodic payments. In recent years, discussions around the growth and reform of the NSSF have gained momentum, with key considerations on how to increase coverage, especially for the informal sector, and improve service delivery. As such, we saw it fit to cover a topical on the Kenyan National Social Security Fund to shed light on the financials, recent developments and provide recommendations to improve efficiency. We shall do this by taking a look into the following;
- Introduction to the National Social Security Fund,
- Financial Performance for the year ended 30th June 2024,
- Recent Developments at the National Social Security Fund,
- Factors hindering growth of the NSSF,
- Key considerations to improving NSSF in Kenya, and,
- Conclusion
Section I: Introduction to the National Social Security Fund
Social security is defined as any programme of social protection established by legislation, or any other mandatory arrangement, that provides individuals with a degree of income security when faced with the contingencies of old age, survivorship, incapacity, disability, or unemployment. In Kenya, the National Social Security Fund (NSSF) offers social protection to all Kenyan workers in the formal and informal sectors by providing a platform to make contributions during their productive years to cater for their livelihoods in old age and the other consequences resulting from unprecedented occurrences such as death or invalidity among others.
The National Social Security Fund (NSSF) has evolved over time having been established in 1965 through an Act of Parliament Cap 258 of the Laws of Kenya. The Fund initially operated as a Department of the Ministry of Labor until 1987 when the NSSF Act was amended transforming the Fund into a State Corporation under the Management of a Board of Trustees. The Act was established as a mandatory national scheme whose main objective was to provide basic financial security benefits to Kenyans upon retirement. The Fund was set up as a Provident Fund providing benefits in the form of a lump sum. Thereafter, the National Social Security Fund (NSSF) Act, No.45 of 2013 was assented to on 24th December 2013 and commenced on 10th January 2014 thereby transforming NSSF from a Provident Fund to a Pension Scheme. Every Kenyan with an income was required to contribute a percentage of his/her gross earnings so as to be guaranteed basic compensation in case of permanent disability, basic assistance to needy dependents in case of death, and a monthly life pension upon retirement. The Act establishes two funds namely;
- Pension Fund, and,
- Provident Fund
NSSF has gained traction over the years, but particularly in the last two years, owing to implementation of the NSSF Act of 2013, which came into effect in February 2023 and is currently in its third year of implementation. The Act increased contributions to the fund from the initial Kshs 400.0 to 12.0% of individuals' income, with the employee and employers both contributing 6.0% each. As of June 2024, total assets held by NSSF stood at Kshs 402.2 bn, a 22.6% increase from Kshs 328.1 bn in December 2023. On y/y basis the assets under management increased by 30.5% from Kshs 308.3 bn in June 2023, attributable to the higher member contributions as a result of the second phase of the implementation of the NSSF Act of 2013, which increased monthly contributions leading to higher fund inflows. The graph below shows the movement of the funds Assets Under Management from 2019 to 2024:
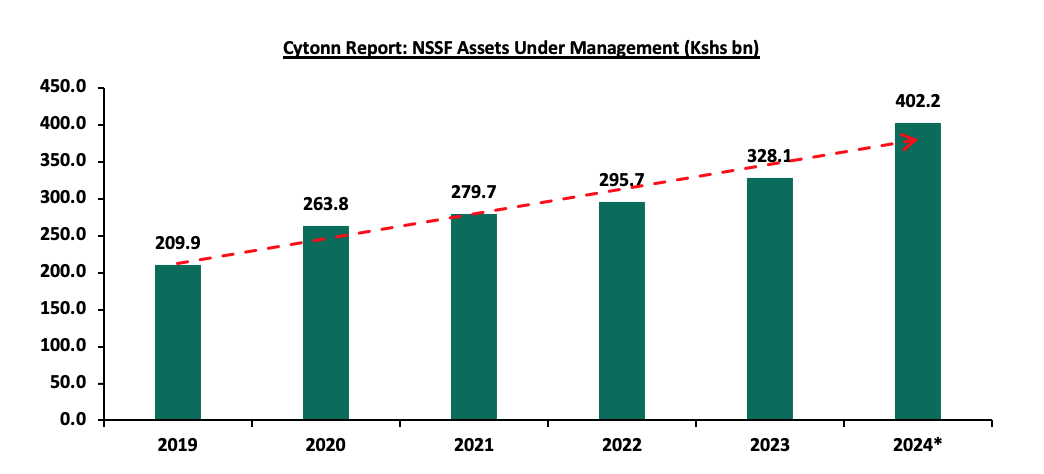
Source: RBA Annual Reports, 2024* data as of June 2024
According to the latest Retirement Benefits Authority (RBA) Annual Report, 13.1% of the total assets, amounting to Kshs 52.5 bn was managed internally by NSSF, while the remaining Kshs 348.7 bn was held by seven external fund managers. A breakdown of NSSF’s investment portfolio as of June 2024 reveals a strong preference for government securities, which accounted for 67.8% of total assets. This significant allocation is both strategic and common among pension schemes due to the safety, stability, and credibility associated with government bonds. These instruments offer guaranteed returns, minimal default risk, and predictable income streams, aligning well with the long-term investment horizon of pension funds. Beyond government securities, quoted equities made up 14.5% of the portfolio, reflecting NSSF’s exposure to publicly traded companies, while immovable property comprised 10.0% of the portfolio and 2.8% in fixed deposits. The chart below shows NSSF total assets spread as of June 2024:
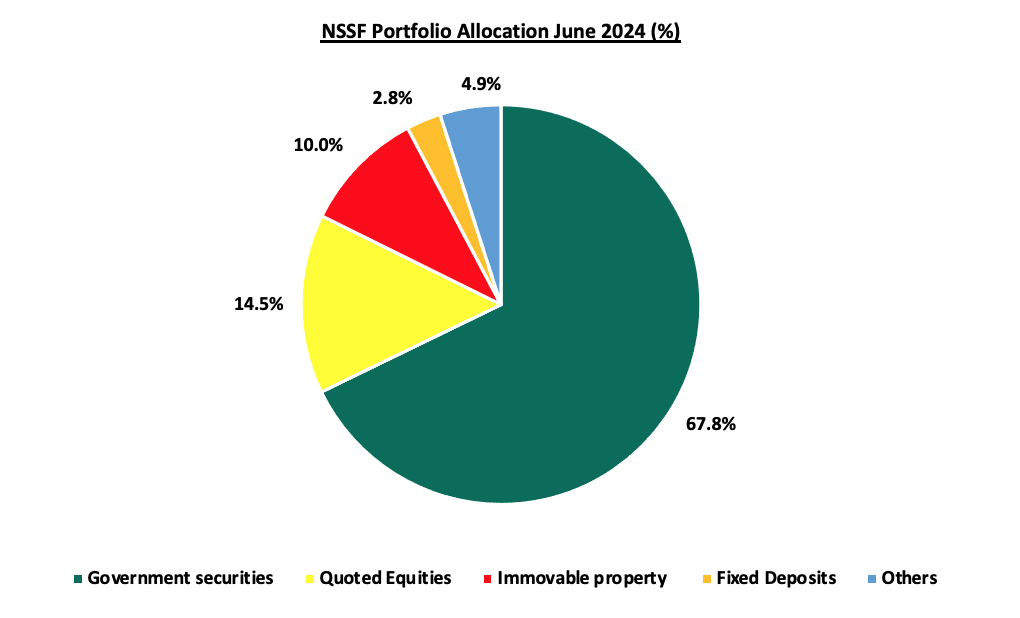
Source: RBA Annual Report June 2024
Section II: Financial Year 2023/2024 Financial Performance
The National Social Security Fund (NSSF) recorded a significant 233.4% net increase in funds to Kshs 88.0 bn for the period ending 30th June 2024, from Kshs 26.4 bn in a similar period in 2023. This was mainly driven by the 238.1% increase in the net investment income to Kshs 41.7 bn in FY’2023/24 from Kshs 12.3 bn in FY’2022/23, coupled with a 160.3% growth in the net contributions to Kshs 52.6 bn in FY’2023/24 from Kshs 20.2 bn in FY’2022/23. The performance was however weighed down by the 2.8% increase in total operating costs to Kshs 6.9 bn, from Kshs 6.7 bn in FY’2022’23. The table below shows a breakdown of NSSF statement of changes in net assets for the year ended 30th June 2024:
|
Cytonn Report: NSSF Statement of Change in Net Assets |
|||
|
FY'2022/23 |
FY'2023/24 |
y/y change |
|
|
Kshs (bn) |
Kshs (bn) |
||
|
Dealings with Member Funds |
|||
|
Remitted Member Contributions |
26.9 |
59.1 |
120.1% |
|
Unremitted Member Contributions |
0.0 |
3.1 |
- |
|
Total Contributions Receivable |
26.9 |
62.3 |
131.8% |
|
Benefits Paid |
(6.7) |
(9.7) |
45.5% |
|
Net Contributions |
20.2 |
52.6 |
160.3% |
|
Investment Income |
|||
|
FV Gain (Loss) on Revaluation of Investments |
(18.4) |
3.0 |
116.2% |
|
FV Gain (Loss) on Realization of Investments |
0.5 |
(0.2) |
(147.2%) |
|
Investment Income |
31.0 |
39.6 |
27.9% |
|
Investment Management Expenses |
(0.7) |
(0.7) |
5.2% |
|
Net Investment Income |
12.3 |
41.7 |
238.1% |
|
Other Income |
0.5 |
0.6 |
13.1% |
|
Net Revenue |
12.9 |
42.3 |
228.6% |
|
Total Operating Costs |
(6.7) |
(6.9) |
2.8% |
|
Net Increase in Fund |
26.4 |
88.0 |
233.4% |
|
Net Assets as Previously Stated |
285.7 |
312.1 |
9.2% |
|
Net Assets |
312.1 |
400.1 |
28.2% |
Source: Report of the Auditor General on NSSF June 2024
Key take outs from the table include:
- Net contributions increased by 160.3% to Kshs 52.6 bn in FY’2023/24 from Kshs 20.2 bn in FY’2022/23 attributable to the 131.8% increase in the total contributions receivable to Kshs 62.3 bn, from Kshs 26.9 bn in FY’2022/23 but was however weighed down by the 45.5% increase in the benefits paid to Kshs 9.7 bn in FY’2023/24 from Kshs 6.7 bn in FY’2022/23,
- Net Investment Income grew by 238.1% to Kshs 41.7 bn in FY’2023/24 from Kshs 12.3 bn in FY’2022/23 attributable to a 116.2% increase in the fair value gain on revaluation of investments to Kshs 3.0 bn from fair loss of Kshs 18.4 bn in FY’2022/2023 and the 27.9% increase in investment income to Kshs 39.6 bn from Kshs 31.0 bn in FY’2022/2023,
- Net revenue increased by 228.9% to Kshs 42.3 bn in FY’2023/24 from Kshs 12.9 bn in FY’2022/23,
- Total operating costs increased by 2.8% to Kshs 6.9 bn in FY’2023/24 from Kshs 6.7 bn in FY’2022/23 attributable to the 11.9 % increase in administrative costs to Kshs 7.0 bn from Kshs 6.2 bn in FY’2022/23. Investment management expenses increased by 5.2% to Kshs 0.67 bn from Kshs 0.65 bn in FY’2022/23 resulting in a 3.1% increase in the total expenses to Kshs 7.6 bn in FY’2023/24 from Kshs 7.3 bn in a similar period in 2023. Despite this increase in the Fund’s total expenses, total expenses to total assets decreased by 0.2% points to 2.4% for the year ending June 2024 from 2.6% in a similar period in 2023 but still came in above the maximum threshold which is in violation of Section 50 of the National Social Security Fund Act, 2013, that stipulates that the Fund shall not pay out more than 2.0% of its total assets in the first six years of its operation, and not more than 1.5% thereafter, and,
- Benefits paid increased by 45.5% to Kshs 9.7 bn in FY’2023/24 from Kshs 6.7 bn in FY’2022/23. Notably, payment of claims after retirement has also evolved over time growing at a 5-year CAGR of 17.2% to Kshs 9.7 bn in FY’2023/24 from Kshs 4.4 bn recorded in FY’2019/20. The graph below shows the benefits payout over the last five years;
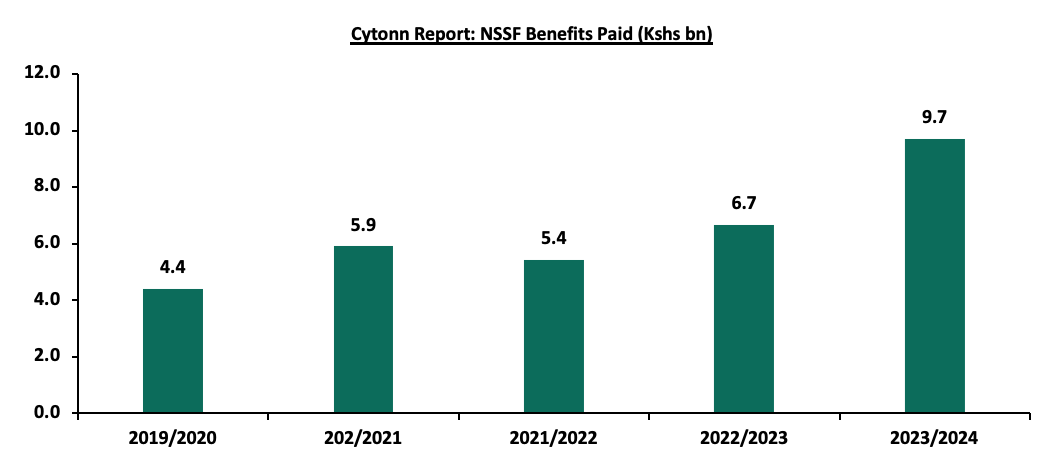
Source: NSSF Annual Reports, Report of the Auditor General on NSSF June 2024
The table below shows the NSSF statement of net assets available for benefits as of 30th June 2024:
|
Cytonn Report: NSSF Statement of Net Assets Available for Benefits |
|||||||
|
Investment Assets |
FY'2022/23 (Kshs bn) a |
FY'2023/24 (Kshs bn) B |
% Allocation FY'2022/23 c |
%Allocation FY'2023/24 d |
y/y change (a-b) |
% points change (c-d) |
|
|
Government Securities |
187.8 |
253.8 |
69.9% |
71.6% |
35.2% |
1.7% |
|
|
Quoted Stocks |
53.0 |
61.2 |
19.7% |
17.3% |
15.5% |
(2.5%) |
|
|
Term and Demand Deposits |
14.9 |
11.4 |
5.6% |
3.2% |
(23.3%) |
(2.3%) |
|
|
Accrued Income |
7.6 |
10.9 |
2.8% |
3.1% |
44.3% |
0.3% |
|
|
Eurobonds |
0.0 |
7.2 |
0.0% |
2.0% |
- |
2.0% |
|
|
Private Equity and other unlisted securities |
0.8 |
5.5 |
0.3% |
1.6% |
597.8% |
1.3% |
|
|
TPS Loans |
2.7 |
2.5 |
1.0% |
0.7% |
(5.8%) |
(0.3%) |
|
|
Corporate Bonds |
1.7 |
1.7 |
0.6% |
0.5% |
(1.1%) |
(0.2%) |
|
|
Total |
268.5 |
354.3 |
100.0% |
100.0% |
32.0% |
||
Source: Report of the Auditor General on NSSF June 2024
Key take outs from the table include:
- Government securities remained with the largest investment allocation, coming in at 71.6% in June 2024, an improvement from 69.9% recorded in June 2023. Similarly, the amounts invested in government securities as of 30th June recorded a 35.2% increase to Kshs 253.8 bn, from Kshs 187.8 bn recorded at the end of FY’2022/23. Notably, on a y/y basis the allocation government securities increased marginally by 1.7% points from 69.9% allocation recorded in FY’2022/23 mainly attributable to the high returns on government papers over the period,
- Quoted stocks recorded a decline in their investment allocation, decreasing by 2.5% points to 17.3% at the end of June 2024, from 19.7% at the end of June 2023. However, equity funds recorded a 15.5% growth in AUM to Kshs 61.2 bn in FY’2023/24, up from Kshs 53.0 bn in FY’2023/24. The increase in AUM is largely attributable to increased market activity, with the Nairobi All Share Index (NASI) registering a 19.0% gain in the six months to June 2024, as well as an improved business environment as evidenced by Purchasing Manager’s Index (PMI) registering an average of 50.0, in the six months to June 2024, from an average of 48.7 in a similar period in 2023.
- Private Equity and other unlisted securities recorded a significant 597.8% growth to Kshs 5.5 bn in June 2024, up from Kshs 0.8 bn in June 2023. Similarly, the allocation increased by 1.3% points to 1.6%, from the 0.3% recorded in a similar period in 2023, highlighting the Fund’s diversification efforts, and,
- The Fund took exposure on Eurobonds investing Kshs 7.2 bn, equivalent to 0.2% of the total net assets available for benefits and this is a result of Kenya’s February 2024 Eurobond issuance attracting institutional investors like NSSF seeking competitive yields.
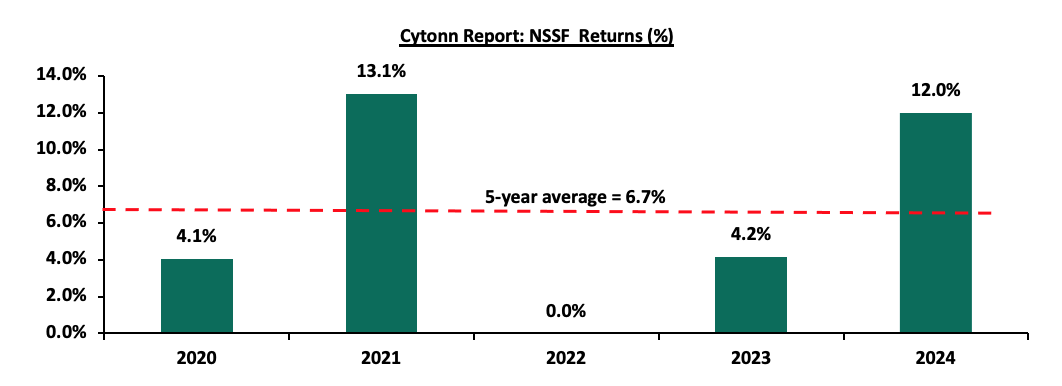
The Fund’s returns increased by 7.8% points to 12.0% in FY’2023/24 from 4.2% recorded in a similar period in 2023. NSSF has recorded an average return of 6.7% over the last five years with the highest return recorded in 2021. The graph below shows the performance of the Fund’s returns over the last 5 years:
Source: NSSF Reports, Office of the Auditor General
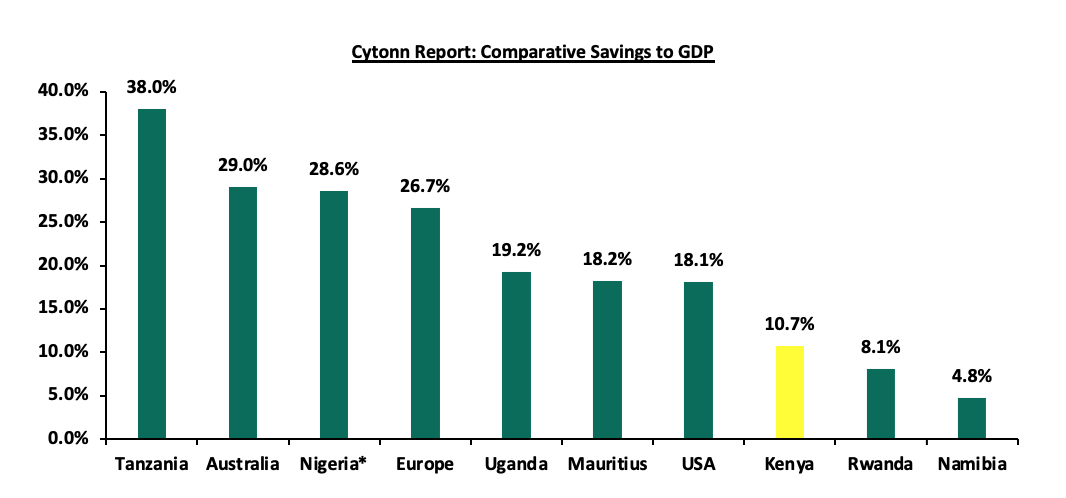
Despite the government making NSSF mandatory, Kenya’s saving culture still lags behind in comparison to other more developed countries partly attributable to low disposable income with 35.1% of the Kenyan population as of 2023 living below the poverty line coupled with lack of sufficient knowledge on the importance of saving for retirement. The graph below shows the gross savings to GDP of select countries in the Sub-Saharan Africa Region and the developed economies;
Source: World Bank, *Figures as of 2023
Section III: Recent Developments at the National Social Security Fund
In early 2025, Kenya’s National Social Security Fund (NSSF) ushered in a pivotal chapter of its evolution, marking the third year of implementing the transformative NSSF Act of 2013. With the stroke of new contribution limits effective 1st February 2025, the fund has broadened its reach, pulling more of workers’ earnings into the fold of pension savings. The lower earnings threshold has edged up from Kshs 7,000 to Kshs 8,000, while the upper limit has soared from Kshs 36,000 to Kshs 72,000, doubling the ceiling for contributions.
- Adjustments to NSSF Contribution Limits - Effective February 1, 2025, the contribution limits governing pensionable income were adjusted, reflecting an ambitious push to secure stronger retirement benefits for workers. The lower earnings limit, previously set at Kshs 7,000, rose to Kshs 8,000, lifting the minimum monthly contribution from Kshs 420 to Kshs 480 per employee, with employers matching this amount to total Kshs 960 for Tier I. Meanwhile, the upper earnings limit has doubled, leaping from Kshs 36,000 to Kshs 72,000. This shift pushes the maximum contribution to Kshs 4,320 per employee—matched equally by employers—resulting in a combined total of Kshs 8,640 for those earning Kshs 72,000 or more. For an employee earning Kshs 50,000, the deduction now stands at Kshs 3,000, up from Kshs 2,160, illustrating how these changes reach across income brackets, capturing a larger slice of salaries for pension savings.
This expansion, however, is a double-edged sword. For employees, particularly those at the lower end of the income spectrum, the increase from Kshs 420 to Kshs 480 trims take-home pay by an additional Kshs 60 monthly, a modest figure that nonetheless bites into budgets already stretched by rising costs. Mid-tier earners, such as those at Kshs 50,000, face a steeper Kshs 840 increase, while high earners see their contributions double, promising greater retirement security at the expense of current liquidity. Employers, too, feel the weight of these adjustments. A business with a handful of employees earning above Kshs 72,000 now shoulders an additional Kshs 2,160 per worker each month, a burden that could strain small enterprises or prompt larger firms to rethink staffing strategies. Yet, there’s a potential relief valve: employers with private pension schemes can opt out of Tier II contributions, redirecting funds to approved alternatives, though this requires navigating regulatory hoops. The adjustments, effective from February this year, are summarized as follows:
|
Cytonn Report: NSSF Contribution Limits Adjustments |
||
|
Year 2 (Previous Rates) |
Year 3 (New Rates Commenced February 2025) |
|
|
Lower Limit (Tier 1) |
7,000 |
8,000 |
|
Total Contribution by Employee |
420 |
480 |
|
Total Contribution by Employer |
420 |
480 |
|
Total Tier 1 NSSF Contributions |
840 |
960 |
|
Upper Limit (Tier 2) |
36,000 |
72,000 |
|
Contribution on Upper Limit (6% of Upper Limit Less Lower Limit) |
29,000 |
64,000 |
|
Total Contribution by Employee |
1,740 |
3,840 |
|
Total Contribution by Employer |
1,740 |
3,840 |
|
Total Tier 2 NSSF Contributions |
3,480 |
7,680 |
|
Total NSSF Contributions |
4,320 |
8,640 |
Source: www.nssf.or.ke
- Court of Appeal Ruling Reinforcing SRC Oversight of NSSF Salaries - On March 6, 2025, the Court of Appeal reinstated the Salaries and Remuneration Commission’s (SRC) authority to regulate salaries at the National Social Security Fund (NSSF), reversing a prior judgment that had excluded NSSF from SRC oversight. The court classified NSSF as a public entity, citing its management of mandatory worker contributions as public funds, thus placing its employees under SRC jurisdiction as public officers. This decision resolves a legal dispute initiated over a decade ago when SRC’s circular on state corporation remuneration faced opposition from employee unions, sparking prolonged litigation.
The ruling mandates SRC to establish standardized salary frameworks for NSSF staff, aligning compensation with public sector policies. This could disrupt existing collective bargaining agreements and reshape future employment terms, enhancing fiscal discipline over NSSF’s operational costs. Given NSSF’s role in managing public pension funds, this strengthens accountability but may strain labor relations if wage adjustments lag behind inflation or market rates. - Stagnation in NSSF Bond Trading Investigation - The investigation into alleged irregular bond trading at NSSF, launched by the Capital Markets Authority (CMA) in September 2024, has shown no significant progress by March 19, 2025. The probe targeted transactions between May and July 2024, where bonds were reportedly bought at above-market prices and sold at losses, potentially benefiting select individuals. Initial momentum including summons of Central Bank of Kenya (CBK) and CMA officials by the National Assembly’s Finance and National Planning Committee has dissipated. Challenges include delays in accessing digital communication evidence and a leaked internal letter that may have compromised the inquiry by alerting suspects to delete data.
The lack of updates suggests operational or political hurdles in enforcing financial oversight, undermining confidence in CMA’s regulatory capacity. With NSSF’s total assets at Kshs 400.1 bn as of June 2024, any unresolved mismanagement could erode member returns, highlighting systemic risks in transparency and governance within Kenya’s pension sector. Below is the performance summary for the last reported years, compared to the estimated returns from a portfolio of 60.0% bonds and 40.0% equities:
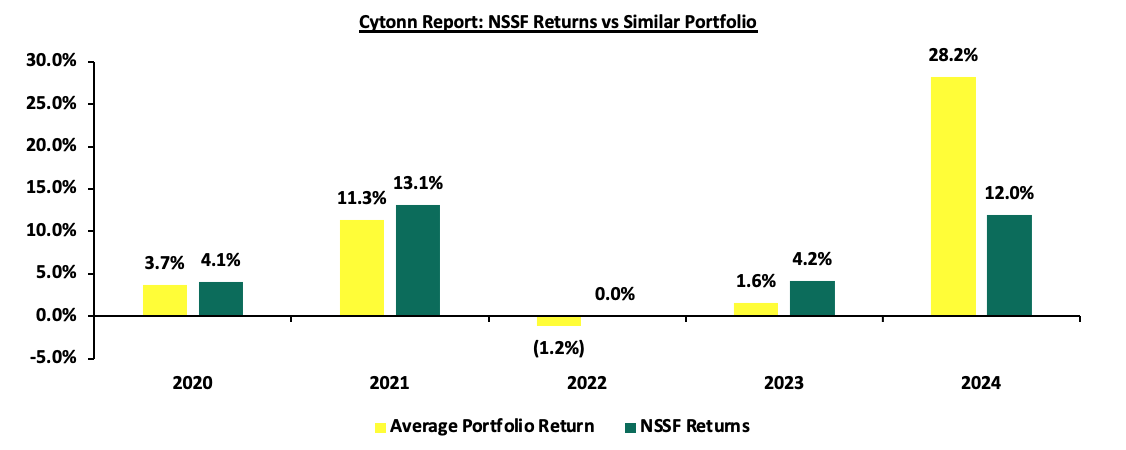
Source: NSSF strategic plan 2023-2027
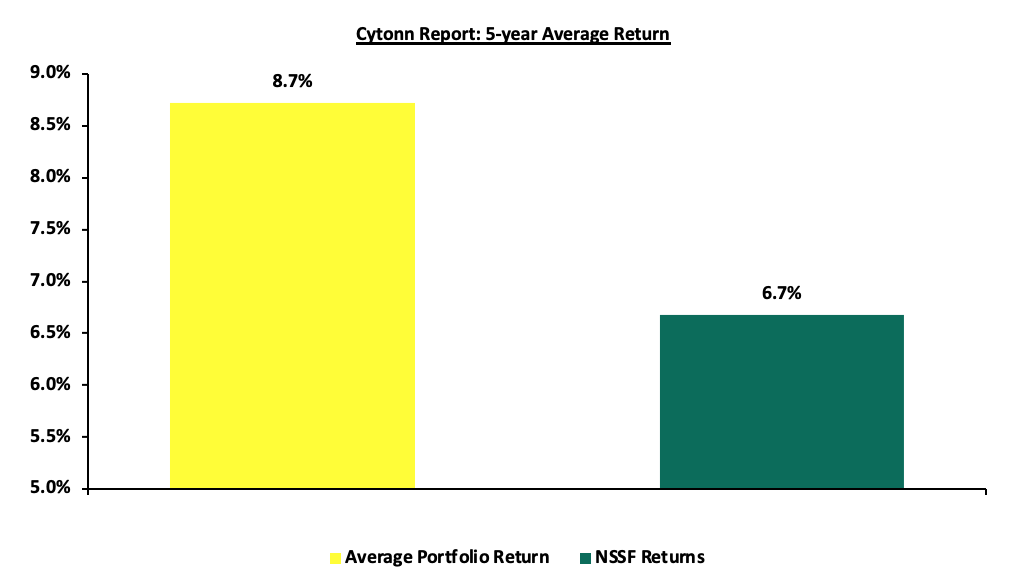
Source: Cytonn Research, NSSF strategic plan 2023-2027
On average, the NSSF portfolio has underperformed by 2.0 percentage points compared to a comparable benchmark. While NSSF recorded a return of 6.7%, a similarly constructed portfolio—split between 60.0% government bonds and 40.0% equities from the NASI—achieved 8.7% over the same period. While there may be a number of reasons for this, occurrences such as the irregular bond trades could definitely have contributed to this.
- NSSF’s Mixed-Use Development Project in Nairobi CBD - The National Social Security Fund (NSSF) is advancing a multibillion-shilling mixed-use development on a 3.9-acre site at the Uhuru Highway and Kenyatta Avenue intersection in Nairobi’s central business district. Vacant for decades due to legal and ownership disputes, the plot will be developed under an EPC+F (Engineering, Procurement, Construction, and Financing) model, delegating design, construction, and funding to private contractors. Announced in late 2024, the project aims to integrate residential, commercial, and hospitality components, reflecting NSSF’s strategy to optimize its real estate portfolio.
This initiative leverages NSSF’s financial capacity to generate long-term returns, with the EPC+F model mitigating direct fiscal risk. Success hinges on contractor selection and market demand, potentially boosting Nairobi’s urban infrastructure while diversifying NSSF’s income streams. However, historical disputes over the site signal execution risks that could delay timelines or inflate costs.
Section IV: Factors Hindering the Growth of NSSF
The growth of Kenya’s National Social Security Fund (NSSF) has been constrained by a combination of interconnected factors affecting its efficiency, financial stability, and capacity to deliver sufficient retirement benefits. In this regard, we examine the key challenges that have hindered the fund’s growth as follows:
- Unremitted Contributions: The fund has struggled with unremitted contributions from state corporations, government-owned enterprises, and semi-autonomous agencies. By the end of FY’2023/24, unremitted member contributions to the NSSF had risen to Kshs 3.1 bn. This sharp rise underscores a widening funding gap that jeopardizes the fund’s capacity to fulfill its retirement obligations,
- Leadership and Governance Issues: The NSSF has struggled with ongoing governance challenges, including accusations of mismanagement and corruption. Probes into corruption allegations involving senior officials have eroded trust in the fund's leadership. The NSSF has faced persistent governance issues, including allegations of mismanagement and corruption. Investigations into corruption allegations involving senior officials at the NSSF have undermined confidence in the fund’s management. Senior officials have been accused of suspicious irregular bond dealings between May and July 2024 in order to generate illegal profits for the participants. This has sparked demands for reforms; however, progress has been hindered by bureaucratic obstacles and resistance from vested interests. The absence of strong governance has led to inefficiencies and continued mismanagement,
- High Unemployment Rate in Kenya: The unemployment rate in Kenya stood at 5.6% at the end of 2023, and is projected at 7.2% in 2025; Largely due to the country's economic development challenges, coupled with a growing youth population. This has raised the dependency ratio among the working population, making it harder for them to allocate funds toward social security contributions for their retirement. As a result, the National Social Security Fund (NSSF) faces slower growth, with fewer contributors limiting its ability to expand its asset base,
- Slow Economic Growth: Kenya’s economy has faced persistent slow growth, with an average GDP growth rate of 4.5% over the last 5 years. This slow economic performance has resulted in low-income levels for many citizens, directly impacting their ability to make regular contributions to the National Social Security Fund (NSSF). Furthermore, inflation and increasing cost of living have reduced disposable income, making it difficult for both individuals and employers to meet their NSSF obligations. This economic stagnation has contributed to lower contribution inflows, limiting the fund's ability to grow its asset base and deliver adequate retirement benefits,
- Government Interference – As a government-owned institution, the NSSF is directly affected by legislative changes, particularly increased taxation, which negatively impacts its growth and operations. Additionally, while the rise in NSSF contribution rates aims to enhance fund collections, it has also increased employment costs. Employers, required to match employee contributions, face higher expenses, discouraging formal employment and ultimately limiting overall contributions. This challenge is further exacerbated by Kenya’s already high unemployment rate. Critics have also argued that the NSSF reforms lacked sufficient public consultation, raising concerns about whether the NSSF Act met constitutional requirements for public participation. As a result, legal disputes and resistance have increased challenging the implemented reforms, further obstructing the growth and stability of NSSF, and,
- Negative Perception of NSSF- The rampant governance issues faced by NSSF has led to mistrust of the fund by the general public due to allegations due to mismanagement and corruption practiced by the top leaders of the office. This has resulted in lack of faith in the scheme and members opting out of contributing their Tier II contributions to the fund and remitting to private pensions schemes managed by fund managers and administrators thus hindering the growth of the fund.
Section V: Key Considerations for Improving NSSF in Kenya
We note that the government has consistently tried to promote a savings culture in the country through various reforms, including raising contribution rates and making contributions mandatory. For instance, in the NSSF Act 2013, the government recommended a mandatory registration contribution to NSSF by employees and employers. The Act aimed to enhance the sustainability of retirement benefits for Kenyan workers. Key provisions of the Act include an increase in contribution rates, from a flat rate of Kshs 400.0 to 12.0% of an employee's monthly earnings, with 6.0% contributed by the employee and an equal amount by the employer.
However, the enactment of the Act has faced legal challenges. Multiple petitions were filed questioning its constitutionality, leading to a decision by the Employment and Labor Relations Court (ELRC). On September 19, 2022, in Kenya Tea Growers Association & 8 Others v. NSSF Board & Others, the ELRC ruled that the Act was unconstitutional on the basis of;
- The provisions of the NSSF Act, 2013 were not subjected to public participation and were not tabled before the Senate prior to its enactment as per constitutional requirements,
- Imposing mandatory registration and contribution to NSSF would have overburdened employees and consequently reduce disposable income since a vast majority of employees have their pay slips already strained due to their various financial commitments with other institutions and their subscription to other pensions schemes, and,
- The provisions of the Act would have given NSSF a competitive advantage thus making the Fund a monopoly in the provision of pension and social security services in the country.
After this ruling, the NSSF Board of Trustees filed an appeal, and the case eventually reached the Supreme Court of Kenya. The Supreme Court assessed whether the ELRC had the authority to determine the Act's constitutionality. In the end, the court upheld the ELRC’s jurisdiction but referred the case to the Court of Appeal for further review. In our opinion, the following are key actionable steps that can be considered to drive NSSF’s growth while striving to balance the interests of the government, employers, and employees.
- Mass education on developing a savings culture – It is crucial to educate Kenyans on the importance of developing a savings culture, particularly young people in the informal sector perceive retirement planning as something meant only for older people rather than a long-term financial necessity. Additionally, many Kenyans tend to be less concerned about retirement planning, relying on the expectation that their children will support them in the future. This mindset hinders individuals from voluntarily enrolling in schemes like the NSSF, even when they have a steady source of income. There’s also a need for mass education to the public on the implemented NSSF Act of 2013 in terms of how it’s going to affect employees, employers and the government and also the benefits to be realized by the stakeholders,
- Ensure involvement of all stakeholders in NSSF reforms – It is essential to involve the general public and all stakeholders in any proposed NSSF reforms. As mentioned earlier, the High Court had nullified the NSSF Act of 2013, which sought to raise monthly contributions from Kshs 200.0 to Kshs 2,160.0, citing a lack of public participation—a constitutional requirement for major policy decisions. Furthermore, the Act's promoters failed to secure Senate approval, despite its impact on county employees and the financial operations of devolved governments. Higher pension contributions will strengthen the NSSF by expanding the retirement fund and improving workers' replacement ratios compared to the current system, and,
- Enforcement of compliance from employers – Unremitted contribution increased to Kshs 3.1 bn in FY’2023/24 and thus there is a need for NSSF to eliminate any loopholes to ensure that all employers fully comply with contribution remittance. This can be achieved by integrating technologies that centralize payroll-related contributions onto a single platform, enhancing efficiency, streamlining record reconciliation, and identifying employers who make partial remittances,
- Streamline operational efficiency – In the financial year ended 30th June 2024, NSSF’s total expenses increased by 3.1% to Kshs 7.6 bn, with the total expenses to AUM ratio decreasing by 0.2% points to 2.4% in FY’2023/24 from 2.6% FY’2022/23, but still above the 2.0% maximum threshold. To better serve the interests of all stakeholders, NSSF should implement proactive measures to enhance efficiency and reduce unnecessary expenses.
Section VI: Conclusion
The National Social Security Fund (NSSF) has seen quite a turnaround in its performance due to its implemented strategies such as diversification of its investments in high yielding investments as well as increased contribution due to implementation of the revived NSSF Act of 2013. However, there are still some challenges that threatens its credibility and the financial security of its members that needs to be addressed. For countless retirees, the NSSF represents a lifetime of dedication and sacrifice, making the protection of their benefits essential. Restoring trust requires the establishment of robust oversight mechanisms, including independent audits and strict adherence to remittance timelines. Now is the time for all stakeholders—government, regulators, and fund management—to come together in a unified effort to strengthen the NSSF, ensuring it continues to secure the retirement futures of millions of Kenyans. Swift action is imperative, as it will help alleviate old-age poverty and provide a stable income to replace earnings in retirement.
Disclaimer: The views expressed in this publication are those of the writers where particulars are not warranted. This publication, which is in compliance with Section 2 of the Capital Markets Authority Act Cap 485A, is meant for general information only and is not a warranty, representation, advice or solicitation of any nature. Readers are advised in all circumstances to seek the advice of a registered investment advisor.

- Talk to us
- Kenya
- P.O Box 20695 - 00200, Nairobi, Kenya
- Cell +254709101200
- Tel +254709101200
- WhatsApp +254741676635
- United States
- +254709101200
- DOWNLOAD OUR APP
-


- Kenya
- 8th Floor, Pinetree Plaza, Kaburu Drive, Ngong Road, Nairobi, Kenya
- USA
- Suite 1150, 1775 Eye Street NW, USA, Washington DC 20006, USA
- Investments
- High Yield
- Private Equity
- Real Estate
- Real Estate
- RiverRun Estates
- Cytonn Towers
- The Ridge
- Taraji Heights
- The Alma