Kenya National Social Security Fund & Cytonn Weekly #03/2026
By Research Team, Jan 25, 2026
Executive Summary
Fixed Income
This week, T-bills were undersubscribed for the first time in four weeks, with the overall subscription rate coming in at 76.5%, lower than the subscription rate of 128.4% recorded the previous week. Investors’ preference for the shorter 91-day paper increased, with the paper receiving bids worth Kshs 1.4 bn against the offered Kshs 4.0 bn, translating to a subscription rate of 34.3%, albeit higher than the subscription rate of 24.0%, recorded the previous week. The subscription rate for the 182-day paper increased to 88.3% from the 5.8% recorded the previous week, while that of the 364-day papers decreased to 81.5% from 292.8% recorded the previous week. The government accepted a total of Kshs 18.2 bn worth of bids out of Kshs 18.4 bn bids received, translating to an acceptance rate of 99.2%.The yields on the government papers showed mixed performance with the yield on the 91 day edging slightly up by 2.6 basis points but remaining at 7.7%, while the yields on the 182-day and 364-day paper decreased by 0.7 bps and 0.3 bps to remain relatively unchanged at 7.8% and 9.2% respectively compared to last week;
During the week, the Central Bank of Kenya released the auction results for the switch of treasury bonds from FXD1/2016/010, with a tenor to maturity of 0.6 years and a fixed coupon rate of 15.0%, to FXD1/2022/015, a with a tenor to maturity of 11.3 years and a fixed coupon rate of 13.9%. This marks the third bond switch, following the switches to IFB1/2022/06 and IFB1/2020/06 in December 2022 and June 2020, respectively. The bond was oversubscribed, with the overall subscription rate coming in at 132.5%, receiving bids worth Kshs 26.5 bn against the offered Kshs 20.0 bn. The government accepted bids worth Kshs 25.2 bn, translating to an acceptance rate of 95.0%. The weighted average yield for the accepted bids for the FXD1/2022/015 came in at 13.2%. Notably, the 13.2% on the FXD1/2022/015 was lower than the 13.9% recorded the last time the bond was reopened in October 2025. With the Inflation rate at 4.5% as of December 2025, the real returns of the FXD1/2022/015 was 8.7%. Given the 10.0% withholding tax on the bonds, the tax equivalent yields for shorter term bonds with 15.0% withholding tax is 14.0% for the FXD1/2022/015;
In the primary bond market, the government is seeking to raise Kshs 50.0 bn for budgetary support through the re-opened bonds FXD3/2019/015 and FXD1/2018/025, with fixed coupon rates of 12.3% and 13.4%, and tenors to maturity of 8.4 years and 17.3 years, respectively. The period of sale for the two bonds runs from Thursday, 22nd January 2026, to Wednesday, 11th February 2026, with a settlement date of 16th February 2026. Our bidding ranges for FXD3/2019/015 and FXD1/2018/025 are 12.25%-12.75% and 13.50%-14.00%, respectively;
We are projecting the January 2026 inflation to decrease marginally to within a range of at 4.3%-4.4% mainly on the back of a decrease in fuel prices in January 2026 and anchored by the stability of the Shilling;
During the week the Kenya Revenue Authority (KRA) announced they had delivered a strong revenue performance for the first half of FY’2025/26, exceeding targets across all key categories. Total tax revenue amounted to Kshs 307.6 bn against a target of Kshs 285.0 bn, translating to a performance rate of 108.0%. Ex-chequer revenue reached Kshs 284.3 bn compared to a target of Kshs 261.8 bn, representing 108.6% achievement;
Equities
During the week, the equities market recorded a mixed performance, with NSE 25, NASI and NSE 20 gaining by 0.4%, 0.4% and 0.3% respectively, while NSE 10 declined by 0.3% taking the YTD performance to gains of 4.0%, 3.9%, 3.6% and 2.7% for NSE 20, NASI, NSE 25 and NSE 10 respectively. The equities market performance was mainly driven by gains recorded by large cap stocks such as NCBA, ABSA, and Cooperative Bank of 8.3%, 2.7% and 1.9% respectively. However, the performance was weighed down by losses recorded by large cap stocks such as EABL, KCB, and Stanbic of 3.6%, 1.1%, and 1.0% respectively;
Also, during the week, the banking sector index gained by 1.0% to 215.8 from 213.6 recorded the previous week. This is attributable to gains recorded by stocks such as NCBA, ABSA, and Cooperative Bank of 8.3%, 2.7% and 1.9% respectively. However, the performance was weighed down by losses recorded by stocks such as KCB, Stanbic, and DTBK of 1.1%, 1.0%, and 0.8% respectively;
During the week, NCBA Group PLC issued a cautionary announcement following receipt of a Notice of Intention from Nedbank Group Limited to acquire approximately 1,087,362,891 ordinary shares, representing approximately 66.0% of NCBA’s issued share capital, from NCBA shareholders through a partial tender offer, subject to regulatory approvals. If successfully completed, the transaction will result in Nedbank acquiring a controlling interest in NCBA, while the remaining 34.0% of the shares will remain listed on the Nairobi Securities Exchange (NSE);
During the week, Kenya Pipeline Company Plc (KPC) launched an Initial Public Offer (IPO) through an Offer for Sale at the Nairobi Securities Exchange (NSE), offering 65% of its stake to the public. The transaction represents one of the largest capital markets listings in East Africa and marks a major milestone in Kenya’s privatization agenda. The IPO provides investors with access to a strategic national infrastructure asset characterized by stable cash flows, strong margins and a dividend-oriented investment profile. Prior to the IPO, KPC was 100% owned by the Government of Kenya. The KPC IPO is anchored on the government’s broader divestment and privatization agenda, aimed at reducing its direct involvement in commercial enterprises while unlocking value from mature state-owned assets;
Real Estate
During the week, the Kenya Railways Corporation announced that it has completed the reconstruction of the Uplands-Kijabe-Longonot Metre Gauge Railway which was destroyed when the Mai Mahiu dam burst its banks in April 2024 which also led to the death of more than 60 people. Some parts of the railway were also washed away by heavy rains which rendered it impassable;
During the week, the Private Infrastructure Development Group (PIDG) announced it will take up 33% of Africa Logistics Properties’ dollar denominated Industrial Income Property Fund. The fund which is backed by six governments such as the United Kingdom, Netherlands, Switzerland, Australia, Sweden and Canada has committed to invest up to Kshs 1.9 bn to become the anchor investor in the Real Estate Investment Trust;
On the Unquoted Securities Platform, Acorn D-REIT and I-REIT traded at Kshs 27.4 and Kshs 23.2 per unit, respectively, as per the last updated data on 5th December 2025. The performance represented a 33.4% and 14.5% gain for the D-REIT and I-REIT, respectively, from the Kshs 20.0 inception price. The volumes traded for the D-REIT and I-REIT came in at 12.8 mn and 41.2 mn shares, respectively, with a turnover of Kshs 323.5 mn and Kshs 791.5 mn, respectively, since inception in February 2021. Additionally, ILAM Fahari I-REIT traded at Kshs 11.0 per share as of 5th December 2025, representing a 45.0% loss from the Kshs 20.0 inception price. The volume traded to date came
Focus of the Week
National Social Security schemes are created by governments to form the first pillar of social security. In Africa, Kenya was the second country after Ghana to form a national security scheme, The National Social Security Fund (NSSF), done in 1965 through an Act of Parliament (Cap 258). In recent years, discussions around the growth and reform of the NSSF have gained momentum, with key considerations on how to increase coverage, especially for the informal sector, and improve service delivery. The fund has also faced a number of challenges in recent years, with concerns about mismanagement, corruption, and inefficiencies often overshadowing the fund’s broader mission and leading to a decline in public confidence. As such, this week we turn our focus to the Kenyan National Social Security Fund to shed light on the fourth phase of the NSSF Act, 2013 deductions, effective 1st February 2026, the financial performance for the year ended 30th June 2025, recent developments and what needs to be done improve efficiency;
Investment Updates:
- Weekly Rates:
- Cytonn Money Market Fund closed the week at a yield of 11.7% p.a. To invest, dial *809# or download the Cytonn App from Google Play store here or from the Appstore here;
- We continue to offer Wealth Management Training every Tuesday, from 7:00 pm to 8:00 pm. The training aims to grow financial literacy among the general public. To register for any of our Wealth Management Trainings, click here;
- If interested in our Private Wealth Management Training for your employees or investment group, please get in touch with us through wmt@cytonn.com;
- Cytonn Insurance Agency acts as an intermediary for those looking to secure their assets and loved ones’ future through insurance namely; Motor, Medical, Life, Property, WIBA, Credit and Fire and Burglary insurance covers. For assistance, get in touch with us through insuranceagency@cytonn.com;
- Cytonn Asset Managers Limited (CAML) continues to offer pension products to meet the needs of both individual clients who want to save for their retirement during their working years and Institutional clients that want to contribute on behalf of their employees to help them build their retirement pot. To more about our pension schemes, kindly get in touch with us through pensions@cytonn.com;
Hospitality Updates:
- We currently have promotions for Staycations. Visit cysuites.com/offers for details or email us at sales@cysuites.com;
Money Markets, T-Bills Primary Auction:
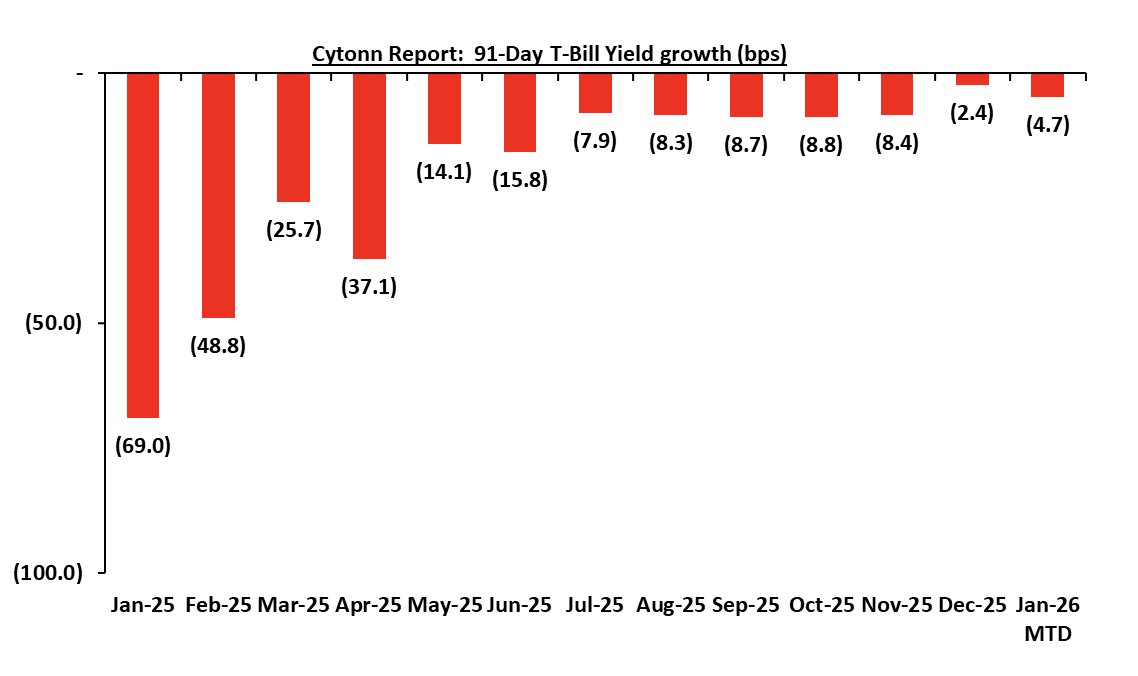
This week, T-bills were undersubscribed for the first time in four weeks, with the overall subscription rate coming in at 76.5%, lower than the subscription rate of 128.4% recorded the previous week. Investors’ preference for the shorter 91-day paper increased, with the paper receiving bids worth Kshs 1.4 bn against the offered Kshs 4.0 bn, translating to a subscription rate of 34.3%, albeit higher than the subscription rate of 24.0%, recorded the previous week. The subscription rate for the 182-day paper increased to 88.3% from the 5.8% recorded the previous week, while that of the 364-day papers decreased to 81.5% from 292.8% recorded the previous week. The government accepted a total of Kshs 18.2 bn worth of bids out of Kshs 18.4 bn bids received, translating to an acceptance rate of 99.2%.The yields on the government papers showed mixed performance with the yield on the 91 day paper increasing by 2.6 bps to remain relatively unchanged at 7.7% compared to last week, while the yields on the 182-day and 364-day paper decreased by 0.7 bps and 0.3 bps to remain relatively unchanged at 7.8% and 9.2% respectively compared to last week. The chart below shows the yield growth rate for the 91-day paper from January 2025 to date:
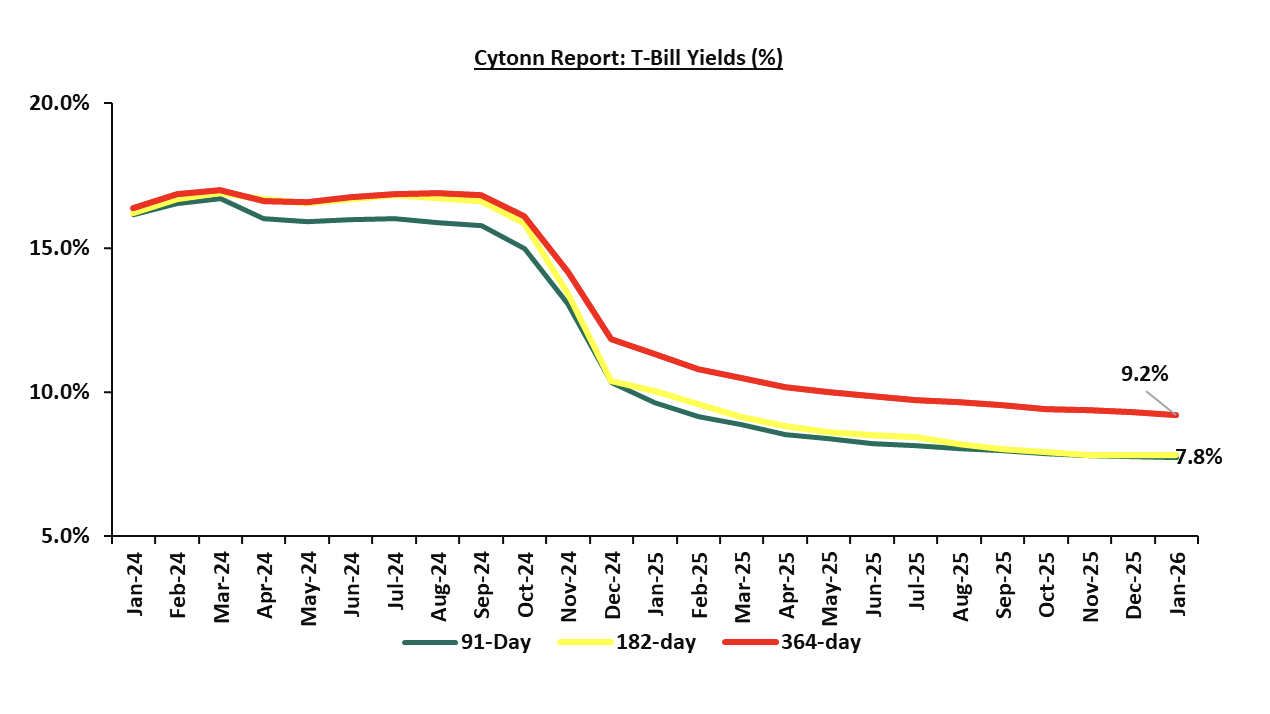
The charts below show the performance of the 91-day, 182-day and 364-day papers from January 2024 to January 2025:
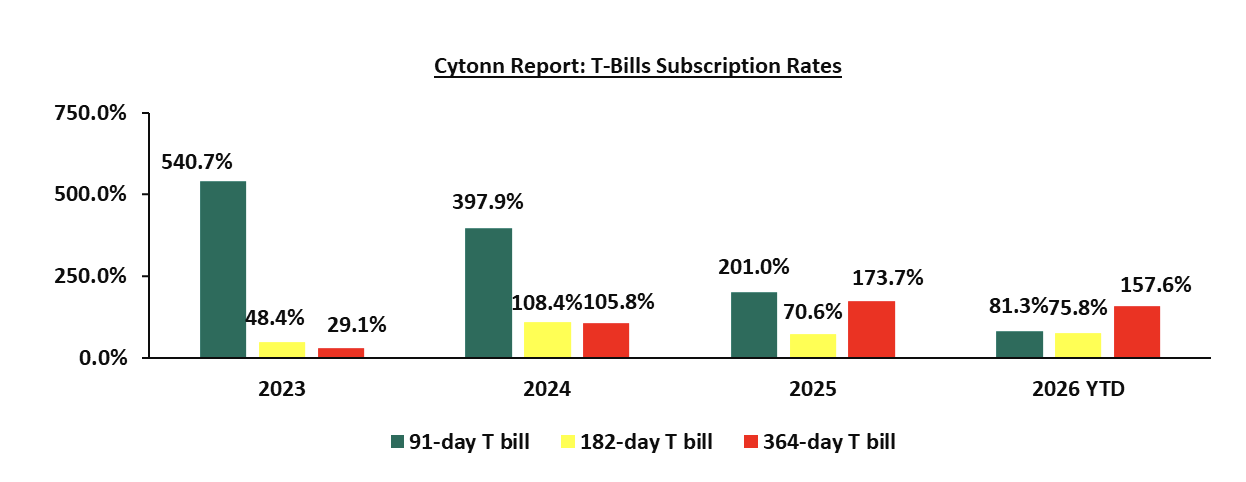
The chart below compares the overall average T-bill subscription rates obtained in 2023, 2024, 2025 and 2026 Year-to-date (YTD):
Primary Bond Market:
The Central Bank of Kenya released the auction results for the switch of treasury bonds from FXD1/2016/010, with a tenor to maturity of 0.6 years and a fixed coupon rate of 15.0%, to FXD1/2022/015, a with a tenor to maturity of 11.3 years and a fixed coupon rate of 13.9%. This marks the third bond switch, following the switches to IFB1/2022/06 and IFB1/2020/06 in December 2022 and June 2020, respectively. The bond was oversubscribed, with the overall subscription rate coming in at 132.5%, receiving bids worth Kshs 26.5 bn against the offered Kshs 20.0 bn. The government accepted bids worth Kshs 25.2 bn, translating to an acceptance rate of 95.0%. The weighted average yield for the accepted bids for the FXD1/2022/015 came in at 13.2%. Notably, the 13.2% on the FXD1/2022/015 was lower than the 13.9% recorded the last time the bond was reopened in October 2025. With the Inflation rate at 4.5% as of December 2025, the real returns of the FXD1/2022/015 was 8.7%. Given the 10.0% withholding tax on the bonds, the tax equivalent yields for shorter term bonds with 15.0% withholding tax is 14.0% for the FXD1/2022/015.
In the primary bond market, the government is seeking to raise Kshs 50.0 bn for budgetary support through the re-opened bonds FXD3/2019/015 and FXD1/2018/025, with fixed coupon rates of 12.3% and 13.4%, and tenors to maturity of 8.4 years and 17.3 years, respectively. The period of sale for the two bonds runs from Thursday, 22nd January 2026, to Wednesday, 11th February 2026, with a settlement date of 16th February 2026. Our bidding ranges for FXD3/2019/015 and FXD1/2018/025 are 12.25%-12.75% and 13.50%-14.00%, respectively.
Money Market Performance:
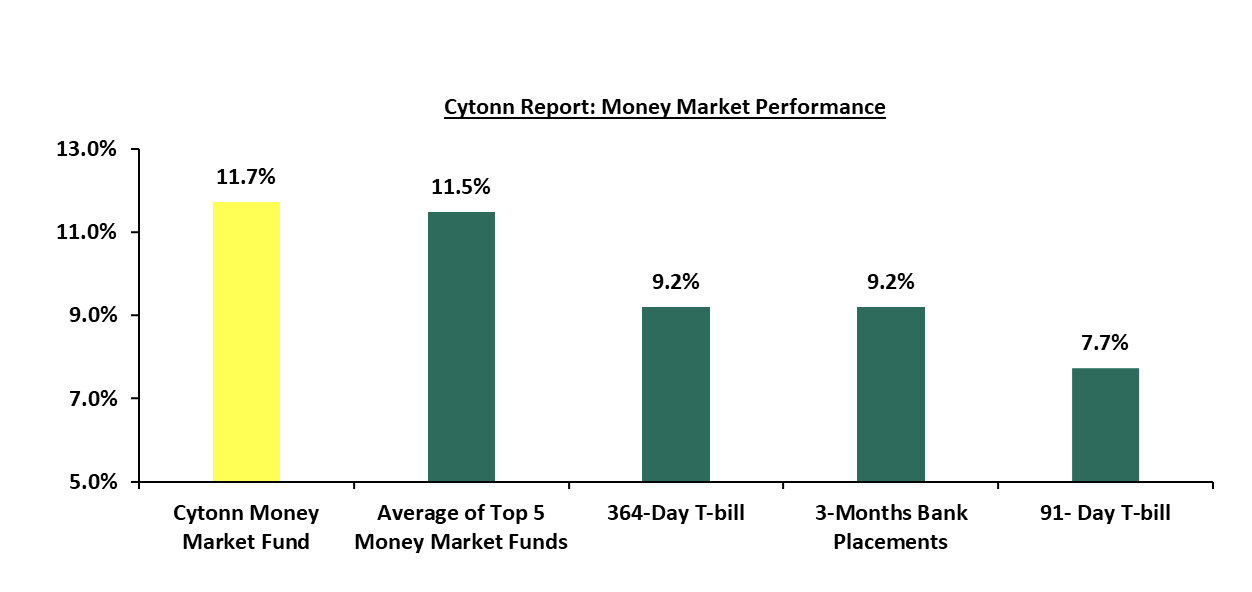
In the money markets, 3-month bank placements ended the week at 9.2% (based on what we have been offered by various banks) and yields on the government papers recorded a mixed performance, with yields on the 91-day paper increasing marginally by 2.6 bps to remain relatively unchanged at 7.7% compared to last week while the yields on the 364-day paper decreased by 0.3 bps to remain relatively unchanged at 9.2% compared to last week. The yield on the Cytonn Money Market Fund increased by 10.0 bps to 11.7% from the 11.6% recorded in the previous week, while the average yields on the Top 5 Money Market Funds decreased by 4.6 bps to remain relatively unchanged at 11.5% in comparison to the previous week.
The table below shows the Money Market Fund Yields for Kenyan Fund Managers as published on 23rd January 2026:
|
Money Market Fund Yield for Fund Managers as published on 23rd January 2026 |
||
|
Rank |
Fund Manager |
Effective Annual Rate |
|
1 |
Arvocap Money Market Fund |
11.9% |
|
2 |
Cytonn Money Market Fund (Dial *809# or download Cytonn App) |
11.7% |
|
3 |
Nabo Africa Money Market Fund |
11.7% |
|
4 |
Etica Money Market Fund |
11.1% |
|
5 |
Ndovu Money Market Fund |
11.1% |
|
6 |
Enwealth Money Market Fund |
11.0% |
|
7 |
Lofty-Corban Money Market Fund |
11.0% |
|
8 |
Gulfcap Money Market Fund |
10.8% |
|
9 |
Kuza Money Market fund |
10.4% |
|
10 |
Jubilee Money Market Fund |
10.4% |
|
11 |
Old Mutual Money Market Fund |
10.3% |
|
12 |
British-American Money Market Fund |
9.9% |
|
13 |
Orient Kasha Money Market Fund |
9.9% |
|
14 |
Madison Money Market Fund |
9.9% |
|
15 |
Dry Associates Money Market Fund |
9.6% |
|
16 |
GenAfrica Money Market Fund |
9.6% |
|
17 |
SanlamAllianz Money Market Fund |
9.5% |
|
18 |
Apollo Money Market Fund |
9.5% |
|
19 |
KCB Money Market Fund |
9.4% |
|
20 |
Faulu Money Market Fund |
8.9% |
|
21 |
Genghis Money Market Fund |
8.8% |
|
22 |
CIC Money Market Fund |
8.5% |
|
23 |
CPF Money Market Fund |
8.3% |
|
24 |
Mali Money Market Fund |
8.3% |
|
25 |
ICEA Lion Money Market Fund |
8.2% |
|
26 |
Co-op Money Market Fund |
8.2% |
|
27 |
Absa Shilling Money Market Fund |
7.5% |
|
28 |
Mayfair Money Market Fund |
6.8% |
|
29 |
AA Kenya Shillings Fund |
6.2% |
|
30 |
Ziidi Money Market Fund |
6.1% |
|
31 |
Stanbic Money Market Fund |
5.6% |
|
32 |
Equity Money Market Fund |
4.9% |
Source: Business Daily
Liquidity:
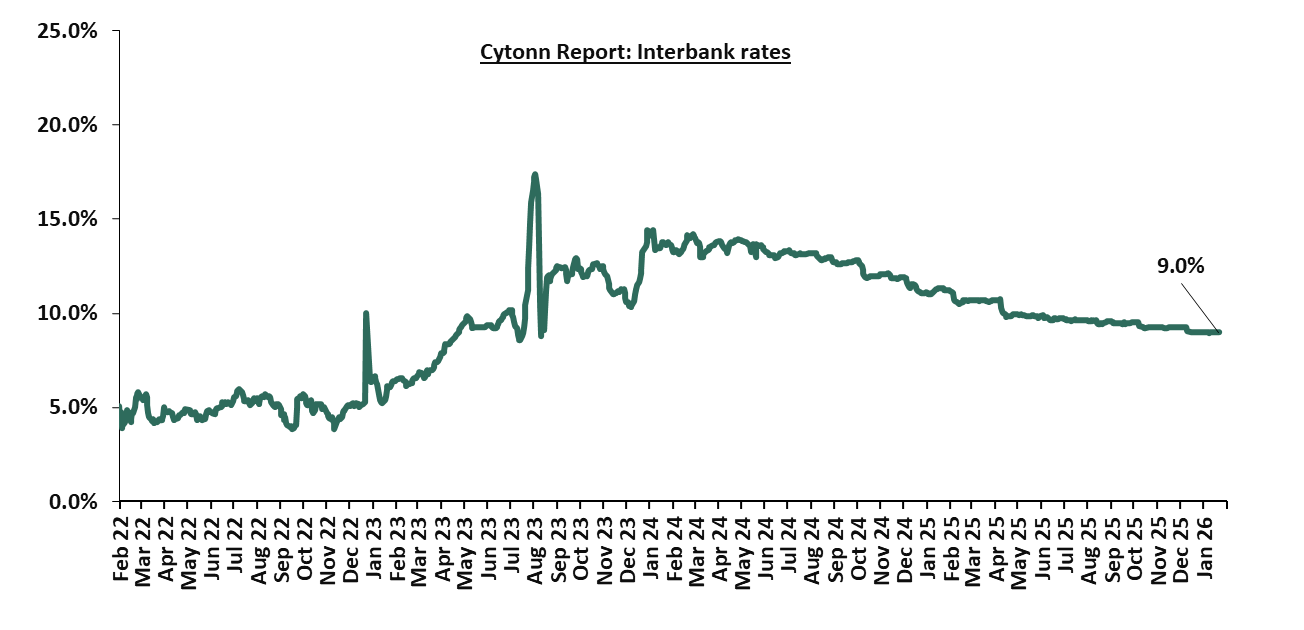
During the week, liquidity in the money markets tightened with the average interbank rate increasing by 0.2 bps to remain relatively unchanged at 9.0% compared to last week, partly attributable to tax remittances that offset government payments. The average interbank volumes traded decreased by 20.7% to Kshs 12.1 bn from Kshs 15.2 bn recorded the previous week. The chart below shows the interbank rates in the market over the years:
Kenya Eurobonds:
During the week, the yields on the Eurobonds were on a downward trajectory with the yield on the 30-year Eurobond issued in 2018 decreasing the most by 11.0 bps to 8.8% from 8.9%, recorded the previous week. The table below shows the summary performance of the Kenyan Eurobonds as of 22nd January 2026;
|
Cytonn Report: Kenya Eurobond Performance |
|||||||
|
|
2018 |
2019 |
2021 |
2024 |
2025 |
||
|
Tenor |
10-year issue |
30-year issue |
7-year issue |
12-year issue |
13-year issue |
7-year issue |
11-year issue |
|
Amount Issued (USD) |
1.0 bn |
1.0 bn |
0.9 bn |
1.2 bn |
1.0 bn |
1.5 bn |
1.5 bn |
|
Years to Maturity |
2.5 |
22.5 |
1.7 |
6.7 |
8.8 |
5.5 |
10.5 |
|
Yields at Issue |
7.3% |
8.3% |
7.0% |
7.9% |
6.2% |
10.4% |
9.9% |
|
2-Jan-26 |
6.1% |
8.8% |
- |
7.2% |
7.8% |
7.1% |
|
|
15-Jan-26 |
6.2% |
8.9% |
- |
7.2% |
7.9% |
7.0% |
|
|
16-Jan-26 |
6.2% |
8.9% |
- |
7.2% |
7.9% |
7.0% |
|
|
19-Jan-26 |
6.2% |
8.9% |
- |
7.2% |
7.9% |
7.0% |
|
|
20-Jan-26 |
6.4% |
9.1% |
- |
7.5% |
8.2% |
7.3% |
|
|
21-Jan-26 |
6.3% |
8.9% |
- |
7.4% |
8.0% |
7.1% |
10.0% |
|
22-Jan-26 |
6.1% |
8.8% |
- |
7.2% |
7.9% |
6.9% |
|
|
Weekly Change |
(0.1%) |
(0.1%) |
- |
(0.0%) |
(0.1%) |
(0.1%) |
0.0% |
|
MTD Change |
0.0% |
0.0% |
- |
0.0% |
0.0% |
(0.2%) |
0.0% |
|
YTD Change |
0.0% |
0.0% |
- |
0.0% |
0.0% |
(0.2%) |
0.0% |
Source: Central Bank of Kenya (CBK) and National Treasury
Kenya Shilling:
During the week, the Kenya Shilling appreciated against the US Dollar by 0.8 bps, to remain relatively unchanged at Kshs 129.3 compared to last week. On a year-to-date basis, the shilling has appreciated by 2.3 bps against the dollar, lower than the 22.9 bps appreciation recorded in 2025.
We expect the shilling to be supported by:
- Diaspora remittances standing at a cumulative USD 5,036.7 mn in the 12 months to December 2025, 1.9% higher than the USD 4,945.2 mn recorded over the same period in 2024. In the December 2025 diaspora remittances figures, North America remained the largest source of remittances to Kenya accounting for 53.3% in the period, and,
- Tourism inflows, which strengthened significantly. Tourism receipts reached Kshs 560.0 bn in 2025, up from Kshs 452.2 bn in 2024, representing a 23.9% increase, supported by improved international arrivals through the country’s major airports, and,
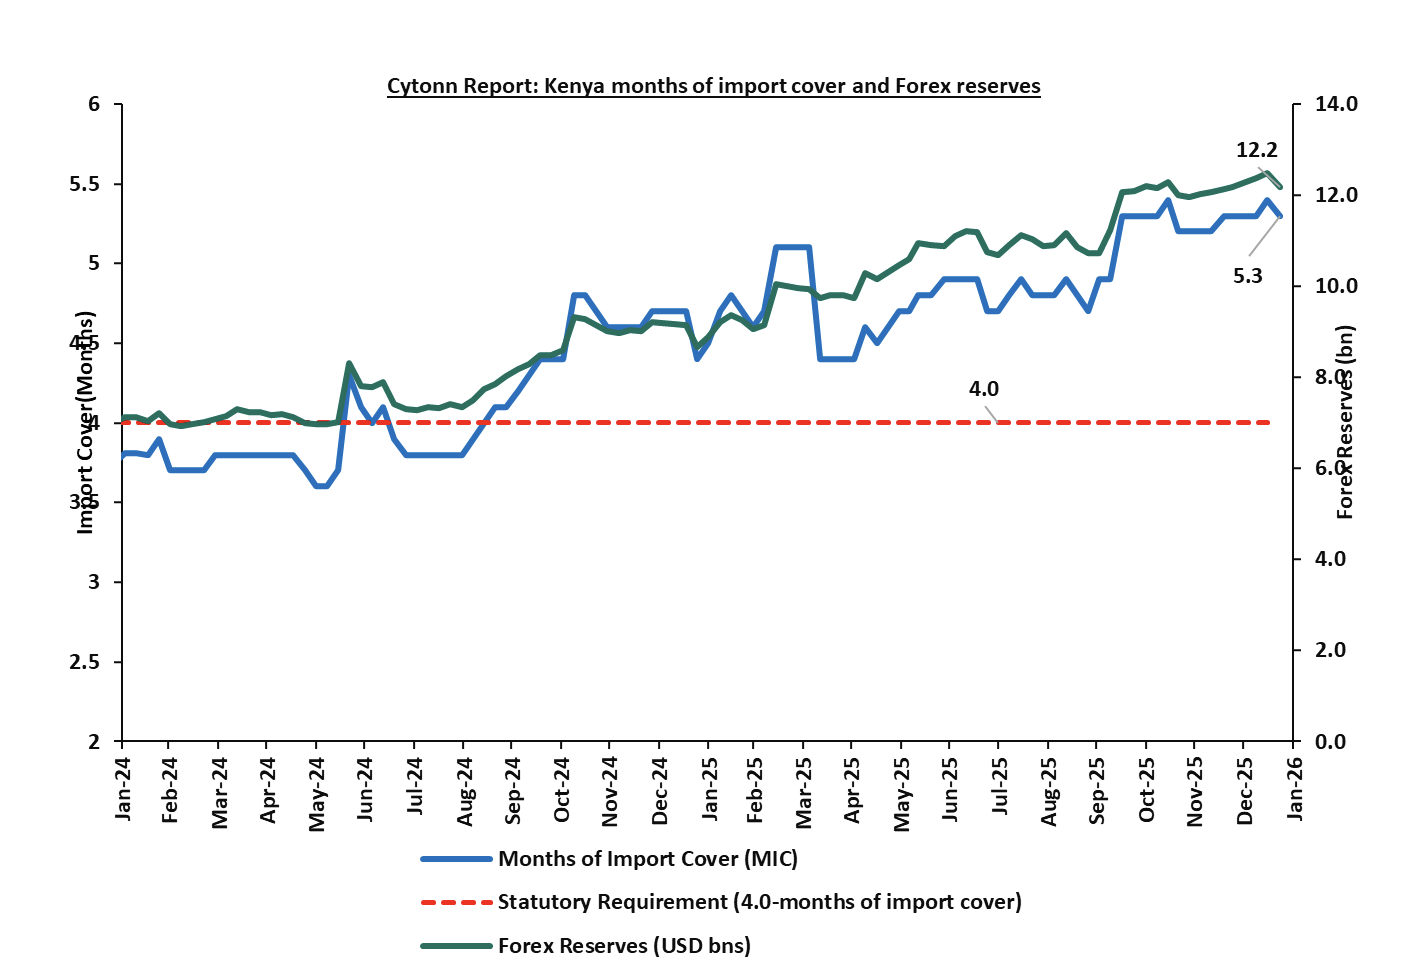
- Improved forex reserves currently at USD 12.2 bn (equivalent to 5.3-months of import cover), which is above the statutory requirement of maintaining at least 4.0-months of import cover and above the EAC region’s convergence criteria of 4.5-months of import cover.
The shilling is however expected to remain under pressure in 2025 as a result of:
- An ever-present current account deficit which came at 2.2% of GDP in the twelve months to October 2025, and,
- Elevated government debt servicing obligations, which continue to exert pressure on foreign exchange reserves, given that 59.7% of Kenya’s external debt is US Dollar-denominated as of June 2025, sustaining demand for hard currency in 2026.
Kenya’s forex reserves decreased by 2.1% during the week to USD 12.2 bn from the USD 12.5 bn recorded the previous week, equivalent to 5.3 months of import cover, and above the statutory requirement of maintaining at least 4.0-months of import cover.
The chart below summarizes the evolution of Kenya's months of import cover over the years:
Weekly Highlights
- January 2026 Inflation projection
We are projecting the y/y inflation rate for January 2026 to decrease marginally to within a range of at 4.3%-4.4%, mainly on the back of:
- Appreciation of the Kenya Shilling against the US Dollar – The Kenya Shilling has recorded a 1.1 bps month-to-date appreciation as of 20th January to Kshs 129.0 from Kshs 129.1 recorded at the beginning of the month. This appreciation in the exchange rate could ease inflationary pressures, making imported goods more affordable.
- Decrease in Fuel prices in January 2026 – The Energy and Petroleum Regulatory Authority (EPRA) released their monthly statement on the maximum retail fuel prices in Kenya, effective from 15th January 2025 to 14th February 2026. Notably, the maximum allowed prices for Super Petrol, Diesel and Kerosene decreased by Kshs 2.0, Kshs 1.0 and Kshs 1.0 per litre to Kshs 182.5, Kshs 170.5 and Kshs 153.8 per litre from Kshs 184.5, Kshs 171.5 and Kshs 171.5 per litre respectively in December 2025, the first decrease in 4 months, with the last being on September 2025. This decrease in fuel prices may ease pressure on inflation, given fuel's significant role in transportation and production costs across the economy.
We, however, expect that inflation rate will, however, be weighed down by:
- The decrease in the Central Bank Rate (CBR) by 25.0 bps to 9.00% from 9.25% – The CBK Monetary Policy Committee has continued adopting an accommodative monetary policy stance, reducing the Central Bank Rate (CBR) by a cumulative 225.0 bps to 9.00% from 11.25% at the beginning of 2025. Notably, the MPC cut the Central Bank Rate (CBR) by 25.0 bps in December 2025, lowering it to 9.00% from 9.25% in October 2025. This continued reduction in the CBR will likely increase the money supply through lower borrowing costs, causing a slight rise in inflation pressures as the effects of the CBR continue to gradually take hold in the broader economy.
Going forward, we expect inflationary pressures to remain anchored in the short term, remaining within the CBK’s target range of 2.5%-7.5% aided by the stability of the Kenya Shilling against the US Dollar. However, risks remain, particularly from the potential for increased demand-driven inflation due to the ongoing accommodative monetary policy stance. The decision to lower the CBR to 9.00% during the latest MPC meeting will likely increase money supply, in turn increasing inflation, especially with further cuts expected in the coming meetings. The CBK’s ability to balance growth and inflation through close monitoring of both inflation and exchange rate stability will be key to maintaining inflation within the target range.
- Kenya Revenue Authority registers Strong performance in December 2025
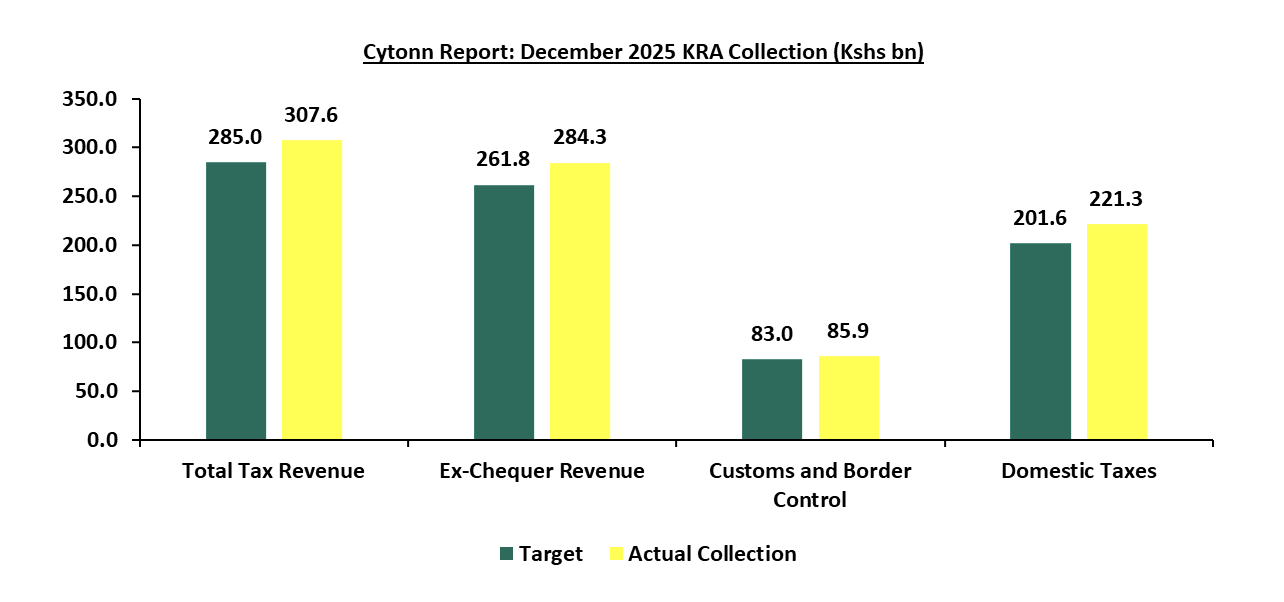
The Kenya Revenue Authority (KRA) delivered a strong revenue performance in December 2025, exceeding targets across all key categories. Total tax revenue amounted to Kshs 307.6 bn against a target of Kshs 285.0 bn, translating to a performance rate of 108.0%.
Ex-chequer revenue reached Kshs 284.3 bn compared to a target of Kshs 261.8 bn, representing 108.6% achievement. Customs and Border Control collections stood at Kshs 85.9 bn versus a target of Kshs 83.0 bn, equivalent to 103.5% of target, while Domestic Taxes recorded Kshs 221.3 bn against a target of Kshs 201.6 bn, achieving 109.8%.
Overall, the results reflect broad-based revenue strength, with domestic taxes and ex-chequer collections providing the main uplift to December’s outperformance. This performance signals strong revenue mobilisation capacity by KRA, supported by resilient domestic economic activity and improved tax compliance. KRA remains optimistic about meeting the overall revenue target for the FY 2025/26, which stands at Kshs 2.968 tn.
The chart below shows the performance across different sections;
Rates in the Fixed Income market have been on a downward trend due to easing inflation, strong money market liquidity, and the government’s rejection of high-priced bids supporting yield curve normalization. The government is 102.6% ahead of its prorated net domestic borrowing target of Kshs 364.5 bn, having a net borrowing position of Kshs 738.3 bn (inclusive of T-bills). Going forward, we anticipate stabilization across the short to medium end of the yield curve as the government increasingly turns to external borrowing to sustain its fiscal position, thereby easing pressure on the domestic market. In this environment, investors are expected to shift towards longer-dated securities to lock in the prevailing high yields.
Market Performance:
The equities market recorded a mixed performance, with NSE 25, NASI and NSE 20 gaining by 0.4%, 0.4% and 0.3% respectively, while NSE 10 declined by 0.3% taking the YTD performance to gains of 4.0%, 3.9%, 3.6% and 2.7% for NSE 20, NASI, NSE 25 and NSE 10 respectively. The equities market performance was mainly driven by gains recorded by large cap stocks such as NCBA, ABSA, and Cooperative Bank of 8.3%, 2.7% and 1.9% respectively. However, the performance was weighed down by losses recorded by large cap stocks such as EABL, KCB, and Stanbic of 3.6%,1.1%, and 1.0% respectively;
Also, during the week, the banking sector index gained by 1.0% to 215.8 from 213.6 recorded the previous week. This is attributable to gains recorded by stocks such as NCBA, ABSA, and Cooperative Bank of 8.3%, 2.7% and 1.9% respectively. However, the performance was weighed down by losses recorded by stocks such as KCB, Stanbic, and DTBK of 1.1%, 1.0%, and 0.8% respectively;
During the week, equities turnover increased by 9.3% to USD 23.9 mn from USD 21.8 mn recorded the previous week, taking the YTD total turnover to USD 73.6 mn. Foreign investors remained net sellers for the second consecutive week with a net selling position of USD 4.3 mn, from a net selling position of USD 8.6 mn recorded the previous week, taking the YTD foreign net selling position to USD 12.4 mn, compared to a net selling position of USD 92.9 mn recorded in 2025;
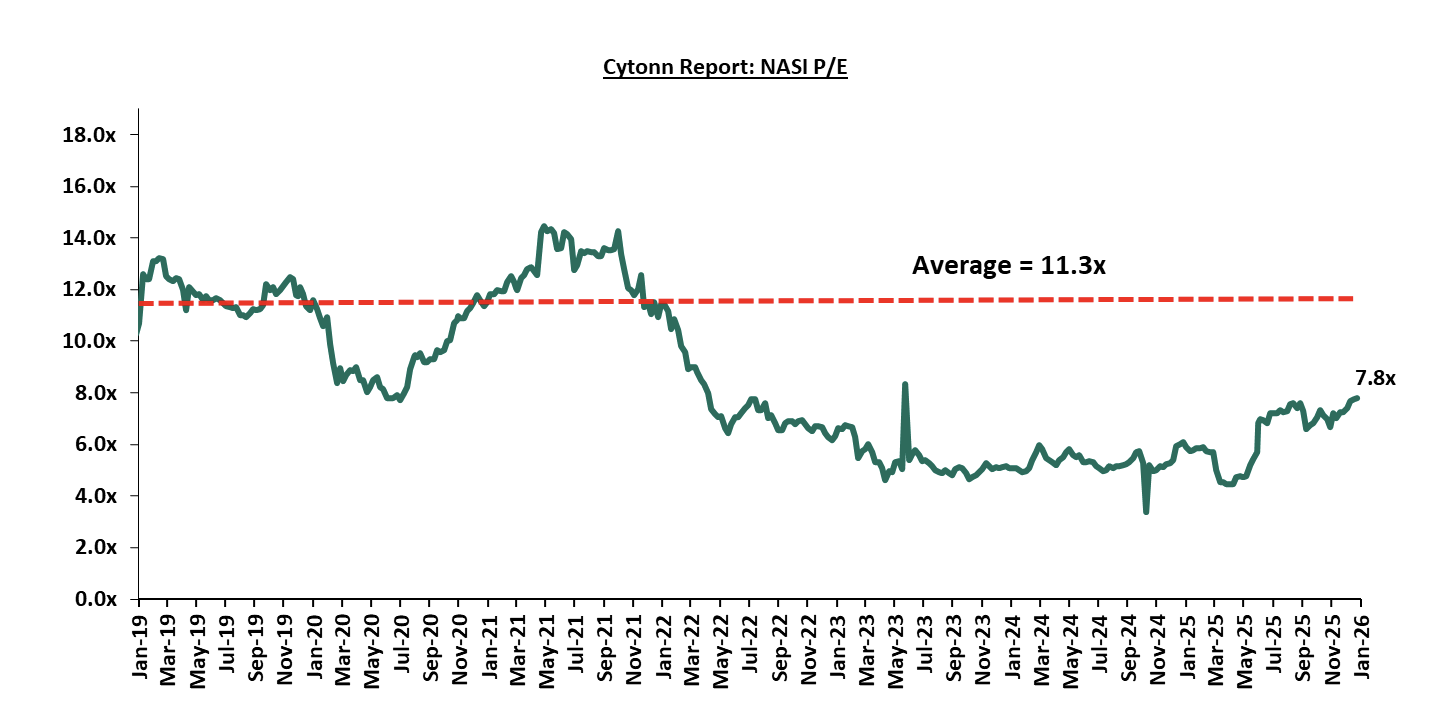
The market is currently trading at a price to earnings ratio (P/E) of 7.8x, 31.2% below the historical average of 11.3x. The dividend yield stands at 5.1%, 0.4% points above the historical average of 4.7%. Key to note, NASI’s PEG ratio currently stands at 1.0x, an indication that the market is fairly valued relative to its future growth. A PEG ratio greater than 1.0x indicates the market may be overvalued while a PEG ratio less than 1.0x indicates that the market is undervalued;
The charts below indicate the historical P/E and dividend yields of the market; 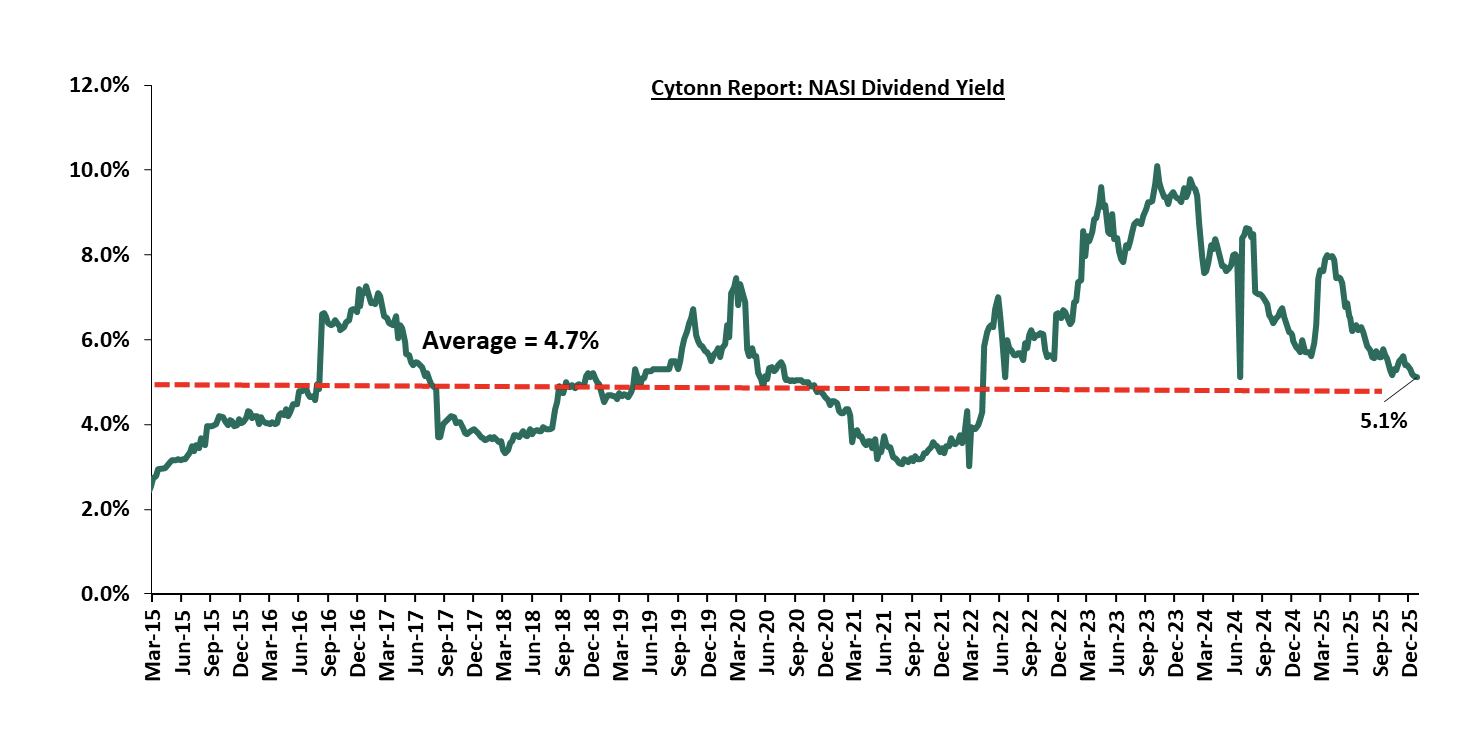
Universe of Coverage:
|
Cytonn Report: Equities Universe of Coverage |
|||||||||||
|
Company |
Price as at 16/01/2026 |
Price as at 23/01/2026 |
w/w change |
YTD Change |
Year Open 2026 |
Target Price* |
Dividend Yield |
Upside/ Downside** |
P/TBv Multiple |
Recommendation |
|
|
Standard Chartered Bank |
309.3 |
307.8 |
(0.5%) |
2.7% |
299.8 |
354.6 |
14.6% |
29.8% |
1.8x |
Buy |
|
|
I&M Group |
45.0 |
45 |
0.1% |
5.1% |
42.8 |
53.1 |
6.7% |
24.7% |
0.8x |
Buy |
|
|
Co-op Bank |
27.0 |
27.5 |
1.9% |
14.9% |
23.9 |
31.5 |
5.5% |
20.2% |
1.0x |
Buy |
|
|
Diamond Trust Bank |
118.0 |
117 |
(0.8%) |
2.0% |
114.8 |
129.4 |
6.0% |
16.6% |
0.4x |
Accumulate |
|
|
Equity Group |
69.0 |
68.8 |
(0.4%) |
2.6% |
67.0 |
75.2 |
6.2% |
15.6% |
1.2x |
Accumulate |
|
|
Stanbic Holdings |
200.0 |
198 |
(1.0%) |
0.1% |
197.8 |
205.5 |
10.5% |
14.3% |
1.2x |
Accumulate |
|
|
ABSA Bank |
25.8 |
26.5 |
2.7% |
6.4% |
24.9 |
28.3 |
6.6% |
13.6% |
1.7x |
Accumulate |
|
|
Jubilee Holdings |
334.8 |
330.0 |
(1.4%) |
2.3% |
322.5 |
354.3 |
4.1% |
11.4% |
0.5x |
Accumulate |
|
|
KCB Group |
67.5 |
66.8 |
(1.1%) |
1.5% |
65.8 |
71.0 |
4.5% |
10.9% |
0.8x |
Accumulate |
|
|
NCBA |
90.0 |
97.5 |
8.3% |
14.7% |
85.0 |
101.3 |
5.6% |
9.5% |
1.6x |
Hold |
|
|
Britam |
9.3 |
9.8 |
4.7% |
7.7% |
9.1 |
10.5 |
0.0% |
7.6% |
0.9x |
Hold |
|
|
CIC Group |
4.6 |
4.6 |
(0.6%) |
1.3% |
4.5 |
4.8 |
2.8% |
6.1% |
1.3x |
Hold |
|
|
*Target Price as per Cytonn Analyst estimates **Upside/ (Downside) is adjusted for Dividend Yield ***Dividend Yield is calculated using FY’2024 Dividends |
|||||||||||
Weekly Highlights
- Proposed Acquisition of a Controlling Stake in NCBA Group PLC by Nedbank Group Limited
During the week, NCBA Group PLC issued a cautionary announcement following receipt of a Notice of Intention from Nedbank Group Limited to acquire approximately 1.1 bn ordinary shares, representing approximately 66.0% of NCBA’s issued share capital, from NCBA shareholders through a partial tender offer, subject to regulatory approvals. If successfully completed, the transaction will result in Nedbank acquiring a controlling interest in NCBA, while the remaining 34.0% of the shares will remain listed on the Nairobi Securities Exchange (NSE). Below shows the current shareholding (before) and the assumption if the tender is fully subscribed (after);
|
NCBA shareholding |
|||||
|
Before |
After (If Tender is fully subscribed) |
||||
|
Name of Shareholder |
Number of shares |
% Shareholding |
Name of Shareholder |
Number of shares |
% Shareholding |
|
First Chartered Securities Limited |
246,149,354 |
14.90% |
Nedbank Group Limited |
1,087,362,891 |
66.0% |
|
Enke Investments Limited |
217,497,023 |
13.20% |
First Chartered Securities Limited |
83,690,780 |
5.08% |
|
D&M Management Services LLP |
190,130,070 |
11.50% |
Enke Investments Limited |
73,948,988 |
4.49% |
|
Brookshire Limited |
142,142,031 |
8.60% |
D&M Management Services LLP |
64,644,224 |
3.92% |
|
Westpoint Nominees Limited |
126,661,231 |
7.70% |
Brookshire Limited |
48,328,291 |
2.93% |
|
Yana Investments Limited |
89,069,204 |
5.40% |
Westpoint Nominees Limited |
43,064,819 |
2.61% |
|
Kahuho Holdings Limited |
67,602,884 |
4.10% |
Yana Investments Limited |
30,283,529 |
1.84% |
|
Rivel Kenya Limited |
64,206,673 |
3.90% |
Kahuho Holdings Limited |
22,984,981 |
1.40% |
|
Makimwa Consultants Limited |
48,587,307 |
3.00% |
Rivel Kenya Limited |
21,830,269 |
1.33% |
|
MTC Trust Corporate Services Limited – A/C NCBA Group ESOP |
21,829,633 |
1.30% |
Makimwa Consultants Limited |
16,519,684 |
1.00% |
|
Others |
433,644,122 |
26.30% |
MTC Trust Corporate Services Limited – A/C NCBA Group ESOP |
7,422,075 |
0.45% |
|
|
|
|
Others |
147,439,001 |
8.95% |
|
Total |
1,647,519,532 |
100.00% |
Total |
1,647,519,532 |
100.00% |
**Table Assumption: 100% participation by all shareholders up to the 66.0% entitlement
Key highlights of the proposed transaction include:
- The proposed acquisition will be implemented via a partial tender offer open to all NCBA shareholders, with Nedbank acquiring shares only from those shareholders who elect to participate in the offer, on a pro-rata basis
- Nedbank has received irrevocable undertakings from shareholders representing approximately 71.2% of NCBA’s issued shares, committing to accept the tender offer in respect of their pro-rata entitlement, subject to the final terms and conditions of the offer
- If the tender offer is fully subscribed, Nedbank will hold approximately 66.0% of NCBA’s issued share capital, with the remaining 34.0% continuing to be held by public shareholders and listed on the NSE. Nedbank has also indicated that its final shareholding will not exceed its target by more than 5.0%, in line with takeover regulations
- The proposed transaction values NCBA at approximately 1.4x its book value, with consideration structured as 20.0% payable in cash and 80.0% payable through the issuance of Nedbank ordinary shares listed on the Johannesburg Stock Exchange (JSE). The share consideration component will be subject to applicable regulatory approvals and customary exceptions, including circumstances where settlement in Nedbank shares is not permissible due to jurisdictional, regulatory, legal or shareholder-specific restrictions, in which case affected shareholders will receive cash consideration in lieu of Nedbank shares, in accordance with the terms of the Tender Offer
- Nedbank Group Limited is a diversified financial services group headquartered in South Africa, with a primary listing on the JSE and a secondary listing on the Namibia Securities Exchange. The group has an established footprint across Southern Africa and international operations in markets including London, Dubai, Jersey and the Isle of Man
NCBA operates across Kenya, Uganda, Tanzania, Rwanda, Ivory Coast and Ghana, with 122 branches serving over 75.0 mn customers, holding assets of approximately Kshs 665.0 bn, and disbursing over Kshs 1.0 tn in digital loans annually, positioning it as a leading financial services provider in East Africa
The transaction aligns with Nedbank’s stated strategy to expand beyond Southern Africa into high-growth markets, with East Africa identified as a key growth corridor, and Kenya serving as the anchor market for regional expansion.
Nedbank has expressed its intention to preserve NCBA’s brand, governance structures, management team and operational model, with no immediate integration of systems, given Nedbank currently only operates a representative office in East Africa.
The proposed acquisition is subject to approvals from the Capital Markets Authority (CMA), the Central Bank of Kenya, and other relevant regulatory and competition authorities across the jurisdictions in which NCBA operates. Following the announcement of the proposed transaction, NCBA’s share price recorded a positive market reaction, rising to Kshs 98.25 from Kshs 89.75 prior to the announcement post-announcement, representing a 9.5% gain, as investors priced in the potential change in control and strategic upside from Nedbank’s entry
The proposed acquisition of NCBA Group PLC by Nedbank Group Limited represents a significant strategic development for the East African banking sector and constitutes a shareholder-level change in control rather than an operational restructuring, with NCBA expected to continue operating under its existing brand, governance framework and regional footprint. While market sentiment is likely to remain sensitive to developments around the tender offer given its potential impact on NCBA’s share price, the transaction positions NCBA to benefit from Nedbank’s strong balance sheet, cross-border expertise and expanded capital base, while providing Nedbank with a scalable platform for East African growth. Importantly, the transaction also carries positive implications for the Nairobi Securities Exchange and Kenya’s capital markets, reinforcing Kenya’s attractiveness to strategic foreign investors, supporting market depth through the retention of a listed minority float, and underscoring the NSE’s role as a regional hub for large-scale financial sector transactions, while maintaining continuity for customers, employees and minority shareholders.
- Kenya Pipeline Company Intial Public Offer (IPO)
During the week, Kenya Pipeline Company Plc (KPC) launched an Initial Public Offer (IPO) at the Nairobi Securities Exchange through an Offer for Sale, marking one of the largest capital markets listings in East Africa and a key milestone in Kenya’s privatisation agenda. The IPO offers investors access to a strategic national infrastructure asset with stable cash flows, strong margins, and a dividend-oriented investment profile, as the government seeks to unlock value from mature state-owned enterprises
The offer involves the sale of a 65.0% stake, equivalent to 11.8 bn shares, at an offer price of Kshs 9.00 per share, targeting gross proceeds of Kshs 106.3 bn and implying a post-listing market capitalization of approximately Kshs 163.6 bn. The shares will be listed on the NSE Main Investment Market Segment, with the offer running from 19th January 2026 to 19th February 2026 and trading expected to commence on 9th March 2026 as shown in the table below:
|
Cytonn Report: Summary of Key Details of the KPC IPO |
|
|
Item |
Details |
|
Offer Type |
Offer for Sale |
|
Shares on Offer |
11,812,644,350 |
|
Percentage Offered |
65.0% |
|
Offer Price per share |
Kshs 9.00 |
|
Expected Gross Proceeds |
Kshs 106.3 bn |
|
Implied Market Capitalization |
Kshs 163.6 bn |
|
Listing Segment |
NSE Main Investment Market Segment |
|
Offer period |
19th January 2026 – 19th February 2026 |
|
Commencement of trading at NSE |
9th March 2026 |
Source: KPC IPO Information Memorandum
Upon completion of the IPO, KPC will transition from full government ownership to a mixed public–private ownership structure, with the Government of Kenya retaining a 35.0% strategic stake that will be locked in for two years to support governance continuity and post-listing price stability. The offer features a broad-based investor allocation across Kenyan retail and institutional investors, EAC investors, foreign investors, Oil Marketing Companies, and KPC employees, aimed at promoting wide participation, employee ownership, and enhanced market liquidity.
The transaction is anchored on the Privatization Act of October 2025 and aligns with the government’s broader divestment and fiscal strategy. All proceeds from the IPO will accrue to the Government of Kenya and are expected to support the FY’2025/26 financing plan, with funding directed toward commercially viable infrastructure projects.
KPC’s higher Price-to-Book (P/B) and Price-to-Earnings (P/E) ratios are difficult to justify relative to its modest dividend yield and profitability metrics. For a mature utility business, this valuation implies limited upside and increases the risk of downside normalization toward sector averages. Therefore, while the IPO provides exposure to a defensive, dividend-paying company, from a risk-adjusted perspective, there are more attractively priced investment opportunities in the market, making this a cautious hold for value-focused investors. For more information, please check our KPC IPO note.
We are “Bullish” on the Equities markets in the short term due to current attractive valuations, lower yields on short-term government papers and expected global and local economic recovery, and, “Neutral” in the long term due to persistent foreign investor outflows. With the market currently trading at par to its future growth (PEG Ratio at 1.0x), we believe that investors should reposition towards value stocks with strong earnings growth and that are trading at discounts to their intrinsic value. We expect the current high foreign investors sell-offs to continue weighing down the economic outlook in the short term.
- Infrastructure Sector
Reopening of the Kijabe Railway Line
During the week, the Kenya Railways Corporation announced that it has completed the reconstruction of the Uplands-Kijabe-Longonot Metre Gauge Railway which was destroyed when the Mai Mahiu dam burst its banks in April 2024 which also led to the death of more than 60 people. Some parts of the railway were also washed away by heavy rains which rendered it impassable.
The reopening of the Kijabe railway line represents a significant improvement to Kenya’s transport infrastructure by restoring a critical section of the metre-gauge railway network that supports national and regional logistics. The repairs undertaken following the Mai Mahiu tragedy strengthen the resilience of rail infrastructure against climate-related disruptions, while also improving the reliability of freight movement between the Port of Mombasa, the Rift Valley, and Western Kenya. By shifting heavy cargo back to rail, the line reduces strain on road infrastructure, lowers highway maintenance costs, and enhances overall network efficiency.
We expect that the reopening of the Kijabe railway line will go beyond disaster recovery and signals progress in building a more resilient and efficient infrastructure system in Kenya. It strengthens freight logistics, supports regional trade, and reduces pressure on roads, all while aligning with sustainable transport objectives. As Kenya continues to invest in modern and climate-resilient infrastructure, such projects will be essential in driving economic growth, improving connectivity, and positioning the country as a reliable transport hub in the region.
- Real Estate Investments Trusts
- PIDG to Acquire 33% Stake in Africa Logistics Properties
During the week, the Private Infrastructure Development Group (PIDG) announced it will take up 33% of Africa Logistics Properties’ dollar denominated Industrial Income Property Fund (IPF). The fund which is backed by six governments such as the United Kingdom, Netherlands, Switzerland, Australia, Sweden and Canada has committed to invest up to Kshs 1.9 bn to become the anchor investor in the Real Estate Investment Trust.
The investment into an industrial real estate vehicle highlights growing confidence in Kenya’s REITs sector as a credible and scalable investment platform. It signals a shift toward diversification beyond traditional office and retail assets, introducing logistics and warehousing as income-generating property classes with stable demand. Institutional participation strengthens market credibility, improves liquidity prospects, and supports the use of REITs as efficient capital-raising tools, which can attract more long-term investors and accelerate the overall growth of the REITs market in Kenya.
Overall, the investment highlights a gradual maturation of Kenya’s REITs sector, where diversified property assets and institutional capital are beginning to converge. By supporting industrial real estate through structured investment vehicles, REITs can play a more meaningful role in financing economic infrastructure while offering investors stable, long-term returns. Continued growth in this space would deepen capital markets, enhance real estate financing options, and position REITs as a key pillar in Kenya’s investment landscape.
- REITs Weekly Performance
On the Unquoted Securities Platform, Acorn D-REIT and I-REIT traded at Kshs 27.4 and Kshs 23.2 per unit, respectively, as per the last updated data on 5th December 2025. The performance represented a 33.4% and 14.5% gain for the D-REIT and I-REIT, respectively, from the Kshs 20.0 inception price. The volumes traded for the D-REIT and I-REIT came in at 12.8 mn and 41.2 mn shares, respectively, with a turnover of Kshs 323.5 mn and Kshs 791.5 mn, respectively, since inception in February 2021. Additionally, ILAM Fahari I-REIT traded at Kshs 11.0 per share as of 5th December 2025, representing a 45.0% loss from the Kshs 20.0 inception price. The volume traded to date came in at 1.2 mn shares for the I-REIT, with a turnover of Kshs 1.5 mn since inception in November 2015.
REITs offer various benefits, such as tax exemptions, diversified portfolios, and stable long-term profits. However, the ongoing decline in the performance of Kenyan REITs and the restructuring of their business portfolios are hindering significant previous investments. Additional general challenges include:
- Insufficient understanding of the investment instrument among investors leading to a slower uptake of REIT products,
- Lengthy approval processes for REIT creation,
- High minimum capital requirements of Kshs 100.0 mn for REIT trustees compared to Kshs 10.0 mn for pension funds Trustees, essentially limiting the licensed REIT Trustee to banks only
- The rigidity of choice between either a D-REIT or and I-REIT forces managers to form two REITs, rather than having one Hybrid REIT that can allocate between development and income earning properties
- Limiting the type of legal entity that can form a REIT to only a trust company, as opposed to allowing other entities such as partnerships, and companies,
- We need to give time before REITS are required to list – they would be allowed to stay private for a few years before the requirement to list given that not all companies maybe comfortable with listing on day one, and,
- Minimum subscription amounts or offer parcels set at Kshs 0.1 mn for D-REITs and Kshs 5.0 mn for restricted I-REITs. The significant capital requirements still make REITs relatively inaccessible to smaller retail investors compared to other investment vehicles like unit trusts or government bonds, all of which continue to limit the performance of Kenyan REITs.
We expect the performance of Kenya’s Real Estate sector to remain resilient, supported by several factors: i) Re-opening of the Kijabe Railway line and the investment of PIDG in the Africa Logistics properties – dollar denominated industrial income property fund. However, challenges such as weak investor appetite in listed REITs like ILAM Fahari I-REIT and high capital requirements will continue to constrain the sector’s optimal performance.
National Social Security schemes are created by governments to form the first pillar of social security. In Africa, Kenya was the second country after Ghana to form a national security scheme, The National Social Security Fund (NSSF), done in 1965 through an Act of Parliament (Cap 258). It is a provident fund, which provides benefits to retiring members as a lump sum rather than through periodic payments. In recent years, discussions around the growth and reform of the NSSF have gained momentum, with key considerations on how to increase coverage, especially for the informal sector, and improve service delivery. As such, we saw it fit to cover a topical on the Kenyan National Social Security Fund to shed light on the Kenyan National Social Security Fund to shed light on the fourth phase of the NSSF Act, 2013 deductions, effective 1st February 2026, the financial performance for the year ended 30th June 2025, recent developments and provide recommendations to improve efficiency. We shall do this by taking a look into the following:
- Introduction to the National Social Security Fund,
- Financial Performance for the year ended 30th June 2025,
- Recent Developments at the National Social Security Fund,
- Factors hindering growth of the NSSF,
- Key considerations to improving NSSF in Kenya, and,
- Conclusion.
Section I: Introduction to the National Social Security Fund
Social security is defined as any programme of social protection established by legislation, or any other mandatory arrangement, that provides individuals with a degree of income security when faced with the contingencies of old age, survivorship, incapacity, disability, or unemployment. In Kenya, the National Social Security Fund (NSSF) offers social protection to all Kenyan workers in the formal and informal sectors by providing a platform to make contributions during their productive years to cater for their livelihoods in old age and the other consequences resulting from unprecedented occurrences such as death or invalidity among others.
The National Social Security Fund (NSSF) has evolved over time having been established in 1965 through an Act of Parliament Cap 258 of the Laws of Kenya. The Fund initially operated as a Department of the Ministry of Labor until 1987 when the NSSF Act was amended transforming the Fund into a State Corporation under the Management of a Board of Trustees. The Act was established as a mandatory national scheme whose main objective was to provide basic financial security benefits to Kenyans upon retirement. The Fund was set up as a Provident Fund providing benefits in the form of a lump sum. Thereafter, the National Social Security Fund (NSSF) Act, No.45 of 2013 was assented to on 24th December 2013 and commenced on 10th January 2014 thereby transforming NSSF from a Provident Fund to a Pension Scheme. Every Kenyan with an income was required to contribute a percentage of his/her gross earnings so as to be guaranteed basic compensation in case of permanent disability, basic assistance to needy dependents in case of death, and a monthly life pension upon retirement. The Act establishes two funds namely;
- Pension Fund, and,
- Provident Fund
NSSF has gained traction over the years, but particularly in the last three years, owing to implementation of the NSSF Act of 2013, which came into effect in February 2023 and is currently in its third year of implementation. The fourth phase of the Act will begin in February 2026. The Act increased contributions to the fund from the initial Kshs 400.0 to 12.0% of individuals' income, with the employee and employers both contributing 6.0% each. As of June 2025, total assets held by NSSF stood at Kshs 558.0 bn, a 17.0% increase from Kshs 476.8 bn in December 2024. On y/y basis the assets under management increased by 43.2% from Kshs 389.7 bn in June 2024, attributable to the higher member contributions as a result of the second phase of the implementation of the NSSF Act of 2013, which increased monthly contributions leading to higher fund inflows. The graph below shows the movement of the Fund’s Assets Under Management from 2020 to 2025:
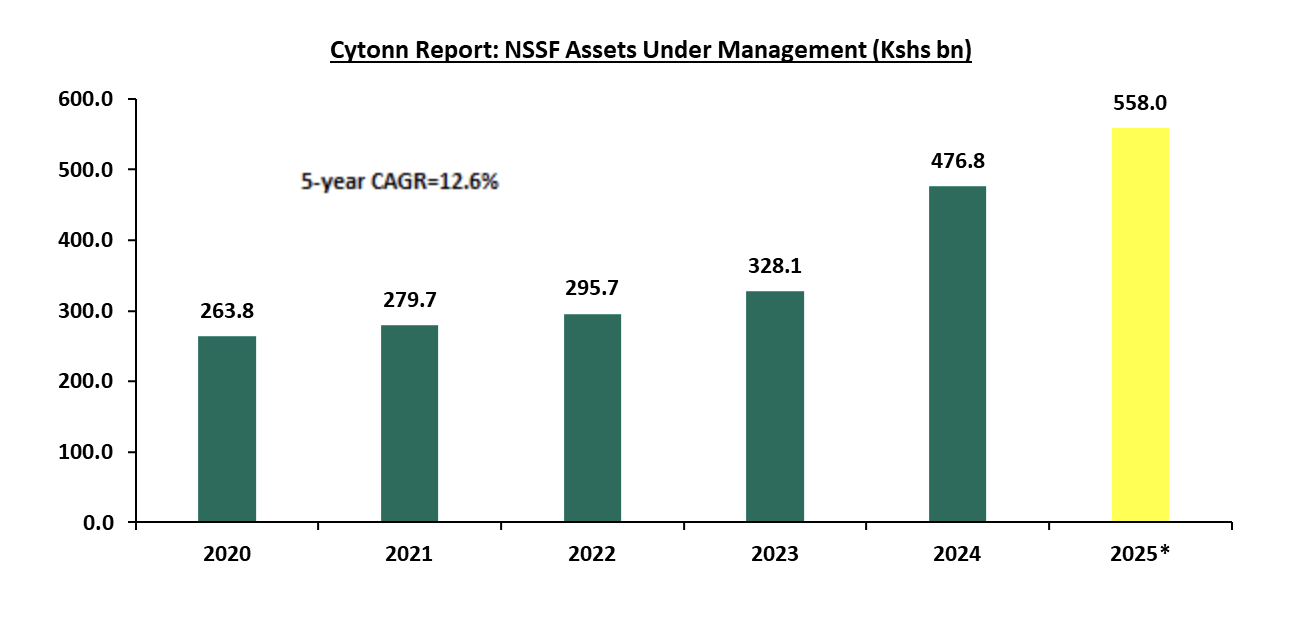
Source: RBA Annual Reports & NSSF Audited Financials FY’2024/25 2025* data as of June 2025
According to the latest Retirement Benefits Authority (RBA) Annual Report, 7.2% of the NSSF’s total assets, amounting to Kshs 40.1 bn was managed internally by NSSF, while the remaining Kshs 518.0 bn was held by seven external fund managers. A breakdown of NSSF’s investment portfolio as of June 2025 reveals a strong preference for government securities, which accounted for 63.7% of total assets. This significant allocation is both strategic and common among pension schemes due to the safety, stability, and credibility associated with government bonds. These instruments offer guaranteed returns, minimal default risk, and predictable income streams, aligning well with the long-term investment horizon of pension funds. Beyond government securities, quoted equities made up 15.3% of the portfolio, reflecting NSSF’s exposure to publicly traded companies, while immovable property comprised 6.4% of the portfolio and 3.2% in fixed deposits. The chart below shows NSSF total assets spread as of June 2025:
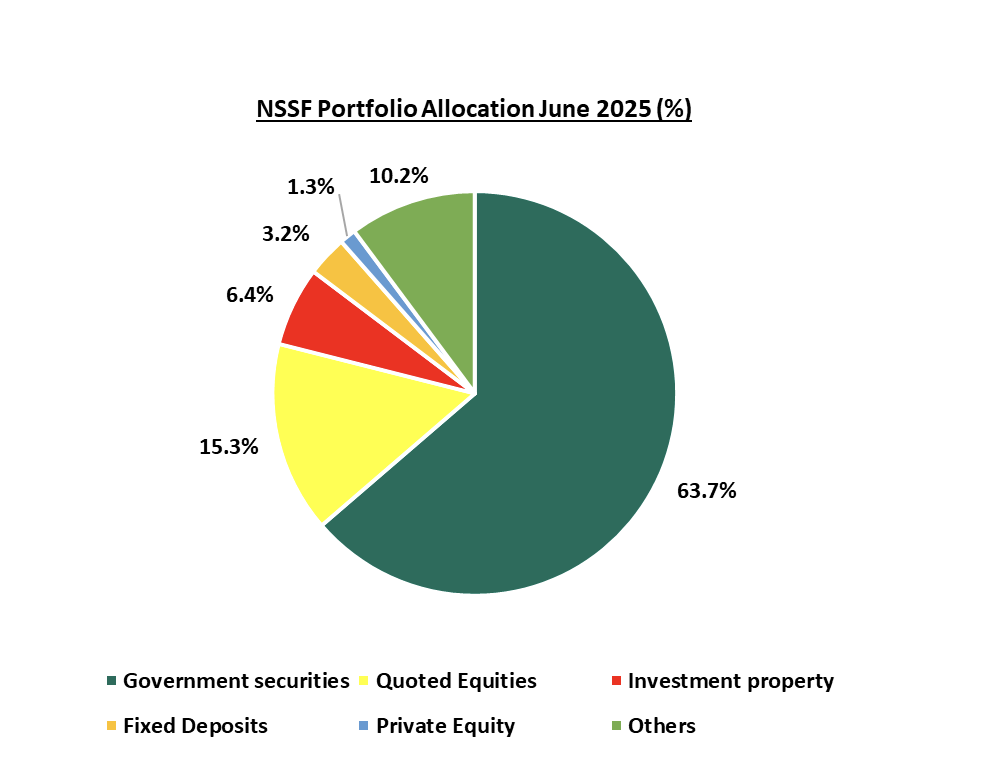
Source: Kenya Gazette, NSSF Audited Financials FY’2024/25
Section II: Financial Year 2024/2025 Financial Performance
From the latest financial reports, the National Social Security Fund (NSSF) recorded a significant 96.1% net increase in funds to Kshs 172.6 bn for the period ending 30th June 2025, from Kshs 88.0 bn in a similar period in 2024. This was mainly driven by the 152.5% increase in the net investment income to Kshs 105.3 bn in FY’2024/25 from Kshs 41.7 bn in FY’2022/23, coupled with a 43.1% growth in the net contributions to Kshs 75.2 bn in FY’2024/25 from Kshs 52.6 bn in FY’2023/24. The performance was however weighed down by the 23.2% increase in total operating costs to Kshs 8.5 bn, from Kshs 6.9 bn in FY’2023’24. The table below shows a breakdown of NSSF statement of changes in net assets for the year ended 30th June 2025:
|
Cytonn Report: NSSF Statement of Change in Net Assets |
|||
|
|
FY'2023/24 |
FY'2024/25 |
y/y change |
|
Kshs (bn) |
Kshs (bn) |
||
|
Dealings with Member Funds |
|
|
|
|
Remitted Member Contributions |
59.1 |
81.9 |
38.5% |
|
Unremitted Member Contributions |
3.1 |
2.0 |
(35.4%) |
|
Total Contributions Receivable |
62.3 |
84.0 |
34.8% |
|
Benefits Paid |
(9.7) |
(8.7) |
(10.1%) |
|
Net Contributions |
52.6 |
75.2 |
43.1% |
|
Investment Income |
|
|
|
|
FV Gain (Loss) on Revaluation of Investments |
3.0 |
46.1 |
1441.2% |
|
FV Gain (Loss) on Realization of Investments |
(0.2) |
4.6 |
2,214.0% |
|
Investment Income |
39.6 |
55.8 |
40.8% |
|
Investment Management Expenses |
(0.7) |
(1.1) |
59.8% |
|
Net Investment Income |
41.7 |
105.3 |
152.5% |
|
Other Income |
0.6 |
0.6 |
(9.7%) |
|
Net Revenue |
42.3 |
105.9 |
150.1% |
|
Total Operating Costs |
(6.9) |
(8.5) |
23.2% |
|
Net Increase in Fund |
88.0 |
172.6 |
96.1% |
|
Net Assets as Previously Stated |
312.1 |
400.1 |
28.2% |
|
Net Assets |
400.1 |
572.8 |
43.1% |
Source: Kenya Gazette Vol. CXXVIII—No. 14, NSSF Audited Financials FY’2024/25
Key take outs from the table include:
- Net contributions increased by 43.1% to Kshs 75.2 bn in FY’2024/25 from Kshs 52.6 bn in FY’2023/24 attributable to the 34.8% increase in the total contributions receivable to Kshs 84.0 bn, from Kshs 62.3 bn in FY’2023/25, coupled with the 10.1% decrease in the benefits paid to Kshs 8.7 bn in FY’2024/25 from Kshs 9.7 bn in FY’2023/24,
- Net Investment Income grew by 152.5% to Kshs 105.3 bn in FY’2024/25 from Kshs 41.7 bn in FY’2023/24 attributable to a 40.8% increase in the investment income to Kshs 55.8 bn from Kshs 39.6 bn in FY’2023/2024, but was weighed down by the 59.8% increase in management expenses to Kshs 1.1 bn from Kshs 0.7 bn in FY’2023/24,
- Net revenue increased by 150.1% to Kshs 105.9 bn in FY’2024/25 from Kshs 42.3 bn in FY’2023/24,
- Total operating costs increased by 23.2% to Kshs 8.5 bn in FY’2024/25 from Kshs 6.9 bn in FY’2023/24 attributable to the 17.3 % increase in administrative costs to Kshs 8.2 bn from Kshs 7.0 bn in FY’2023/24. Investment management expenses increased by 59.8% to Kshs 1.1 bn from Kshs 0.7 bn in FY’2023/24 resulting in a 26.6% increase in the total expenses to Kshs 9.6 bn in FY’2024/25 from Kshs 7.6 bn in a similar period in 2024. Despite this increase in the Fund’s total expenses, total expenses to total assets ratio decreased by 0.2% points to 1.7% for the year ending June 2025 from 1.9% in a similar period in 2024 remaining above the maximum threshold which is in violation of Section 50 of the National Social Security Fund Act, 2013, that stipulates that the Fund shall not pay out more than 2.0% of its total assets in the first six years of its operation, and not more than 1.5% thereafter, and,
- Benefits paid decreased by 10.1% to Kshs 8.7 bn in FY’2024/25 from Kshs 9.7 bn in FY’2023/24. Notably, payment of claims after retirement has also evolved over time growing at a 5-year CAGR of 8.2% to Kshs 8.7 bn in FY’2024/25 from Kshs 5.9 bn recorded in FY’2020/21. The graph below shows the benefits payout over the last five years;
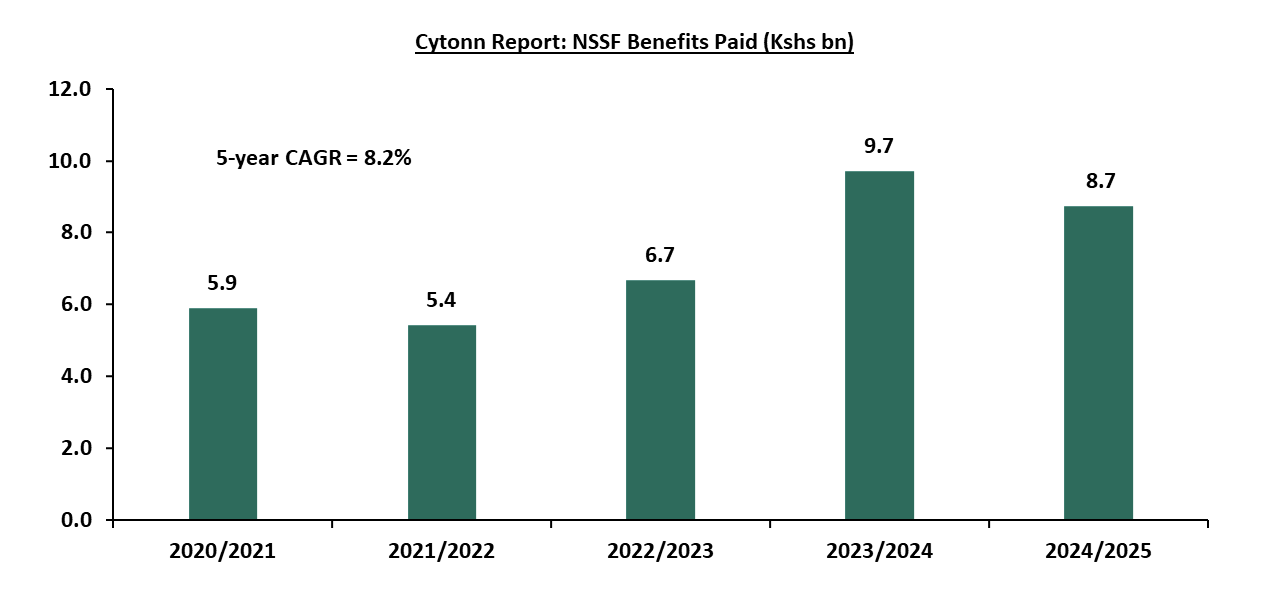
Source: Kenya Gazette Vol. CXXVIII—No. 14, NSSF Audited Financials FY’2024/25
The table below shows the NSSF statement of net assets available for benefits as of 30th June 2025:
|
Cytonn Report: NSSF Statement of Net Assets Available for Benefits |
|||||||
|
Investment Assets |
FY'2023/24 (a) |
FY'2024/25 (b) |
% Allocation FY'2023/24 (c) |
%Allocation FY'2024/25 (d) |
y/y %change (a-b) |
% points change (c-d) |
|
|
Government Securities |
253.8 |
355.4 |
65.1% |
63.7% |
40.0% |
(1.4%) |
|
|
Quoted Stocks |
61.2 |
85.1 |
15.7% |
15.3% |
39.1% |
(0.4%) |
|
|
Eurobonds |
7.2 |
34.3 |
1.8% |
6.1% |
378.3% |
4.3% |
|
|
Term and Demand Deposits |
11.4 |
18.0 |
2.9% |
3.2% |
57.3% |
0.3% |
|
|
Accrued Income |
10.9 |
14.2 |
2.8% |
2.6% |
30.1% |
(0.3%) |
|
|
Private Equity |
3.3 |
7.3 |
0.8% |
1.3% |
120.7% |
0.5% |
|
|
TPS Loans |
2.5 |
2.1 |
0.7% |
0.4% |
(18.1%) |
(0.3%) |
|
|
Corporate Bonds |
1.7 |
1.6 |
0.4% |
0.3% |
(8.7%) |
(0.2%) |
|
|
Money Market Funds |
0.0 |
0.2 |
0.0% |
0.04% |
- |
0.04% |
|
|
Others |
37.6 |
39.8 |
9.6% |
7.1% |
6.0% |
(2.5%) |
|
|
Total |
389.7 |
558.0 |
100.0% |
100.0% |
43.2% |
|
|
Source: Kenya Gazette Vol. CXXVIII—No. 14, NSSF Audited Financials FY’2024/25
Key take outs from the table include:
- Government securities remained with the largest investment allocation, coming in at 63.7% in June 2025, a decline from 65.1% recorded in June 2024. Similarly, the amounts invested in government securities as of 30th June 2025 recorded a 40.0% increase to Kshs 355.4 bn, from Kshs 253.8 bn recorded at the end of FY’2023/24. Notably, on a y/y basis the allocation government securities decreased marginally by 1.4% points from 65.1% allocation recorded in FY’2023/24 mainly attributable to the low yields on government papers over the period,
- Quoted stocks recorded a decline in their investment allocation, decreasing by 0.4% points to 15.3% at the end of June 2025, from 15.7% at the end of June 2024. However, equity funds recorded a 39.1% growth in AUM to Kshs 85.1 bn in FY’2024/25, up from Kshs 61.2 bn in FY’2024/25. The increase in AUM is largely attributable to increased market activity, with the Nairobi All Share Index (NASI) registering a 22.4% gain in the six months to June 2025, as well as an improved business environment as evidenced by Purchasing Manager’s Index (PMI) registering an average of 50.5, in the six months to June 2025, from an average of 50.0 in a similar period in 2024.
- Private Equity recorded a significant 120.7% growth to Kshs 7.3 bn in June 2025, up from Kshs 3.3 bn in June 2024. Similarly, the allocation increased by 0.5% points to 1.3%, from the 0.8% recorded in a similar period in 2024, highlighting the Fund’s diversification efforts,
- The fund diversified into investment in Money Market Funds in FY’2024/25, allocating Kshs 204.0 mn, which represented 0.04% of the total investment assets. This indicates that NSSF has begun exploring low-risk, liquid investment options to enhance diversification and stability, and,
- The Fund took exposure on Eurobonds investing Kshs 34.3 bn, equivalent to 6.1% of the total investment assets and this is a result of Kenya’s February and October 2025 Eurobonds issuance attracting institutional investors like NSSF seeking competitive yields.
The Fund’s returns increased by 10.0% points to 22.0% in FY’2024/25 from 12.0% recorded in a similar period in 2024. NSSF has recorded an average return of 10.3% over the last five years with the highest return recorded in 2025. The graph below shows the performance of the Fund’s returns over the last 5 years:
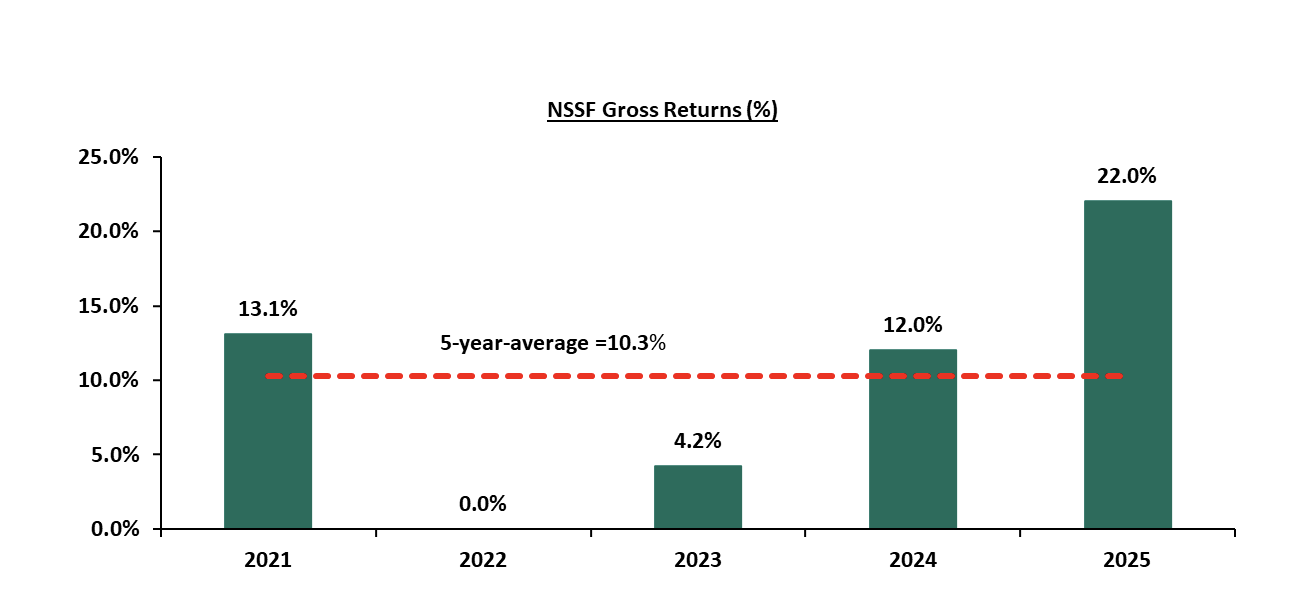
Source: Kenya Gazette Vol. CXXVIII—No. 14, NSSF Audited Financials FY’2024/25
Despite the government making NSSF mandatory, Kenya’s saving culture still lags behind in comparison to other more developed countries partly attributable to low disposable income with 16.0% of the Kenyan population as of 2024 living below the poverty line coupled with lack of sufficient knowledge on the importance of saving for retirement. The graph below shows the gross savings to GDP of select countries in the Sub-Saharan Africa Region and the developed economies;
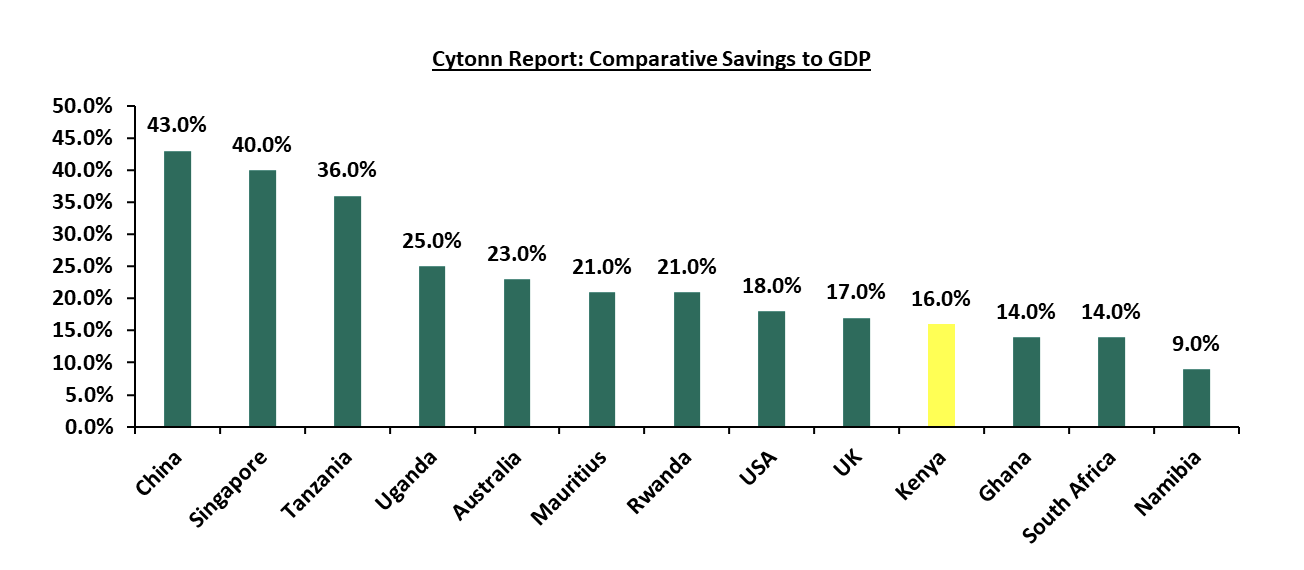
Source: World Bank
Section III: Recent Developments at the National Social Security Fund
In early 2025, Kenya’s National Social Security Fund (NSSF) ushered in a pivotal chapter of its evolution, marking the third year of implementing the transformative NSSF Act of 2013, with the fourth phase of implementation scheduled to commence in February 2026. With the stroke of new contribution limits effective 1st February 2026, the fund has broadened its reach, pulling more of workers’ earnings into the fold of pension savings. The lower earnings threshold will edge up from Kshs 8,000 to Kshs 9,000, while the upper limit will soar from Kshs 72,000 to Kshs 108,000, doubling the ceiling for contributions.
- Adjustments to NSSF Contribution Limits - Effective February 1, 2026, the contribution limits governing pensionable income will be adjusted, reflecting an ambitious push to secure stronger retirement benefits for workers. The lower earnings limit, previously set at Kshs 8,000, will rise to Kshs 9,000, lifting the minimum monthly contribution from Kshs 480 to Kshs 540 per employee, with employers matching this amount to total Kshs 1,080 for Tier I. Meanwhile, the upper earnings limit will increase by 50%, leaping from Kshs 72,000 to Kshs 108,000. This shift pushes the maximum contribution to Kshs 6,480 per employee, matched equally by employers, resulting in a combined total of Kshs 12,960 for those earning Kshs 108,000 or more. For an employee earning Kshs 50,000, the deduction will remain unchanged at Kshs 3,000, while for an employee earning Kshs 80,000, the deduction will increase to Kshs 4,800 from Kshs 4,320, illustrating how these changes reach across income brackets, capturing a larger slice of salaries for pension savings. The table below illustrates the changes in NSSF contribution rates between 2025 and 2026 across various gross salary levels:
|
Cytonn Report: Comparison of NSSF Contribution Rates by Gross Salary (2025 vs 2026) |
|||||
|
Gross Salary |
2025 Rates |
2026 Rates |
|
||
|
Employee contribution |
Total employee + employer contributions |
Employee contribution |
Total employee + employer contributions |
% Difference |
|
|
9,000 |
540 |
1,080 |
540 |
1,080 |
0.0% |
|
72,000 |
4,320 |
8,640 |
4,320 |
8,640 |
0.0% |
|
80,000 |
4,320 |
8,640 |
4,800 |
9,600 |
11.1% |
|
100,000 |
4,320 |
8,640 |
6,000 |
12,000 |
38.9% |
|
108,000 |
4,320 |
8,640 |
6,480 |
12,960 |
50.0% |
This expansion, however, is a double-edged sword. For employees, particularly those at the lower end of the income spectrum, the increase from Kshs 480 to Kshs 540 trims take-home pay by an additional Kshs 60 monthly, a modest figure that nonetheless bites into budgets already stretched by rising costs. Total contributions for mid-tier earners earning between Kshs 9,000 and Kshs 72,000 will remain unchanged, while high earners earning Kshs 108,000 and above will see their contributions increase by 50.0% to Kshs 6,480 from Kshs 4,320, promising greater retirement security at the expense of current liquidity. Employers, too, feel the weight of these adjustments. A business with a handful of employees earning above Kshs 108,000 now shoulders an additional Kshs 2,160 per worker each month, a burden that could strain small enterprises or prompt larger firms to rethink staffing strategies. Yet, there’s a potential relief valve: employers with private pension schemes can opt out of Tier II contributions, redirecting funds to approved alternatives, though this requires navigating regulatory hoops. The adjustments, effective from February this year, are summarized as follows:
|
Cytonn Report: NSSF Contribution Limits Adjustments |
||
|
|
Year 3 (Previous Rates) |
Year 4 (New Rates Commenced February 2026) |
|
Lower Limit (Tier 1) |
8,000 |
9,000 |
|
Total Contribution by Employee |
480 |
540 |
|
Total Contribution by Employer |
480 |
540 |
|
Total Tier 1 NSSF Contributions |
960 |
1,080 |
|
Upper Limit (Tier 2) |
72,000 |
108,000 |
|
Contribution on Upper Limit (6% of Upper Limit Less Lower Limit) |
64,000 |
99,000 |
|
Total Contribution by Employee |
3,840 |
5,940 |
|
Total Contribution by Employer |
3,840 |
5,940 |
|
Total Tier 2 NSSF Contributions |
7,680 |
11,880 |
|
Total NSSF Contributions |
8,640 |
12,960 |
Source: www.nssf.or.ke
- Public Private Partnership in the Mau-Summit Road - NSSF is investing Kshs 25.0 bn in a 30-year investment in a Public- Private Partnership (PPP), partnering with China Road and Bridge Corporation (CRBC). The project involves upgrading the Nairobi-Nakuru-Mau Summit Highway section of the A8 highway into a tolled dual carriageway. The PPP is based on a Design, Build, Finance, Operate, Maintain and Transfer (DBFOMT) model, under which the two entities will design, build, finance, operate, and maintain the road, recover their investment through user tolls, and transfer the asset to the public sector at the end of the 30-year concession period. The Kshs 25.0 bn represents 4.5% of the NSSF’s current Assets Under Management, and remains within the RBA maximum limit of 10% for investments in debt instruments used to finance infrastructure projects approved under the Public Private Partnerships Act, 2013. NSSF is investing in the Nairobi–Nakuru–Mau Summit Highway to diversify members’ savings into higher-return, long-term infrastructure assets that are more resilient than traditional investments. The project aligns with the government’s push for Public-Private Partnerships to fund critical infrastructure amid constrained public debt and reduced access to multilateral financing. Backed by toll revenues, the highway offers a secure, predictable income stream that supports pensioners’ returns while contributing to national socio-economic development.
- Stagnation in NSSF Bond Trading Investigation - The investigation into alleged irregular bond trading at NSSF, launched by the Capital Markets Authority (CMA) in September 2024, has shown no significant progress by January 23, 2026. The probe targeted transactions between May and July 2024, during which bonds were reportedly purchased at above-market prices and, in other instances, sold at a loss before being repurchased days later at higher prices, potentially benefiting select individuals. Initial momentum including summons of Central Bank of Kenya (CBK) and CMA officials by the National Assembly’s Finance and National Planning Committee has dissipated. Challenges include delays in accessing digital communication evidence and a leaked internal letter that may have compromised the inquiry by alerting suspects to delete data. The Committee also cited disruption from other urgent government matters, including the budgeting process. However, it aims to resume the probe after returning from recess in February 2026. The lack of updates suggests operational or political hurdles in enforcing financial oversight, undermining confidence in CMA’s regulatory capacity. With NSSF’s total assets at Kshs 558.1 bn as of June 2025, any unresolved mismanagement could erode member returns, highlighting systemic risks in transparency and governance within Kenya’s pension sector.
- NSSF’s Divestment from EAPCC - The National Social Security Fund (NSSF) recently divested its 27.0% stake in East African Portland Cement Company (EAPCC) for Kshs 1.6 billion to Kalahari, a strategic move aimed at strengthening the Fund’s long-term financial position and refocusing its investment portfolio. By offloading the stake to Kalahari Cement Ltd, the NSSF unlocked value from a long-held investment that had faced operational and performance challenges, allowing the Fund to reallocate capital into assets with potentially stronger and more stable returns for members. The transaction, which received full regulatory approval from the CMA, CAK and relevant government ministries, reduced NSSF’s exposure to sector-specific risk while supporting the recapitalization and revival of EAPCC under a new majority shareholder. For the Fund, the sale underscores a broader shift toward active portfolio management, liquidity enhancement, and protection of contributors’ savings, reinforcing NSSF’s mandate to safeguard and grow retirement funds in a sustainable and prudent manner.
Section IV: Factors Hindering the Growth of NSSF
The growth of Kenya’s National Social Security Fund (NSSF) has been constrained by a combination of interconnected factors affecting its efficiency, financial stability, and capacity to deliver sufficient retirement benefits. In this regard, we examine the key challenges that have hindered the fund’s growth as follows:
- Unremitted Contributions - The fund has struggled with unremitted contributions from state corporations, government-owned enterprises, and semi-autonomous agencies. By the end of FY’2024/25, unremitted member contributions to the NSSF had declined to Kshs 2.0 bn, reflecting an improvement compared to the previous year at Kshs 3.1 bn but still representing a substantial gap. This gap underscores a widening funding gap that jeopardizes the fund’s capacity to fulfill its retirement obligations,
- Leadership and Governance Issues - The NSSF has struggled with ongoing governance challenges, including accusations of mismanagement and corruption. Probes into corruption allegations involving senior officials have eroded trust in the fund's leadership. The NSSF has faced persistent governance issues, including allegations of mismanagement and corruption. Investigations into corruption allegations involving senior officials at the NSSF have undermined confidence in the fund’s management. Senior officials have been accused of suspicious irregular bond dealings between May and July 2024 in order to generate illegal profits for the participants. This has sparked demands for reforms; however, progress has been hindered by bureaucratic obstacles and resistance from vested interests. The absence of strong governance has led to inefficiencies and continued mismanagement,
- High Unemployment Rate in Kenya - The unemployment rate in Kenya stood at 5.4% at the end of 2024; Largely due to the country's economic development challenges, coupled with a growing youth population. This has raised the dependency ratio among the working population, making it harder for them to allocate funds toward social security contributions for their retirement. As a result, the National Social Security Fund (NSSF) faces slower growth, with fewer contributors limiting its ability to expand its asset base,
- Slow Economic Growth and Low Savings - Kenya’s economy has continued to experience modest growth, averaging 4.5% over the past five years and recording a GDP growth rate of 4.7% in 2024. Despite this, the country’s gross savings to GDP ratio stood at only 16.0% in 2024, underscoring the relatively low savings culture. This weak savings performance directly affects the ability of citizens to make regular contributions to the National Social Security Fund (NSSF). Inflationary pressures and rising costs of living further erode disposable income, making it difficult for both individuals and employers to meet their obligations. Consequently, contribution inflows remain subdued, limiting NSSF’s capacity to grow its asset base and provide adequate retirement benefits. Compared to economies with higher savings rates, Kenya’s low savings levels highlight the urgent need for reforms that encourage consistent contributions and strengthen long-term financial security.
- Government Interference – As a government-owned institution, the NSSF is directly affected by legislative changes, particularly increased taxation, which negatively impacts its growth and operations. Additionally, while the rise in NSSF contribution rates aims to enhance fund collections, it has also increased employment costs. Employers, required to match employee contributions, face higher expenses, discouraging formal employment and ultimately limiting overall contributions. This challenge is further exacerbated by Kenya’s already high unemployment rate. Critics have also argued that the NSSF reforms lacked sufficient public consultation, raising concerns about whether the NSSF Act met constitutional requirements for public participation. As a result, legal disputes and resistance have increased challenging the implemented reforms, further obstructing the growth and stability of NSSF,
- Accessing Funds After Retirement - A significant challenge facing NSSF is the difficulty retirees encounter when trying to access their rightful benefits. Many members report delays or outright non-payment of benefits, leaving them financially stranded at a time when they most depend on the Fund. These unremitted benefits mean that retirees, despite years of contributing, are unable to receive the pensions or lump-sum payments they are entitled to. The situation is worsened by administrative inefficiencies and bureaucratic hurdles, which slow down claim verification and disbursement. As a result, retirees often face prolonged uncertainty, forcing them to rely on family support or informal savings mechanisms while waiting for their entitlements. This undermines the very purpose of NSSF as a reliable retirement safety net and highlights the urgent need for reforms to ensure timely and guaranteed access to benefits, and,
- Limited Coverage in the Informal Sector- The informal sector constitutes the majority of Kenya’s workforce, including small-scale traders, artisans, casual laborers, and self-employed individuals. Despite its critical role in the economy, the National Social Security Fund (NSSF) has faced persistent challenges in extending coverage to this segment. Key barriers include limited awareness and financial literacy among informal workers, mistrust arising from past mismanagement and corruption scandals, and administrative systems that are primarily tailored to formal employment structures where payroll deductions are automated. Moreover, the irregular and unpredictable income patterns typical of informal work make it difficult for individuals to commit to consistent contributions, resulting in low participation rates or complete exclusion from the scheme. This gap not only undermines the NSSF’s ability to pool resources effectively but also leaves a significant portion of the population vulnerable to financial insecurity in retirement.
Section V: Key Considerations for Improving NSSF in Kenya
We note that the government has consistently tried to promote a savings culture in the country through various reforms, including raising contribution rates and making contributions mandatory. For instance, in the NSSF Act 2013, the government recommended a mandatory registration contribution to NSSF by employees and employers. The Act aimed to enhance the sustainability of retirement benefits for Kenyan workers. Key provisions of the Act include an increase in contribution rates, from a flat rate of Kshs 400.0 to 12.0% of an employee's monthly earnings, with 6.0% contributed by the employee and an equal amount by the employer.
However, the enactment of the Act has faced legal challenges. Multiple petitions were filed questioning its constitutionality, leading to a decision by the Employment and Labor Relations Court (ELRC). On September 19, 2022, in Kenya Tea Growers Association & 8 Others v. NSSF Board & Others, the ELRC ruled that the Act was unconstitutional on the basis of;
- The provisions of the NSSF Act, 2013 were not subjected to public participation and were not tabled before the Senate prior to its enactment as per constitutional requirements,
- Imposing mandatory registration and contribution to NSSF would have overburdened employees and consequently reduce disposable income since a vast majority of employees have their pay slips already strained due to their various financial commitments with other institutions and their subscription to other pensions schemes, and,
- The provisions of the Act would have given NSSF a competitive advantage thus making the Fund a monopoly in the provision of pension and social security services in the country.
After this ruling, the NSSF Board of Trustees filed an appeal, and the case eventually reached the Supreme Court of Kenya. The Supreme Court assessed whether the ELRC had the authority to determine the Act's constitutionality. In the end, the court upheld the ELRC’s jurisdiction but referred the case to the Court of Appeal for further review. In our opinion, the following are key actionable steps that can be considered to drive NSSF’s growth while striving to balance the interests of the government, employers, and employees.
- Mass education on developing a savings culture – It is essential to raise awareness among Kenyans about the importance of cultivating a savings culture. Many young people in the informal sector view retirement planning as something reserved for older generations rather than a necessary long-term financial strategy. In addition, a significant number of Kenyans rely on the expectation that their children will provide support in the future, which discourages them from voluntarily joining schemes such as the NSSF, even when they have a stable income. Public education is also needed on the provisions of the NSSF Act of 2013, highlighting its implications for employees, employers, and government, as well as the benefits it offers to all stakeholders,
- Ensure involvement of all stakeholders in NSSF reforms – For NSSF reforms to be effective and legally sound, it is essential that all stakeholders, including the general public, employees, employers, and government institutions are actively involved in the decision-making process. The failure to engage the public and secure Senate approval led to the suspension of the NSSF Act of 2013, which had proposed raising monthly contributions to Kshs 2,068 from Kshs 200. Because the law directly impacted county employees and devolved government finances, excluding these voices violated constitutional requirements for public participation. Had the reforms been properly consulted and implemented, the higher contributions would have significantly strengthened NSSF by creating a larger retirement fund and improving workers’ pension benefits compared to the current system,
- Enforcement of compliance from employers – Employer compliance with NSSF contributions remains a critical challenge, with unremitted amounts remaining high despite declining to Kshs 2.0 billion in FY 2024/25. To safeguard the fund’s sustainability, NSSF must strengthen enforcement mechanisms and close existing loopholes to ensure that all employers remit contributions in full and on time. A key solution lies in adopting integrated digital platforms that consolidate payroll-related contributions under one system. Such technology would enhance efficiency, enable real-time reconciliation of records, and make it easier to detect employers who partially remit payments or fail to comply altogether. Stronger monitoring, coupled with penalties for non-compliance, would not only protect employees’ retirement savings but also reinforce trust in the fund, and,
- Streamline operational efficiency – In the financial year ended 30th June 2025, NSSF’s total net assets rose by 43.1% to Kshs 572.8 bn from Kshs 400.1 bn in the same period the previous year. The total expenses increased by 26.6% to Kshs 9.6 bn in FY’2024/25 from Kshs 7.6 bn in FY’2023/24. This indicates that while some progress has been made in controlling costs relative to assets under management, further improvements are necessary to align with best practice benchmarks. To better serve the interests of contributors, beneficiaries, and other stakeholders, NSSF should adopt proactive measures aimed at enhancing operational efficiency, streamlining administrative processes, and reducing unnecessary expenditures. Such measures may include leveraging technology to automate routine functions, strengthening internal controls to curb wastage, renegotiating supplier contracts to achieve cost savings, and adopting performance-based budgeting. By implementing these reforms, NSSF can improve its financial sustainability, maximize returns for members, and reinforce public confidence in its ability to manage retirement savings responsibly.
- Openness and Transparency - Transparency is a cornerstone of effective pension fund management, as it builds trust among contributors, beneficiaries, and the wider public. According to the NSSF Act, the NSSF’s Board of Trustees should submit the Fund’s financial statements to the Auditor General within three months after the end of each financial year. However, the National Social Security Fund (NSSF) released its financial statements for the year ended 30th June 2025, on 23rd January 2026, more than six months past the statutory requirement, raising concerns about accountability and timely disclosure. In contrast, private pension schemes regulated by the Retirement Benefits Authority (RBA) are required to file audited accounts within three months of year‑end, ensuring that stakeholders have access to up‑to‑date information on fund performance, governance, and compliance. The same standard should be enforced for NSSF, given its critical role in safeguarding the retirement savings of millions of Kenyans.
Section VI: Conclusion
The National Social Security Fund (NSSF) has seen quite a turnaround in its performance due to its implemented strategies such as diversification of its investments in high yielding investments as well as increased contribution due to implementation of the revived NSSF Act of 2013. Some of the notable strides are reflected by the 43.2% y/y growth in the Assets Under Management to Kshs 558.0 bn as of June 2025. Additionally, the strong financial performance recorded in FY’2024/25 highlighted by an increase of 43.1% in net contributions to Kshs 75.2 bn and a significant 152.5% increase in net investment income to Kshs 105.3 bn. However, there are still some challenges that threatens its credibility and the financial security of its members that needs to be addressed. For countless retirees, the NSSF represents a lifetime of dedication and sacrifice, making the protection of their benefits essential. Restoring trust requires the establishment of robust oversight mechanisms, including independent audits and strict adherence to remittance timelines. Now is the time for all stakeholders including government, regulators, and fund management, to come together in a unified effort to strengthen the NSSF, ensuring it continues to secure the retirement futures of millions of Kenyans. Swift action is imperative, as it will help alleviate old-age poverty and provide a stable income to replace earnings in retirement.
Disclaimer: The views expressed in this publication are those of the writers where particulars are not warranted. This publication, which is in compliance with Section 2 of the Capital Markets Authority Act Cap 485A, is meant for general information only and is not a warranty, representation, advice or solicitation of any nature. Readers are advised in all circumstances to seek the advice of a registered investment advisor.

- Talk to us
- Kenya
- P.O Box 20695 - 00200, Nairobi, Kenya
- Cell +254709101200
- Tel +254709101200
- WhatsApp +254741676635
- United States
- +254709101200
- DOWNLOAD OUR APP
-


- Kenya
- 8th Floor, Pinetree Plaza, Kaburu Drive, Ngong Road, Nairobi, Kenya
- USA
- Suite 1150, 1775 Eye Street NW, USA, Washington DC 20006, USA
- Investments
- High Yield
- Private Equity
- Real Estate
- Real Estate
- RiverRun Estates
- Cytonn Towers
- The Ridge
- Taraji Heights
- The Alma