Kenya Retail Real Estate Sector Report 2019 & Cytonn Weekly #41/2019
By Research Team, Oct 13, 2019
Executive Summary
Fixed Income
During the week, T-bills remained undersubscribed, with the subscription rate rising to 98.3%, from 86.4% recorded the previous week. The increase in the subscription rate is partly attributable to a slight improvement in liquidity conditions in the money market during the week, which saw the average interbank rate declining to 7.0%, from 7.5% recorded the previous week. In the money markets, 3-month bank placements ended the week at 8.6% (based on what we have been offered by various banks), the 91-day T-bill came in at 6.4%, while the average of Top 5 Money Market Funds came in at 10.0%, unchanged from the previous week, with the Cytonn Money Market Fund closing the week at 10.9%, from 10.4% recorded the previous week;
Equities
During the week, the equities market recorded mixed performance with NASI and NSE 20 gaining by 0.3% and 0.7%, respectively, while the NSE 25 declined by 0.2%, taking their YTD performance to gains/losses of 5.1%, (13.4%) and (1.5%), for NASI, NSE 20, and NSE 25, respectively. During the week, Atlas Mara, which trades on the London Stock Exchange, announced the revaluation of four African banks in Rwanda, Zambia, Mozambique, and Tanzania that are expected to be acquired by Equity Group;
Private Equity
There was private equity activity in the real estate sector with Emerging Africa Infrastructure Fund (EAIF), an infrastructure fund managed by Investec Asset Management, investing Kshs 1.3 bn (USD 12.7 mn) in the green bond issued by Nairobi-based property developer Acorn Holdings. In the financial services sector, Washington-based International Financial Corporation (IFC), a member of World Bank Group, invested USD 10.0 mn in CardinalStone Capital Advisers Growth Fund, a private equity fund offering financing to SMEs in Nigeria and Ghana;
Real Estate
During the week, Nyeri County Government announced plans of developing a 64-units affordable housing project in Skuta, Nyeri while the Nairobi County Government also revealed plans put up 27,000 affordable housing units in areas such as Makongeni and Shauri Moyo within Nairobi’s Eastlands. In the commercial office sector, Sunbird Africa’s subsidiary, Kofisi, a flexible working spaces provider, opened a new office in Karen, and in the retail sector, Tuskys announced plans to take up the anchor tenant space at Nanyuki Mall, following the exit of Botswana-based retailer Choppies, while Java opened up a new fast food joint, Kukito, in Nairobi, along Kimathi Street -its 77th store in East Africa- and also revealed plans to diversify their business model to include more express outlets in schools and hospitals;
Focus of the Week
This week we focus on the retail sector in Kenya, where we update our 2018 Kenya Retail Sector Report. In this report, we cover the current state of the retail market in terms of supply, demand, drivers, challenges and performance as of 2019, in comparison with 2018, to gauge market trends and investment opportunities within the sector. In terms of performance, the retail sector in Kenya softened in 2019 with average rental yields declining by 1.6% points to 7.0% from 8.6% recorded in 2018 while average occupancy rates fell by 4.7% points to 75.1% from 79.8% recorded in 2018. With major cities such as Nairobi and Kisumu recording oversupply, the investment opportunity in the sector is in areas such as Kiambu County and Mt. Kenya region owing to a relatively high retail space supply gap of 0.8 mn and 0.2 mn SQFT, respectively.
- Cytonn Asset Managers Limited, the regulated affiliate of Cytonn Investments held a training for pension trustees at the Sarova Whitesands Hotel, Mombasa. The event was meant to educate the trustees on allocating to alternative investments to help increase the returns for their schemes. Read the event note here
- Phase 1 of The Alma is now 100% sold with early buyers having achieved up to 55% capital appreciation. Phase 2 is now open for sale. For inquiries, please email us on clientservices@cytonn.com. The site is open between 8 am - 5 pm, 7-days a week for site visits;
- Cytonn Money Market Fund closed the week at an average yield of 10.9% p.a. To subscribe, just dial *809#;
- For an exclusive tour of Cytonn’s real estate developments, visit: Sharp Investor’s Tour and for more information, email us at sales@cytonn.com;
- We continue to hold weekly workshops and site visits on how to build wealth through real estate investments. The weekly workshops and site visits target both investors looking to invest in real estate directly and those interested in high yield investment products to familiarize themselves with how we support our high yields. Watch progress videos and pictures of The Alma, Amara Ridge, and The Ridge;
- We continue to see very strong interest in our weekly Private Wealth Management Training (largely covering financial planning and structured products). The training is at no cost and is open only to pre-screened participants. We also continue to see institutions and investment groups interested in the training for their teams. Cytonn Foundation, under its financial literacy pillar, runs the Wealth Management Training. If interested in our Private Wealth Management Training for your employees or investment group, please get in touch with us through wmt@cytonn.com. To view the Wealth Management Training topics, click here;
- For recent news about the company, see our news section here;
- We have 10 investment-ready projects, offering attractive development and buyer targeted returns. See further details here: Summary of Investment-Ready Projects.
Money Markets, T-Bills & T-Bonds Primary Auction:
During the week, T-bills remained undersubscribed, with the subscription rate rising to 98.3%, from 86.4% recorded the previous week. The increase in the subscription rate is partly attributable to a slight improvement in liquidity conditions in the money market during the week, which saw the average inter-bank rate declining to 7.0%, from 7.5% recorded the previous week. The yield on the 91-day and 364-day papers remained unchanged at 6.4% and 9.8%, respectively, while the yield on the 182-day paper rose by 0.1% points to 7.3%, from 7.2% recorded the previous week. The acceptance rates increased to 71.7%, from 55.2% recorded the previous week, with the government accepting Kshs 16.9 bn out of the Kshs 23.6 bn worth of bids received.
For the month of October, the National Treasury is issuing a tax-exempt 16-year Kshs 60 bn infrastructure bond with market determined coupon rates for the purpose of financing the infrastructure projects in the FY 2019/20 budget estimates. The period of sale is from 2nd October to 22nd October 2019. As per the historical trend, we expect the infrastructure bond to attract a lot of interest due to its tax-free incentive that translates to higher returns, thus recording higher subscription rates than other Treasury Bonds. We shall give our bidding range in next week’s report.
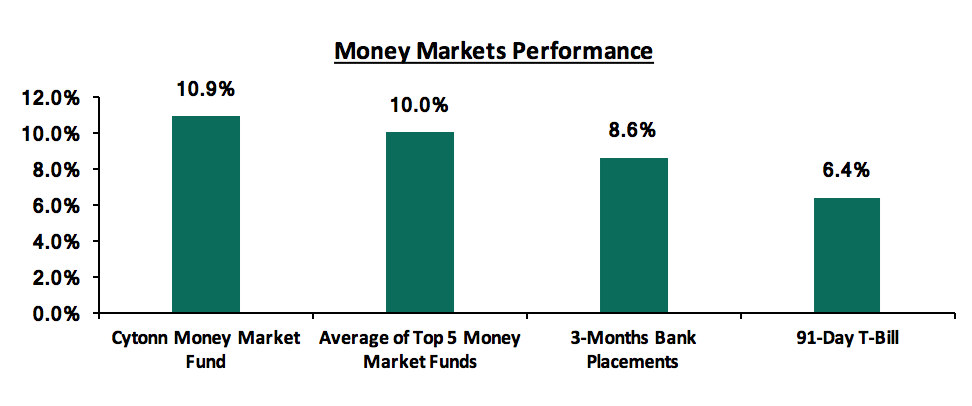
In the money markets, 3-month bank placements ended the week at 8.6% (based on what we have been offered by various banks), the 91-day T-bill came in at 6.4%, while the average of Top 5 Money Market Funds came in at 10.0%, unchanged from the previous week with the Cytonn Money Market Fund closing the week at 10.9%, from 10.4% recorded the previous week.
Liquidity:
During the week, the average interbank rate decreased to 7.0%, from 7.5% recorded the previous week, pointing to improved liquidity conditions in the money market, supported by net redemption of government securities of Kshs 29.2 bn. Despite the slight improvement, the liquidity conditions have been tight in recent weeks, with the average interbank rate being elevated to 7.2%, compared to the 2019 average of 3.9%. The tightened liquidity in the past weeks has been attributed to government intervention in the repurchase agreements (repos) market offering attractive rates of about 8.9% resulting in increased competition for smaller banks chasing the excess liquidity. The average volumes traded in the interbank market declined by 14.2% to Kshs 5.3 bn, from Kshs 6.2 bn the previous week.
Kenya Eurobonds:
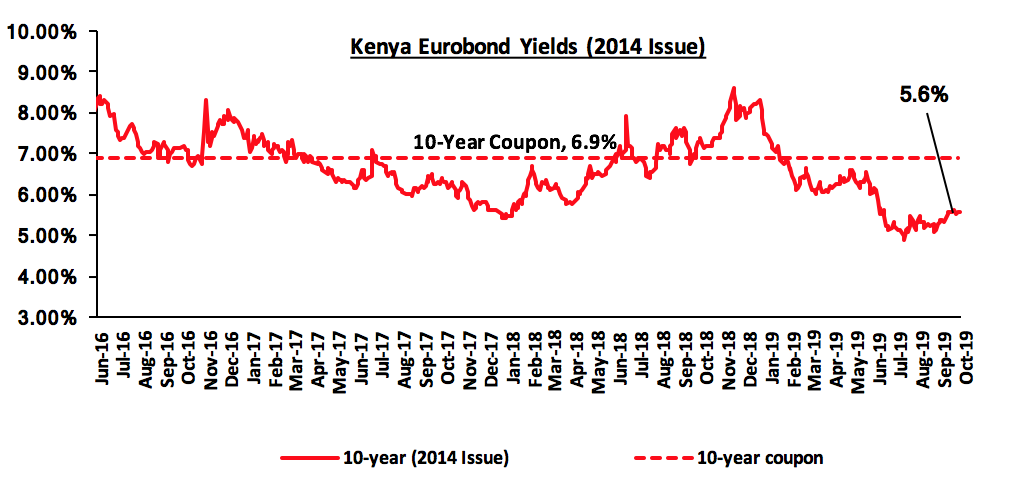
According to Reuters, the yield on the 10-year Eurobond issued in 2014 remained unchanged at 5.6% during the week.
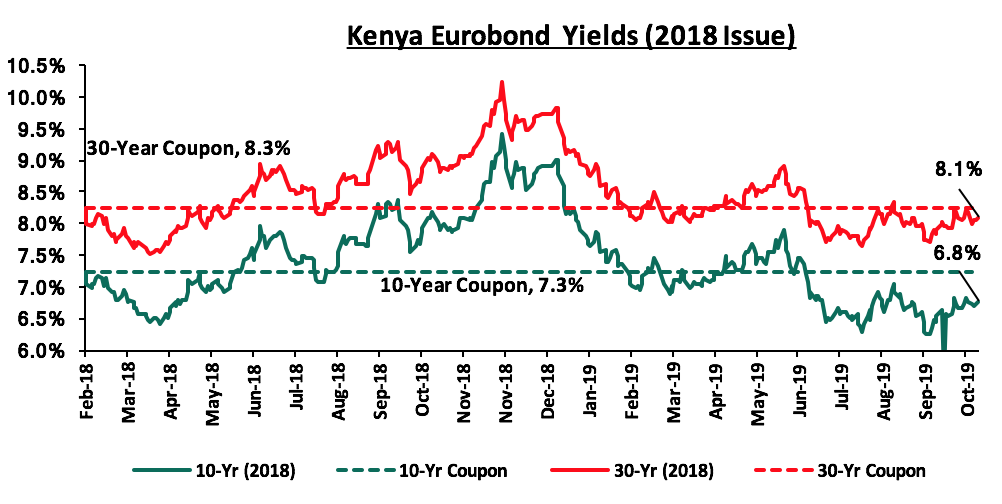
For the 2018 issues, the yield on the 10-year Eurobond also remained unchanged at 6.8% during the week, while the yield on the 30-year Eurobond declined by 0.1% point to 8.1% from 8.2% recorded the previous week.
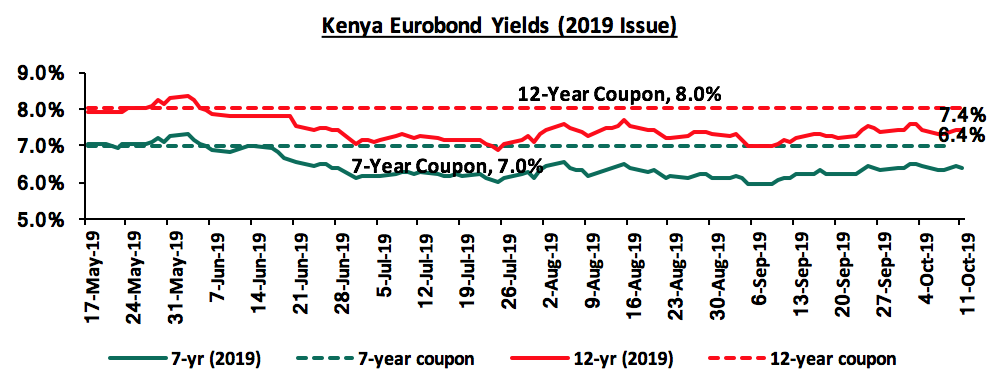
During the week, the yields on both the 7-year Eurobond and the 12-year Eurobond remained unchanged at 6.4% and 7.4%, respectively.
Kenya Shilling:
During the week, the Kenya Shilling remained stable against the US Dollar to close at Kshs 103.8, unchanged from the previous week, supported by inflows from offshore investors buying government securities and liquidity in the local market. On an YTD basis, the shilling has depreciated by 1.9% against the dollar, in comparison to the 1.3% appreciation in 2018. In our view, the shilling should remain relatively stable against the dollar in the short term, supported by:
- The narrowing of the current account deficit, with preliminary data indicating that Kenya’s current account deficit improved by 11.8% during Q2’2019, coming in at a deficit of Kshs 107.6 bn, from Kshs 122.0 bn in Q2’2018, equivalent to (6.2%) of GDP, from (7.6%) recorded in Q2’2018. This was mainly driven by the narrowing of the country’s merchandise trade deficit by 1.7% and a rise in secondary income (transfers) balance by 5.1%,
- Improving diaspora remittances, which have increased cumulatively by 8.9% in the 12-months to August 2019 to USD 2.8 bn, from USD 2.6 bn recorded in a similar period of review in 2018. The rise is due to :
- Increased uptake of financial products by the diaspora due to financial services firms, particularly banks, targeting the diaspora, and,
- New partnerships between international money remittance providers and local commercial banks making the process more convenient,
- CBK’s supportive activities in the money market, such as repurchase agreements and selling of dollars, and,
- High levels of forex reserves, currently at USD 9.0 bn (equivalent to 5.6-months of import cover), above the statutory requirement of maintaining at least 4.0-months of import cover, and the EAC region’s convergence criteria of 4.5-months of import cover.
Weekly Highlight:
During the week, the World Bank released the Africa's Pulse, October 2019. Below are the key take-outs from the report:
- Economic Growth: Sub-Saharan Africa’s economic performance has remained sluggish as a result of heightened policy uncertainty in the region. Growth is expected to rise to 2.6%, 0.2% points lower than the World Bank’s forecast of 2.8% in April, but higher than 2.5% recorded in 2018. The sluggish growth in the Sub-Saharan countries can also be attributed to the slow pace of reforms especially in terms of debt management. Growth in Kenya is expected to edge down, reflecting the effect of weaker agricultural exports due to the unfavourable weather conditions that affected agricultural production,
- Public Debt: 2019 has experienced a slowdown in sovereign bond issuance, with African countries managing to raise USD 5.6 bn in the first three quarters of 2019, lower than USD 17.0 bn in 2018, with Ghana, Benin and Kenya being the most active bond issuers with Kenya raising USD 2.1 bn in May and Ghana issuing a USD 3.0 bn Eurobond in March, which, so far, is the largest bond offering in the region in 2019. The median government debt to GDP ratio is expected to stabilize at around 55.0% in 2019, following sustained and broad-based increases since 2013. The share of foreign currency–denominated public debt increased by 12.0% percentage points from 24.0% in 2013, to 36.0% of GDP in 2018 mainly driven by a surge in Eurobond issues. The increased reliance on non-concessional foreign currency borrowing has heightened refinancing and interest rate risk. The rise in foreign debt has also has exposed some countries to the risk of sudden capital outflows, which could trigger large currency depreciations. For the region as a whole, the average interest payments-to-revenue ratio is expected to rise to 11.0% in 2019, from 6.0% in 2012,
- Inflation and Monetary Policy: The region’s inflation rate is projected to decline to 3.4% in 2019, from 3.8% recorded in 2018, driven by subdued domestic demand, lower oil prices, and increased currency stability. The softening economic activity and low inflationary pressure has provided scope for accommodative monetary policy in many countries, which has seen central banks in 10 countries—including Angola and South Africa— cut their policy rates amid benign inflation and sluggish real GDP growth since May 2019. In contrast however, the central bank of Zambia raised its interest rates to stabilize the exchange rate amid rising inflation. In August, four countries—Botswana, Mauritius, Mozambique, and Namibia—lowered their key policy rates. Looking ahead, the region’s policy makers may further loosen monetary policy amid abating price pressures and the shift to more accommodative conditions globally.
In conclusion, macroeconomic vulnerabilities have increased in many Sub-Saharan African economies coupled with a less favourable external environment and weak macroeconomic fundamentals. Consequently, African countries have tried adopting macroeconomic policies to rebuild their fiscal and monetary space to be more resilient to external and domestic economic shocks. To finance some of the policy actions, some countries in the region have resorted to increased borrowing further elevating risks of debt distress. Going forward, we believe African nations ought to address the increased macroeconomic vulnerabilities through various ways, which include;
- Strengthening monetary policy by enabling central banks to be independent, accountable, and transparent,
- Improving domestic resource mobilization by raising the efficiency and effectiveness of tax administration,
- Implementing sound debt management practices (that reduce the riskiness of the current debt structure) and fostering debt transparency, and,
- Stimulating policies to diversify countries’ export baskets, thus allowing countries to become more resilient to commodity price volatility.
Rates in the fixed income market have remained relatively stable as the government rejects expensive bids. A budget deficit is likely to result from depressed revenue collection with the revenue target for FY’2019/2020 at Kshs 2.1 tn, creating uncertainty in the interest rate environment as additional borrowing from the domestic market goes to plug the deficit. Despite this, we do not expect upward pressure on interest rates due to increased demand for government securities, driven by improved liquidity in the market owing to the relatively high debt maturities. Our view is that investors should be biased towards medium-term fixed income instruments to reduce duration risk associated with long-term debt, coupled with the relatively flat yield curve on the long-end due to saturation of long-term bonds.
Market Performance
During the week, the equities market recorded mixed performance with NASI and NSE 20 gaining by 0.3% and 0.7%, respectively, while the NSE 25 declined by 0.2%, taking their YTD performance to gains/losses of 5.1%, (13.4%) and (1.5%), for NASI, NSE 20 and NSE 25, respectively. The performance in NASI was driven by gains in Safaricom, Co-operative Bank, and Bamburi, which gained by 1.4%, 0.4%, and 0.8%, respectively.
Equities turnover decreased by 47.7% during the week to USD 13.4 mn, from USD 25.6 mn the previous week, taking the YTD turnover to USD 1,097.6 mn. Foreign investors remained net sellers for the week, with a net selling position of USD 0.4 mn, from a net buying position of USD 2.2 mn the previous week.
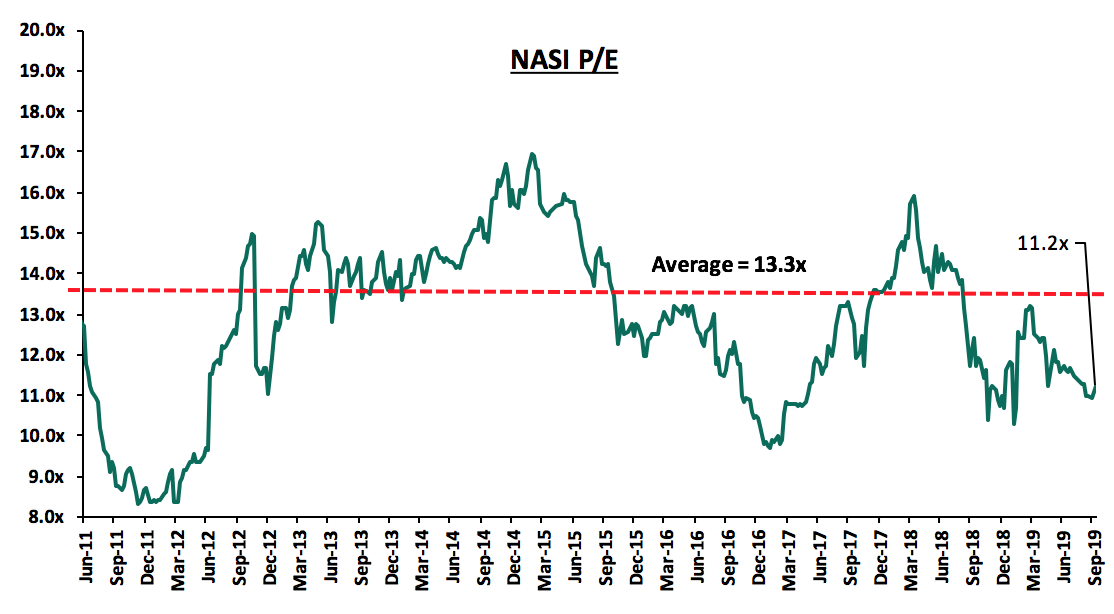
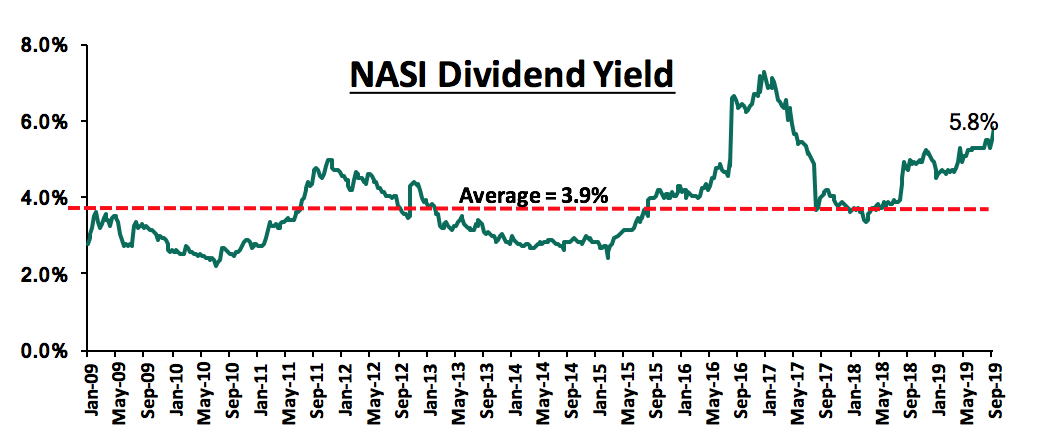
The market is currently trading at a price to earnings ratio (P/E) of 11.2x, 15.7% below the historical average of 13.3x, and a dividend yield of 5.8% above the historical average of 3.9%. With the market trading at valuations below the historical average, we believe there is value in the market. The current P/E valuation of 11.2x is 15.5% above the most recent trough valuation of 9.7x experienced in the first week of February 2017, and 34.9% above the previous trough valuation of 8.3x experienced in December 2011. The charts below indicate the historical P/E and dividend yields of the market.
Weekly Highlight
During the week, Atlas Mara, which trades on the London Stock Exchange, announced the revaluation of four African banks in Rwanda, Zambia, Mozambique, and Tanzania that are expected to be acquired by Equity Group. The acquisition is set to be via a share swap where Equity Group will offer 6.3% of its shares worth Kshs 10.7 bn to acquire the four banks at a price per share of Kshs 42.4, which is a premium of 17.4% to the current price per share of Kshs 36.1. Equity Group will receive 62.0% of the share capital of Rwanda’s Banque Populaire
du Rwanda, and 100.0% of African Banking Corporation Mozambique, African Banking Corporation of Zambia, and African Banking Corporation of Tanzania. This deal will ensure Equity Group penetrates into these four African markets. The bank’s subsidiaries in Rwanda and Tanzania are expected to merge with the Atlas Mara banks once acquired in a bid to save on costs and enhance economies of scale. The four banks had deposits totalling Kshs 96.0 bn at the end of 2018, compared to Equity Group’s deposit base of Kshs 479.4 bn as at H1’ 2019. This transaction gives Atlas Mara an opportunity to acquire a stake in Equity Group Holdings, which is one of the most profitable banks in the region. Atlas Mara could also receive further unspecified compensation from Equity Group in the future on condition that there is improved performance in the four banks being traded. In our view, Kenya’s banking sector consolidation and acquisitions will continue to happen leading to a more stable and safer banking sector. Equity Group is still currently trying to simultaneously acquire a controlling stake in Banque Commerciale du Congo (BCDC) in a cash transaction, and which together with other acquisition deals is expected to make the bank one of the largest in the region. Similarly, in Q1’2019, KCB Group opened a representative office in Ethiopia as the country promotes foreign investment in its financial services sector, and also revealed plans to open a representative office in China to leverage on the trade links between China and the East Africa region. Further, the bank announced plans to acquire a bank both in Rwanda and the Democratic Republic of Congo, looking to expand its presence beyond East Africa. We expect to see the rest of the banking industry pursue inorganic growth strategies beyond Kenya, in order to grow their customer base, revenues, and balance sheet, as Kenya’s banking sector continues to operate under a capped interest rate regime.
Universe of Coverage
Below is a summary of our universe of coverage:
|
Banks |
Price at 4/10/2019 |
Price at 11/10/2019 |
w/w change |
YTD Change |
Target Price * |
Dividend Yield |
Upside/ Downside ** |
P/TBv Multiple |
Recommendation |
|
I&M Holdings*** |
45.1 |
46.1 |
2.1% |
5.9% |
79.8 |
7.8% |
81.0% |
0.8x |
Buy |
|
Sanlam |
17.4 |
17.4 |
0.0% |
(14.8%) |
29.0 |
0.0% |
66.7% |
0.8x |
Buy |
|
Diamond Trust Bank |
115 |
114.8 |
(0.2%) |
(27.2%) |
175.6 |
2.3% |
55.3% |
0.6x |
Buy |
|
KCB Group *** |
41.9 |
41.8 |
(0.1%) |
12.1% |
61.4 |
8.3% |
55.1% |
1.1x |
Buy |
|
Equity Group *** |
37.9 |
36.1 |
(4.7%) |
7.5% |
53.0 |
5.3% |
52.2% |
1.6x |
Buy |
|
NIC Group |
29.5 |
29.0 |
(1.5%) |
7.7% |
37.9 |
3.3% |
34.0% |
0.6x |
Buy |
|
Co-operative Bank |
12.1 |
12.1 |
0.4% |
(16.8%) |
15.0 |
8.4% |
32.3% |
1.0x |
Buy |
|
Britam |
7.0 |
6.9 |
(1.1%) |
(30.2%) |
8.8 |
4.9% |
31.7% |
0.7x |
Buy |
|
CIC Group |
3.1 |
3.0 |
(1.6%) |
(20.5%) |
3.8 |
4.2% |
30.9% |
1.2x |
Buy |
|
Kenya Reinsurance |
3.0 |
3.0 |
1.3% |
(17.2%) |
3.8 |
5.2% |
29.0% |
0.1x |
Buy |
|
Barclays Bank *** |
11.2 |
11.1 |
(1.3%) |
0.0% |
12.6 |
10.0% |
23.9% |
1.4x |
Buy |
|
Jubilee holdings |
346.0 |
350.0 |
1.2% |
(13.5%) |
418.5 |
2.6% |
22.1% |
1.0x |
Buy |
|
Liberty Holdings |
9.7 |
9.8 |
0.2% |
(24.7%) |
11.3 |
5.1% |
20.9% |
0.7x |
Buy |
|
Standard Chartered |
198.0 |
195.5 |
(1.3%) |
2.7% |
208.0 |
6.3% |
12.6% |
1.5x |
Accumulate |
|
Stanbic Holdings |
96.3 |
96.0 |
(0.3%) |
5.8% |
100.5 |
6.1% |
10.8% |
1.1x |
Accumulate |
|
HF Group |
6.9 |
6.9 |
0.0% |
27.1% |
2.8 |
0.0% |
(60.2%) |
0.2x |
Sell |
|
*Target Price as per Cytonn Analyst estimates **Upside / (Downside) is adjusted for Dividend Yield ***Banks in which Cytonn and/or its affiliates are invested in |
|||||||||
We are “Positive” on equities for investors as the sustained price declines has seen the market P/E decline to below its historical average. We expect increased market activity, and possibly increased inflows from foreign investors, as they take advantage of the attractive valuations, to support the positive performance.
During the week, there was private equity activity in the real estate sector with Emerging Africa Infrastructure Fund (EAIF), an infrastructure fund managed by Investec Asset Management, investing Kshs 1.3 bn (USD 12.7 mn) in the green bond issued by Nairobi-based property developer Acorn Holdings. The total funds raised via the green bond amounted to Kshs 4.3 bn, with the funds being raised mainly from pension funds, development finance institutions, and commercial banks. These funds are meant for the construction of affordable student housing projects, where Acorn is set to begin construction of around six green-certified student properties in Nairobi. These properties are expected to create accommodation for about 5,000 students in Kasarani, Karen, Nairobi West and Ngara.
This transaction marked the EAIF’s first ever transaction denominated in local currency, showing a rise in appetite for supporting projects in local currency. This is expected to open up the issuance of securities to global investors looking to invest in local currency, as it shows the confidence in the stability of the Kenyan Shilling by international investors, who usually tend to invest in stable currencies. The properties will be developed by Acorn Holdings Ltd, a joint venture between Acorn Group Ltd, a property developer operating in East Africa, and Accord Holdco, a Helios Investment Partners subsidiary based in London. This deal represents a first of many bonds with “green certification”, a trend that we expect to pick up pace, especially with the proposed tax exemption for similar instruments, following changes in the Finance Bill 2019, which is at the Presidential assent stage. The issuance and subsequent success of the bond is expected to benefit both investors and the stakeholders in the long-run considering its focus on environmental issues and a more sustainable economy, a trend that has been picking up pace in other markets.
In the financial services sector, International Financial Corporation (IFC), a member of World Bank Group headquartered in Washington, invested USD 10.0 mn (Kshs 1.0 bn) in CardinalStone Capital Advisers Growth Fund for a 10% equity stake in the fund. The fund aims to make financing accessible to high growth, underserved SMEs in Nigeria and Ghana. This fund is the first to be managed by CardinalStone Capital Advisers, though the firm has had experience investing capital in at least 5 investment projects across various sectors. The objective for this fund is to facilitate job creation and create a sufficient local private equity and mezzanine financing. In their target of raising USD 100.0 mn, they are USD 50.0 mn short having secured the rest from CDC Group, Kuramo, FMO and NSIA. With SMEs accounting for 85% of private sector in Ghana and 96% of businesses in Nigeria, there has been limited availability of long-term capital, thus creating an opportunity for the fund to grant SMEs access to financing.
We can expect to see an increase in such growth funds and further participation of firms such as IFC in the private equity sector in Africa, given the growth of SMEs in the region, which creates a need for long term financing giving funds such as CardinalStone Capital Advisers Growth Fund opportunities to provide long-term capital. Programs such as IFC SME ventures pave way for more investors to enter the private equity market in Africa. This will build a more sustainable environment for SMEs and the working population in Africa.
Private equity investments in Africa remain robust as evidenced by the increasing investor interest, which is attributed to; (i) rapid urbanization, a resilient and adapting middle class and increased consumerism, (ii) the attractive valuations in Sub-Saharan Africa’s private markets compared to its public markets, (iii) the attractive valuations in Sub-Saharan Africa’s markets compared to global markets, and (iv) better economic projections in Sub-Saharan Africa compared to global markets. We remain bullish on private equity as an asset class in Sub-Sahara Africa. Going forward, the increasing investor interest and stable macro-economic environment will continue to boost deal flow into African markets.
I. Residential Sector
In line with the Kenyan Government’s target to have at least 2,000 affordable housing units at county level, Nyeri County Government during the week announced plans of developing its first affordable housing units, to be located in Skuta. The project, which is a public-private partnership between Tekimamo Company Ltd, a Teachers’ Sacco based in Nyeri County, and Sampesa Agency, a property development and management firm, will see sixty-four two-bedroom units put up at an estimated cost of Kshs 143.6 mn, exclusive of land, which belongs to the Sacco. This means a construction cost of approximately Kshs 2.2 mn per unit. Assuming a 10.0% operating expenses and a 30.0% gross profit margin, the units should have rental rates of approximately Kshs 14,000 per month, and sell at approximately Kshs 2.9 mn, thus, have a potential rental yield of 5.8% at full occupancy. This is in line with our 2019 Nyeri Real Estate Investment Opportunity Report, according to which apartment yields in the region averaged at 5.3% as at 2019, with investment opportunity being in rental property due to high demand evidenced by high occupancy rates which averaged at 93.0%. From the partnership, Sampesa Agency, the developer, is expected to recoup their investment in 25-years, with an estimated profit of Kshs 50.0 mn from a rental income share of 70.0%, translating to an estimated IRR of 2.3%, which in our view is relatively low as most private developers target at least double digit returns.
Nairobi County Government also announced plans to put up 27,000 units within Eastlands, Nairobi. The plan, in tandem with the Kenyan Government’s Big Four Agenda Affordable Housing Programme, will see the development of 5,000 units in Shauri Moyo, 20,000 units in Makongeni, within the current financial year, in addition to the 2,000 units under construction on Park Road. As per the Affordable Housing Programme planner, the 500,000-units initiative is to be rolled out in five phases/lots, with the first lot planned for FY 2017/2018 was to be launched in Park Road, Mavoko, Muguga Green, Makongeni, Starehe and Shauri Moyo, all located in Nairobi’s Eastlands. Of the six projects, the government has only rolled out the Park Road project, meaning the entire programme is behind schedule. This is attributable to government red tapes as seen in delays with construction permits, lack of spatial planning at county level, lack of transparency on availability of land at county and national level, lack of a clear public-private partnerships structure to make headway for private sector financing and engagement, and delays in establishment of affordable housing enabling institutions such as National Housing Development Fund (NHDF) and Kenya Mortgage Refinancing Company (KMRC). For the County and the National Governments to achieve the 27,000 units plan, at least 9,000 units have to be constructed every year for the next three years, assuming a deadline of 2022. This can only be achieved once the government partners with private developers with an actual real estate track record. Additionally, there is need for incentives aimed towards helping reduce the high construction costs in Kenya, as well as fast and efficient building approval processes.
II. Commercial Office Sector
During the week, Kofisi, a subsidiary of Sunbird Group, opened a new office in Karen. The company, which is an aspirational work spaces provider, has offices in Lagos, Dar es Salaam, Kampala, London, and Johannesburg, with other local branches in Upperhill and Westlands. Serviced offices have continued to gain massive traction in Nairobi driven by; (i) the relatively high returns of up to 13.5% p.a, as per the Cytonn Office Report 2019, and (ii) a growing start-up culture and presence of multinationals, for whom serviced offices tend to be more cost effective as they do not require long-term lease commitments, thereby, also offering operational flexibility. In Nairobi, serviced offices attract rental rates of approximately Kshs 173 per SQFT in comparison to un-serviced offices at Kshs 103 per SQFT. Karen as a serviced office node is boosted by presence of good infrastructure, which provides easy access to the Central Business District and other nodes such as Kilimani and Upperhill, particularly the Southern Bypass and Ngong Road, which is being expanded to a dual carriageway, as well as reliable water and electricity supply, and ample sewer connection. Additionally, office stock in Karen is either Grade A or B, thus, easily attracting multinational clients seeking high quality office space.
III. Retail Sector
Amid the growing retail sector, marked by increased presence of international players and expansion of local retailers, various retailers in Kenya have embarked on downsizing measures largely due to financial constraints that result from poor governance and oversight coupled by tight competition in the sector. As such, Botswana-based Choppies announced plans of exiting its Nanyuki Mall branch, which is to be taken up by local retailer Tuskys. The closure of Choppies branches and its planned exit from the Kenyan market is a result of stock shortage and corporate governance issues facing the retailer hailing from its parent companies in Botswana and Zimbabwe. The retailer first set up shop in Kenya in 2016 through acquisition of Ukwala Supermarkets at an estimated price of Kshs 1.0 bn, and with approximately 210 stores across Africa in Countries such as South Africa, Zimbabwe, Tanzania and Kenya, Choppies is arguably the largest African retailer. The retailer has been on an ambitious expansion drive with plans to increase its East African footprint, evidenced by its growth in Kenya from 10 stores in 2016 acquired from the Nairobi-based Ukwala to 17 nationally as at June 2019.
Aggressive retailer expansion in a bid to tap into the growing middle class has often led to financial constraints for major retailers such as Nakumatt, Uchumi, and Choppies, largely due to; (i) thinning profit margins and poor capital management, and (ii) fierce competition from the increasingly growing international retailers such as Carrefour, who attract the high-end and upper mid-end income classes, in addition to the constant challenge of informal retail sector, which attract the lower mid-end and low-end consumers especially in counties such as Kiambu and Bungoma. According to Shoppers’ Trend 2019 Report by Nielsen, a multinational data and measurement firm, informal retail in Kenya accounted for 66.3% of the total retail spend for the year ending March 2019, a 10.7% growth since 2018, whereas modern supermarkets on the other hand accounted for 33.7%, a marginal growth of 0.4% since 2018.
With supermarkets being the conventional anchor tenants in Kenyan malls, the closures have affected the country’s retail sector performance evidenced by the decline in rental yields from 8.6% in 2018 to an average of 7.0% as of 2019, whereas vacancy rates increased from 14.0% as at 2018 to 22.7% in 2019. This therefore, necessitates the need by mall developers to employ prudent methods in order to ensure tenant retention, such as rent reductions and rent-free grace periods. There is also need for retail investors to conduct market-specific trend analysis to identify the most appropriate anchor tenants and occupants, and also nuanced product offering as the number of malls continue to grow. In comparison to countries such as South Africa, which has an estimated formal retail penetration of over 60.0% and an average of 80.0% in developed countries, Kenya’s formal retail penetration is considerably low and therefore, still has potential for a lot of growth.
Other Weekly Highlights;
- For the past five years, real estate has continued to deliver attractive long-term returns to investors with five-year average returns of 20.1% in comparison to traditional asset classes with 8.7%. In light of this, during the week, an undisclosed pension scheme through GenAfrica Asset Managers, announced plans of purchasing a developed commercial property at Kshs 600.0 mn or below for rental income purposes. Currently, commercial real estate offers attractive rental yields with Nairobi Metropolitan Area recording averages of 7.7% and 8.0%, for commercial office and retail sectors, respectively, whereas markets such as Westlands offer double-digit rental yields of up to 11.0%, according to the Cytonn Q3’2019 Markets Review. Additionally, according to Retirement Benefits Authority (RBA), pension schemes can invest up to 30.0% of their assets in real estate. However, as of 2019, pension schemes investment in real estate came in at 19.1% indicating the potential for pensions investment in the sector especially in light of the huge assets under management, which was at Kshs 1.2 tn as at December 2018,
- During the week, Java introduced a new restaurant business line to its existing portfolio which includes the coffeehouse, Planet Yoghurt, and 360 Degrees Pizza, to now include fried chicken in a new restaurant, Kukito, which is located in Nairobi, along Kimathi Street. The new opening marks Java’s 77th store in East Africa and also follows Java’s announcement to open more express outlets in schools and hospitals likes of which it operates in United States International University (USIU) off Thika Road, and Aga Khan and MP Shah Hospitals in Nairobi. The group aims to increase the express outlets, which are less capital intensive, to fourteen by end of the 2020 financial year. In our view, the strategy will ensure the retailer reaches a wider market by targeting clientele from multiple income levels especially as competition in the local retail sector continues to grow following the continued entry of foreign retailers. Also, with the tough financial environment, we continue to see retailers diversifying in a bid to remain competitive in the current market with international retailers such as Burger King, KFC, and Subway expanding their local footprint driven by growth of Kenya’s middle class and evolving lifestyles.
We expect the real estate sector’s performance to improve in the long run fueled by the continued interest in the Kenyan real estate market by both local and international players, continued investment in infrastructure and the focus on provision of affordable housing.
In October 2018, we released the Kenya Retail Sector Report - 2018, themed “Retail Sector Recovers in Key Cities Except Nairobi”, which focused on the performance of the retail real estate sector in Kenya in 2018. According to the report, the retail sector in Kenya recorded improved performance across all major cities in Kenya with the exception of Nairobi, which recorded a decline in rental yields by 0.2% points to 9.4% in 2018 from 9.6% in 2017.
This week, we update those findings with our Kenya Retail Sector Report - 2019. The report is based on findings from research conducted in 8 nodes in the Nairobi Metropolitan Area, as well as key urban cities and regions in Kenya, including North Rift, Coastal Region, Western/Nyanza, and Mt. Kenya. The report highlights the performance of the retail real estate sector in Kenya in 2019, based on rental yields, occupancy rates, as well as demand and supply, all in comparison to 2018 and the years before to identify the trends, and hence, provide investors with an investment opportunity outlook for the sector. In this focus note, we will highlight the key take-outs from the report as below;
- Overview of the Retail Sector in 2019
- Retail Sector Performance Summary in 2019,
- Retail Space Demand Analysis,
- Retail Sector Investment Opportunity, and
- Retail Sector Outlook.
Section I: Overview of the Retail Sector in 2019
In the 2018/2019 period, the retail sector in Kenya continued to witness growth evidenced by increase in malls and number of international retailers making inroads in the country. New mall openings included The Karen Waterfront in Karen, expansion of Sarit Centre in Westlands, and Mwembe Mall in Mombasa, among others. New foreign players included Spanish fashion retailer, Mango, which set up shop in Nairobi at the Westgate Mall and South African retailer, Shoprite, also made its debut, opening at Westgate Mall in Westlands, Garden City, along Thika Road, and in City Mall, Nyali. Overall, the retail sector recorded an increase of 1.1 mn SQFT of mall space into the market in 2018, leading to a supply of 12.5 mn SQFT in 2019 from 11.4 SQFT in 2018. The sectors growth was driven by:
- Positive Demographics: Kenya’s urban population continues to expand at an annual rate of 4.3% as per the World Bank, increasing the need for formal retail,
- Rising Consumerism: The retail sector continues to evolve on the back of a growing middle class and change in tastes and preferences especially towards international products, thus, creating a niche for international retailers,
- Infrastructure: The continued investment in infrastructure has encouraged a growth in mall space as this encourages tenancy as well as footfall
- Recognition as a Regional Hub: This has seen international retailers such as Carrefour, Shoprite and Game open locations within the Nairobi Metropolitan Area (NMA), and,
- Growth of Small and Medium Sized Enterprises (SMEs): SMEs contribute approximately 45% of Kenya’s GDP, 80% of employment in Kenya and constitute 98% of businesses locally according to a CNBC News Report 2014 and are thus a key driver for the retail office sector.
However, due to a tough financial environment, developers continued to employ prudent methods in a bid to retain tenants and also to target international anchor tenants. Retail spaces are now differentiating themselves in a bid to attract footfall by focusing on entertainment and recreational facilities as seen in malls such as Two Rivers and Karen Waterfront.
During the year, the key challenges to the retail sector were:
- Slow private sector credit growth, which stood at 5.2% as of June 2019, compared to a 5-year (2013-2018) average of 14.0%,
- Tough financial environment brought about by inflationary pressures and challenges in the employment sector, and,
- Increase in troubled retailers, with Choppies, an anchor tenant in various Kenyan Malls, announcing plans to exit the country owing to poor governance.
Despite these challenges, we expect the retail sector to be cushioned by the presence of strong international retailers such as Carrefour, Shoprite, food chains such as Subway, Burger King and KFC, as well as local retailers such as Tuskys and Naivas. These retailers have continued to take up space in malls and mixed-use developments, in a bid to expand their local footprint, thus providing a boost to the retail sector. Overall, formal retail sector in Kenya remains relatively low at approximately 35.0%, in comparison to countries such as South Africa with 60.0% and therefore, we expect to see more growth in the sector.
Section II: Retail Sector Performance Summary in 2019
In 2018, Kenya’s retail sector performance improved with average rental yields increasing by 0.3% points y/y to 8.6%, from 8.3% in 2017, on the back of a recovery from the tough economic environment in 2017. However, in 2019, the sector’s performance in key urban cities softened, recording average rental yields of 7.0%, 1.6% points lower than the 8.6% recorded in 2018. The reduced performance is largely attributed to:
- Rental Rates Reductions – The tough financial environment has seen the rental rates in the sector decline by 10.6% to Kshs 118 per SQFT in 2019, from Kshs 132 per SQFT in 2018, and,
- Increased Vacancy Rates - A surplus in retail space coupled with stiff competition between malls in some nodes such as Nairobi, which recorded an oversupply of 2.8 mn SQFT, which saw average occupancies drop by 8.7% points Y/Y from 86.0% in 2018 to 77.3% in 2018. Some property managers, therefore, introduced innovative strategies such as offering rent-free grace periods of up to 6 months in a bid to attract tenants.
In our analysis of the retail market performance in 2019, we will cover the general market performance within key nodes in the Nairobi Metropolitan Area by node and class and then conclude with the performance of key urban cities in the country.
a. Retail Sector Performance in Kenya Over Time
In 2019, the Kenyan retail sector’s performance dropped slightly with average rental yields declining by 1.6% points to 7.0% in 2019, from 8.6% in 2018. Occupancy rates declined by 8.7% points to 77.3% in 2019, from 86.0% in 2018. The decline in performance is mainly attributed to:
- An introduction of 0.8 mn SQFT of retail space into the Kenyan market driving down rents and occupancy rates by 10.2% and 4.8% points, respectively. The new retail spaces include the Waterfront Mall and Signature Mall, amongst others, and,
- Constrained spending power among consumers due to a tough financial environment.
The performance of the sector across the key cities is as summarized below:
(all values in Kshs unless stated otherwise)
|
Kenya’s Retail Sector Performance Summary 2019 |
||||||
|
Item |
2016 |
2017 |
2018 |
2019 |
∆ Y/Y 2019/2018 |
|
|
Average Asking Rents (Kshs/SQFT) |
154.9 |
140.9 |
132.1 |
118.0 |
(10.6%) |
|
|
Average Occupancy (%) |
82.9% |
80.2% |
86.0% |
77.3% |
(8.7%) Points |
|
|
Average Rental Yields |
8.7% |
8.3% |
8.6% |
7.0% |
(1.6%) Points |
|
|
· The average rental yields declined by 1.6% points to 7.0% in 2019 from 8.6% in 2018 driven by 8.7% points decline in occupancy rates to 77.3% in 2019, from 86.0% in 2018 · The decline in performance is attributable to an introduction of 0.8 mn SQFT of retail space into the Kenyan market and constrained spending power among consumers due to a tough financial environment |
||||||
Source: Cytonn Research 2019
b. Nairobi Metropolitan Area (NMA) Retail Market Performance – Rental yield and Occupancy rates recorded slight declines
- Performance by Nodes- Kilimani, Ngong Road and Westlands were the best-performing retail nodes
In 2019, rental yields within the Nairobi Metropolitan Area declined by 1.0% points to 8.0%, from 9.0% in 2018. This was mainly driven by a decline in rents per SQFT and occupancy rates by 5.4% and 4.7% points, respectively, from Kshs 178.2 and 79.8% in 2018 to Kshs 168.6 and 75.1% in 2019. The decline is mainly attributed to an increase in retail space supply of 0.8 mn SQFT within the past year with the addition of malls such as Waterfront, The Well, Mountain View and the expansion of Westgate and Sarit Centre malls.
Kilimani, Ngong Road and Westlands were the best-performing retail nodes recording rental yields of 9.9%, 9.2% and 9.2%, respectively, in 2019 attributed to the nodes serving the upper middle income and high-end population. However, Westlands area experienced the largest drop in performance recording a 3.0% points decline in rental yields to 9.2% in 2019 from 12.2% in 2018. Its occupancy rates also declined by 3.6% points to 84.6% in 2019 from 88.2% in 2018. This was mainly attributed to a 7.1% reduction of rental rates from an average of Kshs 219.2 per SQFT in 2018 to Kshs 203.6 per SQFT as of 2019, in a bid to attract tenants especially with the addition of 0.5 mn SQFT of retail space within the node following the completion of malls such as Mountain View mall and the expansion of Sarit Centre and Westgate shopping malls.
Satellites towns recorded the lowest rental yields at 6.0% attributed to low rents, which average at Kshs 131.4 per SQFT, 28.3% lower than the market average of Kshs 168.6 per SQFT driven by low rental charges as a result of competition from informal retail space.
The performance of the key nodes in the Nairobi Metropolitan Area (NMA) is as summarized below:
(all values in Kshs unless stated otherwise)
|
Summary of NMA’s Retail Market Performance 2018-2019 |
|||||||||
|
Location |
Rent Per SQFT 2019 |
Occupancy Rate 2019 |
Rental Yield 2019 |
Rent Per SQFT 2018 |
Occupancy Rate 2018 |
Rental Yield 2018 |
Change in Rents |
Change in Occupancy |
Change in Rental Yields |
|
Kilimani |
170.4 |
87.2% |
9.9% |
167.1 |
97.0% |
10.7% |
2.0% |
(9.8%) |
(0.9%) |
|
Ngong Road |
179.4 |
83.1% |
9.2% |
175.4 |
88.8% |
9.7% |
2.3% |
(5.7%) |
(0.5%) |
|
Westlands |
203.6 |
84.6% |
9.2% |
219.2 |
88.2% |
12.2% |
(7.1%) |
(3.6%) |
(3.0%) |
|
Karen |
207.9 |
77.0% |
9.1% |
224.9 |
88.8% |
11.0% |
(7.6%) |
(11.8%) |
(1.9%) |
|
Eastlands |
145.0 |
74.5% |
7.5% |
153.3 |
64.8% |
6.8% |
(5.4%) |
9.7% |
0.7% |
|
Thika road |
165.4 |
73.5% |
7.5% |
177.3 |
75.5% |
8.3% |
(6.7%) |
(2.0%) |
(0.8%) |
|
Kiambu Road |
166.0 |
61.7% |
6.8% |
182.8 |
69.5% |
8.1% |
(9.2%) |
(7.8%) |
(1.4%) |
|
Mombasa Road |
148.1 |
64.0% |
6.3% |
161.5 |
72.4% |
7.9% |
(8.3%) |
(8.4%) |
(1.6%) |
|
Satellite Towns |
131.4 |
70.3% |
6.0% |
142.1 |
73.7% |
6.7% |
(7.5%) |
(3.3%) |
(0.7%) |
|
Average |
168.6 |
75.1% |
8.0% |
178.2 |
79.8% |
9.0% |
(5.4%) |
(4.7%) |
(1.0%) |
|
· Kilimani, Ngong Road and Westlands were the best-performing retail nodes recording rental yields of 9.9%, 9.2% and 9.2%, respectively, in 2019 · Westlands experienced the largest drop in performance driven by a 7.1% decline in rental charges to Kshs 203.6 per SQFT in 2019 from Kshs 219.2 per SQFT in 2018. This was attributed to a reduction of rental rates by property managers in a bid to attract tenants · Satellites towns were the worst performing recording rental yields of 6.0% attributed lower rents at Kshs 131.4 per SQFT, 28.3% lower than the market average at Kshs 168.6 per SQFT driven by low rental charges as a result of competition from informal retail space |
|||||||||
Source: Cytonn Research 2019
- Performance by Class - Destination malls were the best performing malls
To analyze the performance of malls by class we classified malls into three bands as below:
- Regional Centers / Destination Malls: They are largest malls, with a Gross Lettable Area (GLA) of 400,000 - 800,000 SQFT and characteristically have two or more anchor tenants (except NextGen), in Nairobi these include; Sarit Centre, Two Rivers Mall, NextGen Mall, and Garden City,
- Community Centers: These are the second largest mall types, occupying spaces of between 125,001 - 400,000 SQFT and characteristically have zero to two anchor tenants, in Nairobi these include; The Hub, Capital Centre, Galleria, Village Market, Junction Mall, and Westgate, and,
- Neighbourhood Centers: They have the minimum mall space, with a Gross Lettable Area (GLA) of 20,000 SQFT and characteristically having a maximum of one or even no anchor tenant, in Nairobi these include; Prestige Plaza, Rosslyn Riviera and Ridgeways Mall.
On performance by class, destination malls were the best performing mall typologies recording average rental yields of 9.4%, attributable to high rental charges averaging at Kshs 211.6 per SQFT, 25.5% higher than the market average of Kshs 168.6 per SQFT. This is as the malls charge premium rents for the high-quality retail space, facilities provided, and higher footfall attracted by the presence of international retailers. Despite the attractive yields, destination malls recorded a slight decline in performance with rental yields declining by 0.2%
points from 9.6% in 2018 to 9.4% in 2019 and rental rates declining by 2.9% to Kshs 211.6 in 2019 from Kshs 217.9 in 2018.
Community malls recorded the largest drop in performance with rental yields declining by 1.5% points, driven by an 8.4% points decline in occupancy rates from 84.5% in 2018 to 76.1% in 2019. The decline in performance is attributed to a large number of community malls such as the Waterfront and the Signature Mall, opened within the past year adding 528,000 SQFT into the retail market.
Neighbourhood malls equally recorded a drop in performance with rental yields and occupancy rates declining by 1.1% and 6.7% points, respectively, attributed to the reduction of rental rates by property managers to attract smaller retailers.
Retail market performance in Nairobi Metropolitan Area (NMA) by class is as shown below:
(All values in Kshs Unless Stated Otherwise)
|
Nairobi Metropolitan Area (NMA) Retail Market Performance by Class 2019 |
||||||||
|
Class |
Rent per SQFT 2019 |
Occupancy 2019 |
Rental Yield 2019 |
Rent per SQFT 2018 |
Occupancy 2018 |
Rental Yield 2018 |
Change in Occupancy Rates |
Change in Rental Yields |
|
Destination |
211.6 |
79.8% |
9.4% |
217.9 |
81.0% |
9.6% |
(1.3%) |
(0.2%) |
|
Community |
166.9 |
76.1% |
8.1% |
176.9 |
84.5% |
9.6% |
(8.4%) |
(1.5%) |
|
Neighbourhood |
162.3 |
73.5% |
7.9% |
170.0 |
80.2% |
9.0% |
(6.7%) |
(1.1%) |
|
Average |
168.6 |
75.1% |
8.0% |
178.2 |
79.8% |
9.0% |
(4.7%) |
(1.0%) |
|
· Destination malls were the best performing mall typologies recording average rental yields of 9.4% attributable to charging premium rents for the high quality space, facilities provided, and higher footfall attracted by the presence of international retailers · Community malls recorded a decline in occupancy rates from 84.5% in 2018 to 76.1% in 2019 attributed to a large number of community malls opened within the past year |
||||||||
Source: Cytonn Research 2019
c. Retail Market Performance in Key Urban Cities in Kenya
Performance in key urban cities within the country softened with rental yields declining by 1.6% points to 7.0% in 2019 from 8.6% in 2018. This was mainly driven by a drop in occupancy rates by 8.7% points to 77.3% in 2019, from 86.0% in 2018. The decline in performance is mainly attributed to adoption of informal retail spaces and mixed-use developments by retailers and increase in the supply of retail space by 0.8 mn SQFT in 2019 with malls such as Lake Basin Mall in Kisumu, the Waterfront in Nairobi and the Signature Mall in Kitengela.
Mt. Kenya was the best performing region, with average yields of 8.6% and rental rates of Kshs 129.8 per SQFT. The region has a relatively low mall space supply accounting for 7.7% market share in Kenya, which means high occupancy rates.
Kisumu and Nakuru had the lowest rental yields recording 5.6% and 4.5%, respectively. Kisumu’s lower performance is attributed to oversupply of retail space in the area after the opening of Lake Basin Mall with over 0.3 mn SQFT of retail space that resulted in a 12.2% points decline in retail space occupancy to 75.8% in 2019, from 88.0% in 2018. Nakuru’s low performance is attributed to competition due to lower rental rates
offered from more established mixed-use developments (MUDs) that are in the market such as CK Patel and Shoppers Paradise.
The performance of the key urban centres in Kenya is as summarized below:
(all values in Kshs unless stated otherwise)
|
Summary of 2019 Retail Performance in Key Urban Cities in Kenya |
||||||||
|
Region |
Rent 2019 |
Occupancy Rate 2019 |
Rental Yield 2019 |
Rent 2018 |
Occupancy Rate 2018 |
Rental Yield 2018 |
Change in Occupancy Y/Y |
Change in Yield Y/Y |
|
Mt. Kenya |
129.8 |
80.0% |
8.6% |
130.1 |
84.5% |
9.9% |
(4.5%) |
(1.3%) |
|
Nairobi |
168.6 |
75.1% |
8.0% |
178.9 |
83.7% |
9.4% |
(8.6%) |
(1.4%) |
|
Eldoret |
131.0 |
82.3% |
7.9% |
134.1 |
78.5% |
7.6% |
3.8% |
0.3% |
|
Mombasa |
122.8 |
73.3% |
7.3% |
135.8 |
96.3% |
8.3% |
(22.9%) |
(0.9%) |
|
Kisumu |
96.9 |
75.8% |
5.6% |
106.3 |
88.0% |
9.7% |
(12.2%) |
(4.1%) |
|
Nakuru |
59.2 |
77.5% |
4.5% |
63.0 |
85.0% |
6.9% |
(7.5%) |
(2.4%) |
|
Average |
118.0 |
77.3% |
7.0% |
124.7 |
86.0% |
8.6% |
(8.7%) |
(1.6%) |
|
· Mt. Kenya was the best performing region, with average yields of 8.6% and rental rates of Kshs 129.8 per SQFT · Kisumu and Nakuru had the lowest rental yields recording 5.6% and 4.5%, respectively. Kisumu’s lower performance is attributed to an oversupply of retail space in the area after the opening of Lake Basin Mall with over 0.3 mn SQFT of retail space |
||||||||
Section III: Retail Space Demand Analysis
We worked out a retail space demand analysis to help track retail market gaps across the country, and therefore inform investors on both overserved and underserved markets. Our demand analysis is based on the current and incoming retail space supply and the required retail space demand per region dependent on the population.
To determine the retail space demand per region we looked at Net Space Uptake (the total retail space adequate to serve a region dependent on the population less the vacancy rates in malls) per person in SQM, shopping population, and current retail market occupancy rates. For calculation of the Net Space Uptake, we used the average uptake in Kilimani as a guideline. In this analysis:
- Total Demand/Gross Uptake is the total retail space adequate to serve a region dependent on the population. This is calculated by multiplying the Net Space Uptake per person by the total shopping population,
- Net Demand/Uptake is the gross uptake less the vacancy rates in malls in a specific region. This is calculated by multiplying the Gross uptake by respective market occupancy rates,
- Supply is calculated by summing up the completed retail stock and the incoming retail space,
- To get the over/undersupply (Gap) in the market, the supply is subtracted from the demand/net uptake, and
Key assumptions are:
- Number of persons per household at 3.6 based on the average household size in urban areas as per Kenya Population and Housing Census 2009, and,
- Percentage of Shopping Population (14 years and above) at 58.0% according to KNBS (2009 Census).
If the figure is positive, then the market has an undersupply i.e, demand is more than supply and if it is a negative figure then the market has an oversupply, i.e. supply is more than demand.
The retail space demand across key regions in Kenya is as shown below;
|
Retail Space Demand Analysis Summary 2019 |
||||||||||
|
Region |
Population 2019(F)Mn |
Urban Population (%) |
Urban population 2019 (Mn) |
Shopping Population(Mn) |
Net Space Uptake per pax in SQFT (Based on Uptake per pax in Kilimani) |
Occupancy (2 Year Average) |
Gross Space Uptake per Pax SQFT (Mn) |
Net Uptake (Space Required) for each market SQFT (Mn) |
Total Supply |
GAP at current market performance |
|
Kiambu |
2.1 |
62% |
1.3 |
0.8 |
1.9 |
79% |
2.1 |
1.7 |
0.9 |
0.8 |
|
Mombasa |
1.3 |
100% |
1.3 |
0.8 |
1.9 |
85% |
2.1 |
1.8 |
1.6 |
0.2 |
|
Kajiado |
1.1 |
41% |
0.5 |
0.3 |
0.7 |
79% |
0.7 |
0.6 |
0.4 |
0.2 |
|
Mt Kenya |
2.8 |
22% |
0.6 |
0.4 |
0.9 |
82% |
1.0 |
0.8 |
0.6 |
0.2 |
|
Machakos |
1.3 |
52% |
0.7 |
0.4 |
1.0 |
79% |
1.1 |
0.9 |
0.7 |
0.2 |
|
Nakuru |
2.2 |
45% |
1.0 |
0.6 |
1.4 |
81% |
1.6 |
1.3 |
1.4 |
(0.1) |
|
Kisumu |
1.2 |
52% |
0.6 |
0.4 |
0.9 |
82% |
1.0 |
0.8 |
1.0 |
(0.2) |
|
Uasin Gishu |
1.3 |
39% |
0.5 |
0.3 |
0.7 |
80% |
0.8 |
0.7 |
0.9 |
(0.2) |
|
Nairobi |
4.6 |
100% |
4.6 |
2.7 |
6.7 |
79% |
7.4 |
5.9 |
8.6 |
(2.8) |
|
Total |
18.0 |
|
11.1 |
6.5 |
16.1 |
|
17.9 |
14.4 |
16.1 |
(1.7) |
|
· The Kenyan retail market is currently oversupplied by 1.7mn SQFT with Nairobi recording a 9-year CAGR of 15.3% · Kiambu is the highest under-supplied area by 0.8 mn SQFT while Mombasa, Kajiado, Mt. Kenya and Machakos are under-supplied by 0.2 mn SQFT each · Nairobi is the most over-supplied area at 2.8 mn SQFT, a 40% increase from 2.0 mn SQFT in 2018 |
||||||||||
Source: Cytonn Research 2019
In summary, the table above gives us the below three key take-outs:
- The Kenyan retail market is currently oversupplied by 1.7mn SQFT with Nairobi recording a 9-year CAGR of 15.3%
- Kiambu County is the highest under-supplied area by 0.8 mn SQFT while Mombasa, Kajiado, Mt. Kenya and Machakos are under-supplied by 0.2 mn SQFT each
- Nairobi is the most over-supplied area at 2.8 mn SQFT, a 40% increase from 2.0 mn SQFT in 2018
Section IV: Retail Space Investment Opportunity
To determine the investment opportunity for development of malls in Nairobi and the other key cities, we analyzed the regions based on three metrics, that is performance (rental yield), required retail space and household expenditure as a proxy for purchasing power, which have been allocated 30%, 30% and 40% weights, respectively.
Methodology Used:
- Rental Yield – Measures the expected return from development hence the higher the better. This carried 30% of the weight. The area with the highest yield was given the highest score of 9, while the area with the least yield was given the least score of 1,
- Household Expenditure - It shows the ability of the population to spend and thus the higher the better. This carried a 40% weight, hence, the area with a high household expenditure was given the highest score of 9, while the area with least household expenditure was given the least score of 1, and
- Retail Space Demand – measures the amount of space a region can take up at the current market occupancy rates. The higher the better. This carried a 30% weight, hence, an area with a high retail space was given the highest score of 9, while the area with least retail space was given the least score of 1.
Based on these metrics, Mombasa, Mt. Kenya and Kiambu offer the best investment opportunities to mall developers. This is mainly due to a lower retail space supply, with a retail space supply gap of 0.2 mn, 0.2 mn and 0.8 mn SQFT, respectively and household expenditure at Kshs 5,800, Kshs 4,333 and Kshs 5,100 for Mombasa, Mt. Kenya and Kiambu, respectively. The ranking is as shown below:
|
Retail Space Opportunity 2019 |
|||||||
|
Region/Weight |
Retail Yield Score |
Retail Space Score |
Household expenditure (per adult) score |
|
|||
|
|
30% |
30% |
40% |
Weighted score |
Rank |
||
|
Mombasa |
5 |
8 |
8 |
7.1 |
1 |
||
|
Mt. Kenya |
9 |
6 |
5 |
6.5 |
2 |
||
|
Kiambu |
3 |
9 |
7 |
6.4 |
3 |
||
|
Nairobi |
8 |
1 |
9 |
6.3 |
4 |
||
|
Kajiado |
6 |
7 |
2 |
4.7 |
5 |
||
|
Kisumu |
4 |
3 |
6 |
4.5 |
6 |
||
|
Machakos |
2 |
5 |
3 |
3.3 |
7 |
||
|
Uasin Gishu |
7 |
2 |
1 |
3.1 |
8 |
||
|
Nakuru |
1 |
4 |
4 |
3.1 |
8 |
||
|
· Mombasa, Mt. Kenya and Kiambu offer the best investment opportunities to retail mall developers attributed to higher rental yields, higher household expenditure and lower retail space supply · Uasin Gishu and Nakuru are the lowest ranking as a result of lower yields, higher retail space supply and lower household expenditure |
|||||||
Source: Cytonn Research 2019
Section V: Retail Sector Outlook
The table below summarizes metrics that have a possible impact on the retail sector, that is the retail space supply, performance, retail space demand, and concluding with the market opportunity/outlook in the sector.
|
Kenya Retail Sector Outlook 2019 |
||||
|
Measure |
Sentiment 2018 |
Sentiment 2019 |
2018 Outlook |
2019 Outlook |
|
Retail Space Supply |
•Increasing supply with Nairobi currently having a mall space supply of approximately 6.5 mn SQFT, having grown from 2.0mn SQFT in 2010 at 8-yr CAGR of 15.9%. |
• Majority of the Kenyan regions that is Kiambu County, Mt Kenya region, Machakos, Mombasa and Kajiado are undersupplied and therefore, we expect to see developers shifting their focus to these regions • However, in the short-run we expect developers to scale back on the top-tier regions that are oversupplied, that is, Nairobi, Kisumu, Uasin Gishu and Nakuru with more development picking up based on demand from international retailers and investors as well as improved financial environment |
Neutral |
Neutral |
|
Retail Market Performance |
•The retail sector recorded average rental yields of 8.6%, and occupancy rates of 86.0%, which are 0.3% and 5.8% points y/y increase from average rental yield of 8.3% and occupancy rates of 80.2% in 2017 •Mt. Kenya and Kisumu were the best performing regions, with average yields of 9.9% and 9.7%, respectively indicating that the investment opportunity is tilted to the counties outside Nairobi Metropolitan Area |
•The retail sector performance declined by 5.4% and 4.7%, respectively to record rental yields of 8.0% and occupancy rates of 75.1%, respectively •Nairobi and Mt. Kenya were the best performing regions with average rental yields of 8.6% and 8.0%, respectively. Kisumu’s performance dropped significantly indicating due to increased mall supply in the counties |
Positive |
Neutral |
|
Retail Space Demand |
•Kiambu, Mombasa, Kajiado, Mt. Kenya and Machakos are undersupplied by 0.6mn, 0.3mn, 0.2mn,0.2mn and 0.1mn SQFT, respectively, presenting an investment opportunity in these areas |
•Despite four major cities i.e Nakuru, Uasin Gishu, Kisumu and Nairobi being oversupplied, the rest are undersupplied including Kiambu with a retail space demand of 0.8mn SQFT |
Positive |
Neutral |
|
Market Outlook |
The outlook for the sector is neutral and we expect to witness reduced development activity in Nairobi, with developers shifting to county headquarters in some markets such as Kiambu and Mt. Kenya that have retail space demand of 0.8mn and 0.2mn SQFT, respectively |
|||
Source: Cytonn Research 2019
For 2019, the metrics under consideration are neutral and therefore our outlook for the retail sector is neutral. However, we remain optimistic that the sector’s performance will remained cushioned by increased market activity driven by the entry of international retailers into the Kenyan market and the expansion efforts by local retailers such as Naivas and Tuskys as they take advantage of the attractive rental rates. The opportunity remains in county headquarters in some markets such as Kiambu that have retail space demand of 0.8mn SQFT. For more details on the report see the link Cytonn’s Kenya retail Sector Report – 2019
Disclaimer: The views expressed in this publication are those of the writers where particulars are not warranted. This publication is meant for general information only and is not a warranty, representation, advice or solicitation of any nature. Readers are advised in all circumstances to seek the advice of a registered investment advisor.

- Talk to us
- Kenya
- P.O Box 20695 - 00200, Nairobi, Kenya
- Cell +254709101200
- Tel +254709101200
- WhatsApp +254741676635
- United States
- +254709101200
- DOWNLOAD OUR APP
-


- Kenya
- 8th Floor, Pinetree Plaza, Kaburu Drive, Ngong Road, Nairobi, Kenya
- USA
- Suite 1150, 1775 Eye Street NW, USA, Washington DC 20006, USA
- Investments
- High Yield
- Private Equity
- Real Estate
- Real Estate
- RiverRun Estates
- Cytonn Towers
- The Ridge
- Taraji Heights
- The Alma