Kenya Retail Report 2021, & Cytonn Weekly #38/2021
By Research Team, Sep 26, 2021
Executive Summary
Fixed Income
During the week, T-bills remained undersubscribed, with the overall subscription rate coming in at 42.3%, down from the 54.6% recorded the previous week. The 91-day paper recorded the highest subscription rate, receiving bids worth Kshs 4.9 bn against the offered Kshs 4.0 bn, translating to a subscription rate of 119.8%, an increase from the 83.8% recorded the previous week. The subscription rate for the 182-day paper declined to 46.7%, from 68.0%, while that of the 364-day paper declined significantly to 7.0%, from the 29.5% recorded the previous week. The yields on the 91-day, 182-day and 364-day papers increased by 2.6 bps, 3.2 bps and 4.5 bps to 6.9%, 7.3% and 7.9%, respectively. In the Primary Market, the government reopened three bonds, FXD1/2013/15, FXD3/2019/15 and FXD1/2021/25, with effective tenors of 6.4 years, 12.9 years and 24.7 years, respectively;
The Monetary Policy Committee (MPC) is set to meet on Tuesday, 28th September 2021 to review the outcome of its previous policy decisions to decide on the direction of the Central Bank Rate (CBR) and any other policy measure like the Cash Reserve Ratio (CRR). We expect the MPC to maintain the CBR at 7.0% and closely monitor the inflation levels given the recent rise in fuel and food prices. We are projecting the y/y inflation rate for September 2021 to fall within the range of 6.6% - 7.0%, compared to 6.6% recorded in August 2021 mainly driven by the recent increase in fuel and food prices which are major contributors to headline inflation;
Equities
During the week, the equities market was on a downward trajectory, with NASI, NSE 20 and NSE 25 declining by 2.7%, 1.1% and 2.4%, respectively, taking their YTD performance to gains of 16.9%, 8.9% and 14.9% for NASI, NSE 20 and NSE 25, respectively. The equities market performance was driven by losses recorded by large-cap stocks such as Equity Group, Standard Chartered Bank (SCBK), Safaricom and KCB Group of 5.2%, 3.3%, 3.2%, and 3.0%, respectively. The decline was however mitigated by gains recorded by banking stocks such as ABSA and Diamond Trust Bank (DTB-K) which gained by 1.9% and 1.2%, respectively;
Real Estate
During the week, the National Housing Corporation (NHC) began the demolition of 792 detached units in Changamwe Estate in Mombasa County, to pave way for Phase II upgrade of the Estate valued at Kshs 0.4 bn. In the retail sector, Naivas Supermarket, a local retailer, opened a new outlet in Juja City Mall taking up 37,000 SQFT of prime retail space that was previously occupied by Tuskys Supermarket. In the hospitality sector, the United Kingdom (UK) government removed Kenya from the ‘Red List’ of countries banned from entering the UK;
Focus of the Week
In November 2020, we published the Kenya Retail Report 2020 themed “E-commerce Shaping the Retail Sector,” which highlighted that the performance of the retail sector declined recording an average rental yield of 6.7%, 0.3% points lower than the 7.0% recorded in 2019. This week we update our research with the Kenya Retail Report 2021 themed “Rapid Expansion by Retailers to Cushion the Retail Sector,” in which we will highlight the performance of the Kenyan retail market based on rental rates, occupancies and rental yields, to identify investment opportunities and outlook for the sector. In 2021, the Kenyan retail sector performance recorded a 0.1% increase in the average rental yields to 6.8%, from 6.7% in 2020. Average occupancy rates and rental rates also realized an increase of 1.8% points and 2.2% points, respectively, to 78.4% and Kshs 118 per SQFT in 2021 from 76.6% and Kshs 115 per SQFT in 2020, respectively, mainly attributed to an improved business environment as well as aggressive expansion by local and international retailers such as Carrefour and Naivas taking up new retail spaces as well as spaces previously occupied by troubled retailers such as Tuskys thus cushioning the overall performance of the retail market;
Investment Updates:
- Weekly Rates:
- Cytonn Money Market Fund closed the week at a yield of 10.63%. To invest, just dial *809#;
- Cytonn High Yield Fund closed the week at a yield of 13.95% p.a. To invest, email us at sales@cytonn.com and to withdraw the interest you just dial *809#;
- We continue to offer Wealth Management Training Monday through Saturday, from 9:00 am to 11:00 am, through our Cytonn Foundation. The training aims to grow financial literacy among the general public. To register for any of our Wealth Management Trainings, click here;
- If interested in our Private Wealth Management Training for your employees or investment group, please get in touch with us through wmt@cytonn.com;
- As of 1st of September 2021, Cytonn CHYS and CPN Investors have converted Kshs 2.5 billion of their investment funds from the two illiquid funds into real estate, translating to a 20.0% resolution of the debt owed by the two funds. For more information, please see the Cytonn CHYS and CPN Conversion 2.5 bn Real Estate article;
- Any CHYS and CPN investors still looking to convert is welcome to consider one of the five projects currently available for conversion, click here for the latest conversion term sheet;
- Cytonn Insurance Agency acts as an intermediary for those looking to secure their assets and loved ones’ future through insurance namely; Motor, Medical, Life, Property, WIBA, Credit and Fire and Burglary insurance covers. For assistance, get in touch with us through insuranceagency@cytonn.com;
- Cytonnaire Savings and Credit Co-operative Society Limited (SACCO) provides a savings and investments avenue to help you in your financial planning journey. To enjoy competitive investment returns, kindly get in touch with us through clientservices@cytonn.com;
Real Estate Updates:
- For an exclusive tour of Cytonn’s real estate developments, visit: Sharp Investor's Tour, and for more information, email us at sales@cytonn.com;
- Phase 3 of The Alma is now ready for occupation. To rent please email properties@cytonn.com;
- We have 8 investment-ready projects, offering attractive development and buyer targeted returns. See further details here: Summary of Investment-ready Projects;
- For recent news about the group, see our news section here;
Hospitality Updates:
- We currently have promotions for Staycations. Visit cysuites.com/offers for details or email us at sales@cysuites.com;
- Share a meal with a friend during the Sunday Brunch at The Hive Restaurant at Cysuites Hotel and Apartment. Every Sunday from 11.00 AM to 4.00 PM at a price of Kshs 2,500 for Adults and Kshs 1,500 for children under 12 years;
During the week, T-bills remained undersubscribed, with the overall subscription rate coming in at 42.3%, down from the 54.6% recorded the previous week. The 91-day paper recorded the highest subscription rate, receiving bids worth Kshs 4.9 bn against the offered Kshs 4.0 bn, translating to a subscription rate of 119.8%, an increase from the 83.8% recorded the previous week. The subscription rate for the 182-day paper declined to 46.7%, from 68.0%, while that of the 364-day paper declined significantly to 7.0%, from the 29.5% recorded the previous week. The yields on the 91-day, 182-day and 364-day papers increased by 2.6 bps, 3.2 bps and 4.5 bps to 6.9%, 7.3% and 7.9%, respectively. The government accepted all the Kshs 10.2 bn worth of bids received, translating to an acceptance rate of 100.0%.
In the Primary Market, the government reopened three bonds, FXD1/2013/15, FXD3/2019/15 and FXD1/2021/25, with effective tenors of 6.4 years, 12.9 years and 24.7 years, respectively, in a bid to raise Kshs 60.0 bn for budgetary support. The coupon rates are 11.3% for FXD1/2013/15, 12.3% for FXD3/2019/15 and 13.9% for FXD1/2021/25. We expect investors to prefer the longer dated papers, FXD3/2019/15 and FXD1/2021/25, as they search for higher yields. The bonds are currently trading in the secondary market at yields of 11.7%, 12.7% and 13.5%, for FXD1/2013/15, FXD3/2019/15 and FXD1/2021/25, respectively, and as such, our recommended bidding range for the three bonds are: 11.5%-11.8% for FXD1/2013/15, 12.3%-12.7% for FXD3/2019/15 and 13.2%-13.5% for FXD1/2021/25. The period of the sale runs until 5th October 2021.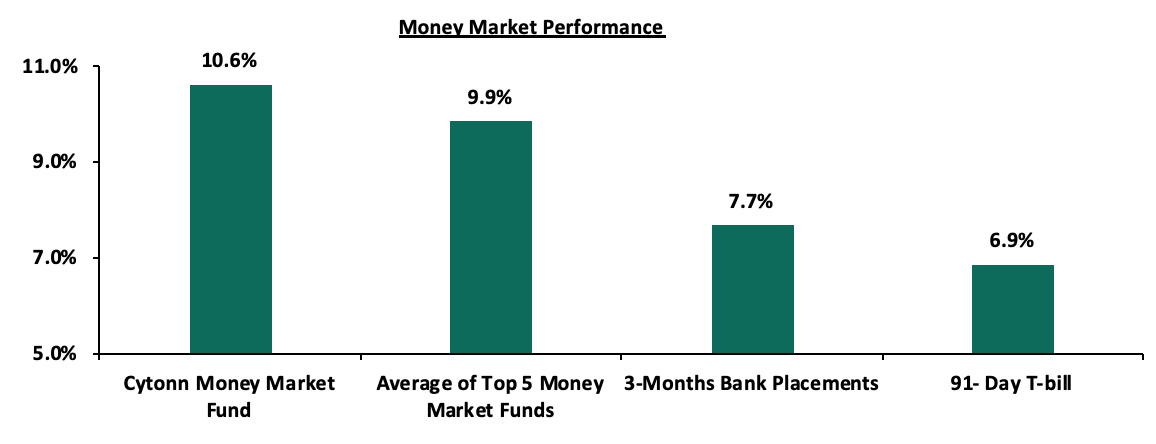
In the money markets, 3-month bank placements ended the week at 7.7% (based on what we have been offered by various banks), while the yield on the 91-day T-bill increased by 2.6 bps to 6.9%. The average yield of the Top 5 Money Market Funds increased marginally by 0.1% points to 9.9%, from 9.8% recorded the previous week. The yield on the Cytonn Money Market Fund remained unchanged at 10.6% as was recorded the previous week.
The table below shows the Money Market Fund Yields for Kenyan Fund Managers as published on 24th September 2021:
|
Money Market Fund Yield for Fund Managers as published on 24th September 2021 |
|||
|
Rank |
Fund Manager |
Daily Yield |
Effective Annual Rate |
|
1 |
Cytonn Money Market Fund |
10.10% |
10.63% |
|
2 |
Nabo Africa Money Market Fund |
9.70% |
10.18% |
|
3 |
Zimele Money Market Fund |
9.56% |
9.91% |
|
4 |
Sanlam Money Market Fund |
9.04% |
9.46% |
|
5 |
Madison Money Market Fund |
8.72% |
9.11% |
|
6 |
CIC Money Market Fund |
8.69% |
8.99% |
|
7 |
Apollo Money Market Fund |
9.10% |
8.95% |
|
8 |
Dry Associates Money Market Fund |
8.46% |
8.80% |
|
9 |
GenCapHela Imara Money Market Fund |
8.38% |
8.74% |
|
10 |
Co-op Money Market Fund |
8.31% |
8.66% |
|
11 |
Orient Kasha Money Market Fund |
8.21% |
8.55% |
|
12 |
British-American Money Market Fund |
8.16% |
8.47% |
|
13 |
ICEA Lion Money Market Fund |
8.00% |
8.33% |
|
14 |
NCBA Money Market Fund |
8.02% |
8.33% |
|
15 |
Old Mutual Money Market Fund |
7.11% |
7.35% |
|
16 |
AA Kenya Shillings Fund |
6.50% |
6.70% |
Source: Business Daily
Liquidity:
During the week, liquidity in the money markets tightened, with the average interbank rate increasing by 2.0% points to 6.1%, from 4.1% recorded the previous week, partly attributable to the tax remittances which offset government payments made during the week. The average interbank volumes declined by 2.0% to Kshs 16.9 bn, from Kshs 17.2 bn recorded the previous week.
Kenya Eurobonds:
During the week, yields on all the Eurobonds increased marginally, with the yields on the 10-year bond issued in 2018, 30-year issued in 2018, 7-year issued in 2019, and 12-year bond issued in 2019 all increasing by 0.2% points to 5.3%, 7.4%, 5.0%, and 6.4%,respectively. Yields on the 10-year bond issued in 2014 increased by 0.1% to 3.1% while yield on the 12-year bond issued to 6.4%. Below is a summary of the performance:
|
Kenya Eurobond Performance |
||||||
|
|
2014 |
2018 |
2019 |
2021 |
||
|
Date |
10-year issue |
10-year issue |
30-year issue |
7-year issue |
12-year issue |
12-year issue |
|
31-Dec-20 |
3.9% |
5.2% |
7.0% |
4.9% |
5.9% |
- |
|
31-Aug-21 |
3.1% |
5.0% |
7.1% |
4.6% |
6.0% |
5.9% |
|
17-Sep-21 |
3.0% |
5.1% |
7.2% |
4.8% |
6.2% |
6.1% |
|
20-Sep-21 |
3.0% |
5.2% |
7.3% |
4.9% |
6.3% |
6.3% |
|
21-Sep-21 |
3.0% |
5.1% |
7.3% |
4.9% |
6.3% |
6.2% |
|
22-Sep-21 |
3.1% |
5.2% |
7.3% |
4.9% |
6.3% |
6.3% |
|
23-Sep-21 |
3.1% |
5.3% |
7.4% |
5.0% |
6.4% |
6.4% |
|
Weekly Change |
0.1% |
0.2% |
0.2% |
0.2% |
0.2% |
0.3% |
|
MTD Change |
0.0% |
0.3% |
0.3% |
0.4% |
0.4% |
0.5% |
|
YTD Change |
(0.8%) |
0.2% |
0.4% |
0.1% |
0.4% |
- |
Source: CBK Weekly Bulletin
Kenya Shilling:
During the week, the Kenyan shilling depreciated marginally by 0.3% against the US dollar to close the week at Kshs 110.4, from Kshs 110.1 recorded the previous week, mainly attributable to increased dollar demand from oil and general merchandise importers. On a YTD basis, the shilling has depreciated by 1.1% against the dollar, in comparison to the 7.7% depreciation recorded in 2020. We expect the shilling to remain under pressure for the remainder of 2021 as a result of:
- Rising uncertainties in the global market due to the Coronavirus pandemic, which has seen investors continue to prefer holding their investments in dollars and other hard currencies and commodities,
- The widened current account position which increased by 0.5% points to 5.4% of GDP in the 12 months to August 2021, from 4.9% of GDP for a similar period in 2020, and,
- Demand from energy importers as they beef up their hard currency positions in the prevailing elevated global oil prices.
The shilling is however expected to be supported by:
- The Forex reserves, currently at USD 9.5 bn (equivalent to 5.8 months of import cover), which is above the statutory requirement of maintaining at least 4.0 months of import cover, and the EAC region’s convergence criteria of 4.5-months of import cover, and,
- Improving diaspora remittances evidenced by a 14.2% y/y increase to USD 312.9 mn in August 2021, from USD 274.1 mn recorded over the same period in 2020, which has continued to cushion the shilling against further depreciation.
Weekly Highlight
- September MPC Meeting
The Monetary Policy Committee (MPC) is set to meet on Tuesday, 28th September to review the outcome and effectiveness of its previous policy decisions and recent economic developments, and to decide on the direction of the Central Bank Rate (CBR) and any other policy measure like the Cash Reserve Ratio (CRR). In their previous meeting held on 28th July 2021, the committee maintained the CBR at 7.00%, in line with our expectations, citing that the accommodative policy stance adopted in March 2020 and all other sittings ever since, remained appropriate and were having the desired effects on the economy. We expect the MPC to maintain the Central Bank Rate (CBR) at 7.00% and to closely monitor the rising inflation rates. Some of the key driving factors shall include;
- Inflation remaining within the government’s target range of 2.5% - 7.5%. August’s inflation stood at 6.6%, the highest reading since the pandemic began. We anticipate the Inflation pressures to remain elevated in the short term mainly driven by increases in food and fuel prices as well as the impact of the increase in tariffs and taxes as we foresee a concurrent contribution to the increase in the headline inflation. With the possibility of further fuel price increases, we might see an even higher inflation figure in the coming months as the cost of living remains elevated.,
- The need to support the economy and credit growth in the private sector. The current macro and business environment fundamentals might constrain the transmission of further easing, despite the need to stimulate economic growth. Kenya’s private sector credit growth in July 2021 stood at 7.7%, below CBK’s target of 10.2% by December 2021, an indication of the cautious lending by banks towards the Private Sector. We therefore believe that any additional rate cuts will not lead to a rise in private sector credit growth as banks will prefer lending to the government, and,
- The need to refine macroeconomic modelling and forecasting frameworks to reflect the economy's changing structure. Similar measures include improving the interbank market's functioning to strengthen monetary policy transmission and operations, and improving public understanding of monetary policy decisions. We expect this to support better anchoring of inflation expectations in view of the changing economic and financial environment.
- The shilling has remained range bound and therefore the need to ensure that the shilling is balanced and there is no significant pressure on it is key.
For a more detailed analysis, please see our MPC note here.
- September Inflation Projections
We are projecting the y/y inflation rate for September 2021 to fall within the range of 6.6% - 7.0%. The key drivers include:
- The recent hike in fuel prices, with Super Petrol prices increasing by 6.0% to Kshs 134.7 per litre, from Kshs 127.1 per litre. Diesel and Kerosene prices also increased by 7.4% and 13.2%, respectively to Kshs 115.6 and Kshs 110.8 per litre, from Kshs 107.7 and Kshs 97.9 per litre, respectively. With fuel being a major contributor to Kenya’s headline inflation, the increase in fuel prices is expected to have a ripple effect in increasing the prices of other contributors to the consumer price index like food and transport,
- Increase in food and non-alcoholic drinks prices, which have the largest weighting in the consumer price index at 32.9%, attributable to an increase in imported components like cooking oil and below average rainfall recorded in most parts of the country, and,
- Upward readjustment of the fuel cost charge on electricity bills by 2.9% to Kshs 3.9 per Kilowatt hour (KWh) from Kshs 3.8 per Kilowatt hour (KWh) and foreign exchange fluctuation tariff for electricity usage to 76.0 cents per Kilowatt hour (KWh) in September from 68.0 cents per Kilowatt hour (KWh) in August. The readjustment will increase the cost of electricity consumption for households.
Going forward, we expect the inflation rate to remain within the government’s set range of 2.5% - 7.5%. However, our concern on the inflation rate nearing the upper limit of 7.5% persists, driven by increases in fuel and food prices which are major contributors to Kenya’s headline inflation. Should the increase in inflation persist, the CBK and the Government may have to intervene with monetary and fiscal policies in-order to comply with the conditions set by the IMF, in the Extended Credit facility agreement between the IMF and the Government in February 2021. In the agreement, IMF indicated that Kenya’s inflation should remain well anchored and between the government target range so that Kenya can continue accessing the loan facility already approved. Given that the next IMF evaluation test date is in December 2021, the government has a sufficient period to readjust in the event of the spike in the inflation rate in the months in between.
Rates in the fixed income market have remained relatively stable due the sufficient levels of liquidity in the money market. The government is 63.4% ahead of its prorated borrowing target of Kshs 164.6 bn having borrowed Kshs 269.1 bn of the Kshs 658.5 bn borrowing target for the FY’2021/2022. We expect a gradual economic recovery going into FY’2021/2022 as evidenced by KRAs collection of Kshs 247.2 bn in revenues during the first two months of the current fiscal year, which is equivalent to 86.9% of the prorated revenue collection target. However, despite the projected high budget deficit of 7.5% and the lower credit rating from S&P Global to 'B' from 'B+', we believe that the monetary support from the IMF and World Bank will mean that the interest rate environment may stabilize since the government will not be desperate for cash.
Markets Performance
During the week, the equities market was on a downward trajectory, with NASI, NSE 20 and NSE 25 declining by 2.7%, 1.1% and 2.4%, respectively, taking their YTD performance to gains of 16.9%, 8.9% and 14.9% for NASI, NSE 20 and NSE 25, respectively. The equities market performance was driven by losses recorded by large-cap stocks such as Equity Group, Standard Chartered Bank (SCBK), Safaricom and KCB Group of 5.2%, 3.3%, 3.2%, and 3.0%, respectively. The decline was however mitigated by gains recorded by banking stocks such as ABSA and Diamond Trust Bank (DTB-K) which gained by 1.9% and 1.2%, respectively.
During the week, equities turnover increased by 31.4% to USD 29.2 mn, from USD 22.2 mn recorded the previous week, taking the YTD turnover to USD 914.0 mn. Foreign investors turned net sellers, with a net selling position of USD 7.7 mn, from a net buying position of USD 1.9 mn recorded the previous week, taking the YTD to a net selling position to USD 14.8 mn.
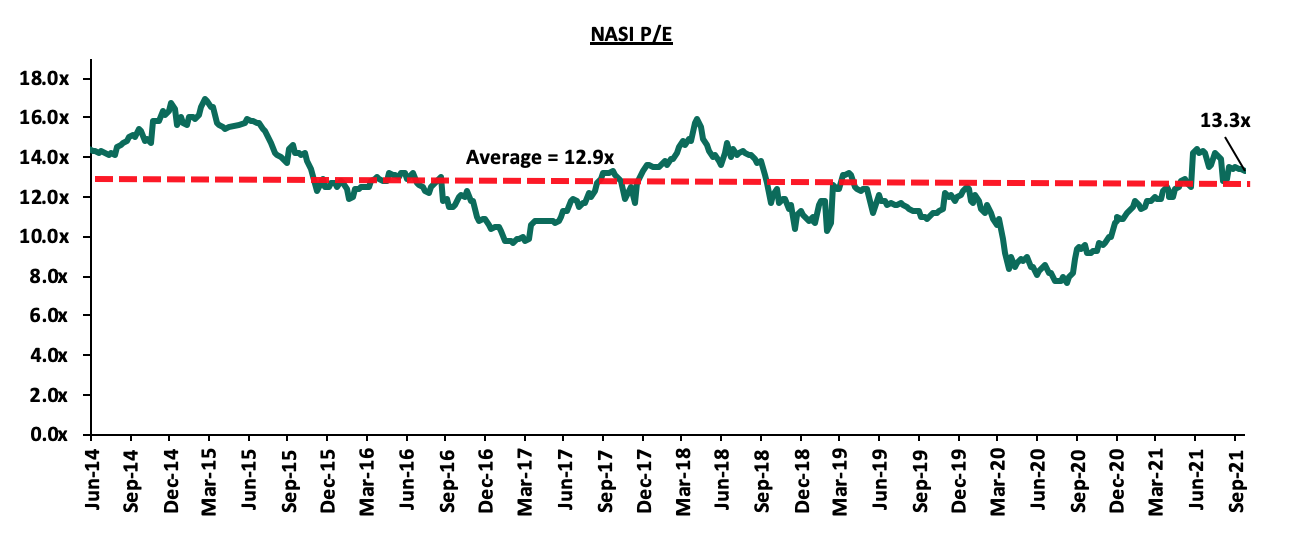
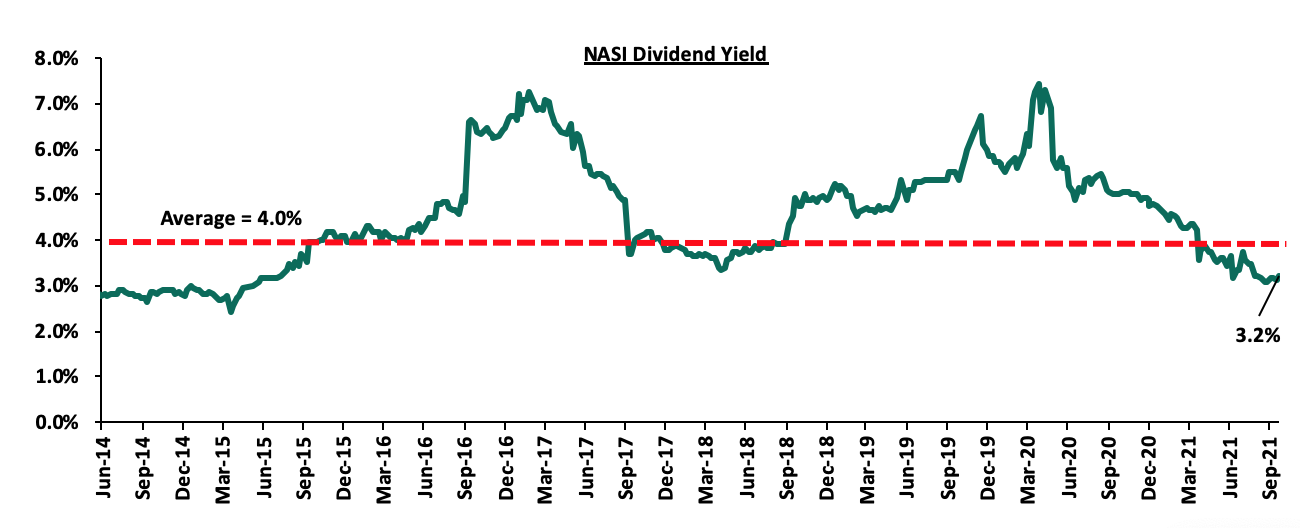
The market is currently trading at a price to earnings ratio (P/E) of 13.3x, 2.9% above the historical average of 12.9x, and a dividend yield of 3.2%, 0.8% points below the historical average of 4.0%. Key to note, NASI’s PEG ratio currently stands at 1.5x, an indication that the market is trading at a premium to its future earnings growth. Basically, a PEG ratio greater than 1.0x indicates the market may be overvalued while a PEG ratio less than 1.0x indicates that the market is undervalued. Excluding Safaricom, which is currently 61.2% of the market, the market is trading at a P/E ratio of 12.1x and a PEG ratio of 1.4x. The current P/E valuation of 13.3x is 72.9% above the most recent trough valuation of 7.7x experienced in the first week of August 2020. The charts below indicate the historical P/E and dividend yields of the market.
Universe of Coverage:
|
Company |
Price as at 17/09/21 |
Price as at 24/09/21 |
w/w change |
YTD Change |
Year Open 2021 |
Target Price* |
Dividend Yield |
Upside/ Downside** |
P/TBv Multiple |
Recommendation |
|
I&M Group*** |
22.7 |
23.0 |
1.5% |
(48.7%) |
44.9 |
32.0 |
9.8% |
48.9% |
0.6x |
Buy |
|
Kenya Reinsurance |
2.5 |
2.5 |
(1.2%) |
8.2% |
2.3 |
3.1 |
8.0% |
32.0% |
0.3x |
Buy |
|
ABSA Bank*** |
10.4 |
10.6 |
1.9% |
10.8% |
9.5 |
13.8 |
0.0% |
30.8% |
1.2x |
Buy |
|
NCBA*** |
27.7 |
27.1 |
(2.2%) |
1.7% |
26.6 |
31.0 |
5.5% |
20.1% |
0.7x |
Buy |
|
Standard Chartered*** |
134.5 |
130.0 |
(3.3%) |
(10.0%) |
144.5 |
145.4 |
8.1% |
19.9% |
1.0x |
Accumulate |
|
KCB Group*** |
48.6 |
47.1 |
(3.0%) |
22.7% |
38.4 |
53.4 |
2.1% |
15.5% |
1.0x |
Accumulate |
|
Co-op Bank*** |
13.5 |
13.2 |
(2.2%) |
5.2% |
12.6 |
14.1 |
7.6% |
14.4% |
0.9x |
Accumulate |
|
Equity Group*** |
53.3 |
50.5 |
(5.2%) |
39.3% |
36.3 |
57.5 |
0.0% |
13.9% |
1.4x |
Accumulate |
|
Stanbic Holdings |
91.0 |
92.0 |
1.1% |
8.2% |
85.0 |
96.6 |
1.8% |
6.8% |
0.9x |
Hold |
|
Diamond Trust Bank*** |
62.8 |
63.5 |
1.2% |
(17.3%) |
76.8 |
67.3 |
0.0% |
6.0% |
0.3x |
Hold |
|
Sanlam |
11.5 |
11.9 |
3.5% |
(8.5%) |
13.0 |
12.4 |
0.0% |
4.2% |
1.1x |
Lighten |
|
Liberty Holdings |
8.0 |
8.1 |
1.8% |
5.7% |
7.7 |
8.4 |
0.0% |
3.2% |
0.6x |
Lighten |
|
Jubilee Holdings |
350.3 |
368.8 |
5.3% |
33.7% |
275.8 |
330.9 |
2.4% |
(7.8%) |
0.8x |
Sell |
|
Britam |
8.3 |
8.1 |
(2.9%) |
15.4% |
7.0 |
6.7 |
0.0% |
(17.1%) |
1.5x |
Sell |
|
HF Group |
3.9 |
4.1 |
4.1% |
29.9% |
3.1 |
3.1 |
0.0% |
(24.0%) |
0.2x |
Sell |
|
CIC Group |
2.7 |
2.7 |
0.7% |
29.4% |
2.1 |
1.8 |
0.0% |
(34.1%) |
0.9x |
Sell |
|
Target Price as per Cytonn Analyst estimates **Upside/ (Downside) is adjusted for Dividend Yield ***For Disclosure, these are stocks in which Cytonn and/or its affiliates are invested in Key to note, I&M Holdings YTD share price change is mainly attributable to the counter trading ex-bonus issue |
||||||||||
We are “Neutral” on the Equities markets in the short term. With the market currently trading at a premium to its future growth (PEG Ratio at 1.5x), we believe that investors should reposition towards companies with a strong earnings growth and are trading at discounts to their intrinsic value. Additionally, we expect the recent discovery of new strains of COVID-19 coupled with the introduction of strict lockdown measures in major economies to continue dampening the economic outlook.
- Residential Sector
During the week, the National Housing Corporation (NHC) began the demolition of 792 detached units in Changamwe Estate in Mombasa County, to pave way for Phase II upgrade of the Estate valued at Kshs 0.4 bn. The County Government of Mombasa looks to complete over 9,000 affordable housing units by 2024 through joint ventures with private developers. Phase I of the redevelopment project which consisted of 84 units is already complete and some of the tenants who have completed their rent arrears and signed tenancy agreement will move in as demolition and reconstruction of their old houses begins. The project will also include a commercial space and social amenities such as schools and recreation centers. Upon successful completion, the project is expected to; i) provide decent and affordable homes for residents of Changamwe Estate, ii) improve standards of living for residents in this Estate through the upgrade, iii) enhance Kenyans confidence in the affordable housing program, and, iv) boost home ownership rate in the country with the government planning to have the cost of the housing units deducted through an affordable Tenancy Purchase Scheme which will be equivalent to the current rent levels over a period of time.
The redevelopment comes after the County government of Mombasa began demolitions at Buxton Estate in May 2021, to pave way for 1,860 affordable houses at a cost of Kshs 6.0 bn. These estates are a part of a Kshs 200.0 bn housing plan to redevelop ten estates through a joint venture between County Government of Mombasa and private investors, with other estates such as Kaa Chonjo, Khadija, Kizingo and Nyerere in the pipeline for facelift.
Despite the efforts to support the housing initiative in Kenya, home ownership rates are still low at 21.3% as at 2020, compared to other African countries such as Ghana with a 47.2% according to Center for Affordable Housing Africa. Considering the housing deficit of 2.0 mn units which continues to grow annually by 200,000 units, and the low annual supply rate, it might not be easy to meet the targeted 500,000 affordable housing units by 2022 under the Affordable Housing Initiative, since we are yet to see a significant part of that delivered. Current hurdles constraining supply of affordable houses in the country include; i) high construction costs, ii) the pending operationalization of the Integrated Project Delivery Unit under the Ministry of Housing as a single point of regulatory approval for developments, infrastructure provision and developer incentive, iii) lack of development finance as investors hold back monies during the tough economic times coupled with a non-supportive capital markets regulatory framework, and, iv) reduced revenue inflows and disruption of supply chains due to the pandemic.
The graph below shows the home ownership percentages of different countries compared to Kenya;
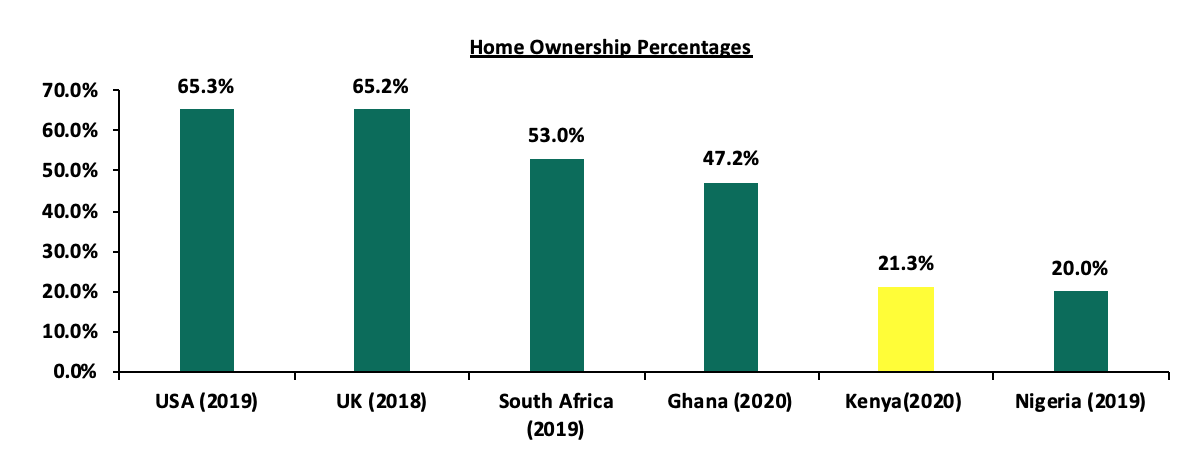
Source: Center for Affordable Housing Africa, Federal Reserve Bank
To address the low home ownership rate, government is providing institutional housing, slum upgrading and private affordable homes programs under the affordable housing initiative, and established the Boma Yangu online platform, which facilitates registration for housing allocations and has so far attracted at least 322,343 applications. Given the negligible number of units delivered compared to existing demand, we expect the current housing deficit to expand further driven by the relatively high urbanization growth rates of 4.0% p.a compared to Sub-Saharan Africa’s at 3.5% p.a by 2030 according to World Bank.
- Retail Sector
During the week, Naivas Supermarket, a local retailer, opened a new outlet in Juja City Mall taking up 37,000 SQFT of prime retail space that was previously occupied by Tuskys Supermarket. The retailer has been on an expansion spree to maintain retail market dominance with this being its 76th outlet, having opened 6 other outlets so far this year as they also recently opened a new outlet in Kisumu’s Simba Hall, in July 2021. The retailer aims to increase its footprint in the Kenyan retail market amid competition from international retailer Carrefour which has opened 5 outlets in 2021, and local retailer QuickMart which has opened 4 outlets this year. The decision to invest in Juja is attributable to; i) the location of the Juja City Mall along Thika Superhighway which will enhance accessibility by both clients and suppliers, ii) the close proximity to the Jomo Kenyatta University of Agriculture of Technology (JKUAT) from which the retailer expects to form a significant part of the clientele base, iii) the availability of prime rental space left by the beleaguered Tuskys Supermarket, iv) the need to boost sales through promotions and e-commerce by tapping into the vibrant Juja market, and, v) the retailer’s necessity to meet the customer tastes and preferences in the area by diversifying their a range of consumer products including a food market and an alcoholic joint.
According to our Kenya Retail Report 2021, the average rent/SQFT for Thika Road is Kshs 158.0 which is 6.0% lower than the market average of Kshs 168.0 implying affordability, hence the basis for investing along the area.
The table below shows the submarket performance in the Nairobi Metropolitan Area (NMA);
|
Nairobi Metropolitan Area (NMA) Sub Market Performance |
|||
|
Area |
Rent (Kshs)/SQFT 2021 |
Occupancy % 2021 |
Rental Yield 2021 |
|
Westlands |
209 |
80.4% |
9.7% |
|
Karen |
214 |
80.8% |
9.4% |
|
Kilimani |
172 |
83.6% |
9.0% |
|
Ngong Road |
175 |
78.0% |
7.8% |
|
Kiambu road |
178 |
70.4% |
7.2% |
|
Thika Road |
158 |
74.2% |
6.7% |
|
Satellite towns |
138 |
72.2% |
6.1% |
|
Mombasa road |
136 |
70.5% |
6.0% |
|
Eastlands |
135 |
72.5% |
5.9% |
|
Average |
168 |
75.8% |
7.5% |
Source: Cytonn Research 2021
The table below shows the summary of the number of stores of the Key local and international retailer supermarket chains in Kenya;
|
Main Local and International Retail Supermarket Chains |
|||||||||
|
Name of Retailer |
Category |
Highest number of branches that have ever existed as at FY’2018 |
Highest number of branches that have ever existed as at FY’2019 |
Highest number of branches that have ever existed as at FY’2020 |
Number of branches opened in 2021 |
Closed branches |
Current number of Branches |
Number of branches expected to be opened |
Projected number of branches FY’2021 |
|
Naivas |
Local |
46 |
61 |
69 |
7 |
0 |
76 |
4 |
80 |
|
QuickMart |
Local |
10 |
29 |
37 |
4 |
0 |
41 |
4 |
45 |
|
Chandarana Foodplus |
Local |
14 |
19 |
20 |
1 |
0 |
21 |
2 |
23 |
|
Carrefour |
International |
6 |
7 |
9 |
5 |
0 |
16 |
0 |
16 |
|
Cleanshelf |
Local |
9 |
10 |
11 |
1 |
0 |
12 |
0 |
12 |
|
Tuskys |
Local |
53 |
64 |
64 |
0 |
61 |
3 |
0 |
3 |
|
Game Stores |
International |
2 |
2 |
3 |
0 |
0 |
3 |
0 |
0 |
|
Uchumi |
Local |
37 |
37 |
37 |
0 |
35 |
2 |
0 |
2 |
|
Choppies |
International |
13 |
15 |
15 |
0 |
13 |
2 |
0 |
2 |
|
Shoprite |
International |
2 |
4 |
4 |
0 |
4 |
0 |
0 |
0 |
|
Nakumatt |
Local |
65 |
65 |
65 |
0 |
65 |
0 |
0 |
0 |
|
Total |
257 |
313 |
334 |
18 |
178 |
176 |
10 |
183 |
|
Source: Online Research
The retail sector is expected to be supported by expansion activities by the various retailers in an aim to increase their footprint and tap into extra markets by taking up spaces previously occupied by troubled retailers such as Tuskys. The rise of e-commerce market trend through online sales and deliveries is also expected to boost revenues for retailers in the country going forward. The retail sector performance is however expected to be weighed down factors such as oversupply with areas such as Nairobi, Kisumu, Uasin Gishu and Nakuru being the most oversupplied at by 3.0 mn, 0.3 mn, 0.1 mn and 0.1 mn SQFT of space as at 2021 and financial constraints limiting expansion.
- Hospitality Sector
During the week, the United Kingdom (UK) government removed Kenya from the ‘Red List’ of countries banned from entering the UK. Kenya is now on the ‘Amber-list’ which has now been joined with the ‘Green-List’ to form the low risk category citing convincing data about covid-19 vaccination numbers and the efficiency of the vaccine. Kenyans will now be allowed into the UK after a 6-month ban since April 2021 due to fears of the Covid-19 Delta variant, which led to a decline in the number of international arrivals in the country since UK nationals were not allowed to travel to the ‘Red-List’ countries, while those coming from such are faced with high quarantine charges upon arrival. According to the Tourism Research Institute, UK formed the 5th source market for international tourists on Kenya in H1’2021 with 16,264 visitors which was 5.3% of the total visitor arrivals at 305,635. This performance was despite the ban in April, and therefore lifting of the travel ban is expected to increase the number of visitors going forward. For the period, United States of America (USA), Uganda, Tanzania and China formed the top four source markets with 49,178, 31,418, 31,291 and 18,069 visitors, respectively. In terms of overall performance, according to the Kenya National Bureau of Statistics (KNBS), international arrivals through Jomo Kenyatta International Airport (JKIA) and Moi International Airport (MIA) registered an improvement from 1,177 arrivals in Q2’2020 to 113,307 arrivals in Q2’2021. However, there was a 7.5% decline in international arrivals from 122,498 visitors in Q1’2021 to 113,307 visitors in Q2’2021 through the same airports attributable to travel bans and advisories from key source markets such as the UK and the United States America (USA).
The graph below shows the number of visitor arrivals through Jomo Kenyatta International Airport (JKIA) and Moi International Arrivals (MIA) between Q1’2020 and Q2’2021;
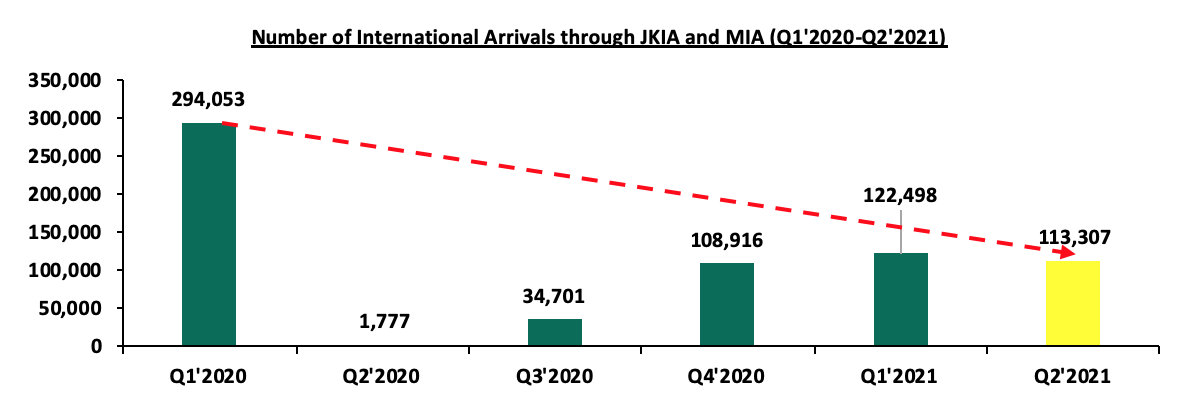
Source: Kenya National Bureau of Statistics
The hospitality sector is expected to continue on a path of recovery through the ongoing government and private sector efforts such as; i) the Ministry of Tourism ensuring mass vaccination against Covid-19 for industry players to boost confidence, ii) aggressive marketing of the Kenyan hospitality industry through Magical Kenya platform to the rest of the world with international promotions in countries such as the Ukraine currently underway, and, iii) the return of international flights to the country that had initially stalled due to travel bans and pending the actualization of Covid-19 travel guidelines. The Ministry of Tourism is however projecting a return to full normalcy to pre-pandemic levels in 2024 attributable to the slow monitoring of situations relating to the handling of the Covid-19 pandemic before the relaxation of measures that had initially been put in place.
The real estate sector is expected to record improvements supported by the government’s efforts to support Affordable Housing Initiative, retailer’s aggressiveness to expand and compete favorably, and the expected increase in international tourist arrivals which will boost the performance of the hospitality sector.
In November 2020, we published the Kenya Retail Report 2020 themed “E-commerce Shaping the Retail Sector,” which highlighted that the performance of the sector declined recording an average rental yield of 6.7%, 0.3% points lower than the 7.0% recorded in 2019. The subdued performance was largely attributed to; i) reduction in rental rates in a bid to attract tenants amid a tough economic environment which saw the rental rates in the sector post a 2.1% decline to Kshs 115.1 per SQFT in 2020, from Kshs 118.0 per SQFT in 2019, and, ii) reduced occupancy rates which declined by 0.7% points Y/Y from 77.3% in 2019 to 76.6% in 2020 attributable to reduced demand for physical retail space due to growing focus on e-commerce and scaling down of retailers in the wake of reduced revenue inflows.
This week we will update our research with the Kenya Retail Report 2021 themed “Rapid Expansion by Retailers to Cushion the Retail Sector,” in which we will highlight the performance of the Kenyan retail sector based on research conducted on 9 nodes within the Nairobi metropolitan Area (NMA), as well as other key urban cities in Kenya which include Nakuru, Kisumu, Eldoret, Mombasa, and the Mount Kenya Region. This is in order to identify the market performance based on rental rates, occupancies and rental yields, thereby identifying the investment opportunities and outlook for the sector. Therefore, the topical shall cover;
- Overview of the Kenya Retail Sector in 2021
- Kenya Retail Sector Performance Summary in 2021,
- Retail Space Demand Analysis,
- Retail Sector Investment Opportunity, and,
- Retail Sector Outlook.
Section I: Overview of the Kenya Retail Sector in 2021
In 2021, the Kenyan retail sector registered increased market activities evidenced by the aggressive expansion by major local and international retailers as opposed to 2020 which was marked with lockdowns leading to retailers scaling down their businesses to cushion themselves against the pandemic. Some of the retailers who have been on an aggressive expansion drive during the year include; i) Naivas supermarket opening 7 new stores in Kilifi, Kisumu, Nakuru, Eldoret, and Nairobi, ii) Carrefour opening 5 new stores in Kwale, Nairobi, and Kisumu, iii) QuickMart supermarket opening 4 new stores Nairobi and Eldoret, iv) Cleanshelf supermarket opening a new store in Nakuru, and v) Chandarana Food Plus opening a new outlet in Eldoret.
The table below shows the summary of the number of stores of the Key local and international retailer supermarket chains in Kenya;
|
Main Local and International Retail Supermarket Chains |
|||||||||
|
Name of Retailer |
Category |
Highest number of branches that have ever existed as at FY’2018 |
Highest number of branches that have ever existed as at FY’2019 |
Highest number of branches that have ever existed as at FY’2020 |
Number of branches opened in 2021 |
Closed branches |
Current number of Branches |
Number of branches expected to be opened |
Projected number of branches FY’2021 |
|
Naivas |
Local |
46 |
61 |
69 |
7 |
0 |
76 |
4 |
80 |
|
QuickMart |
Local |
10 |
29 |
37 |
4 |
0 |
41 |
4 |
45 |
|
Chandarana Foodplus |
Local |
14 |
19 |
20 |
1 |
0 |
21 |
2 |
23 |
|
Carrefour |
International |
6 |
7 |
9 |
5 |
0 |
16 |
0 |
16 |
|
Cleanshelf |
Local |
9 |
10 |
11 |
1 |
0 |
12 |
0 |
12 |
|
Tuskys |
Local |
53 |
64 |
64 |
0 |
61 |
3 |
0 |
3 |
|
Game Stores |
International |
2 |
2 |
3 |
0 |
0 |
3 |
0 |
0 |
|
Uchumi |
Local |
37 |
37 |
37 |
0 |
35 |
2 |
0 |
2 |
|
Choppies |
International |
13 |
15 |
15 |
0 |
13 |
2 |
0 |
2 |
|
Shoprite |
International |
2 |
4 |
4 |
0 |
4 |
0 |
0 |
0 |
|
Nakumatt |
Local |
65 |
65 |
65 |
0 |
65 |
0 |
0 |
0 |
|
Total |
257 |
313 |
334 |
18 |
178 |
176 |
10 |
183 |
|
Source: Online Search
Additionally, Giordano, a Hong Kong clothing retailer, opened its 3rd store in Nairobi at Two Rivers Mall along Kiambu Road, taking up 1,076 SQFT space. Kentucky Fried Chicken (KFC), a United States of America (USA) fast food chain, opened a new branch in Mombasa County, in an expansion drive that saw it take up approximately 2,200 SQFT of space in Mombasa Trade Centre, marking its first outlet in the county. Optica Limited, a local eye-wear retailer, opened its 43rd Kenyan outlet in Gateway Mall along Mombasa Road as part of the retailer’s expansion strategy of the geographical outreach of its products and services. Artcaffe Group, a restaurant chain based in Kenya, announced plans to open four new outlets within the Nairobi Metropolitan Area in Kileleshwa, Freedom Height Mall in Lang’ata, ACK Gardens in Upperhill, and at Hardy in Ngong, whereas Java House Africa Group, an international restaurant chain, announced plans to open 30 new Kukito outlets in various parts of Nairobi, in the next five years. These aggressive expansion move by the retailers taking up space previously occupied by troubled retailers as well as new retail spaces has therefore boosted the market’s performance. In addition to the recent expansions, some of the developments in the pipeline expected to be completed by the end of year include; i) City Mall Phase II project in Mombasa, ii) Crystal Rivers Mall in Mavoko, and, iii) Imaara Mall along Mombasa Road.
Some of the factors driving the growth in the sector include;
- Improved Infrastructure Developments- Government’s continued focus on implementing and completing major infrastructural projects has enabled easier access to retail stores as well as boost investor confidence in the investment opportunities and property prices,
- Positive Demographics- Kenya’s relatively high urbanization and population growth rates of 4.0% p.a and 2.3% p.a, respectively against the global average of 0.9% p.a and 1.1% p.a, respectively, has also initiated the sector’s growth and performance through increased demand for retail products, services and spaces,
- Aggressive Expansion of Local and International Retailers- Retailers such as Carrefour, Naivas and QuickMart have been aggressively taking up prime retail space initially occupied by troubled retailers such as Tuskys, Uchumi and Nakumatt, thereby in return cushioning the overall performance of the sector of focus,
- Improvement in Ease of Doing Business- Investor confidence has also been improving with Kenya currently ranking position #56 as at 2019 according to World Bank, which in return drives more expansion activities and developments in the country thereby initiating growth of the sector,
- Recognition of Kenya as a Regional Hub- Kenya has attracted many international organizations and retailers into the country such as Kentucky Fried Chicken (KFC) and Giordano, thus the continued demand for retail space in the country, and,
- Affordability of Retail Spaces- Certain urban cities in the country such as Kisumu and Nakuru have attracted retail investments as a result of their affordable rents, having recorded rental rates of Kshs 101 and Kshs 59 per SQFT, respectively against the market average of Kshs 118 per SQFT in 2021.
Despite the above supporting factors, there exists challenges that affected growth and overall performance of the sector which include;
- Online Shopping and E-Commerce Strategy- This is still being adopted in various parts of the country thus causing declined demand for physical retail space and an overall hindrance of its growth and performance,
- Constrained Spending Power- This is as a result of the tough economic conditions brought by the pandemic which caused financial constraints, leading to minimal development activities by developers in addition to some retailers exiting their spaces and as customers purchasing powers reduced from the effects of COVID-19,
- Limited Access to credit loans- This is due to inadequacy and limited income which isn’t able to finance the available loans. According to Kenya National Bureau of Statistics, financial activities from the real estate sub sector grew by 4.2% in 2020 compared to 6.2% growth in 2019, with the decline being attributed to the tough economic environment amidst the awakening of the pandemic in 2020, and,
- Oversupply- Major urban cities such as Nairobi, Kisumu, Uasin Gishu and Nakuru continue to be witness overs supply with retails space with the oversupply approximated at 3.0 mn, 0.3 mn, 0.1 mn and 0.1 mn SQFT in the various cities respectively. The overall oversupply stands at 1.7 mn SQFT in the Kenya retail market thereby causing developers to halt their construction plans as they wait for the absorption of the existing ones.
Section II: Kenya Retail Sector Performance Summary in 2021
Our analysis of the retail market performance in 2021 covers the general market performance within the key nodes in the Nairobi Metropolitan Area (NMA) by node and class and finally performance of key urban cities in the country. In 2021, the Kenyan retail sector performance recorded a 0.1% increase in the average rental yields to 6.8%, from 6.7% in 2020. Average occupancy rates and rental rates also realized an increase of 1.8% points and 2.2%, respectively, to 78.4% and Kshs 118 per SQFT in 2021 from 76.6% and Kshs 115 per SQFT in 2020, respectively, as a result of an improved business environment. In the NMA, the retail market recorded average rental yields of 7.5% similar to 2020, with occupancy rates coming in at 75.8%, a 0.6% points increase from the 75.2% realized in 2020 due to the increased demand for spaces. Rental rates however continued to remain subdued at Kshs 168 per SQFT in 2021, 0.2% lower than Kshs 169 per SQFT recorded in 2020 as landlords continue to give incentives such as lowering rents to attract and retain tenants.
- Retail Sector Performance in Kenya Over Time
In 2021, the Kenyan retail sector performance recorded 0.1% points increase in the average rental yields to 6.8%, from 6.7% in 2020. Average occupancy rates and rental rates realized an increase of 1.8% points and 2.2%, respectively, to 78.4% and Kshs 118 per SQFT in 2021 from 76.6% and Kshs 115 per SQFT in 2020, respectively, mainly attributed to an improved business environment as well as local and international retailers such as Giordano, Carrefour, Optica Limited and Naivas aggressively taking up new retail spaces as well as spaces previously occupied by troubled retailers such as Tuskys thus cushioning the overall performance of the retail market.
The performance of the sector across the key cities is as summarized below:
All Values in Kshs Unless Stated Otherwise
|
Kenya’s Retail Performance Summary-2021 |
|||||||
|
Item |
2016 |
2017 |
2018 |
2019 |
2020 |
2021 |
∆ Y/Y 2021/2020 |
|
Asking rents (Kshs/SQFT) |
155 |
141 |
132 |
118 |
115 |
118 |
2.2% |
|
Average Occupancy (%) |
82.9% |
80.2% |
86.0% |
77.3% |
76.6% |
78.4% |
1.8% |
|
Average Rental Yields |
8.7% |
8.3% |
8.6% |
7.0% |
6.7% |
6.8% |
0.1% |
Source: Cytonn Research 2021
- Nairobi Metropolitan Area (NMA) Retail Market Performance
The NMA retail market recorded average rental yields of 7.5% similar to 2020, with average occupancy rates coming in at 75.8%, a 0.6% increase from the 75.2% realized in 2020, attributed to an increased demand for retail spaces evidenced by retailers such as Naivas aggressively taking up new spaces as well as spaces previously occupied by troubled retailers and improvement in infrastructure opening up areas for retail investments. Rental rates remained subdued at Kshs 168 per SQFT in 2021 when compared to the Kshs 169 per SQFT recorded in 2020 as a result of landlords offering lower rental rates to attract new tenants as well as retain existing ones, and the growing e-commerce thereby causing reduced demand for physical retail spaces.
- Performance by Nodes
Westlands and Karen were the best performing nodes with average rental yields of 9.7% and 9.4%, respectively which were 2.2% and 1.9% points higher than the market average of 7.5%. This can mainly be attributed to higher average rental and occupancy rates that they fetch at Ksh 209 per SQFT and 80.4%, respectively, against the market average of Kshs 168 per SQFT and 75.8%, respectively, adequate amenities and infrastructure, and the undersupply of retail stores in Karen thus driving higher demand for the available ones.
Eastlands ranked last, recording declines in the average rental yields by 0.2% points from 6.1% in 2020 to 5.9% in 2021 due to the lower rental rates which declined by 1.5% from Kshs 137 per SQFT to Kshs 135 per SQFT. The occupancy rates came in at 72.5%, 1.3% points lower than the market average of 75.8% as a result of the relatively high competition from the existing informal retail centers and stores.
The table below shows the submarket performance of nodes in the Nairobi Metropolitan Area (NMA):
All Values in Kshs Unless Stated Otherwise
|
Nairobi Metropolitan area (NMA) 2021 Retail Performance |
|||||||||
|
Area |
Rent (Kshs)/SQFT 2021 |
Occupancy % 2021 |
Rental Yield 2021 |
Rent Kshs/SQFT 2020 |
Occupancy 2020 |
Rental Yield 2020 |
2021 ∆ in Rental Rates |
2021 ∆ in Occupancy (% points) |
2021 ∆ in Rental Yield (% points) |
|
Westlands |
209 |
80.4% |
9.7% |
209 |
81.5% |
9.9% |
(0.1%) |
(1.1%) |
(0.1%) |
|
Karen |
214 |
80.8% |
9.4% |
216.5 |
81.0% |
9.8% |
(1.4%) |
(0.2%) |
(0.4%) |
|
Kilimani |
172 |
83.6% |
9.0% |
171 |
82.5% |
8.5% |
0.6% |
1.1% |
0.5% |
|
Ngong Road |
175 |
78.0% |
7.8% |
178 |
80.3% |
8.2% |
(1.8%) |
(2.3%) |
(0.4%) |
|
Kiambu road |
178 |
70.4% |
7.2% |
176 |
67.5% |
6.9% |
0.7% |
2.9% |
0.2% |
|
Thika Road |
158 |
74.2% |
6.7% |
158 |
70.5% |
6.3% |
0.3% |
3.7% |
0.4% |
|
Satellite towns |
138 |
72.2% |
6.1% |
133 |
73.0% |
5.8% |
3.6% |
(0.8%) |
0.3% |
|
Mombasa road |
136 |
70.5% |
6.0% |
140 |
70.0% |
5.9% |
(2.6%) |
0.5% |
0.1% |
|
Eastlands |
135 |
72.5% |
5.9% |
137 |
70.2% |
6.1% |
(1.5%) |
2.3% |
(0.2%) |
|
Average |
168 |
75.8% |
7.5% |
169 |
75.2% |
7.5% |
(0.2%) |
0.7% |
0.0% |
Source: Cytonn Research 2021
- Performance by Class
To analyze the performance of malls by class we classified malls into three bands as below:
- Regional Centers / Destination Malls: These malls are characterized by their higher lettable areas ranging between 400,000 - 800,000 SQFT, they usually have more than one anchor tenants. Some examples include; Sarit Centre, Two Rivers Mall, Garden City Mall and Next Gen Mall,
- Community Centers: They are the second largest malls after the destination malls with a lettable area ranging between 125,001 - 400,000 SQFT, and can also host more than one anchor tenants. They include malls such as Thika Road Mall, Valley Arcade, Gateway Mall, and the Village Market, among others, and,
- Neighborhood Centers: These malls are characterized by their lettable areas ranging between 20,000 SQFT hence can only host a single anchor tenant. They include The Well in Karen, Ciata City Mall along Kiambu Road, and Unicity Mall along Thika Road, among others.
On performance by class, destination malls were the best performing recording average rental yields of 10.3%, attributable to high rental charges averaging at Kshs 257 per SQFT, 34.2% points higher than the market average of Kshs 169, as the malls charge premium rents for the high-quality retail space, facilities provided, and have higher footfall due to the presence of international retailers who have preference for destination malls. Moreover, the destination malls recorded the highest average occupancy rates of 81.7% against the market average of 75.9% in the NMA. Community malls recorded an average rental yield of 7.8%, 0.2% higher than the market average of 7.6%, with the average occupancy and rental rates coming in at 77.2% and Kshs 169 per SQFT, respectively against a market average of 75.9% and 7.6%, respectively as a result of an improved demand. Neighborhood malls recorded the lowest rental yields averaging 6.7% against the market average of 7.6%, attributed to lower rental rates averaging Kshs 151 per SQFT, 11.9% lower than the market average of Kshs 169 per SQFT. Average occupancy rates for neighborhood malls came in at 72.8% against the market average of 75.9% as a result of a slow but rising demand for physical retail spaces. The summary of performance by class is as shown below:
All Values in Kshs Unless Stated Otherwise
|
Retail Market Performance in Nairobi by Class 2021 |
|||
|
Class |
Average of rent (Kshs) |
Average of occupancy |
Average of rental yields |
|
Destination |
257 |
81.7% |
10.3% |
|
Community |
169 |
77.2% |
7.8% |
|
Neighborhood |
151 |
72.8% |
6.7% |
|
Grand Average |
169 |
75.9% |
7.6% |
Source: Cytonn research
- Retail Market Performance in Key Urban Cities in Kenya
Key urban cities in Kenya recorded increased average rental yields by 0.1% points to 6.8% in 2021 from 6.7% recorded in 2020, with the average occupancy and rental rates realizing improvements as well by 1.8% points and 2.2% points to 78.4% and Kshs 118 per SQFT, respectively in 2021 from 76.6% and Kshs 115 per SQFT in 2020, respectively.
Mount Kenya was the best performing region with the average rental yields and occupancy rates coming in at 7.9% and 81.7%, respectively, 1.1% and 3.3% points higher than market average of 6.8% and 78.4%. This can be attributed to improved average rental rates which came in at Kshs 128 per SQFT from Kshs 125 per SQFT in 2020, and increased demand for retail spaces as a result of the region being undersupplied by 0.7 mn per SQFT.
Nakuru ranked last with the average rental yields coming in at 6.1%, 0.7% lower than the market average of 6.8% in 2021. However, this is a 0.2% increase compared to the 5.9% realized in 2020, due to the increased rental rates to Kshs 59 per SQFT from Kshs 58 per SQFT in 2020.
The performance of the key urban centers in Kenya is as summarized below:
All Values in Kshs Unless Stated Otherwise
|
Summary of Retail Performance in Key Urban Cities in Kenya 2021 |
||||||||
|
Region |
Rent (Kshs) 2021 |
Occupancy Rate 2021 |
Rental yield 2021 |
Rent (Kshs) 2020 |
Occupancy Rate 2020 |
Rental yield 2020 |
Change in Occupancy Y/Y |
Change in Yield Y/Y |
|
Mount Kenya |
128 |
81.7% |
7.9% |
125 |
78.0% |
7.7% |
3.7% |
0.1% |
|
Nairobi |
168 |
75.8% |
7.5% |
169 |
74.5% |
7.5% |
1.3% |
0.0% |
|
Mombasa |
119 |
77.6% |
6.8% |
114 |
76.3% |
6.6% |
1.4% |
0.2% |
|
Kisumu |
101 |
74.6% |
6.4% |
97 |
74.0% |
6.3% |
0.6% |
0.1% |
|
Eldoret |
131 |
80.8% |
6.3% |
130 |
80.2% |
5.9% |
0.6% |
0.4% |
|
Nakuru |
59 |
80.0% |
6.1% |
58 |
76.6% |
5.9% |
3.4% |
0.2% |
|
Average |
118 |
78.4% |
6.8% |
115 |
76.6% |
6.7% |
1.8% |
0.1% |
Source: Cytonn Research
Section III: Retail Space Demand Analysis
In order to identify the retail market gap for investment opportunity, we worked on the retail space demand for various urban regions in Kenya. This is to enable developers to be aware of the undersupplied areas and the oversupplied areas. The analysis was based on the retail spaces available as well as the ones in pipeline against the existing demand by the population available per region. By this, we identified the net space uptake per person in SQM, the shopping population, and current retail market occupancy rates. In addition to this, we used the average uptake in Kilimani as a guide to calculating the net space uptake for the various regions:
- Total Demand/ Gross Uptake - This measures the total retail space required by a population in a particular region hence calculated by multiplying the net space uptake per person by the total shopping population,
- Net Demand/ Uptake - This is a measure of the gross uptake which is not inclusive of the occupancy rates of malls in particular regions, and is calculated by multiplying the gross uptake by respective market occupancy rates, and,
- Supply - This is the summation of the existing malls as well as the ones in pipeline. To get the over/undersupply (gap) in the market, the supply is subtracted from the demand/net uptake.
Also, the key assumptions used in the analysis include:
- Number of persons per household was at 3.6 based on the average household size in urban areas as per Kenya Population and Housing Census 2019, and,
- Percentage of shopping population (14 years and above).
(If the figure is positive, then the market has an undersupply i.e, demand is more than supply and if it is a negative figure then the market has an oversupply, i.e. supply is more than demand).
The retail space demand across key regions in Kenya is as shown below;
|
Demand Analysis 2021 |
||||||||||
|
Region |
2019 |
Urban Population |
Urban population 2019 |
Shopping People |
Net Space Uptake per pax in SQM (Based on Uptake per pax in Kilimani) |
Occupancy (2 year Average) |
Gross Space Uptake per Pax (Required Space Kilimani) |
Net Uptake (Space Required) for each market |
Current supply |
GAP at current market performance |
|
Kiambu |
2.1 |
60% |
1.3 |
0.7 |
1.9 |
81.7% |
2.1 |
1.7 |
0.9 |
0.8 |
|
Mt Kenya |
2.8 |
38% |
1.1 |
0.6 |
1.5 |
81.7% |
1.7 |
1.4 |
0.4 |
0.7 |
|
Kajiado |
1.1 |
41% |
0.5 |
0.3 |
0.7 |
75.8% |
0.7 |
0.6 |
0.36 |
0.2 |
|
Machakos |
1.3 |
52% |
0.7 |
0.4 |
1.0 |
75.8% |
1.1 |
0.9 |
0.3 |
0.1 |
|
Mombasa |
1.3 |
100% |
1.3 |
0.8 |
1.9 |
77.6% |
2.1 |
1.7 |
1.4 |
0.1 |
|
Nakuru |
2.2 |
45% |
1.0 |
0.6 |
1.4 |
80.0% |
1.6 |
1.3 |
0.6 |
(0.1) |
|
Uasin Gishu |
1.3 |
44% |
0.6 |
0.3 |
0.8 |
80.8% |
0.9 |
0.7 |
0.4 |
(0.1) |
|
Kisumu |
1.2 |
50% |
0.6 |
0.3 |
0.9 |
74.6% |
1.0 |
0.7 |
1.0 |
(0.3) |
|
Nairobi |
4.6 |
100% |
4.6 |
2.7 |
6.7 |
75.8% |
7.4 |
5.6 |
7.3 |
(3.0) |
|
Total |
18.0 |
11.6 |
6.7 |
16.8 |
18.6 |
14.5 |
12.6 |
(1.7) |
||
|
The Kenya retail sector and the NMA realized a 15.0% and 3.2% decline in the market gap to 1.7mn and 3.0 mn per SQFT when compared to the 2.0 mn and 3.1 mn SQFT recorded in 2020, attributed to an increase in demand for retail spaces |
||||||||||
Source: Cytonn Research
Based on our demand analysis, Nairobi, Kisumu, Uasin Gishu and Nakuru are the most oversupplied retail markets by 3.0 mn SQFT, 0.3 mn SQFT, 0.1 mn SQFT, and 0.1 mn SQFT, respectively, with occupancies of 75.8%, 74.6%, 80.8% and 80.0%, respectively.
Section IV: Retail Space Investment Opportunity
We analyzed the various urban cities in Kenya in order to determine the investment opportunity within the real estate retail market in the country. This was based on three metrics which include the rental yields, the retail spaces required, and the household purchasing power, with allocations of 30.0%, 30.0% and 40.0% weights, respectively:
- Rental Yield- This is a measure of the value the profit that an investor generates from an investment as a percentage of its value hence the higher the better. The weighted score for rental yields was 30.0%, and the area with the highest yield was ranked with the highest score of 9 whereas the area with lower yields was given the lowest score of 1,
- Household Expenditure - This measures the consumption expenditure of the target population hence the higher the better as well. The weighted score for this was at 40.0% and the area with the highest expenditure was given the highest score at 9, and the lowest given the lowest score at 1, and,
- Retail Space Demand- This measures the amount of retail space required by a particular region hence the higher the better as it increases occupancy rates of the available developments. 30.0% was the allocated weight for this and the area with the highest demand was given the highest score at 9 as well whilst the area with the lowest demand was allocated the lowest score at 1.
Based on our analysis, Mombasa and Kiambu offer the best investment opportunities to retail space developers having achieved a higher weighted score of 7.4 and 7.3, respectively. Uasin Gishu ranked the lowest implying that as of this time it is not the best investment area and this is attributed to lower yields, relatively low retail space demand and lower household expenditure. The table below shows the retail space investment opportunity in Kenya:
|
Retail Space Opportunity 2021 |
|||||
|
Region/Weight |
Retail Yield Score |
Retail Space Score |
Household expenditure (per adult) score |
|
|
|
|
30% |
30% |
40% |
Weighted score |
Rank |
|
Mombasa |
9 |
5 |
8 |
7.4 |
1 |
|
Kiambu |
7 |
8 |
7 |
7.3 |
2 |
|
Mt Kenya |
7 |
9 |
5 |
6.8 |
3 |
|
Nairobi |
4 |
1 |
9 |
5.1 |
4 |
|
Machakos |
4 |
6 |
3 |
4.2 |
5 |
|
Kajiado |
4 |
7 |
2 |
4.1 |
6 |
|
Kisumu |
3 |
2 |
6 |
3.9 |
7 |
|
Nakuru |
1 |
3 |
4 |
2.8 |
8 |
|
Uasin Gishu |
1 |
4 |
1 |
1.9 |
9 |
Source: Cytonn Research
Section V: Retail Sector Outlook
The table below summarizes metrics that have a possible impact on the retail sector, that is the retail space supply, performance, retail space demand, and concluding with the market opportunity/outlook in the sector;
|
Kenya Retail Sector Outlook 2021 |
||||
|
Sentiment 2020 |
Sentiment 2021 |
2020 Outlook |
2021 Outlook |
|
|
Retail Space Supply |
Main urban cities such as Nairobi and Kisumu have an existing oversupply of space while regions such as Kiambu County and Mt Kenya region are undersupplied and therefore, we expect to see developers shifting their focus to these regions. This will be supported by demand from international retailers and expansion by local retail chains |
Nairobi, Kisumu, Uasin Gishu and Nakuru are the most oversupplied areas by 3.0 mn, 0.3 mn, 0.1 mn and 0.1 mn SQFT of space, respectively while areas such as Kiambu and Mt Kenya regions are under supplied by 0.8 mn and 0.7 mn SQFT, respectively |
Neutral |
Neutral |
|
Retail Space Demand |
Nairobi, Kisumu and Nakuru are the most oversupplied areas by 3.1 mn, 0.3 mn and 0.2 mn SQFT of space, respectively while areas such as Mt Kenya are under supplied by 0.7 mn SQFT |
Performance of cities such as Nairobi, Kisumu, Uasin Gishu and Nakuru continues to be affected by the slow absorption rates of the retail spaces due to the existing demand that doesn’t match the higher supply, that is also expected to increase with the additional spaces such as the Imaara mall along Mombasa road, Britam Mall in Kilimani, and the Beacon Mall in Nairobi CBD |
Neutral |
Neutral |
|
Retail Market Performance |
The retail sector performance recorded a decline of 0.3% and 0.7% points in average rental yields and occupancy rates, respectively, coming in at 6.7% and 76.6%, respectively Nairobi and Mt. Kenya were the best performing regions with average rental yields of 7.7% and 7.5%, respectively, attributable to relatively high demand for quality retail space demand for space in malls. We expect the sector’s performance to be cushioned by entry of local and international retailers taking up prime retail space left by their troubled counterparts |
Kenyan retail sector performance recorded a 0.1% increase in the average rental yields to 6.8% in 2021, from 6.7% in 2020. Average occupancy rates and rental rates also realized an increase of 1.8% points and 2.2% points, respectively, to 78.4% and Kshs 117.8 per SQFT in 2021 Mount Kenya and Nairobi were the best performing regions with the average rental yields coming in at 7.9% and 7.5%, respectively against the market average of 6.8% We expect to see increased market activity with the expansion efforts by local and international retailers such as Naivas and Carrefour taking up space left by troubled retailers such as Tuskys. The existing oversupply is however expected to weigh down the performance of the Kenyan retail market |
Neutral |
Neutral |
|
Our outlook for the Kenya retail market remains NEUTRAL with factors such as the e-commerce strategy, limited availability of land and financial constraints expected to impede performance of the sector. However, the rapid infrastructure developments, retailers aggressively taking up retail spaces, positive demographics and the reopening of the economy is expected to cushion the sector’s performance |
||||
Disclaimer: The views expressed in this publication are those of the writers where particulars are not warranted. This publication, which is in compliance with Section 2 of the Capital Markets Authority Act Cap 485A, is meant for general information only and is not a warranty, representation, advice or solicitation of any nature. Readers are advised in all circumstances to seek the advice of a registered investment advisor.

- Talk to us
- Kenya
- P.O Box 20695 - 00200, Nairobi, Kenya
- Cell +254709101200
- Tel +254709101200
- WhatsApp +254741676635
- United States
- +254709101200
- DOWNLOAD OUR APP
-


- Kenya
- 8th Floor, Pinetree Plaza, Kaburu Drive, Ngong Road, Nairobi, Kenya
- USA
- Suite 1150, 1775 Eye Street NW, USA, Washington DC 20006, USA
- Investments
- High Yield
- Private Equity
- Real Estate
- Real Estate
- RiverRun Estates
- Cytonn Towers
- The Ridge
- Taraji Heights
- The Alma