Kenya’s Balance of Payments, & Cytonn Weekly #37.2023
By Cytonn Research, Sep 17, 2023
Executive Summary
Fixed Income
During the week, T-bills were undersubscribed with the overall subscription rate coming in at 92.1%, from the oversubscription rate of 161.8% recorded the previous week. Investors’ preference for the shorter 91-day paper persisted, with the paper receiving bids worth Kshs 18.0 bn against the offered Kshs 4.0 bn, translating to an oversubscription rate of 450.0%, which was lower than the subscription rate of 870.8% recorded the previous week. The subscription rate for the 364-day paper increased to 34.1% from 27.8% recorded the previous week, while that of the 182-day paper decreased to 7.0% from 12.3% recorded the previous week. The government accepted a total of Kshs 19.5 bn worth of bids out of Kshs 22.1 bn of bids received, translating to an acceptance rate of 88.3%. The yields on the government papers recorded mixed performance, with the yields on the 182-day and 91-day papers increasing by 4.6 bps and 28.1 bps to 14.4% and 14.5%, respectively, while the yield on the 364-day paper decreased by 13.2 bps to 14.7%;
In the primary bond market, The Central Bank of Kenya released the auction results for the re-opened bonds FXD1/2023/02 with a tenor to maturity of 2 years and FXD1/2016/10 with a 2.9-year tenor to maturity. The bonds were undersubscribed with overall subscription rate coming in at 97.2%, receiving bids worth Kshs 34.0 bn against the offered Kshs 35.0 bn. The government accepted bids worth Kshs 21.6 bn, translating to an acceptance rate of 63.6%. The weighted average yield of accepted bids came in at 17.5% and 17.9% for FXD1/2023/02 and FXD1/2016/10, respectively. The coupon rate for the FXD1/2023/02 was set at 17.0% and FXD1/2016/10 was set at 15.0%, respectively;
During the week, the National Treasury gazetted the revenue and net expenditures for the second month of FY’2023/2024, ending 31st August 2023 highlighting that total revenue collected as at the end of August 2023 amounted to Kshs 323.4 bn, equivalent to 12.6% of the original estimates of Kshs 2,571.2 bn for FY’2023/2024 and is 75.5% of the prorated estimates of Kshs 428.5 bn;
During the week, the Energy and Petroleum Regulatory Authority (EPRA) released their monthly statement on the maximum retail fuel prices in Kenya, effective 15 September 2023 to 14 October 2023. Notably, fuel prices for super petrol, Diesel and Kerosene increased;
Equities
During the week, the equities market recorded mixed performance, with NASI gaining by 0.2%, while NSE 20, NSE 25 and NSE 10 declined by 0.7%, 0.2% and 0.4% respectively, taking the YTD performance to losses of 22.3%, 8.6%, and 18.9% for NASI, NSE 20, and NSE 25, respectively. The equities market performance was mainly driven by gains recorded by large-cap stocks such as Safaricom, DTB-K and Coop Bank of 1.6%, 1.5% and 1.3% respectively. The gains were however weighed down by losses recorded by stocks such as NCBA Bank, KCB Group and Standard Chartered Bank-Kenya of 6.5%, 4.5% and 1.8% respectively;
Real Estate
During the week, Fahari I-REIT closed the week trading at an average price of Kshs 7.8 per share on the Nairobi Securities Exchange, representing a 16.7% decline from the Kshs 9.4 recorded the previous week. On the Unquoted Securities Platform as at 08 September 2023, Acorn D-REIT and I-REIT closed the week trading at Kshs 25.3 and Kshs 21.7 per unit, a 26.6% and 8.3% gain for the D-REIT and I-REIT, respectively, from the Kshs 20.0 inception price. In addition, Cytonn High Yield Fund (CHYF) closed the week with an annualized yield of 13.8%, remaining relatively unchanged from the performance recorded the previous week;
Focus of the Week
One of the key priorities for the government lies in ensuring a harmonious balance between various aspects of its economic policy, particularly in the context of the Balance of Payments (BOP). This includes fostering a stable trade environment, effectively managing capital flows, and addressing inflation, all while maintaining a well-balanced exchange rate system. These efforts are geared towards fostering economic growth, creating employment opportunities, and implementing strategic commercial policies, all of which play pivotal roles in Kenya's pursuit of a robust and sustainable economic trajectory. As such, we saw it fit to focus on Kenya’s balance of payments to analyze the current state and what can be done to improve it;
Investment Updates:
- Weekly Rates:
- Cytonn Money Market Fund closed the week at a yield of 13.44% p.a To invest, dial *809# or download the Cytonn App from Google Playstore here or from the Appstore here;
- Cytonn High Yield Fund closed the week at a yield of 13.85% p.a. To invest, email us at sales@cytonn.com and to withdraw the interest, dial *809# or download the Cytonn App from Google Playstore here or from the Appstore here;
- We continue to offer Wealth Management Training every Wednesday, from 9:00 am to 11:00 am. The training aims to grow financial literacy among the general public. To register for any of our Wealth Management Trainings, click here;
- If interested in our Private Wealth Management Training for your employees or investment group, please get in touch with us through wmt@cytonn.com;
- Cytonn Insurance Agency acts as an intermediary for those looking to secure their assets and loved ones’ future through insurance namely; Motor, Medical, Life, Property, WIBA, Credit and Fire and Burglary insurance covers. For assistance, get in touch with us through insuranceagency@cytonn.com;
- Cytonn Asset Managers Limited (CAML) continues to offer pension products to meet the needs of both individual clients who want to save for their retirement during their working years and Institutional clients that want to contribute on behalf of their employees to help them build their retirement pot. To more about our pension schemes, kindly get in touch with us through pensions@cytonn.com;
Real Estate Updates:
- For more information on Cytonn’s real estate developments, email us at sales@cytonn.com;
- Phase 3 of The Alma is now ready for occupation and the show house is open daily. To join the waiting list to rent, please email properties@cytonn.com;
- For Third Party Real Estate Consultancy Services, email us at rdo@cytonn.com;
- For recent news about the group, see our news section here;
Hospitality Updates:
- We currently have promotions for Staycations. Visit cysuites.com/offers for details or email us at sales@cysuites.com;
Money Markets, T-Bills Primary Auction:
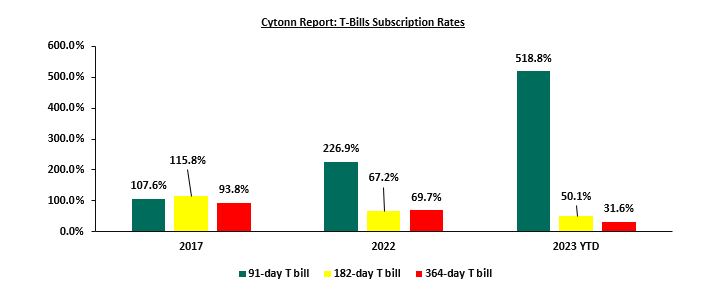
During the week, T-bills were undersubscribed with the overall subscription rate coming in at 92.1%, from the oversubscription rate of 161.8% recorded the previous week. Investors’ preference for the shorter 91-day paper persisted, with the paper receiving bids worth Kshs 18.0 bn against the offered Kshs 4.0 bn, translating to an oversubscription rate of 450.0%, which was lower than the subscription rate of 870.8% recorded the previous week. The subscription rate for the 364-day paper increased to 34.1% from 27.8% recorded the previous week, while that of the 182-day paper decreased to 7.0% from 12.3% recorded the previous week. The government accepted a total of Kshs 19.5 bn worth of bids out of Kshs 22.1 bn of bids received, translating to an acceptance rate of 88.3%. The yields on the government papers recorded mixed performance, with the yields on the 182-day and 91-day papers increasing by 4.6 bps and 28.1 bps to 14.4% and 14.5%, respectively, while the yield on the 364-day paper decreased by 13.2 bps to 14.7%.
So far in the current FY’2023/24, government securities totalling Kshs 444.0 bn have been advertised. The government has accepted bids worth Kshs 467.3 bn, of which 321.0 bn and 146.3 bn were treasury bills and bonds, respectively. Total redemptions so far in FY’2023/24 equal to Kshs 400.5 bn, as a result, the government has a domestic net borrowing surplus of Kshs 66.8 billion in FY’2023/24
The chart below compares the overall average T- bills subscription rates obtained in 2017, 2022 and 2023 Year to Date (YTD):
In the primary bond market, The Central Bank of Kenya released the auction results for the re-opened bonds FXD1/2023/02 with a tenor to maturity of 2 years and FXD1/2016/10 with a 2.9-year tenor to maturity. The bonds were undersubscribed with overall subscription rate coming in at 97.2%, receiving bids worth Kshs 34.0 bn against the offered Kshs 35.0 bn. The government accepted bids worth Kshs 21.6 bn, translating to an acceptance rate of 63.6%. The weighted average yield of accepted bids came in at 17.5% and 17.9% for FXD1/2023/02 and FXD1/2016/10, respectively. The coupon rate for the FXD1/2023/02 was set at 17.0% and FXD1/2016/10 was set at 15.0%, respectively.
Money Market Performance:
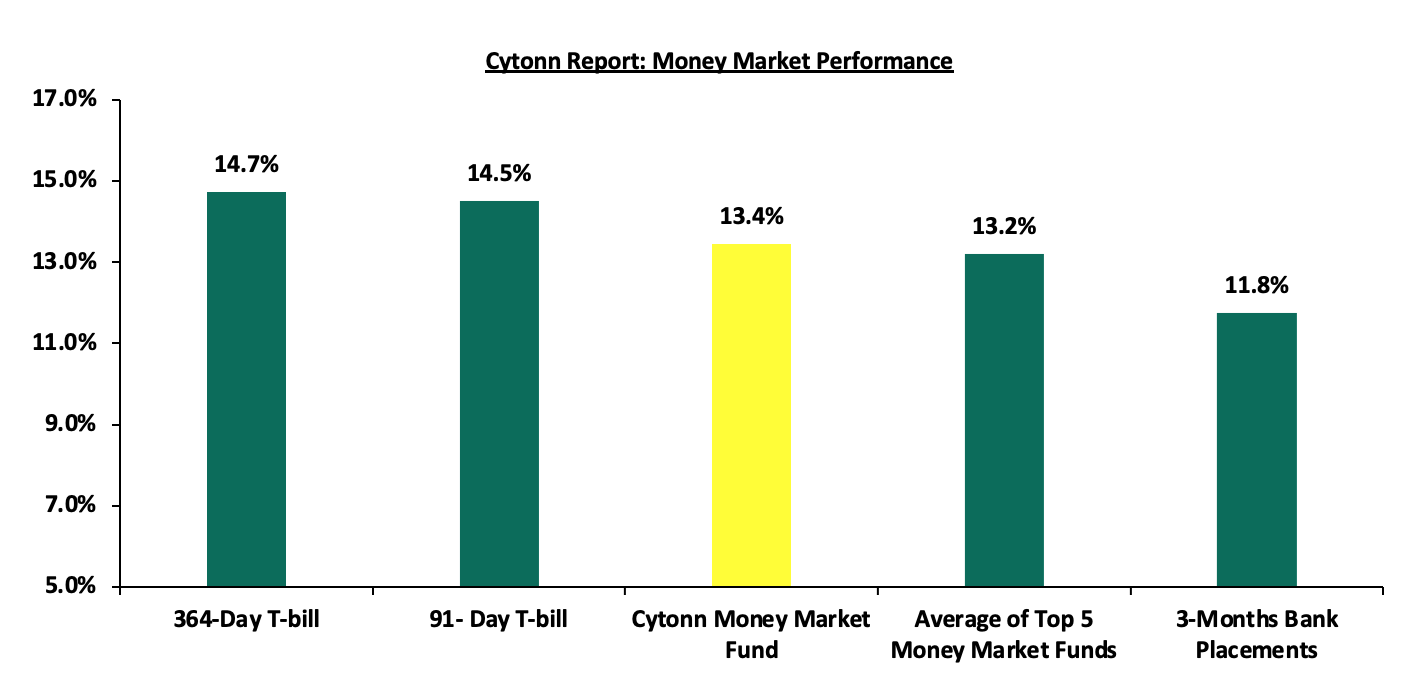
In the money markets, 3-month bank placements ended the week at 11.8% (based on what we have been offered by various banks), The yield on the 364-day paper decreased by 13.2 bps to 14.7%, while that of 91-day paper increased by 28.1 bps to 14.4%. The yield of Cytonn Money Market Fund remained unchanged at 13.4% and the average yields on the Top 5 Money Market Funds increased by 13.2 bps to 13.2% from 13.1% recorded the previous week.
The table below shows the Money Market Fund Yields for Kenyan Fund Managers as published on 15th Sep 2023:
|
Cytonn Report: Money Market Fund Yield for Fund Managers as published on 15th September 2023 |
||
|
Rank |
Fund Manager |
Effective Annual |
|
1 |
GenAfrica Money Market Fund |
13.5% |
|
2 |
Cytonn Money Market Fund |
13.4% |
|
3 |
Enwealth Money Market Fund |
13.1% |
|
4 |
Madison Money Market Fund |
13.0% |
|
5 |
Etica Money Market Fund |
13.0% |
|
6 |
Lofty-Corban Money Market Fund |
12.7% |
|
7 |
Apollo Money Market Fund |
12.6% |
|
8 |
Jubilee Money Market Fund |
12.5% |
|
9 |
Co-op Money Market Fund |
12.5% |
|
10 |
Kuza Money Market fund |
12.2% |
|
11 |
AA Kenya Shillings Fund |
11.7% |
|
12 |
Sanlam Money Market Fund |
11.7% |
|
13 |
KCB Money Market Fund |
11.5% |
|
14 |
Absa Shilling Money Market Fund |
11.5% |
|
15 |
ICEA Lion Money Market Fund |
11.5% |
|
16 |
Nabo Africa Money Market Fund |
11.5% |
|
17 |
Old Mutual Money Market Fund |
11.5% |
|
18 |
GenCap Hela Imara Money Market Fund |
11.4% |
|
19 |
Equity Money Market Fund |
11.0% |
|
20 |
Dry Associates Money Market Fund |
10.9% |
|
21 |
CIC Money Market Fund |
10.5% |
|
22 |
Orient Kasha Money Market Fund |
10.2% |
|
23 |
Mali Money Market Fund |
10.0% |
|
24 |
British-American Money Market Fund |
9.5% |
Source: Business Daily
Liquidity:
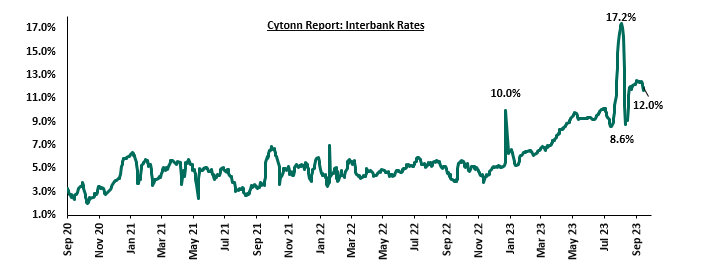
During the week, liquidity in the money markets eased, with the average interbank rate decreasing to 12.1%, from 12.4% recorded the previous week, partly attributable to government payments that offset tax remittances. The average interbank volumes traded decreased by 26.0% to Kshs 26.3 bn, from Kshs 35.5 bn recorded the previous week. The chart below shows the interbank rates in the market over the years:
Kenya Eurobonds:
During the week, the yields on Eurobonds recorded mixed performance with the yield on the 10-year Eurobond issued in 2014 decreasing the most by 1.1% points to 13.6%, from 14.7%, recorded the previous week. The table below shows the summary of the performance of the Kenyan Eurobonds as of 14th Sep 2023;
|
Cytonn Report: Kenya Eurobonds Performance |
||||||
|
|
2014 |
2018 |
2019 |
2021 |
||
|
Tenor |
10-year issue |
10-year issue |
30-year issue |
7-year issue |
12-year issue |
12-year issue |
|
Amount Issued (USD) |
2.0 bn |
1.0 bn |
1.0 bn |
0.9 bn |
1.2 bn |
1.0 bn |
|
Years to Maturity |
0.8 |
4.5 |
24.5 |
3.7 |
8.7 |
10.8 |
|
Yields at Issue |
6.6% |
7.3% |
8.3% |
7.0% |
7.9% |
6.2% |
|
02-Jan-23 |
12.9% |
10.5% |
10.9% |
10.9% |
10.8% |
9.9% |
|
01-Sep-23 |
13.8% |
11.7% |
11.4% |
12.0% |
11.5% |
11.0% |
|
07-Sep-23 |
14.7% |
11.9% |
11.5% |
12.3% |
11.5% |
11.1% |
|
08-Sep-23 |
14.3% |
11.7% |
11.3% |
12.1% |
11.4% |
11.0% |
|
11-Sep-23 |
15.8% |
12.0% |
11.5% |
12.7% |
11.6% |
11.2% |
|
12-Sep-23 |
15.9% |
12.1% |
11.5% |
12.8% |
11.7% |
11.2% |
|
13-Sep-23 |
15.5% |
12.1% |
11.6% |
12.8% |
11.7% |
11.2% |
|
14-Sep-23 |
13.6% |
11.8% |
11.5% |
12.3% |
11.5% |
11.1% |
|
Weekly Change |
(1.1%) |
(0.1%) |
0.0% |
0.0% |
0.0% |
0.0% |
|
MTD Change |
(0.2%) |
0.1% |
0.1% |
0.3% |
0.0% |
0.1% |
|
YTD Change |
0.7% |
1.3% |
0.6% |
1.4% |
0.7% |
1.2% |
Source: Source: Central Bank of Kenya (CBK) and National Treasury
Kenya Shilling:
During the week, the Kenya Shilling depreciated by 0.4% against the US dollar to close the week at Kshs 146.8, from Kshs 146.1 recorded the previous week. On a year to date basis, the shilling has depreciated by 18.9% against the dollar, adding to the 9.0% depreciation recorded in 2022. We expect the shilling to remain under pressure in 2023 as a result of:
- An ever-present current account deficit, which came at 2.3% of GDP in Q1’2023 from 4.2% recorded in a similar period last year, and,
- The need for government debt servicing, continues to put pressure on forex reserves given that 66.8% of Kenya’s external debt is US Dollar denominated as of April 2023, and,
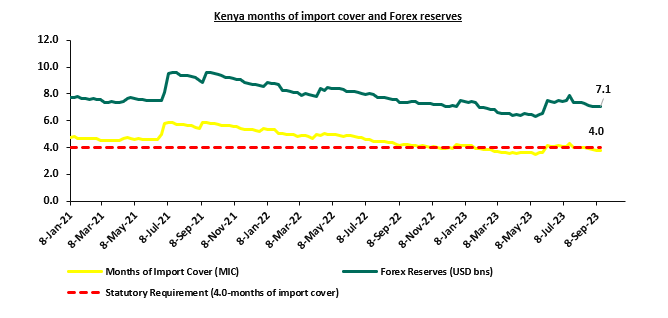
- Dwindling forex reserves currently at USD 7.1 bn (equivalent to 3.8-months of import cover), which is below the statutory requirement of maintaining at least 4.0-months of import cover.
The shilling is however expected to be supported by:
- Diaspora remittances standing at a cumulative USD 2,766.3 mn in 2023 as of August 2023, 3.4% higher than the USD 2,674.5 mn recorded over the same period in 2022, and,
- The tourism inflow receipts which came in at Kshs 268.1 bn in 2022, a significant 82.9% increase from Kshs 146.5 bn inflow receipts recorded in 2021.
The chart below summarizes the evolution of Kenya months of import cover over the years:
Weekly Highlights:
- Revenue and Net Exchequer for FY’2023/2024
The National Treasury gazetted the revenue and net expenditures for the second month of FY’2023/2024, ending 31st August 2023. Below is a summary of the performance:
|
FY'2023/2024 Budget Outturn - As at 31st August 2023 |
|||||
|
Amounts in Kshs billions unless stated otherwise |
|||||
|
Item |
12-months Original Estimates |
Actual Receipts/Release |
Percentage Achieved of the Original Estimates |
Prorated |
% achieved of the Prorated |
|
Opening Balance |
|
2.6 |
|
|
|
|
Tax Revenue |
2,495.8 |
317.6 |
12.7% |
416.0 |
76.3% |
|
Non-Tax Revenue |
75.3 |
3.2 |
4.3% |
12.6 |
25.7% |
|
Total Revenue |
2,571.2 |
323.4 |
12.6% |
428.5 |
75.5% |
|
External Loans & Grants |
870.2 |
53.0 |
6.1% |
145.0 |
36.6% |
|
Domestic Borrowings |
688.2 |
125.7 |
18.3% |
114.7 |
109.6% |
|
Other Domestic Financing |
3.2 |
2.8 |
89.1% |
0.5 |
534.5% |
|
Total Financing |
1,561.6 |
181.6 |
11.6% |
260.3 |
69.8% |
|
Recurrent Exchequer issues |
1,302.8 |
149.0 |
11.4% |
217.1 |
68.6% |
|
CFS Exchequer Issues |
1,963.7 |
300.0 |
15.3% |
327.3 |
91.7% |
|
Development Expenditure & Net Lending |
480.8 |
14.5 |
3.0% |
80.1 |
18.1% |
|
County Governments + Contingencies |
385.42 |
39.27 |
10.2% |
64.2 |
61.1% |
|
Total Expenditure |
4,132.7 |
502.7 |
12.2% |
688.8 |
73.0% |
|
Fiscal Deficit excluding Grants |
1,561.6 |
179.3 |
11.5% |
260.3 |
68.9% |
|
Annualized fiscal Deficit as a % of GDP |
13368.3 |
1075.9 |
8.0% |
|
|
|
Total Borrowing |
1,558.4 |
178.7 |
11.5% |
259.7 |
68.8% |
The Key take-outs from the release include;
- Total revenue collected as at the end of August 2023 amounted to Kshs 323.4 bn, equivalent to 12.6% of the original estimates of Kshs 2,571.2 bn for FY’2023/2024 and is 75.5% of the prorated estimates of Kshs 428.5 bn. Cumulatively, tax revenues amounted to Kshs 317.6 bn, equivalent to 12.7% of the original estimates of Kshs 2,495.8 bn and 76.3% of the prorated estimates of Kshs 416.0 bn,
- Total financing amounted to Kshs 181.6 bn, equivalent to 11.6% of the original estimates of Kshs 1,561.6 bn and is equivalent to 69.8% of the prorated estimates of Kshs 260.3 bn. Additionally, domestic borrowing amounted to Kshs 125.7 bn, equivalent to 18.3% of the original estimates of Kshs 688.2 bn and is 109.6% of the prorated estimates of Kshs 114.7 bn,
- The total expenditure amounted to Kshs 502.7 bn, equivalent to 12.2% of the original estimates of Kshs 4,132.7 bn, and is 73.0% of the prorated target expenditure estimates of Kshs 688.8 bn. Additionally, the net disbursements to recurrent expenditures came in at Kshs 149.0 bn, equivalent to 11.4% of the original estimates of Kshs 1,302.8 and 68.6% of the prorated estimates of Kshs 217.1 bn,
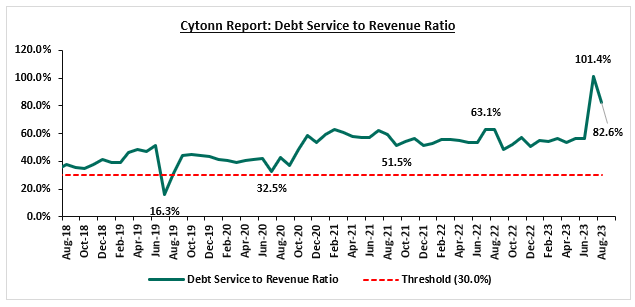
- Consolidated Fund Services (CFS) Exchequer issues came in at Kshs 300.0 bn, equivalent to 15.3% of the original estimates of Kshs 1,963.7 bn, and are 91.4% of the prorated amount of Kshs 327.3 bn. The cumulative public debt servicing cost amounted to Kshs 267.0 bn which is 15.3% of the original estimates of Kshs 1,751.1 bn, and is 91.5% of the prorated estimates of Kshs 291.8 bn. Additionally, the Kshs 267.0 bn debt servicing cost is equivalent to 82.6% of the actual revenues collected as at the end of August 2023. The chart below shows the debt serving to revenue ratio;
- Total Borrowings as at the end of August 2023 amounted to Kshs 178.7 bn, equivalent to 11.5% of the original estimates of Kshs 1,558.4 bn for FY’2023/2024 and are 68.8% of the prorated estimates of Kshs 259.7 bn. The cumulative domestic borrowing of Kshs 688.2 bn comprises of Net Domestic Borrowing KSh. 313.7 bn and Internal Debt Redemptions (Rollovers) Kshs 374.5 bn.
The revenue performance continues to be impeded by the poor business environment brought about by the high cost of living amid high fuel prices, the sustained depreciation of the Kenya shilling as well as the difficult business and entrepreneurship environment. As such, we believe that the performance of revenue collection in the coming months will be largely determined by how soon the country’s business environment stabilizes. Notably, the government continues to implement strategies to enhance revenue collection, such as expanding the revenue base and addressing tax leakages, as well as suspending tax relief payments.
- Fuel Prices effective 15 September 2023 to 14 October 2023
During the week, the Energy and Petroleum Regulatory Authority (EPRA) released their monthly statement on the maximum retail fuel prices in Kenya, effective 15 September 2023 to 14 October 2023. Notably, fuel prices for super petrol, Diesel and Kerosene increased by 8.7%, 11.9% and 19.6% to kshs 211.6, kshs 200.9 and kshs 202.6, respectively, from Kshs 194.7, kshs 169.5 and kshs 179.7 per litre for super petrol, kerosene and Diesel respectively.
Other key take-outs from the performance include;
- The average landing costs per cubic meter for super petrol, Diesel and Kerosene increased by 4.8%, 12.5% and 19.8% to USD 774.7, USD 789.9 and USD 827.3 in August 2023, from USD 739.2, USD 702.0, and USD 690.6, respectively in July 2023.
- The Kenyan shilling depreciated against the US Dollar by 2.0% to kshs 149.0 in August 2023, compared to the mean monthly exchange rate of kshs 146.1 recorded in July 2023.
We note that fuel prices in the country have increased significantly based on historical levels despite government efforts to tap into the Petroleum Development Levy (PDL) to stabilize fuel retail prices by compensating oil marketing companies in August 2023. The high fuel prices in the country are mainly due to the high cost of fuel imports as a result of the sustained depreciation of the shilling against the US dollar, as well as the high taxation of petroleum products as provided in the Finance Act 2023.
Rates in the Fixed Income market have been on an upward trend given the continued high demand for cash by the government and the occasional liquidity tightness in the money market. The government is 1.9% behind of its prorated net domestic borrowing target of Kshs 68.1 bn, having a net borrowing position of Kshs 66.8 bn of the domestic net borrowing target of Kshs 313.6 bn for the FY’2023/2024. Therefore, we expect a continued upward readjustment of the yield curve in the short and medium term, with the government looking to bridge the fiscal deficit through the domestic market. Owing to this, our view is that investors should be biased towards short-term fixed-income securities to reduce duration risk.
Market Performance:
During the week, the equities market recorded mixed performance, with NASI gaining by 0.2%, while NSE 20, NSE 25 and NSE 10 declined by 0.7%, 0.2% and 0.4% respectively, taking the YTD performance to losses of 22.3%, 8.6%, and 18.9% for NASI, NSE 20, and NSE 25, respectively. The equities market performance was mainly driven by gains recorded by large-cap stocks such as Safaricom, DTB-K and Coop Bank of 1.6%, 1.5% and 1.3% respectively. The gains were however weighed down by losses recorded by stocks such as NCBA Bank, KCB Group and Standard Chartered Bank-Kenya of 6.5%, 4.5% and 1.8% respectively;
During the week, equities turnover decreased by 3.7% to USD 7.6 mn from USD 7.9 mn recorded the previous week, taking the YTD total turnover to USD 560.3 mn. Foreign investors remained net sellers for the third consecutive week with a net selling position of USD 0.8 mn, from a net selling position of USD 2.8 mn recorded the previous week, taking the YTD foreign net selling position to USD 277.6 mn.
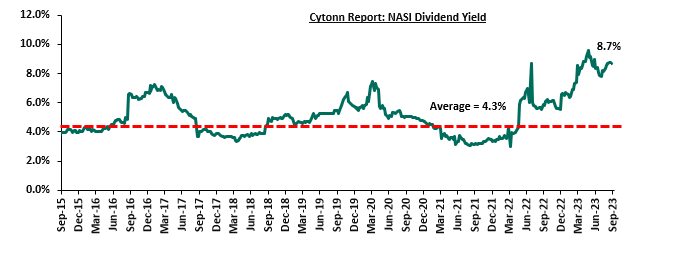
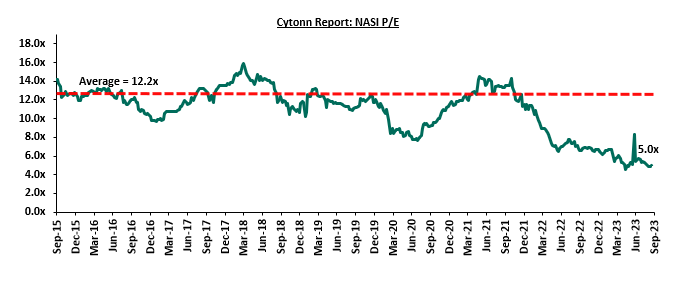
The market is currently trading at a price to earnings ratio (P/E) of 5.0x, 59.2% below the historical average of 12.2x. The dividend yield stands at 8.7%, 4.4% points above the historical average of 4.3%. Key to note, NASI’s PEG ratio currently stands at 0.6x, an indication that the market is undervalued relative to its future growth. A PEG ratio greater than 1.0x indicates the market is overvalued while a PEG ratio less than 1.0x indicates that the market is undervalued. The charts below indicate the historical P/E and dividend yields of the market;
Universe of coverage:
|
Company |
Price as at 08/09/2023 |
Price as at 15/09/2023 |
w/w change |
YTD Change |
Target Price* |
Dividend Yield |
Upside/ Downside** |
P/TBv Multiple |
Recommendation |
|
KCB Group*** |
23.4 |
22.3 |
(4.5%) |
(41.9%) |
41.3 |
9.0% |
94.0% |
0.4x |
Buy |
|
Liberty Holdings |
4.0 |
3.7 |
(7.3%) |
(26.4%) |
5.9 |
0.0% |
59.6% |
0.3x |
Buy |
|
Kenya Reinsurance |
1.8 |
1.8 |
1.7% |
(2.1%) |
2.5 |
10.9% |
48.1% |
0.1x |
Buy |
|
Equity Group*** |
37.2 |
37.4 |
0.5% |
(17.0%) |
51.2 |
10.7% |
47.5% |
0.8x |
Buy |
|
Sanlam |
7.6 |
7.2 |
(5.0%) |
(24.6%) |
10.3 |
0.0% |
42.5% |
2.0x |
Buy |
|
NCBA*** |
40.0 |
37.4 |
(6.5%) |
(4.0%) |
48.9 |
11.4% |
42.0% |
0.8x |
Buy |
|
Co-op Bank*** |
11.8 |
12.0 |
1.3% |
(1.2%) |
15.0 |
12.6% |
37.7% |
0.6x |
Buy |
|
Jubilee Holdings |
175.8 |
199.5 |
13.5% |
0.4% |
260.7 |
6.0% |
36.7% |
0.3x |
Buy |
|
ABSA Bank*** |
11.8 |
11.8 |
0.0% |
(3.7%) |
14.7 |
11.5% |
36.3% |
0.9x |
Buy |
|
Standard Chartered*** |
162.5 |
159.5 |
(1.8%) |
10.0% |
183.9 |
13.8% |
29.1% |
1.1x |
Buy |
|
Stanbic Holdings |
110.0 |
110.5 |
0.5% |
8.3% |
127.9 |
11.4% |
27.1% |
0.8x |
Buy |
|
HF Group |
4.5 |
4.6 |
2.0% |
45.7% |
5.8 |
0.0% |
26.6% |
0.2x |
Buy |
|
CIC Group |
2.2 |
2.2 |
0.0% |
13.6% |
2.5 |
6.0% |
21.2% |
0.7x |
Buy |
|
I&M Group*** |
17.9 |
18.1 |
0.8% |
5.9% |
19.5 |
12.5% |
20.3% |
0.4x |
Buy |
|
Diamond Trust Bank*** |
49.0 |
49.8 |
1.5% |
(0.2%) |
54.6 |
10.1% |
19.8% |
0.2x |
Accumulate |
|
Britam |
5.3 |
5.2 |
(2.3%) |
(0.4%) |
6.0 |
0.0% |
15.3% |
0.7x |
Accumulate |
We are “Neutral” on the Equities markets in the short term due to the current tough operating environment and huge foreign investor outflows, and, “Bullish” in the long term due to current cheap valuations and expected global and local economic recovery.
With the market currently being undervalued to its future growth (PEG Ratio at 0.6x), we believe that investors should reposition towards value stocks with strong earnings growth and that are trading at discounts to their intrinsic value. We expect the current high foreign investors sell-offs to continue weighing down the equities outlook in the short term.
- Regulated Real Estate Funds
- Real Estate Investment Trusts (REITs)
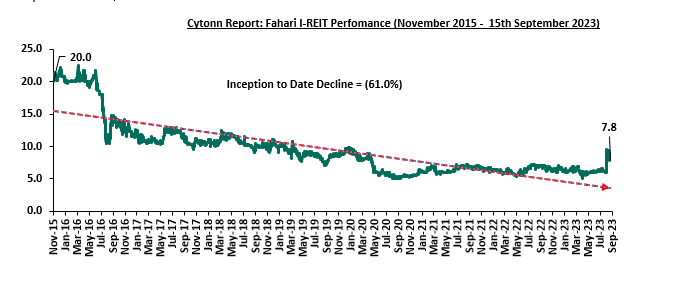
In the Nairobi Securities Exchange, ILAM Fahari I-REIT closed the week trading at an average price of Kshs 7.8 per share. The performance represented a 16.7% decline from Kshs 9.4 per share recorded the previous week, taking it to a 15.0% Year-to-Date (YTD) growth from Kshs 6.8 per share recorded on 3 January 2023. However, the performance represented a 61.0% Inception-to-Date (ITD) loss from the Kshs 20.0 price. The dividend yield currently stands at 8.3%. The graph below shows Fahari I-REIT’s performance from November 2015 to 15 September 2023;
In the Unquoted Securities Platform, Acorn D-REIT and I-REIT traded at Kshs 25.3 and Kshs 21.7 per unit, respectively, as at 08 September 2023. The performance represented a 26.6% and 8.3% gain for the D-REIT and I-REIT, respectively, from the Kshs 20.0 inception price. The volumes traded for the D-REIT and I-REIT came in at 12.3 mn and 30.4 mn shares, respectively, with a turnover of Kshs 257.5 mn and Kshs 627.6 mn, respectively, since inception in February 2021.
REITs provide various benefits like tax exemptions, diversified portfolios, and stable long-term profits. However the continuous deterioration in performance of the Kenyan REITs and restructuring of their business portfolio hampering major investment they had previously made are on top of other general challenges such as; i) inadequate comprehension of the investment instrument among investors, ii) prolonged approval processes for REITs creation, iii) high minimum capital requirements of Kshs 100.0 mn for trustees, and, iv) minimum investment amounts set at Kshs 5.0 mn, continue to limit the performance of the Kenyan REITs market.
- Cytonn High Yield Fund (CHYF)
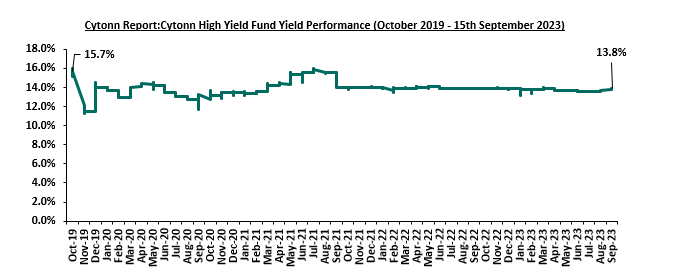
Cytonn High Yield Fund (CHYF) closed the week with an annualized yield of 13.8%, remaining relatively unchanged from the performance recorded the previous week. However, the performance represented 0.1% points Year-to-Date (YTD) decline from 13.9% yield recorded on 1 January 2023, and 1.9% points Inception-to-Date (ITD) decline from the 15.7% yield. The graph below shows Cytonn High Yield Fund’s performance from October 2019 to 15 September 2023;
Notably, the CHYF has outperformed other regulated Real Estate funds with an annualized yield of 13.8%, as compared to Fahari I-REIT, and Acorn I-REIT with yields of 8.3% and 2.8% respectively. As such, the higher yields offered by CHYF makes the fund one of the best alternative investment resource in the Real Estate sector. The graph below shows the yield performance of the Regulated Real Estate Funds:
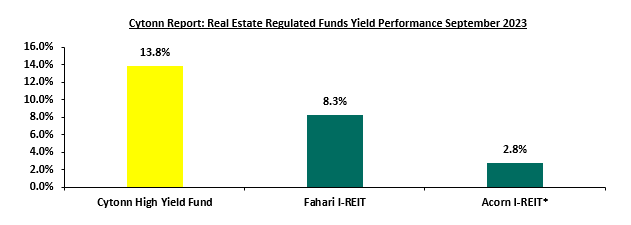
* H1’2023
Source: Cytonn Research
We expect the performance of Kenya’s Real Estate sector to remain on an upward trajectory, supported by factors such as; i) positive demographic trends facilitating increased housing demand, ii) continued focus by the government and private sector to provide affordable housing, iii) infrastructure developments opening up areas for investments, and iv) rapid expansion of retail investors seeking market dominance. However, the oversupply of physical space in select sectors, including commercial office and retail sectors leading to slower uptake of new spaces, rising construction costs on the back of inflationary pressure, and limited investor knowledge and interest in REITs, which is expected to hinder the sector's optimal performance.
Section I: Introduction
One of the key priorities for the government lies in ensuring a harmonious balance between various aspects of its economic policy, particularly in the context of the Balance of Payments (BOP). This includes fostering a stable trade environment, effectively managing capital flows, and addressing inflation, all while maintaining a well-balanced exchange rate system. These efforts are geared towards fostering economic growth, creating employment opportunities, and implementing strategic commercial policies, all of which play pivotal roles in Kenya's pursuit of a robust and sustainable economic trajectory. As such, we saw it fit to focus on Kenya’s balance of payments to analyze the current state and what can be done to improve it.
We have previously tackled the subject of balance of payments in our topical titled Kenya’s Balance of Payments - released In October 2022, where we discussed Kenya’s balance of payments, which shows its economic transactions with other countries. We also covered the main components, such as the current account and the capital account and evaluated the performance, outlook and policy implications of Kenya’s balance of payments situation.
This week, we will review Kenya’s current balance of payment by covering the following:
- Overview of the Balance of Payments,
- The Current State of Kenya’s Balance of Payments,
- Balance of Payments Outlook and Recommendations, and,
- Conclusion
Section II: Overview of the Balance of Payments
The balance of payments (BOP) is the method by which countries measure all of the international monetary transactions within a certain period. It is a crucial financial record that captures the economic interactions between Kenya and the rest of the world during a specified timeframe. It provides a systematic account of how the country engages with the global economy, encompassing a wide range of economic activities including trade of goods and services, financial investments, and various transfer payments like foreign aid and grants from other nations. The Balance of Payments (BOP) holds significant importance as a key economic metric, offering a concise representation of the movement of resources between a nation and its trade partners. This financial record categorizes transactions into three primary accounts: Current Account, the Capital Account, and the Financial Account;
- Current Account
The Current Account is one of the primary components of the BoP and tracks transactions related to day-to-day economic activities of a country with other countries. The component captures transactions of exports and imports of goods and services, income receipts, and payments. It includes four main sub-accounts;
- Balance of Trade (Trade Balance)- This sub-account records the value of Kenya's exports of goods (like tea, coffee, and flowers) and imports of goods (machinery, petroleum, etc.). If Kenya’s exports are more than its imports, it has a trade surplus in this category, otherwise, it has a trade deficit,
- Services trade- The services trade accounts for the export and import of services such as tourism, transportation, and financial services. Kenya's income from foreign tourists and revenue from providing services to other nations contribute to the services sub section the current account,
- Income: In this sub-account, Kenya records income flows from its foreign investments (like profits and dividends from foreign-owned assets in Kenya) and income paid to foreign investors holding assets in Kenya.
- Current Transfers: This sub-account captures unilateral transfers of funds, including foreign aid, remittances from Kenyan expatriates working abroad, and other gifts or grants from foreign sources.
- Capital Account
The Capital Account in the BoP records capital transfers and transactions involving non-produced, non-financial assets. It may include items like the transfer of ownership of patents, copyrights, and trademarks;
- Capital transfers – They represent transactions involving the transfer of ownership of non-financial assets between a country and other countries which do not result in any corresponding goods, services, or financial claims, and
- Acquisition/disposal of non-produced, non-financial assets – These are transactions involving the transfer of ownership rights to assets that are neither produced nor considered financial assets, that is, intangible assets such as brand names and trademarks and rights to use land resources for various economic activities
- Financial Account
The Financial Account is a crucial component that records financial transactions between Kenya and other countries. It includes;
- Foreign Direct Investment (FDI) - This sub-account tracks the flow of investments where foreign entities directly invest in Kenyan businesses or assets. For example, foreign companies setting up operations in Kenya.
- Portfolio Investment - Portfolio investment includes transactions involving financial assets like stocks and bonds. It reflects foreign investors' purchases of Kenyan securities and Kenyan investors' purchases of foreign securities.
- Reserves Assets - The official reserves sub-account accounts for changes in Kenya's foreign exchange reserves held by the central bank. This can result from currency interventions or other actions affecting reserves.
- Other reserves - This covers various financial transactions such as loans, currency, and deposits, and trade credits between Kenya and foreign countries
Other components under financial account include Financial Derivatives and Other Changes in Financial Assets and Liabilities
Section III: The Current State of Kenya’s Balance of Payments
In this section, we will analyze the individual components of Kenya’s balance of payments, its evolution as well as its overall performance.
- Components of Balance of Payments
-
- Current Account Balance
Kenya’s current account deficit narrowed by 39.0% to Kshs 84.9 bn in Q1’2023 from Kshs 139.3 bn recorded in Q1’2022 despite a 27.3% deterioration in the primary income balance to a deficit of Kshs 56.8 bn in Q1’2023 from a deficit of Kshs 44.6 bn in Q1’2022. The narrowing of the deficit was driven by;
- The contraction of the merchandise trade account deficit (the value of import goods exceeds the value of export goods, resulting in a negative net foreign investment) by 7.5% to Kshs 303.6 bn in Q1’2023, from Kshs 328.1 bn recorded in Q1’2022. The improvement is attributable to the 12.0% growth in merchandise exports to Kshs 233.0 bn, from Kshs 208.1 bn in Q1’2022 which outpaced the 0.1% growth in merchandise imports to Kshs 536.6 bn from Kshs 536.2 bn recorded in a similar period in 2022, and,
- A 13.6% improvement in the services trade balance to a surplus of Kshs 56.0 bn from a surplus of Kshs 49.3 bn in Q1’2022 was mainly driven by the 54.3% growth in travel and transport services net receipts to Kshs 34.6 bn in Q1’2023, up from Kshs 22.5 bn recorded in Q1’2022,
- A 19.2% improvement in the secondary income (transfer) balance to a surplus of Kshs 219.54 bn from a surplus of Kshs 184.1 bn in Q1’2022 mainly driven by the 10.6% growth in diaspora remittances to Kshs 128.9 bn in Q1’2023, up from Kshs 116.6 bn recorded in Q1’2022.
The table below shows the breakdown of the various current account components, comparing Q1’2022 and Q1’2023:
|
Cytonn Report: Q1’2023 Current Account Balance |
|||
|
Item |
Q1’2022 |
Q1’2023 |
% Change |
|
Merchandise Trade Balance |
(328.1) |
(303.6) |
(7.5%) |
|
Service Trade Balance |
49.3 |
56.0 |
13.6% |
|
Primary Income Balance |
(44.6) |
(56.8) |
27.3% |
|
Secondary Income (Transfers) Balance |
184.1 |
219.54 |
19.2% |
|
Current Account Balance |
(139.3) |
(84.9) |
(39.0%) |
Source: Kenya National Bureau of Statistics (KNBS), All values in Kshs bn
We observe that, over the last ten years, Kenya’s current account balance has been running deficits, implying that the country relies more on the outside world for its goods and services. The current account deficit as a percentage of GDP was at 4.7% in 2022. However, the current account deficit is projected to widen to 5.3% of GDP in 2023 due to the depreciating Kenyan shilling and implementation of the Finance Act 2023 which introduced an increased tax burden on businesses. The chart below shows the current account deficit over the last 10 years;
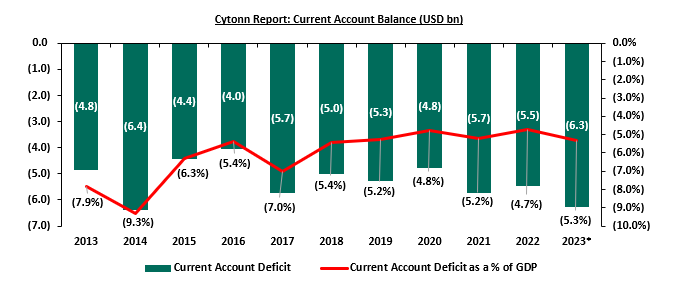
Source: IMF Data *Q1’2023
- Financial Account and Capital Account
The financial account balance is the difference between the foreign assets purchased by domestic buyers and the domestic assets purchased by the foreign buyers, where a surplus adds to the balance of payment while a deficit subtracts from it. It provides a perspective on the claims or liabilities on financial assets to non-residents, where an increase in domestic ownership of foreign assets is an outflow and decreases the financial account of the country, while an increase in foreign ownership of domestic assets is an inflow and increases the financial account. The financial account balance recorded a deficit of Kshs 111.1 bn in Q1’2023, a reversal from the surplus of Kshs 82.9 bn recorded in Q1’2022. A key point to note is that a deficit in the financial account indicates that there are more investment funds flowing out of the country than inflows. The chart below shows the trend in the financial account over the last ten years;
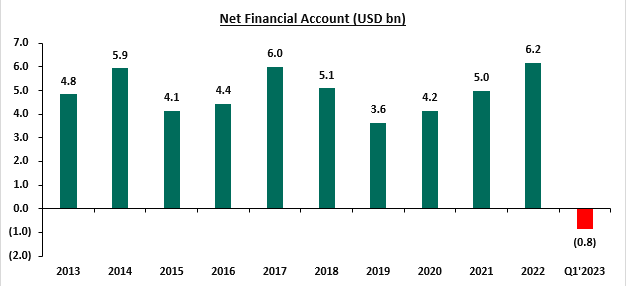
Source: World Bank Data, KNBS Data
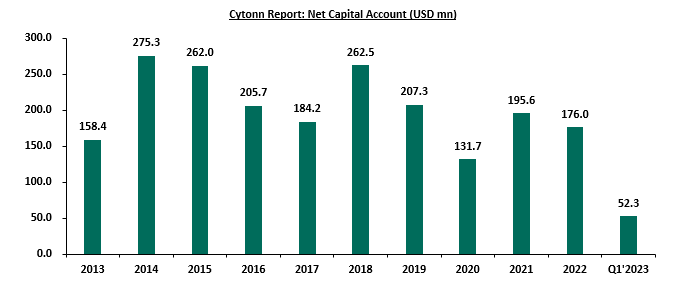
On the other hand, the capital account balance recorded a 5.9% decline to a surplus of Kshs 6.9 bn in Q1’2023, down from a surplus of Kshs 7.4 bn recorded in Q1’2022. Key to note, the account has been increasing at a 10-year CAGR of 1.1% to USD 176.0 mn in 2022 from USD 158.4 mn in 2013. The declining capital account is partly attributable to capital flight in the country with many direct foreign investors shying away from investing in the country. Below is a chart highlighting the movement of the capital account over the last 10 years;
Source: World Bank Data, KNBS Data
- Evolution of Balance of Payments
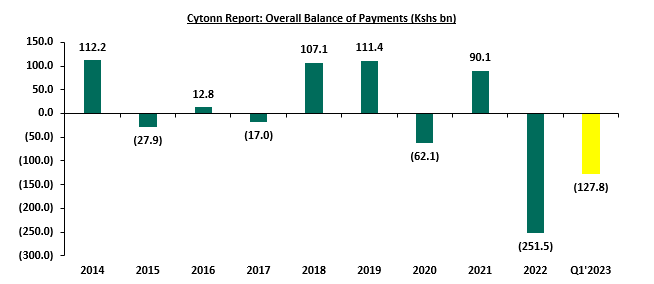
Kenya’s overall balance of payments has been fluctuating over the years, with the balance of payments standing at a deficit of Kshs 127.8 bn in Q1’2023, attributable to the running current account deficit and the high cost of debt servicing. The performance has been mainly supported by the financial account, which has accumulated a surplus over the years, except for Q1’2023 when it registered a deficit. However, the overall balance of payments has been weighed down by the running current account deficit, whose deterioration is attributable to faster growth in the merchandise import bill, which outpaced the growth in merchandise exports due to the increased fuel costs and the lower exports. It is important to note that the deterioration in trade terms contributes to an excess of import bills over export earnings as Kenya has remained a net importer of food, fuel and other raw materials. Below is a graph highlighting the trend in Kenya’s balance of payments over the last nine years;
Source: Kenya National Bureau of Statistics (KNBS)
Key take-outs from the chart include;
- In 2022, the balance of payment ended the year at a deficit of Kshs 251.5 bn primarily due to increased capital out flows following the heightened uncertainty in business environment following the political tensions arising from the country’s general election, and,
- The balance of payment position deteriorated by 6.0% to a deficit of Kshs 127.8 bn in Q1’2023, from a deficit of Kshs 120.6 bn recorded in Q1’2022 mainly attributed to the reversal of the financial account balance from a surplus of Kshs 82.9 bn in Q1’2022 to a deficit of Kshs 111.1 bn in Q1’2023 coupled with increased drawdowns in the official reserves to service external debt. This was further exacerbated by currency depreciation with the Kenyan shilling having depreciated against the US dollar by 7.2% in Q1’2023, given that 67.3% of Kenya's external debt as of March 2023 was denominated in USD.
Going forward, we expect the balance of payments to remain in a deficit position as the sustained depreciation of the shilling against hard currency continues to inflate the country's import bill. However, in the long term, we expect that the current administration’s focus on fiscal consolidation will improve the balance of payments performance by minimizing the costs of servicing external debts through the adjustment of the public debt mix in the FY/2023/24 budget to comprise 18.3% foreign debt and 81.7% domestic debt, from 48.0% foreign financing and 52.0% domestic financing in FY’2022/23. Additionally, the introduction of the fertilizer subsidy program is set to reduce the costs of farm inputs, coupled with favorable weather is set to boost agricultural production in the country thereby increasing exports of agricultural products, and supporting the current account.
- Performance Measurements of Balance of Payments
Balance of payments is influenced by a number of factors which include;
- Exports and Imports
Exports are goods and services that a country sells to other countries. Exports affect the balance of payment by increasing the value of goods and services sold to other countries and reducing the trade deficit. Exports also form a major source of foreign currency, which contributes to the stability of the domestic currency against other currencies. Imports on the other hand are goods and services that a country buys from other countries. Imports affect the balance of payment by offsetting the value of goods and services sold to other countries and thereby increasing the trade deficit. Increase in value of imports also reduces the foreign currency reserves and the current account balance.
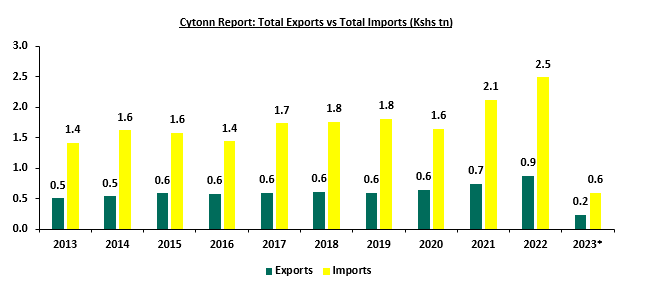
Over the last ten years, Kenya’s annual value of imports has averaged Kshs 0.6 tn, three factors lower than the average annual value of exports of Kshs 1.8 tn. Over aver the same period, imports registered a compounded annual growth rate of 5.8% to Kshs 2.5 tn in 2022 from Kshs 1.4 tn in 2013, which outpaced that of exports at 5.7% to Kshs 0.9 tn in 2022 from Kshs 0.5 tn in 2013, hence resulting in running trade deficits over the period. The chart below shows the total imports and exports over the last ten years;
Source: KNBS, *Provisional figures (Q1’2023)
- Foreign Direct Investments
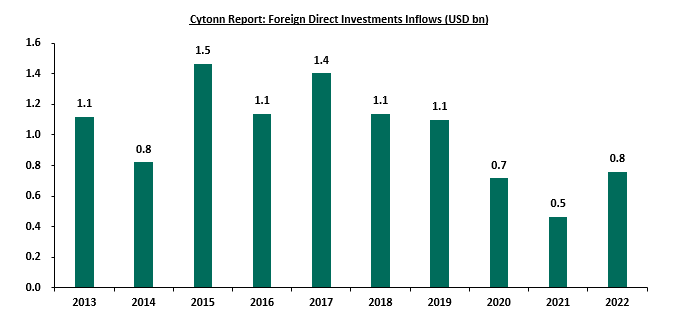
A Foreign direct investment (FDI) is an investment by a business or an individual in one country in an enterprise in another country with the intention of establishing a lasting interest. FDI inflows increased significantly by 63.9% to USD 0.8 bn (Kshs 93.64 bn) in 2022, from USD 0.5 bn (Kshs 52.4 bn) in 2021 attributed to economic recovery from the tough economic environment occasioned by the Covid-19 pandemic.
FDI can improve the current account of the BOP by increasing the exports of goods and services from the host country to the foreign market. This is especially true if the FDI is in export-oriented sectors or if the foreign investor uses local inputs and suppliers. A good example is FDI in Kenya’s horticulture sector which has boosts its exports of flowers, fruits, and vegetables to Europe and other regions. FDI can also worsen the current account of the BOP by increasing the imports of goods and services from the foreign market to the host country if the FDI is in import-dependent sectors. The chart below shows the FDI inflows over the last ten years;
Source: UNCTAD World Investments Report
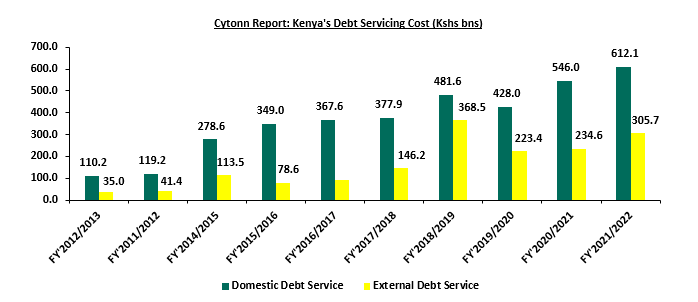
- Debt
Kenya’s debt stock has been on the rise over the years mainly due to a widening fiscal deficit coupled with increased debt servicing costs. Key to note, the country’s debt stood at Kshs 9.9 tn as of end of August 2023, equivalent to 68.4% of GDP and 18.4% points above the IMF recommended threshold of 50.0% for developing nations. The increased debt burden has consequently led to a decline in the gross reserves as it necessitates a draw down in the reserves, leading to the deterioration of the balance of payments. The graph below shows the debt servicing costs over the last ten fiscal years:
Source: National Treasury
Despite, the debt service to revenue ratio easing by 2.1% points to 47.9% in the FY’2021/2022 down from 50.0% observed in FY’2020/2021, the ratio remained 17.9% points above the IMF’s recommended threshold of 30.0%. Notably, the country’s debt service to revenue ratio stood at 82.6% as at the end of August 2023. The sustained level of debt service to revenue ratio above the recommended threshold is a worrying sign, elevating the refinancing risk following shocks arising from the political tension witnessed in the country and global supply disruptions accelerated by the ongoing Russian-Ukrainian conflict. Below is a chart showing the debt service to revenue ratio for the last ten fiscal years;
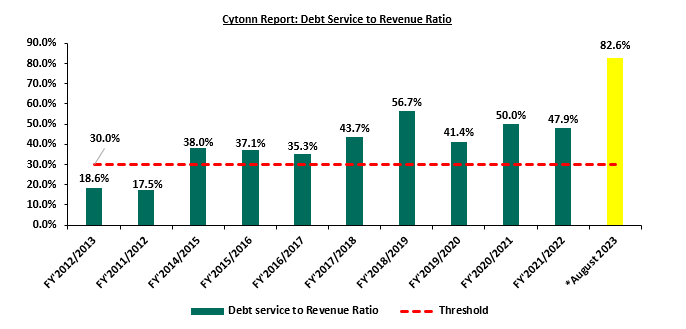
Source: National Treasury, *Provisional figures
Balance of payments deficit indicates that the country is spending more than it is receiving. As such, it is forced to borrow more money to pay for the goods and services from the rest of the world. In the long-term, a country becomes a net consumer and not a net producer of the global economic output which leads to more debt requirements. Additionally, a persistent deficit may necessitate selling of some of the resources to pay its creditors.
Section IV: Factors affecting Balance of Payments
The balance of payment is a reflection of the economic interaction of a nation with the rest of the world over a specific period. Several factors not limited to economic, political, government policies, global economic conditions as well as currency, determine the state of balance of payment of a nation. These factors include:
- Balance of Trade- When a country’s value of exports of goods and services is more compared to its imports, then it has a trade surplus. This in turn is a good indicator on the balance of payments as it means the inflows outrun the outflows. Farther, more import value of goods and services of a country compared to the exports value is called a trade deficit, and is viewed as an indicator of a poor balance of payment as the nation is spending more on imports than its earning, which negatively affects the balance of payment.
- Foreign Direct Investment (FDI)- FDI refers to the foreign investments in terms of business interests and assets into a foreign country. This in turn increases the inflow of foreign exchange, development in new technology, increased employment opportunities as well as increased tax revenues. In turn, an increase in FDI is favorable to the balance of payment while a decrease has a negative effect on the country’s BoP.
- Exchange rates- When market forces or deliberate government policies depreciates the currency of a nation, the prices of exports in foreign markets are cheaper compared to the imports. In turn, the exports inflow increases due to increase in demand, resulting from cheaper prices, while the imports decrease as the inflated import prices reduce consumption appetite.
- Economic growth rate- When the differential rate of GDP growth across countries increases, the country’s attractiveness of its assets increases, which in turn leads to increased capital flows. This can be in form of portfolio investments, loans and other capital flows. Consequently, this will lead to improved balance of payment account, by improving the financial account.
- Inflation- When a country’s inflation rate increases compared to its trade partners, the home prices of goods and services increases, which reduces the demand for the country’s exports. Additionally, high inflation increases the cost of imports as they are cheaper compared to domestic products being exported to other countries. In turn, this can lead to a deficit in the BoP.
- Government policies- The government can enact policies that are geared to encourage exports or to reduce the value of imports, which is meant to improve the trade surplus. Some of the policies can be imposing tariffs, quotas on imports or a total import ban on a product, to reduce the value of imports. Additionally, the government can promote exports through foreign trade agreements or export subsidies. Both strategies can be used to improve the balance of payments.
- Global economic conditions- Shifts in the global economies like commodity price fluctuations, recessions, affect the state of the balance of payment. This is as a result of impacted trade, capital flows, foreign remittances and reduced financial transactions. All these can affect the health of the BoP leading to a trade deficit.
- Excessive government borrowing- High levels of foreign debt can increase a country’s risk to financial crises, which can make investors pessimistic on the government’s ability to service debt. As a result, it can lead to withdrawal of investments, capital flight as well as negatively impacting the financial account of the BoP.
Section V: Policy Recommendations
It is crucial for any government to come up with policies that will favor the health of the BOP through improving exports while lowering the imports value, in order to achieve a balance of payment surplus. Therefore, we suggest the following specific recommendations for the government to narrow the BoP deficit and improve the general state of the BoP account:
- Encourage export diversification- the government should shift from complete over-reliance on traditional exports like tea, horticulture and coffee, through diversification in promoting value added processing and manufacturing to increase export revenue.
- Export promotion- The government can employ different strategies to encourage more export volumes and produce. This can be done through actively engaging in trade pacts that favor Kenyan exports in new markets. For example, the recently signed trade agreement with the EU is meant to give Kenyan exports an advantage in the European market. Additionally, the government can provide export incentives and subsidies to increase Kenyan products’ price competition in foreign markets.
- Increase agricultural produce- the government should support small-scale farmers with improved agricultural technology and quality inputs, as well as improved access to credit. This will help increase the agricultural productivity, thus increasing exports, while reducing the dependence on some of the unnecessary agricultural imports like sugar and wheat.
- Encouraging Foreign Direct Investment (FDI)- The government should be strategic in creating an attractive investment environment for foreign investments through improving regulatory transparency as well reducing hurdles in the process. The Kenyan government can target key investment sectors of global interest like the Renewable energy sector and Sustainable Energy Development Goals (SEDG), and make it favorable for foreign investors
- Reducing Imports- The government should carefully cut down on imports and only import what is needed, while encouraging domestic production of some of the imports. This can be achieved through introduction of import restrictions like quotas and tariffs. To note, this should be carefully done to strike a balance between domestic industry protection as well protecting existing trade relationships with other nations.
- Maintaining a sustainable debt level- The government should also strike a balance between foreign borrowing which helps increase the foreign reserves, while maintaining a good credit score with its creditors. This ensures that the country remains attractive for investors’ capital and financial flows. As such, the government should be intentional in honoring the upcoming maturities like the forthcoming USD 2.0 bn Eurobond in June 2024, given the recent credit rating outlook downgrade by Fitch from stable to negative. This downgrade was a confirmation of both Moody’s and S&P earlier ratings on the Kenya’s credit rating outlook.
Section VI: Conclusion
The country’s balance of payments has been weak for the last 10 years due to a persistent current account deficit. This has been brought about by the rising costs of debt servicing as the Kenya shilling depreciated against the US dollar, given that 66.8% of Kenya’s external debt as of April 2023 is denominated in the US dollar. As a result, the country’s import bill has increased due to the weakening of the shilling against hard currency. Therefore, we expect that the high costs of imports will continue to affect the current account’s performance in the medium term. The government has a significant role to play in managing the debt levels, reducing the fiscal deficit, and restoring economic stability to improve the balance of payments position. We note that the current administration’s focus on fiscal consolidation will improve the balance of payments performance by reducing the costs of servicing external debts through the change of the public debt mix in the FY/2023/24 budget to consist of 18.3% foreign debt and 81.7% domestic debt, from 48.0% foreign financing and 52.0% domestic financing in FY’2022/23. Moreover, the launch of the fertilizer subsidy program is expected to lower the costs of farm inputs, enhance agricultural production in the country, and increase exports of agricultural products. We also expect that multilateral trade partnership deals such as the Kenya-EU Trade Deal and the Tripartite Agreement between the EAC, SADC and COMESA will help stabilize the balance of payments by increasing the demand and supply of exports. However, the government needs to reduce the country’s overreliance on debt and imports. One of the best ways to achieve this is to promote domestic production and attract foreign direct investments, especially in export-oriented sectors, to boost the country’s export values.
Disclaimer: The views expressed in this publication are those of the writers where particulars are not warranted. This publication, which is in compliance with Section 2 of the Capital Markets Authority Act Cap 485A, is meant for general information only and is not a warranty, representation, advice, or solicitation of any nature. Readers are advised in all circumstances to seek the advice of a registered investment advisor.

- Talk to us
- Kenya
- P.O Box 20695 - 00200, Nairobi, Kenya
- Cell +254709101200
- Tel +254709101200
- WhatsApp +254741676635
- United States
- +254709101200
- DOWNLOAD OUR APP
-


- Kenya
- 8th Floor, Pinetree Plaza, Kaburu Drive, Ngong Road, Nairobi, Kenya
- USA
- Suite 1150, 1775 Eye Street NW, USA, Washington DC 20006, USA
- Investments
- High Yield
- Private Equity
- Real Estate
- Real Estate
- RiverRun Estates
- Cytonn Towers
- The Ridge
- Taraji Heights
- The Alma