Kenya’s Balance of Payments & Cytonn Weekly #40/2022
By Research Team, Oct 9, 2022
Executive Summary
Fixed Income
During the week, T-bills were oversubscribed, with the overall subscription rate coming in at 110.0%, up from the 38.8% recorded the previous week. The oversubscription was partly attributable to the eased liquidity in the money market, with the average interbank rate declining to 5.3% from 5.6% recorded the previous week. Investor’s preference for the shorter 91-day paper persisted, with the paper receiving bids worth Kshs 18.1 bn against the offered Kshs 4.0 bn, translating to a subscription rate of 452.2%, up from 128.2% recorded the previous week. Similarly, the subscription rate for the 364-day and 182-day papers increased to 14.3% and 68.8% from 11.5% and 30.5% respectively, recorded the previous week. The yields on the government papers recorded mixed performance, with the yields on the 182-day and 91-day papers increasing by 0.8 bps and 8.4 bps to 9.6% and 9.2%, respectively, while the yields on the 364-day paper remained unchanged at 9.9%. In the Primary Bond Market, the Central Bank of Kenya released results for the recently re-opened bonds; FXD1/2017/10 and FXD1/2020/15 highlighting that the bonds recorded an undersubscription of 47.0%;
Additionally during the week, Stanbic Bank released its monthly Purchasing Manager’s Index (PMI), highlighting that the index for the month of September rose to 51.7 from 44.2 recorded in August 2022, pointing towards an improvement in the business conditions following a peaceful general election;
Equities
During the week, the equities market was on a downward trajectory with NASI, NSE 20 and NSE 25 declining by 1.6%, 2.4% and 2.2%, respectively. The equities market performance was mainly driven by losses recorded by large-cap stocks such as KCB Group, ABSA, Equity Group and Bamburi of 4.5%, 4.4%, 4.2%, and 4.0% respectively. The losses were however mitigated by gains recorded by other large cap stocks such as NCBA Group of 5.4%;
Also during the week, the Insurance Regulatory Authority of Kenya (IRA) released the Quarterly Insurance Industry Report for the period ended 30th June 2022 highlighting that the industry’s profits after tax declined by 40.0% to Kshs 3.5 bn, from Kshs 5.8 bn recorded in Q2’2021. Additionally, Safaricom Group Plc announced the official launch of Safaricom Telecommunications Ethiopia (STE), an international consortium that will offer telecommunication services in Ethiopia;
Real Estate
During the week, President William Ruto floated a mortgage plan that will allow tenants to own homes under the social housing tenant purchase scheme, and, affordable housing initiative, through monthly rental payments. Additionally, the President announced plans to commission an affordable housing project consisting of 5,000 units in Homa Bay County. In the infrastructure sector, the president announced plans to complete the construction of over 200 Km of roads in Homa Bay County and its environs. For Real Estate Investment Trusts (REITs), Fahari I-REIT closed the week trading at an average price of Kshs 7.1 per share on the Nairobi Stock Exchange, while Acorn D-REIT and I-REIT closed the week trading at Kshs 23.8 and Kshs 20.8 per unit, respectively, on the Unquoted Securities Platform;
Focus of the Week
Every government that takes office is concerned with policies pertaining to trade, capital flows, inflation management, the exchange rate system, economic growth, employment opportunities, and commercial policies aimed at ensuring a country's economic growth. Kenya, like any other country, aims at achieving both internal balance by promoting price stability and external balance by maintaining a balance of payment equilibrium. Key to note, Kenya’s balance of payment stood at a deficit of Kshs 120.6 bn as of Q1’2022, a 376.9% increase from a deficit of Kshs 25.3 bn in Q1’2021 mainly due to a decline in the gross official reserves which have gone into debt service. The deterioration in the balance of payment is one of the key challenges that the new administration will face hence the need to develop policies to manage it and this week, we turn our focus to Kenya’s balance of payments to shed light on the subject and give our specific recommendations;
Investment Updates:
- Weekly Rates:
- Cytonn Money Market Fund closed the week at a yield of 10.3%. To invest, dial *809# or download the Cytonn App from Google Playstore here or from the Appstore here;
- Cytonn High Yield Fund closed the week at a yield of 13.93% p.a. To invest, email us at sales@cytonn.com and to withdraw the interest, dial *809# or download the Cytonn App from Google Playstore here or from the Appstore here;
- We continue to offer Wealth Management Training every Wednesday and every third Saturday of the month, from 9:00 am to 11:00 am, through our Cytonn Foundation. The training aims to grow financial literacy among the general public. To register for any of our Wealth Management Trainings, click here;
- If interested in our Private Wealth Management Training for your employees or investment group, please get in touch with us through wmt@cytonn.com;
- Any CHYS and CPN investors still looking to convert are welcome to consider one of the five projects currently available for assignment, click here for the latest term sheet;
- Cytonn Insurance Agency acts as an intermediary for those looking to secure their assets and loved ones’ future through insurance namely; Motor, Medical, Life, Property, WIBA, Credit and Fire and Burglary insurance covers. For assistance, get in touch with us through insuranceagency@cytonn.com;
- Cytonnaire Savings and Credit Co-operative Society Limited (SACCO) provides a savings and investments avenue to help you in your financial planning journey. To enjoy competitive investment returns, kindly get in touch with us through clientservices@cytonn.com;
- For an exclusive tour of Cytonn’s real estate developments, visit: Sharp Investor's Tour, and for more information, email us at sales@cytonn.com;
- Phase 3 of The Alma is now ready for occupation and the show house is open daily. To rent please email properties@cytonn.com;
- We have 8 investment-ready projects, offering attractive development and buyer targeted returns; See further details here: Summary of Investment-ready Projects;
- For Third Party Real Estate Consultancy Services, email us at rdo@cytonn.com;
- For recent news about the group, see our news section here;
Hospitality Updates:
- We currently have promotions for Staycations. Visit cysuites.com/offers for details or email us at sales@cysuites.com;
During the week, T-bills were oversubscribed, with the overall subscription rate coming in at 110.0%, up from the 38.8% recorded the previous week. The oversubscription was partly attributable to the eased liquidity in the money market, with the average interbank rate decreasing to 5.3% from 5.6% recorded in the previous week. Investor’s preference for the shorter 91-day paper persisted, with the paper receiving bids worth Kshs 18.1 bn against the offered Kshs 4.0 bn, translating to a subscription rate of 452.2%, up from 128.2% recorded the previous week. The subscription rate for the 364-day and 182-day papers also increased to 14.3% and 68.8% from 11.5% and 30.5% respectively, recorded the previous week. The yields on the government papers recorded mixed performance, with the yields on the 182-day and 91-day papers increasing by 0.8 bps and 8.4 bps to 9.6% and 9.2%, respectively, while the yields on the 364-day paper remained unchanged at 9.9%.
In the Primary Bond Market, the Central Bank of Kenya released results for the recently re-opened bonds; FXD1/2017/10 and FXD1/2020/15 with effective tenors to maturity of 4.9 years and 12.3 years respectively. As per our expectations, the bonds recorded an undersubscription of 47.0%, partly attributable to investors’ preference for the shorter dated papers as they sought to avoid duration risk. The government issued the bonds seeking to raise Kshs 40.0 bn for budgetary support, received bids worth Kshs 18.8 bn and accepted bids worth Kshs 15.1 bn, translating to an 80.4% acceptance rate. The weighted average yields for the two bonds were 13.4% for FXD1/2017/10 and 14.0% for FXD1/2020/15.
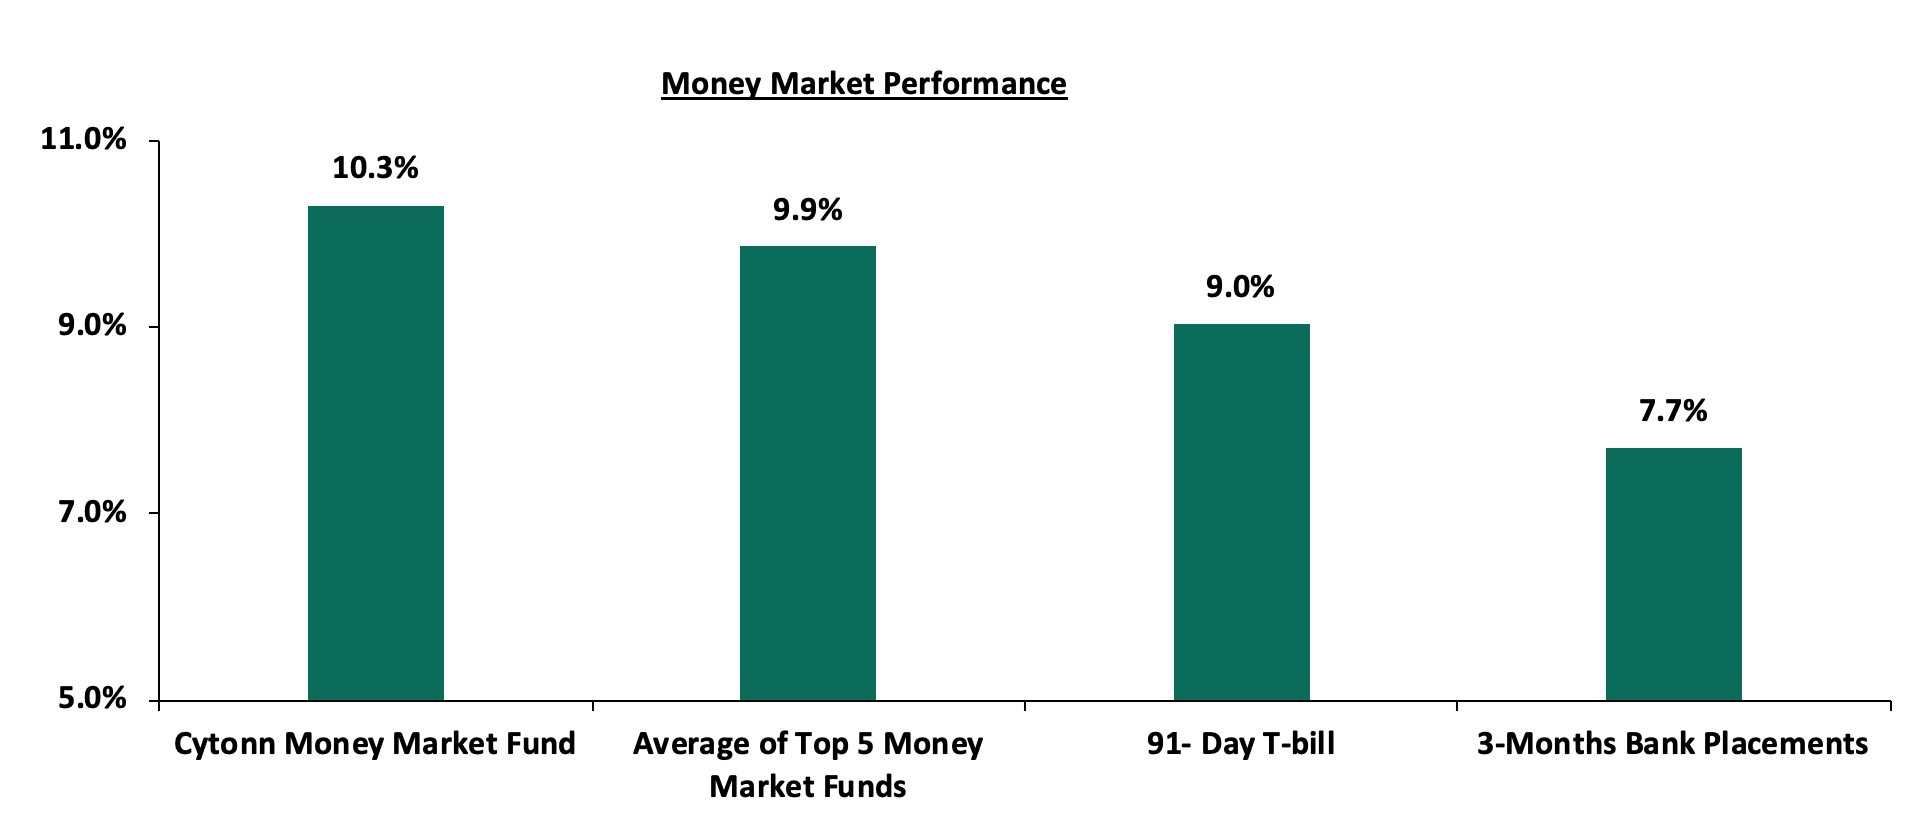
In the money markets, 3-month bank placements ended the week at 7.7% (based on what we have been offered by various banks), while the yield on the 91-day T-bill increased by 8.4 bps to 9.0%. The average yield of the Top 5 Money Market Funds and the yield of Cytonn Money Market Fund declined by 0.1 bps and 0.2 bps to 9.9% and 10.3%, respectively.
The table below shows the Money Market Fund Yields for Kenyan Fund Managers as published on 7th October 2022:
|
Money Market Fund Yield for Fund Managers as published on 7th October 2022 |
||
|
Rank |
Fund Manager |
Effective Annual Rate |
|
1 |
Cytonn Money Market Fund |
10.3% |
|
2 |
Zimele Money Market Fund |
9.9% |
|
3 |
GenCap Hela Imara Money Market Fund |
9.9% |
|
4 |
NCBA Money Market Fund |
9.7% |
|
5 |
Dry Associates Money Market Fund |
9.5% |
|
6 |
Sanlam Money Market Fund |
9.4% |
|
7 |
Nabo Africa Money Market Fund |
9.4% |
|
8 |
Madison Money Market Fund |
9.3% |
|
9 |
Old Mutual Money Market Fund |
9.3% |
|
10 |
Apollo Money Market Fund |
9.2% |
|
11 |
Co-op Money Market Fund |
9.2% |
|
12 |
CIC Money Market Fund |
9.1% |
|
13 |
Orient Kasha Money Market Fund |
8.8% |
|
14 |
ICEA Lion Money Market Fund |
8.5% |
|
15 |
AA Kenya Shillings Fund |
8.4% |
|
16 |
British-American Money Market Fund |
7.7% |
Source: Business Daily
Liquidity:
During the week, liquidity in the money markets eased, with the average interbank rate declining to 5.3% from 5.6% recorded the previous week, partly attributable to government payments that offset tax remittances. The average interbank volumes traded increased by 49.3% to Kshs 17.6 bn from Kshs 11.8 bn recorded the previous week.
Kenya Eurobonds:
During the week, the yields on Eurobonds were on a downward trajectory, an indication of easing risk concerns over the economy by investors despite the persistent inflationary pressures. The yield on the 10-year Eurobond issued in 2014 declined the most by 1.6% to 16.0% from 17.6% recorded in the previous week. The table below shows the summary of the performance of the Kenyan Eurobonds as of 6th October 2022;
|
Cytonn Report: Kenya Eurobond Performance |
||||||
|
2014 |
2018 |
2019 |
2021 |
|||
|
Date |
10-year issue |
10-year issue |
30-year issue |
7-year issue |
12-year issue |
12-year issue |
|
3-Jan-22 |
4.4% |
8.1% |
8.1% |
5.6% |
6.7% |
6.6% |
|
30-Sep-22 |
17.6% |
14.7% |
14.0% |
15.6% |
14.7% |
13.2% |
|
3-Oct-22 |
17.4% |
14.8% |
14.0% |
15.7% |
14.8% |
13.2% |
|
4-Oct-22 |
16.6% |
14.3% |
13.6% |
15.0% |
14.3% |
12.8% |
|
5-Oct-22 |
15.9% |
14.0% |
13.4% |
15.1% |
14.1% |
12.6% |
|
6-Oct-22 |
16.0% |
13.7% |
13.1% |
14.8% |
13.8% |
12.6% |
|
Weekly Change |
(1.6%) |
(1.0%) |
(0.9%) |
(0.8%) |
(0.9%) |
(0.6%) |
|
MTD Change |
(1.6%) |
(1.0%) |
(0.9%) |
(0.8%) |
(0.8%) |
(0.6%) |
|
YTD Change |
11.6% |
5.6% |
5.0% |
9.2% |
7.1% |
6.0% |
Source: Central Bank of Kenya (CBK)
Kenya Shilling:
During the week, the Kenyan shilling depreciated by 0.1% against the US dollar to close the week at Kshs 120.9, from Kshs 120.7 recorded the previous week, partly attributable to increased dollar demand from the oil and energy sectors against a slower supply of hard currency. On a year to date basis, the shilling has depreciated by 6.8% against the dollar, higher than the 3.6% depreciation recorded in 2021. We expect the shilling to remain under pressure in 2022 as a result of:
- High global crude oil prices on the back of persistent supply chain bottlenecks coupled with high demand as most economies gradually recover,
- An ever-present current account deficit estimated at 5.2% of GDP in the 12 months to August 2022, same as that was recorded in a similar period in 2021, and,
- The aggressively growing government debt which continues to put pressure on forex reserves given that 68.1% of Kenya’s debt is US Dollar denominated as of July 2022.
The shilling is however expected to be supported by:
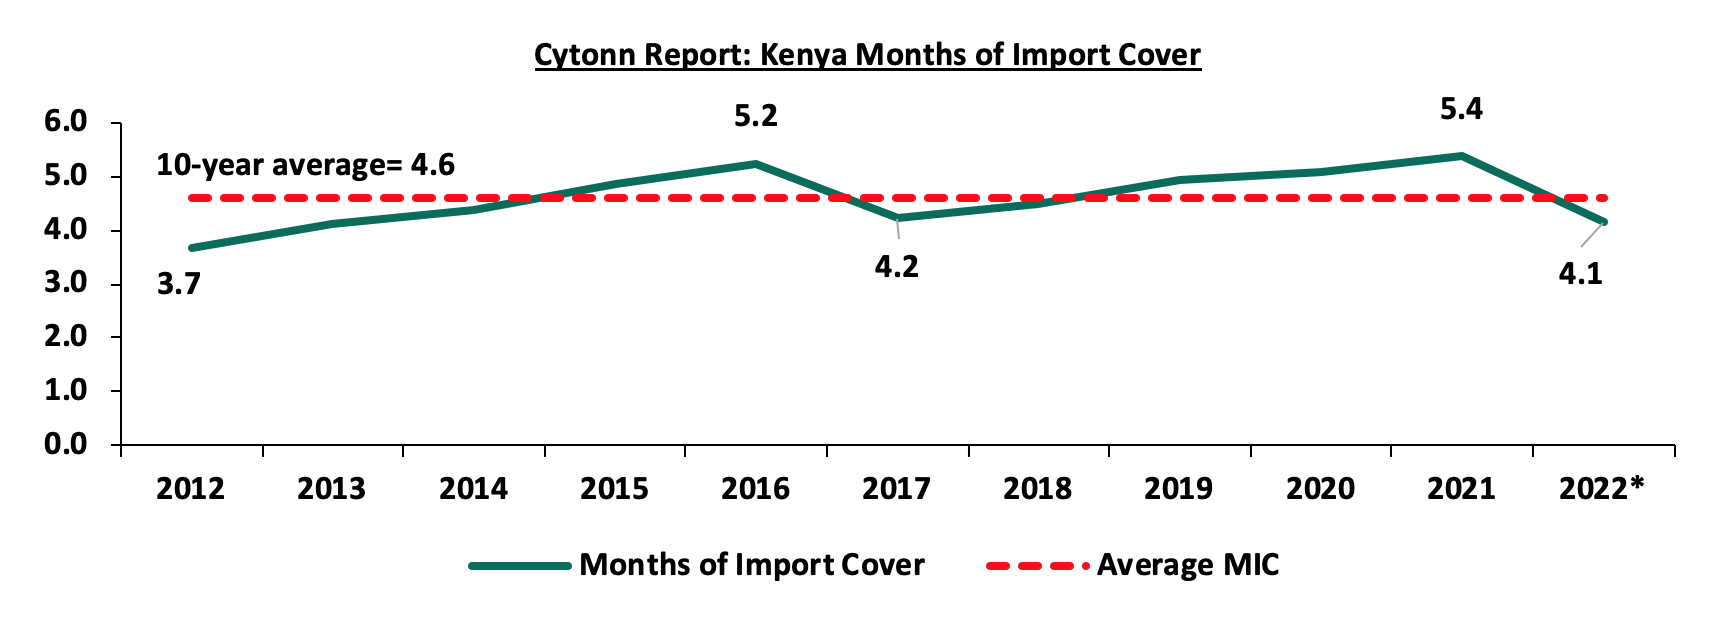
- Sufficient Forex reserves currently at USD 7.3 bn (equivalent to 4.1 months of import cover), which is above the statutory requirement of maintaining at least 4.0-months of import cover, however it’s important to note that Forex reserves has dropped by 16.5% on YTD from USD 8.8 bn to the current USD 7.3 bn. The chart below summarizes the evolution of Kenya months of import cover over the last 10 years.
- Sufficient diaspora remittances standing at a cumulative USD 3,992.0 mn as of August 2022, representing a 14.7% y/y increase from USD 3,481.0 mn recorded over the same period in 2021.
Weekly Highlight:
Stanbic Bank’s September 2022 Purchasing Manager’s Index (PMI)
During the week, Stanbic Bank released its monthly Purchasing Manager’s Index (PMI), highlighting that the index for the month of September rose to 51.7 from 44.2 recorded in August 2022, marking a six months high. The index points towards an improvement in the business environment following a peaceful general election. The increase was largely attributable to the increase in demand for consumer goods which consequently led to an increase in new business volumes after a five-month period of declines. The chart below summarizes the evolution of PMI over the last 24 months.
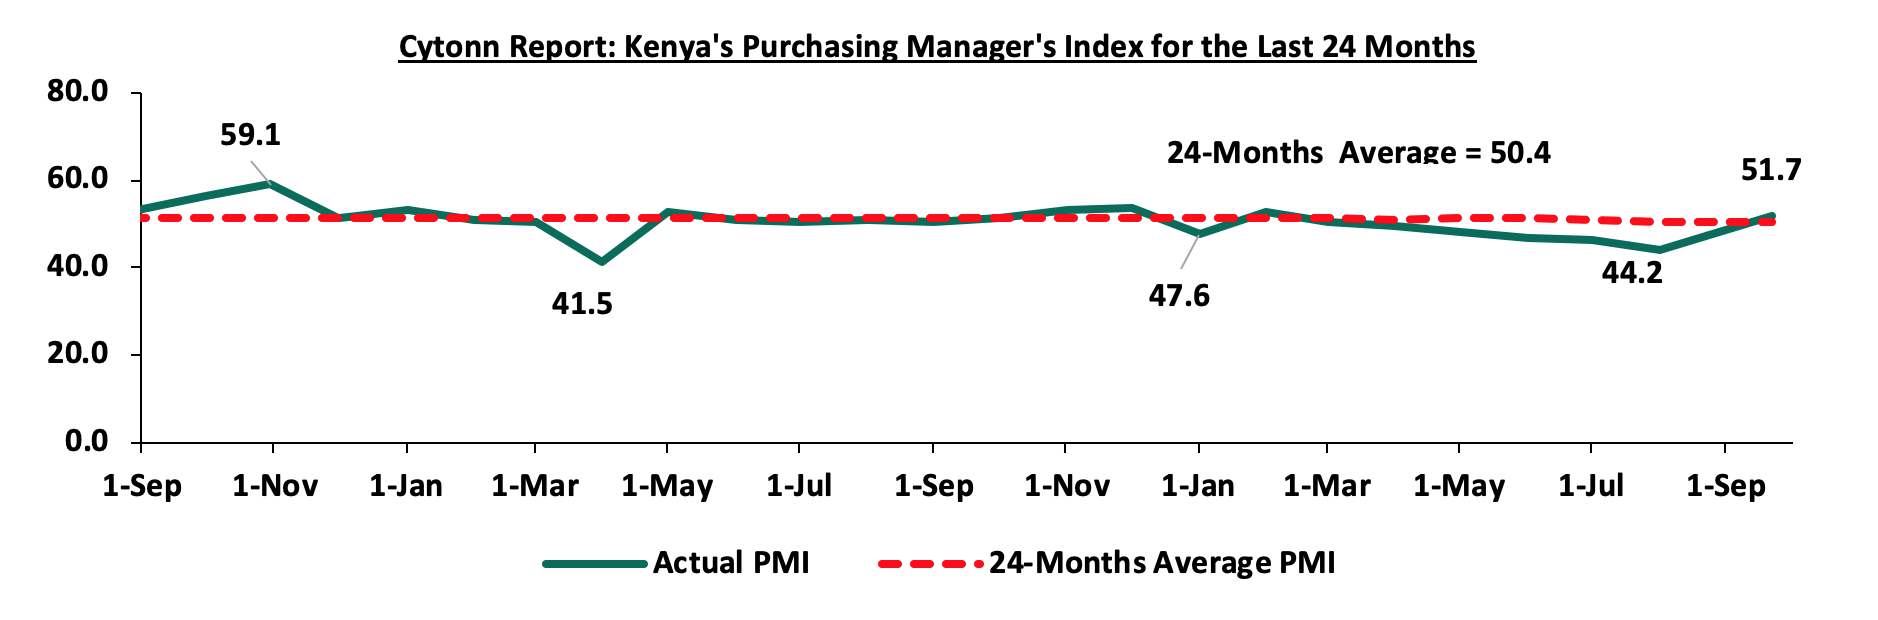
*** Key to note, a reading above 50.0 signals an improvement in business conditions, while readings below 50.0 indicate a deterioration.
Despite the improvement in the September PMI, we expect the general business environment to remain subdued in the short term owing primarily to the high cost of living brought on by the elevated inflationary pressures. With fuel being a major input cost to many businesses, we expect the high global fuel prices to contribute to the deterioration of business conditions in the country even further, given the partial removal of the fuel subsidy. We expect the subsidy to be completely eliminated in the coming months as it continues to weigh on the government’s budget.
Rates in the Fixed Income market have remained relatively stable due to the relatively ample liquidity in the money market. The government is 3.7% behind its prorated borrowing target of Kshs 158.2 bn having borrowed Kshs 152.4 bn of the Kshs 581.7 bn borrowing target for the FY’2022/2023. We expect sustained gradual economic recovery as evidenced by the revenue collections of Kshs 2.0 tn in the FY’2021/2022, equivalent to a 2.8% outperformance. Despite the performance, we believe that the projected budget deficit of 6.2% is relatively ambitious given the downside risks and deteriorating business environment occasioned by high inflationary pressures. We however expect the support from the IMF and World Bank to finance some of the government projects and thus help maintain a stable interest rate environment since the government is not desperate for cash. Owing to this, our view is that investors should be biased towards short-term fixed-income securities to reduce duration risk.
Market Performance:
During the week, the equities market was on a downward trajectory with NASI, NSE 20 and NSE 25 declining by 1.6%, 2.4% and 2.2%, respectively. The equities market performance was mainly driven by losses recorded by large-cap stocks such as KCB Group, ABSA, Equity Group and Bamburi of 4.5%, 4.4%, 4.2%, and 4.0% respectively. The losses were however mitigated by gains recorded by other large cap stocks such as NCBA Group of 5.4%.
During the week, equities turnover increased by 43.9% to USD 20.7 mn from USD 14.4 mn recorded the previous week, taking the YTD turnover to USD 677.0 mn. Additionally, foreign investors remained net sellers, with a net selling position of USD 13.6 mn, from a net selling position of USD 4.9 mn recorded the previous week, taking the YTD net selling position to USD 177.8 mn.
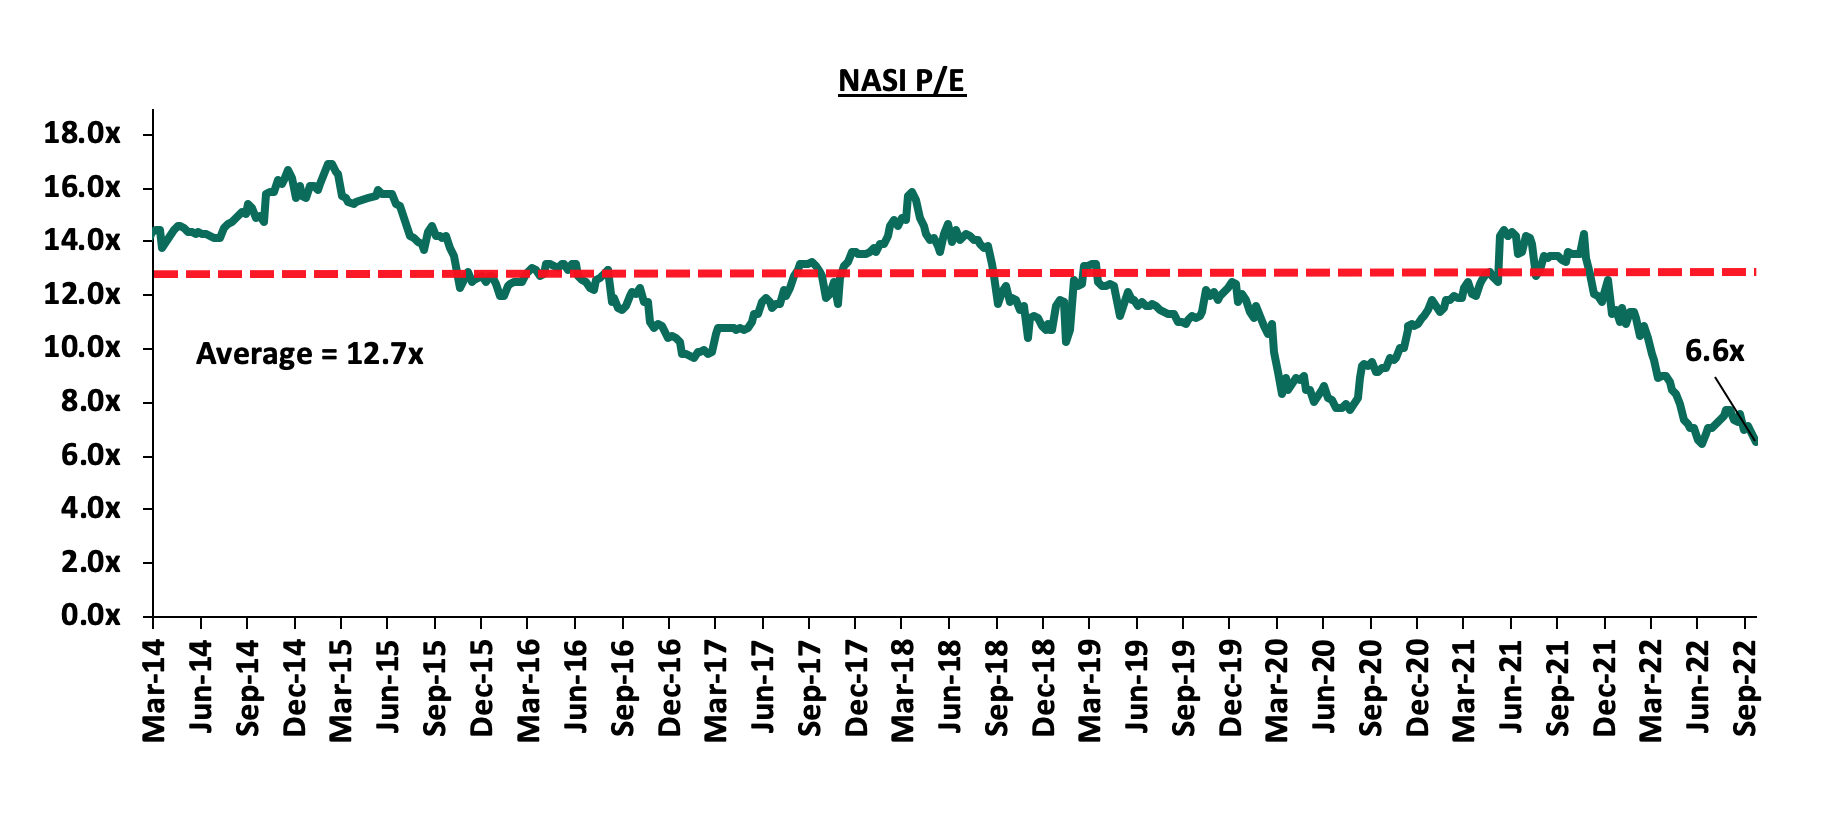
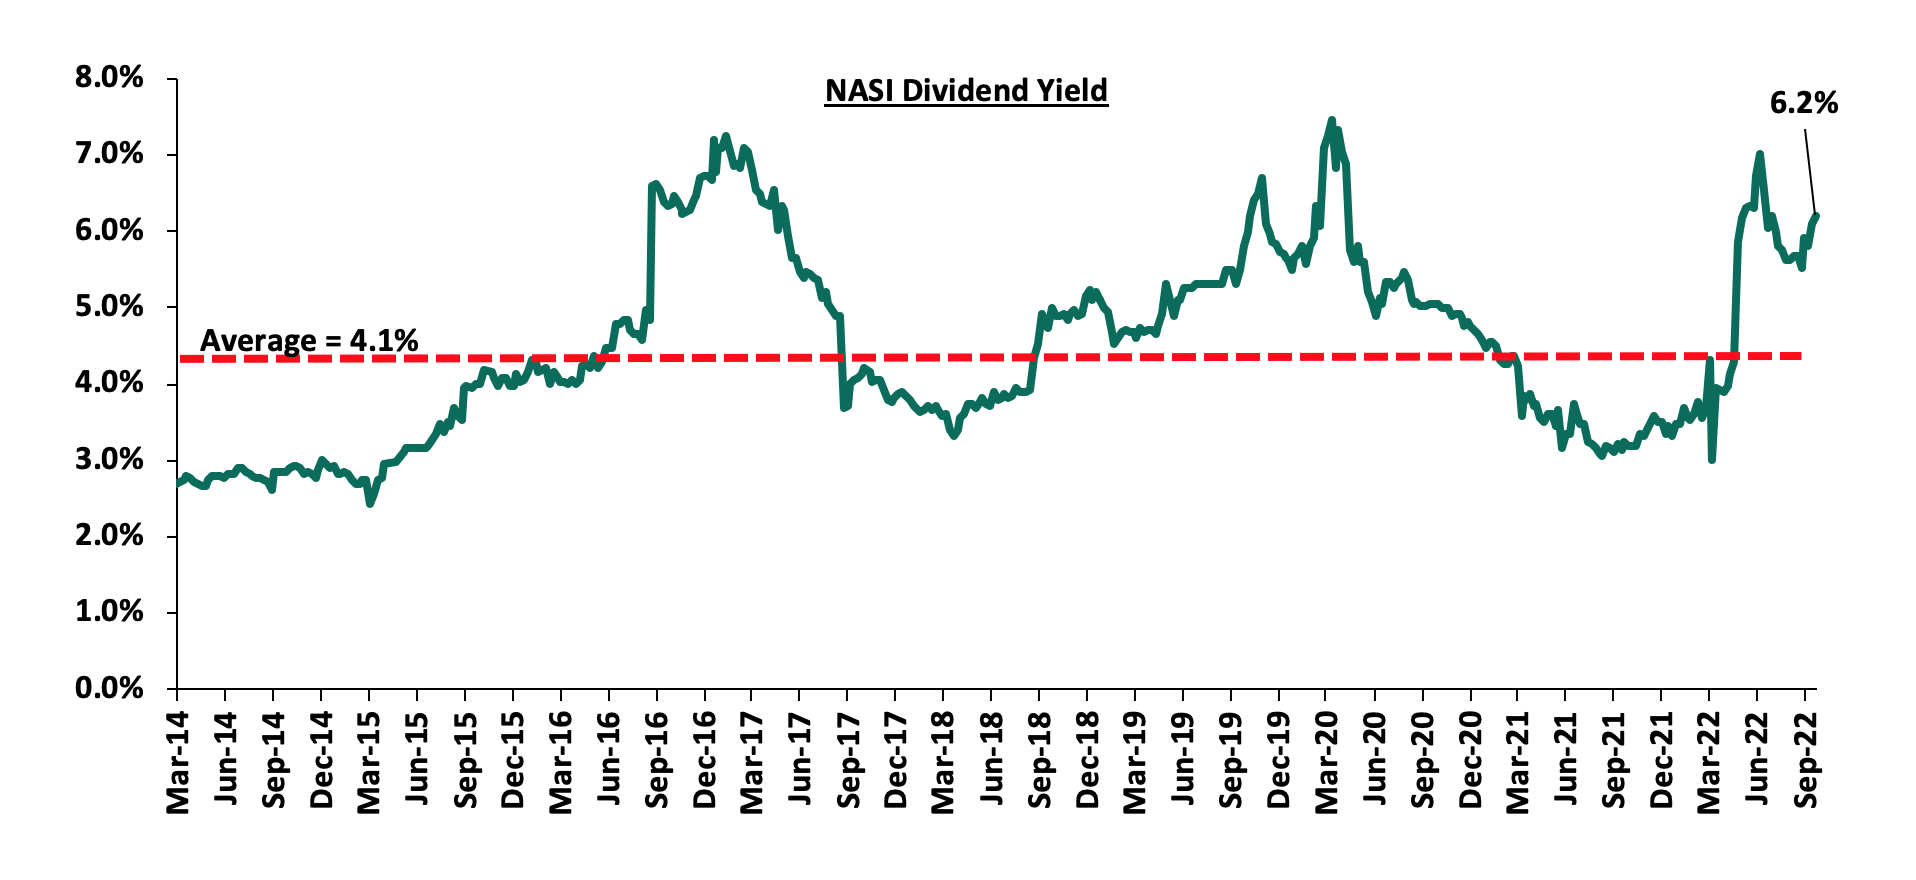
The market is currently trading at a price to earnings ratio (P/E) of 6.6x, 48.3% below the historical average of 12.7x, and a dividend yield of 6.2%, 2.1% points above the historical average of 4.1%. Key to note, NASI’s PEG ratio currently stands at 0.8x, an indication that the market is undervalued relative to its future growth. A PEG ratio greater than 1.0x indicates the market may be overvalued while a PEG ratio less than 1.0x indicates that the market is undervalued.
The charts below indicate the historical P/E and dividend yields of the market;
Weekly Highlights:
- Q2’2022 Insurance Industry Report
During the week, the Insurance Regulatory Authority of Kenya (IRA) released the Quarterly Insurance Industry Report for the period ending 30th June 2022 highlighting that the industry’s profits after tax declined by 40.0% to Kshs 3.5 bn, from Kshs 5.8 bn recorded in Q2’2021. The decline in profits was mainly driven by a 17.1% increase in benefits paid in the long term insurance segment to Kshs 46.1 bn in Q2’2022 from Kshs 39.4 bn in Q1’2021 coupled with a 14.5% increase in claims incurred in the general business segment to Kshs 37.0 bn in Q2’2022, from Kshs 32.4 bn in Q2’2021. Additionally, management expenses increased by 6.3% to Kshs 23.1 bn, from Kshs 21.7 bn in Q2’2021. The industry’s gross premiums grew by 13.2% y/y to Kshs 163.1 bn in Q2’2022, from Kshs 144.0 bn recorded in Q2’2021, with the general insurance business contributing 56.7% of the industry’s premium income, a 2.6% points decline from the 59.3% contribution witnessed in Q2’2021. The general insurance business, however, continues to report underwriting losses, attributed to the increase in loss ratios as the net claims outpaced net premiums at 14.5% against 12.3% growth respectively.
Other key take-outs from the report include:
- Investment income declined by 37.0% to Kshs 16.6 bn in Q2’2022, from Kshs 26.3 bn recorded in Q2’2021 for long term insurance businesses, and also declined by 26.5% for general insurance businesses to Kshs 4.6 bn, from Kshs 6.3 bn recorded in Q2’2021. The declines are attributed to fair value losses on quoted equity investments in the capital market as evidenced by the declines in the NASI, NSE 25 and NSE 20 which posted losses of 25.2%, 21.0% and 15.2%, respectively, at the end of Q2’2022,
- The net claims for the long term insurance business increased by 4.7% to Kshs 41.3 bn, from Kshs 39.4 bn in Q2’2021, mainly driven by requests from individuals wishing to access their pension benefits given the reduction in their disposable income. On the other hand, net premium income for the long term business grew by 8.2% to Kshs 64.3 bn in Q2’2022, from Kshs 54.7 bn in Q2’2021,
- Net claims for the general business increased by 14.5% to Kshs 37.0 bn, from Kshs 32.4 bn in Q2’2022, driven by a 44.4% growth in medical claims to Kshs 15.5 bn in Q2’2022, from Kshs 12.0 bn in Q2’2022. Contrastingly, net premiums increased by 12.3% to Kshs 54.4 bn, from Kshs 48.5 bn in Q2’2021,
- The loss ratio for the long term business declined by 8.0% points to 64.2%, from 72.2% recorded in Q2’2021 on the back of a 17.8% increase in net premiums relative to a 4.7% increase in net claims in Q2’2022. Notably, the loss ratio for the general insurance businesses increased to 68.1% in Q2’2022, from 66.8% in Q2’2021 owing to a 14.5% growth in claims incurred that outpaced the 12.3% growth in the net earned premium income,
- The combined ratio for general insurance business declined by 4.7% points to 102.7% in Q2’2022, from 107.4% recorded in Q2'2021 but 0.8% points higher than the 101.9% recorded in Q1'2022. The increase in the combined ratio was mainly attributable to the increase in claims ratio, having increased by 1.3% points to 68.1% in Q2'2022, from 66.8% in Q1'2021, coupled with a 0.5% points increase in commissions expense ratio to 7.0%, from 6.5% in Q2’2021,
- General insurance businesses recorded an underwriting loss of Kshs 1.49 bn in Q2’2022 a 2.1% decline from Kshs 1.46 bn recorded in Q2’2021. The decline in underwriting performance was driven by a 14.5% increase in net claims incurred to Kshs 37.0 bn, from Kshs 32.4 bn in Q2’2021 against a relatively lower 12.3% increase in net premiums earned to Kshs 54.4 bn, from Kshs 48.5bn recorded in Q2’2021. Key to note, workmen’s compensation class made the highest underwriting profit of Kshs 1.5 bn during the quarter while motor private and medical classes of general insurance business incurred the highest losses of Kshs 2.4 bn and Kshs 0.9 bn respectively.
The insurance sector continues to suffer from perennial problems such as low insurance penetration at 2.3% at the end of 2021, as compared to a global average of 7.0%. This is mainly driven by the fact that insurance is perceived to be a luxury good, coupled with low disposable income among the Kenyan population. As such, we expect the insurance sector players and regulators to up consumer education on benefits of insurance and to come up with innovative products to cater for all income levels. It is also key to note that the insurance core business still remains unprofitable as evidenced by a 68.1% loss ratio and a further 34.6% expense ratio in the general insurance business. As a result, the combined ratio of 102.7% in Q2’2022 for the General insurance translated to an underwriting loss of Kshs 1.5 bn.
We will be releasing our H1’2022 Insurance Report on 16th October 2022.
- Safaricom’s Expansion into Ethiopia
During the week, Safaricom Group Plc announced the official launch of Safaricom Telecommunications Ethiopia (STE), an international consortium that will offer telecommunication services in Ethiopia. The official launch and roll out of services in Addis Ababa comes after the Safaricom-led consortium won the licensing bid valued at Kshs 91.6 bn (USD 800.0 mn) in 2021. The joint venture is co-owned by Safaricom, Sumitomo Corporation (Japan), CDC Group (UK), and Vodacom with stakes of 55.7%, 27.2%, 10.9%, and 6.2%, respectively. The telecommunication license allows STE to offer 2G, 3G, and 4G network coverage, coupled with voice and SMS services, with an operating period of 15 years. Safaricom is further expected to be formally granted a mobile money transfer license that will allow it to roll out M-pesa services in Ethiopia.
In our view, the Ethiopian expansion is an ideal opportunity for Safaricom to tap into Africa’s second most populated nation after Nigeria, with a population of 117.9 mn according to World Bank data, and 50.7 mn mobile subscribers. Further, the country presents an untapped market for internet connectivity, with 66.0% of the population being covered by mobile network but do not have mobile internet access. In the short-term, we expect the venture to contribute positively to revenue growth, which came in at Kshs 298.1 bn as at 31st March 2022, a 13.0% growth from the Kshs 261.5 bn recorded as at 31st March 2021. In the long term, we expect the venture to contribute to bottom-line growth and subsequent increased returns to shareholders, with the Profits after Tax in FY’2022 coming in at Kshs 67.5 bn, a 1.7% decline from the Kshs 68.7 bn recorded in FY’2021. Further, we expect the official launch to increase investor sentiments on the stock that currently controls 51.3% of the Nairobi Securities Exchange main index NASI, and has recorded a 35.1% Year to date decline to Kshs 24.8 per share as at 7th October 2022.
Universe of coverage:
|
Company |
Price as at 30/09/2022 |
Price as at 07/10/2022 |
w/w change |
YTD Change |
Target Price* |
Dividend Yield |
Upside/ Downside** |
P/TBv Multiple |
Recommendation |
|
Kenya Reinsurance |
2.0 |
2.0 |
0.0% |
(13.5%) |
3.2 |
5.1% |
65.6% |
0.2x |
Buy |
|
Sanlam |
9.9 |
9.9 |
0.0% |
(13.9%) |
15.9 |
0.0% |
60.0% |
1.0x |
Buy |
|
Jubilee Holdings |
245.0 |
240.0 |
(2.0%) |
(24.2%) |
379.4 |
0.4% |
58.5% |
0.4x |
Buy |
|
Liberty Holdings |
5.8 |
5.2 |
(10.7%) |
(26.6%) |
7.8 |
0.0% |
50.6% |
0.4x |
Buy |
|
Equity Group*** |
46.5 |
44.5 |
(4.2%) |
(15.6%) |
62.2 |
6.7% |
46.6% |
1.0x |
Buy |
|
KCB Group*** |
41.5 |
39.6 |
(4.5%) |
(13.1%) |
53.5 |
7.6% |
42.7% |
0.7x |
Buy |
|
Co-op Bank*** |
11.9 |
11.9 |
0.0% |
(8.8%) |
15.6 |
8.4% |
40.1% |
0.7x |
Buy |
|
ABSA Bank*** |
11.5 |
11.0 |
(4.4%) |
(6.8%) |
14.9 |
1.8% |
37.9% |
0.9x |
Buy |
|
Britam |
6.0 |
5.9 |
(1.7%) |
(22.5%) |
7.7 |
0.0% |
31.4% |
1.0x |
Buy |
|
I&M Group*** |
17.0 |
16.9 |
(0.6%) |
(21.0%) |
20.5 |
8.9% |
30.4% |
0.4x |
Buy |
|
Diamond Trust Bank*** |
50.0 |
49.4 |
(1.2%) |
(17.0%) |
59.5 |
6.1% |
26.5% |
0.2x |
Buy |
|
Standard Chartered*** |
136.8 |
134.8 |
(1.5%) |
3.7% |
155.0 |
10.4% |
25.4% |
0.9x |
Buy |
|
NCBA*** |
30.3 |
32.0 |
5.4% |
25.5% |
35.2 |
6.3% |
16.3% |
0.7x |
Accumulate |
|
Stanbic Holdings |
100.0 |
97.0 |
(3.0%) |
11.5% |
99.9 |
9.3% |
12.3% |
0.8x |
Accumulate |
|
HF Group |
3.4 |
3.3 |
(1.8%) |
(12.6%) |
3.6 |
0.0% |
7.8% |
0.2x |
Hold |
|
CIC Group |
2.0 |
2.0 |
(0.5%) |
(7.8%) |
2.1 |
0.0% |
5.0% |
0.7x |
Hold |
|
Target Price as per Cytonn Analyst estimates **Upside/ (Downside) is adjusted for Dividend Yield ***For Disclosure, these are stocks in which Cytonn and/or its affiliates are invested in |
|||||||||
We are “Neutral” on the Equities markets in the short term due to the current adverse operating environment and huge foreign investor outflows, and, “Bullish” in the long term due to current cheap valuations and expected global and local economic recovery.
With the market currently trading at a discount to its future growth (PEG Ratio at 0.8x), we believe that investors should reposition towards value stocks with strong earnings growth and that are trading at discounts to their intrinsic value. We expect the current high foreign investors sell-offs to continue weighing down the economic outlook in the short term.
- Residential Sector
- President Ruto Floats a Mortgage Plan to Allow Tenants Own Homes After 20 years
During the week, President William Ruto floated a mortgage plan that will allow tenants to own homes under the social housing tenant purchase scheme, and, affordable housing initiative, through monthly rental payments. The mortgage scheme entails tenants paying their monthly rents as the mortgage repayments for a period of up to 20 years upon which, ownership of a unit is given to the tenant. The government is targeting the ongoing Mukuru Kwa Jenga project which comprises of 15,000 units with undisclosed plinth areas and number of units per typology in order to implement its strategy, with the rents beginning from as low as Kshs 3,000 per month for the tenant purchase scheme as highlighted below;
|
All prices are in Kshs unless stated otherwise |
|||
|
Cytonn Report: Monthly Rent Payments in Kshs per month |
|||
|
Scheme |
Bedsitters |
1 Bedroom |
2 Bedroom |
|
Social Housing Tenant Purchase |
3,000 |
5,000 |
6,500 |
|
Affordable Housing |
- |
6,600 |
10,000 |
Despite this, many details remain unknown such as; i) Is there interest on the mortgages? ii) What is the sustainable funding model for the housing projects?, and, iii) How will the units be allocated once complete? However once successful, the initiative is expected to provide affordable and quality homes to residents, as well as access to descent amenities and infrastructure. This is in addition to helping curb Kenya’s housing deficit which currently stands at 2.0 mn units, and growing by 200,000 annually. Moreover, the move by the government is expected to boost the overall mortgage loan accounts which recorded a 0.9% decline to 26,723 in 2021, from 26,971 recorded in 2020. This was driven by the increasing property prices resulting from the rising construction costs, and interest rates, which in turn makes it costly for majority of Kenyans to take up mortgages as depicted below;

Source: Central Bank of Kenya
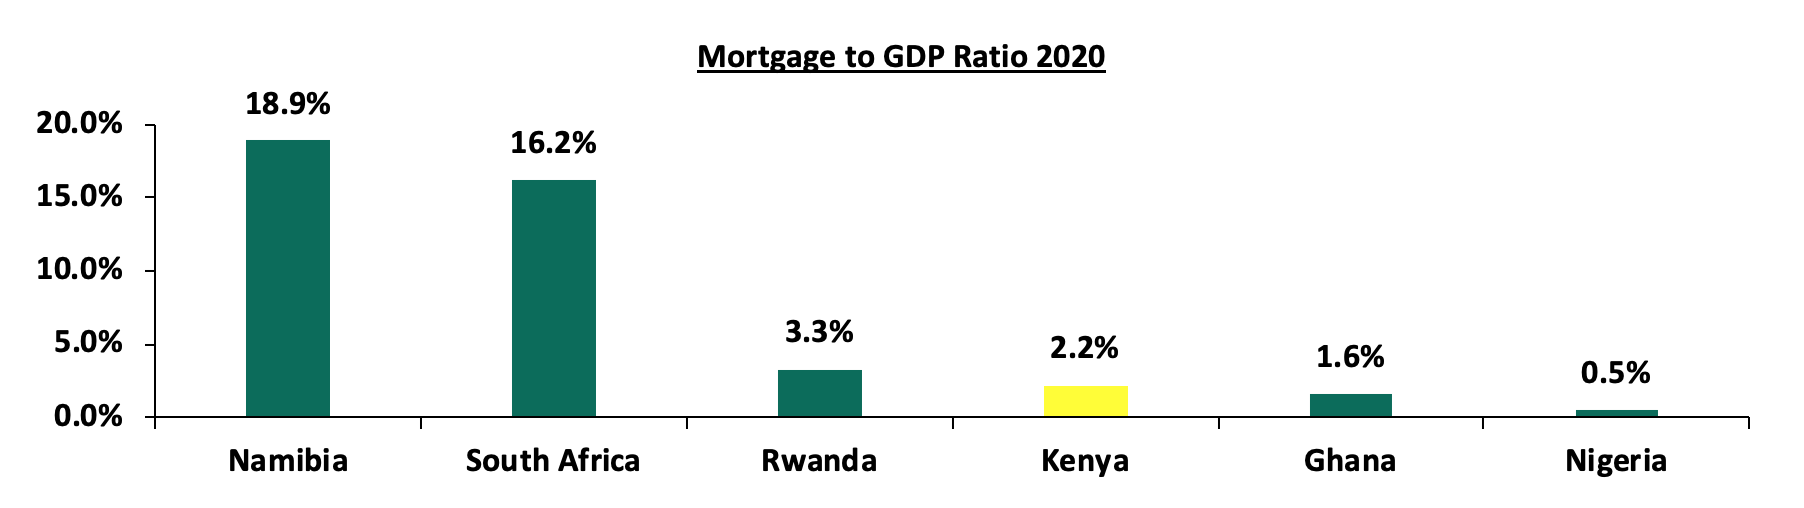
Given the above, Kenya’s mortgage to GDP ratio stands at 2.2%, lower than other comparable countries such as Namibia and South Africa at 18.9% and 16.2%, respectively, as shown below;
Source: Centre for Affordable Housing Africa
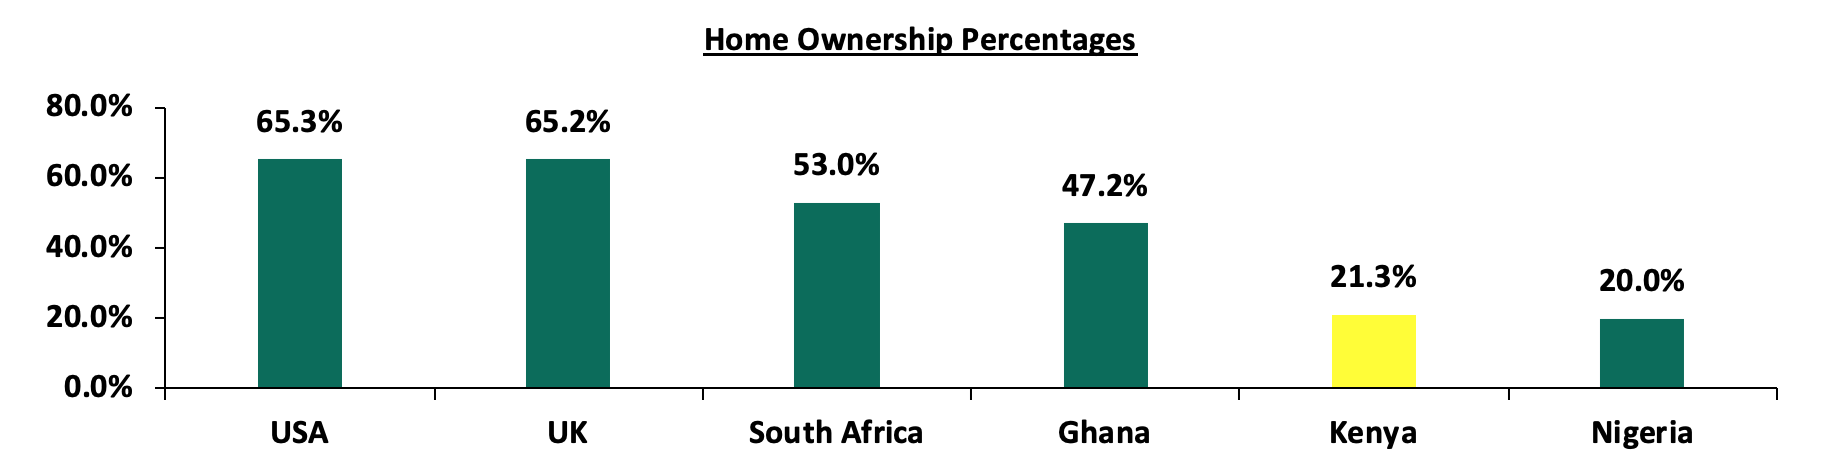
In spite of this, the government’s move is expected to boost home ownership rates in the country which currently stand at 21.3% in urban areas as at 2020, compared to other African countries such as South Africa and Ghana at 53.0% and 47.2%, respectively, as shown below;
Source: Centre for Affordable Housing Africa
- President Ruto Announces Plans to Commission an affordable housing Project in Homa Bay
Also during the week, President William Ruto announced plans to commission an affordable housing project consisting of 5,000 units in Homa Bay County with a start date of November 2022. The project will be constructed in phases, with the first phase targeting 400 units; while the second phase will comprise of 2,000 units and delivered by the end of 2023. The rest of the housing units will be delivered in subsequent phases until completion of the project. Upon completion, the project is expected to;
- Provide houses at low costs, hence affordable to residents from the targeted area,
- Improve the living standards of residents by providing them with decent housing,
- Help curb Kenya’s housing deficit, and,
- Boost the low home ownership rate in Kenya.
Ruto’s decision comes at a time when affordable housing continues to gain traction in the country, further boosted by the current government having embraced the initiative in a bid to reduce the national housing deficit, by delivering approximately 250,000 units on an annual basis. Some of the affordable housing projects in the pipeline include; i) Mukuru Kwa Jenga housing project, ii) Kitui housing project, iii) Pangani housing project, and, iv) Starehe housing project, among many others. We expect a similar trend to continue shaping the performance of the sector, while also improving the living standards of various citizens in the country. However, inadequate funding for the projects continues to pose a major challenge in their delivery thus weighing on the optimum performance of the initiative. For their performance to improve, we believe that the government needs to set clear strategies on how to implement the plan as well as provide adequate and sufficient information to investors and tenants.
To shed more light on the segment, we shall cover a topical on the feasibility of Kenya’s affordable housing initiative in the coming weeks.
- Infrastructure
During the week, President William Ruto also announced plans to complete the construction of over 200.0 km of roads covering Homa Bay County and its environs. The roads include; Mbita-Kiabuya-Magunga-Sori road, Kanyadhiang’-Pala-Kandiege-Kadel road, and, the Karabok-Adiedo road. Construction of the aforementioned projects have been stalling owing to inadequate financing, but once completed they are expected to spur Homa Bay’s Real Estate sector performance through;
- Improved returns on the back of increased property investments and prices,
- Reduced costs of development hence promoting property investments, and,
- Enhanced accessibility.
The government continues to undertake various infrastructure projects aimed at boosting the economy’s performance. However, given the change in regime, we expect the implementation to take a slower pace as transport infrastructure is not a top priority when compared to the previous regime. Despite this, we expect that the government will initiate additional infrastructure projects within the country, guided by various factors such as; i) the launch of project partnership strategies such as PPPs and Joint Ventures (JVs), ii) issuance of infrastructure bonds meant to finance projects, and, iii) yearly budget allocations, among others.
- Real Estate Investment Trusts (REITs)
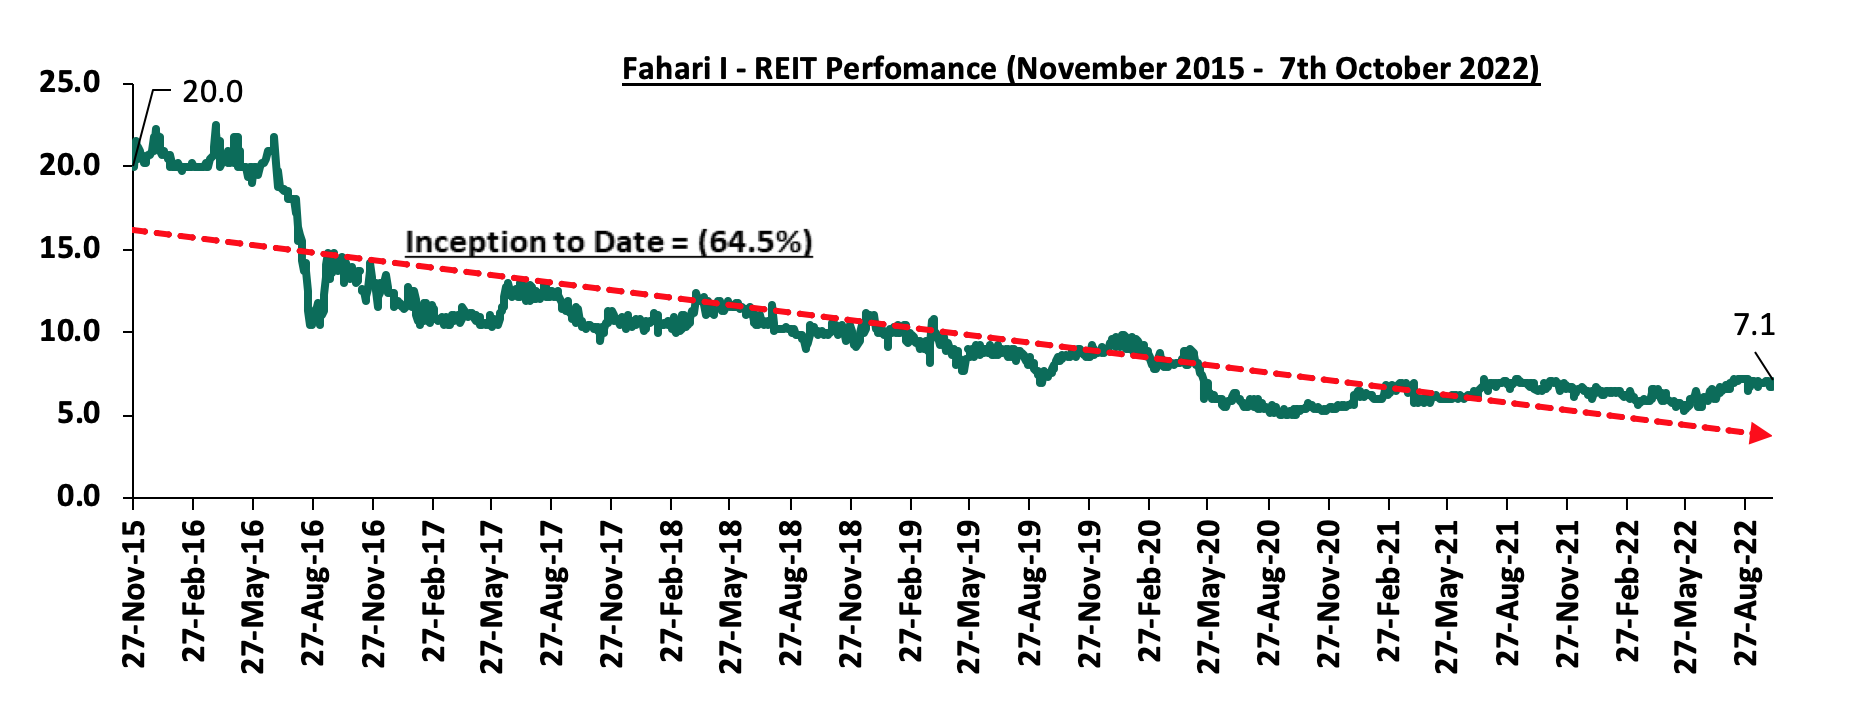
In the Nairobi Stock Exchange, ILAM Fahari I-REIT closed the week trading at an average price of Kshs 7.1 per share. The performance represented a 13.4% Year-to-Date (YTD) increase. However, the performance was a 64.5% Inception-to-Date (ITD) decline from Kshs 20.0. The graph below shows Fahari I-REIT’s performance from November 2015 to 07th October 2022:
In the Unquoted Securities Platform, Acorn D-REIT and I-REIT closed the week at Kshs 23.8 and Kshs 20.8 per unit, respectively. The performance represented a 19.0% and 4.0% gain for the D-REIT and I-REIT, respectively, from the Kshs 20.0 inception price. The volumes traded for the D-REIT and I-REIT came in at 5.5 mn and 14.5 mn shares, respectively, with a turnover of Kshs 116.9 mn and Kshs 300.3 mn, respectively, since its Inception in February 2021.
We expect the performance of Kenya’s Real Estate sector to improve as a result of the government’s efforts to increase the supply of housing, as well as providing mortgage plans which in turn will increase home ownership rates, and, the implementation of various infrastructure projects that will promote investments within the country. However, setbacks such as inadequate funding for projects, and, minimal investor appetite for REITs still pose a challenge to the optimum performance of Kenya’s property market.
Every government that takes office is concerned with policies pertaining to trade, capital flows, inflation management, the exchange rate system, economic growth, employment opportunities, and commercial policies aimed at ensuring a country's economic growth. Kenya, like any other country, aims at achieving both internal balance by promoting price stability and external balance by maintaining a balance of payment equilibrium. Key to note, Kenya’s balance of payment stood at a deficit of Kshs 120.6 bn as of Q1’2022, a 376.9% increase from a deficit of Kshs 25.3 bn in Q1’2021 mainly due to a decline in the gross official reserves which have gone into debt service. The deterioration in the balance of payment is one of the key challenges that the new administration will face hence the need to develop policies to manage it. As such, we saw it fit to focus on Kenya’s balance of payment to analyze the current state and what can be done to improve the status. We shall do this by looking into the following;
- Introduction,
- The Current State of Kenya’s Balance of Payments,
- Balance of Payments Outlook and Recommendations, and,
- Conclusion
Section I: Introduction
Balance of payments, BOP, summarizes the economic transactions made by residents of a country, such as Kenya, against the rest of the world over a specific period of time. Put simply, it’s the net amount of the money that leaves Kenya versus the money that comes into Kenya. The transactions include exports and imports of goods, financial assets and services, as well as other transfer payments which may be in form of foreign aid and grants from other governments. BOP is an essential economic indicator as it provides a summary of how resources flow between a country and its trading partners. Balance of payments divides transactions into three broad accounts; Current Account, Capital account and Financial Account;
- Current Account
The component captures transactions of exports and imports of goods and services, income receipts and payments, as well as net current transfers. Categorically, the current account has three components, as explained below;
- Trade balance – Refers to the value of goods and services that Kenyan residents export less those that they import,
- Primary income balance – Refers to the income that Kenyan residents earn from the rest of the world from working and also financial investments, less what they pay, and,
- Secondary income balance – Refers to the income that Kenyan residents earn from the rest of the world through the government, less what they pay. It also consists of current transfers between residents and non-residents that directly affect the level of gross national disposable income and thus influence the economy’s ability to consume goods and services.
- Capital Account
The capital account records two main types of transactions; capital transfers and acquisition of non-produced, non-financial assets;
- Capital transfers – Refers to transactions where a party has transferred ownership of something to another party without receiving anything in return such as forgiveness of debt and conditional grants for capital projects, and
- Acquisition/disposal of non-produced, non-financial assets – Involves transactions of intangible assets such as brand names and trademarks and rights to use land resources for various economic activities.
- Financial Account
The financial account component records transactions between parties that involve a change of ownership of assets or liabilities and is structured according to different classes of investments such as direct investments, portfolio investment, financial derivative, among others.
Section II: The Current State of Kenya’s Balance of Payments
Here, we shall analyze the individual components of Kenya’s balance of payments, its evolution as well as its overall performance.
- Components of Balance of Payments
- Current Account Balance
Kenya’s current account deficit narrowed by 39.7% in Q1’2022 to Kshs 95.0 bn, from Kshs 157.5 bn recorded in Q1’2021 despite an 18.5% expansion in the merchandise trade deficit to Kshs 333.4 bn in Q1’2022, from Kshs 281.4 bn in Q1’2021. The narrowing of the this was driven by;
- A 19.2% increase in the secondary income balance to Kshs 184.1 bn, from Kshs 154.5 bn in Q1’2021, and,
- A 783.0% increase in Service Trade Balance in Q1’2022 to a surplus of Kshs 98.9 bn, from a surplus Kshs 11.2 bn in Q1’2021 mainly driven by the increase in travel and transport services receipts following resumption of international travel after all of the restriction measures were lifted.
The table below shows the breakdown of the various current account components, comparing Q1’2021 and Q1’2022:
|
Cytonn Report: Q1’2022 Current Account Balance |
|||
|
Item |
Q1’2021 |
Q1’2022 |
% Change |
|
Merchandise Trade Balance |
(281.4) |
(333.4) |
18.5% |
|
Service Trade Balance |
11.2 |
98.9 |
783.0% |
|
Primary Income Balance |
(41.7) |
(44.6) |
6.9% |
|
Secondary Income (Transfers) Balance |
154.5 |
184.1 |
19.2% |
|
Current Account Balance |
(157.5) |
(95.0) |
(39.7%) |
Source: Kenya National Bureau of Statistics (KNBS), All values in Kshs bns
We note that, over the last ten years, the current account balance has been running deficits an indication that Kenya relies more on the outside world for its goods and services. The current account as a percentage of GDP was estimated at 5.2% in the 12 months to August 2022. For 2022, the current account deficit is projected at 5.9% of GDP mainly supported by a rebound in horticulture and tea exports as well as increased inflows of remittances. The chart below shows the current account deficit over the last 10 years;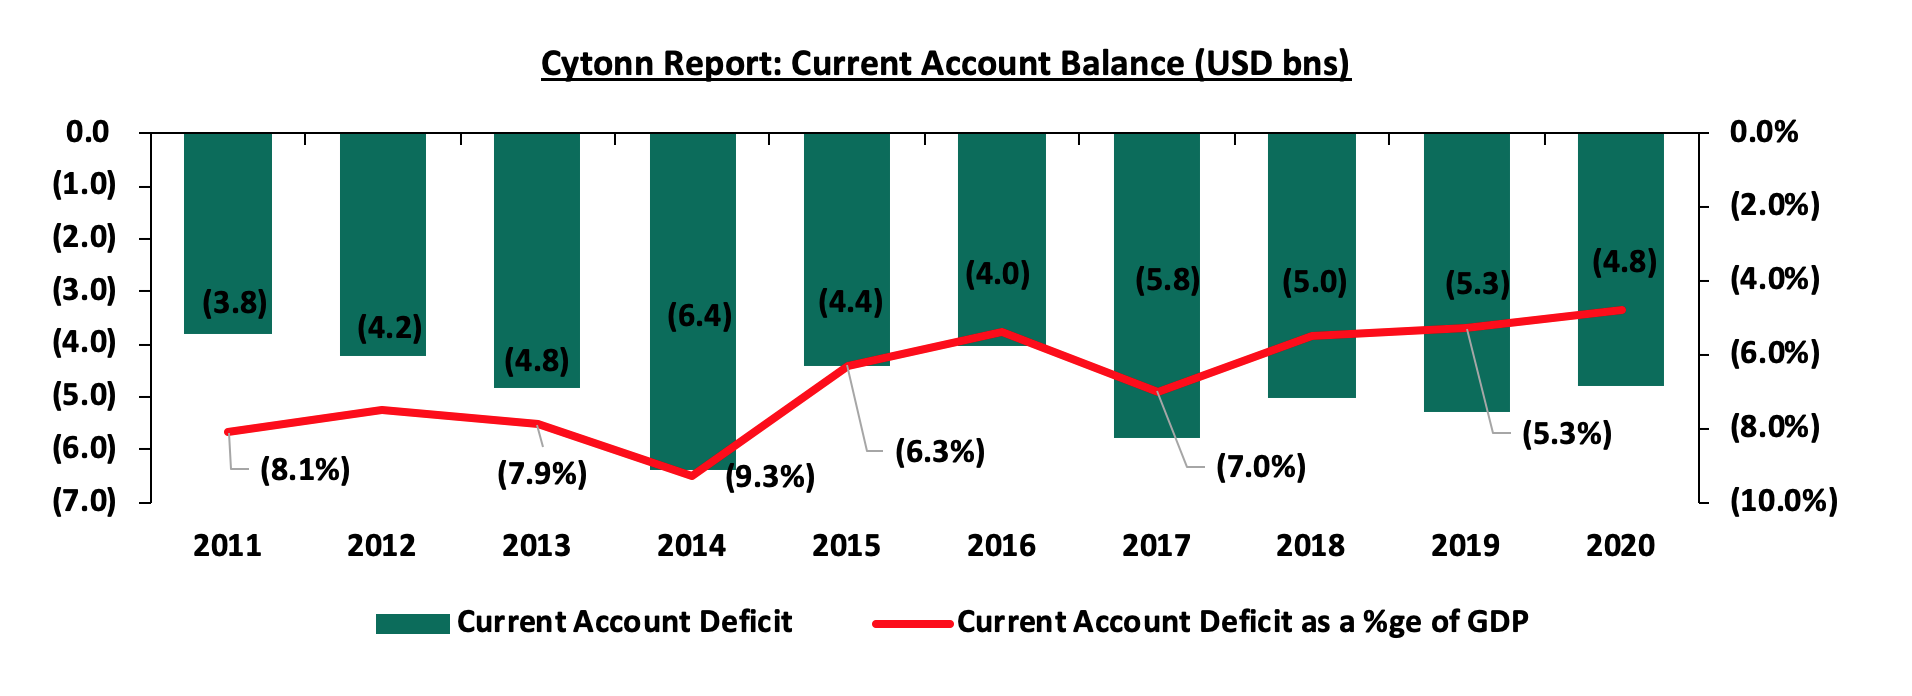
Source: World Bank Data
- Financial Account and Capital Account
The financial account balance is the difference between the foreign assets purchased by domestic buyers and the domestic assets purchased by the foreign buyers and they end up affecting the capital account of the country. It looks more on the financing and investments part of the country form outsiders. In Q1’2022, the financial account declined by 14.0% to a surplus of Kshs 92.2 bn, from a surplus of Kshs 107.3 bn in Q1’2021. Key to note, a surplus of the financial account indicates that there are more investments funds flowing into the country than flowing out. The chart below shows the trend in the financial account over the last ten years;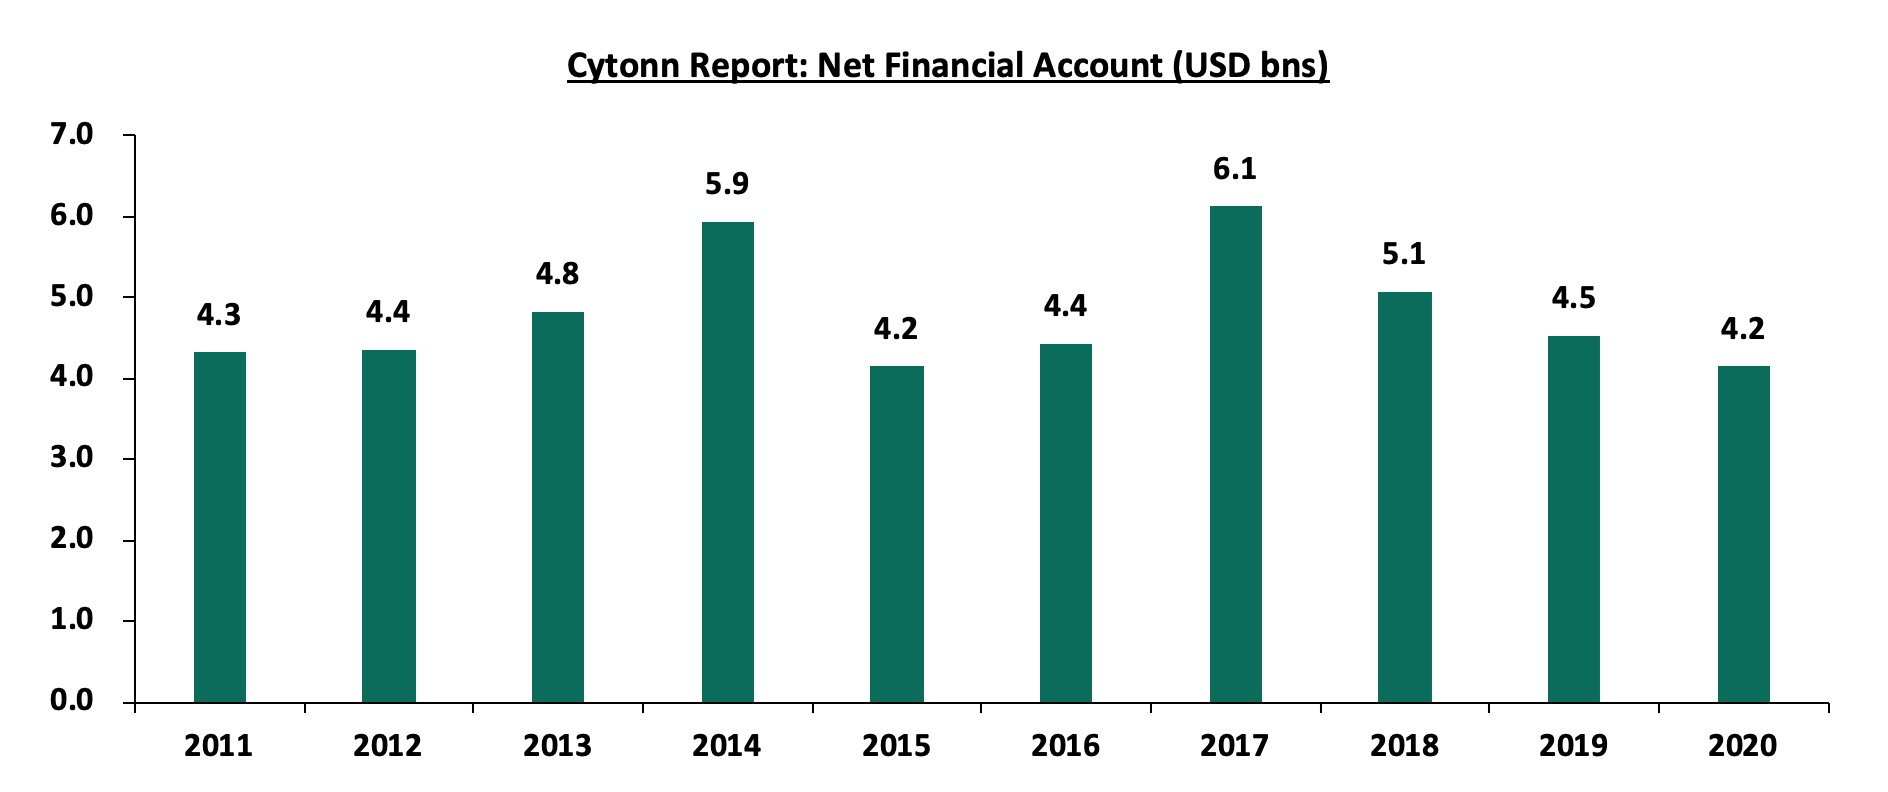
Source: World Bank Data
On the other hand, the capital account balance recorded a 7.6% decline to Kshs 7.4 bn from Kshs 8.0 bn in Q1’2021. Key to note, the account has been declining at a 10-year CAGR of 5.8% to USD 131.7 mn in 2020 from USD 240.2 mn in 2010. The declining capital account is partly attributable to capital flight in the country with many direct foreign investors not reinvesting in the country. Below is a chart highlighting the movement of the capital account over the last 10 years;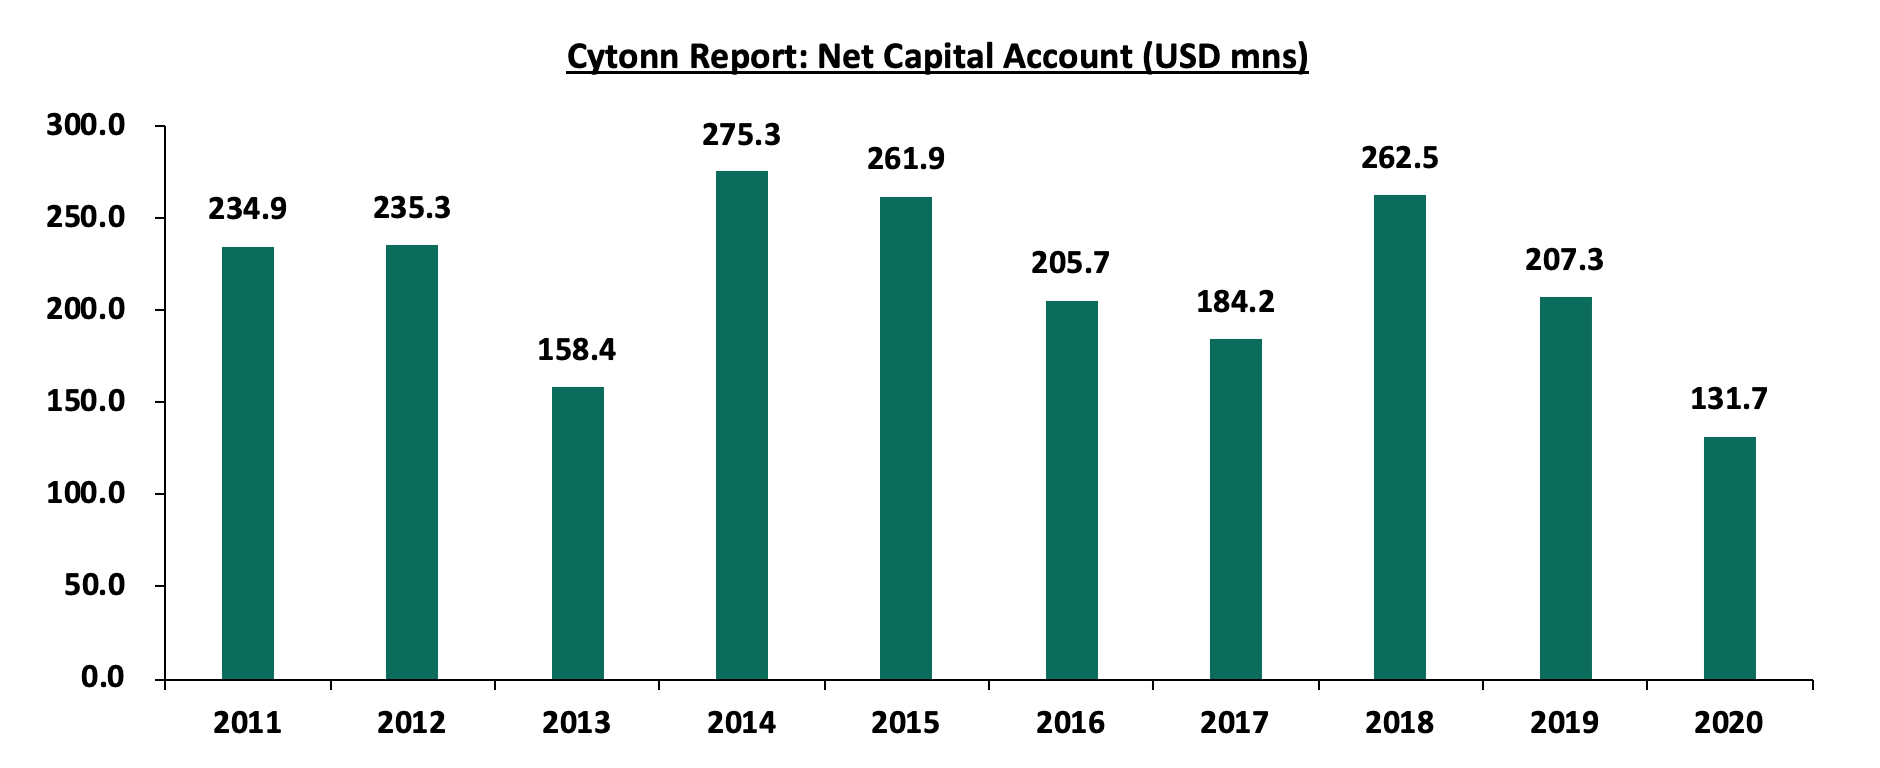
Source: World Bank Data
- Evolution of Balance of Payments
Kenya’s overall balance of payments has been fluctuating over time, standing at a deficit of Kshs 120.6 bn in Q1’2022, attributable to the running current account deficit and the high debt servicing. The performance has been mainly supported by the financial account, which has accumulated a surplus over the years. The current account deterioration can be attributable to faster growth in the merchandise import bill compared to merchandise exports due to the increased fuel costs and the lower exports. It is important to note that the deterioration in trade terms contributes to an excess of import bills over export earnings as Kenya has remained a net importer of food, fuel and other raw materials. Below is a graph highlighting the trend in the Kenya’s balance of payments over the last eight years;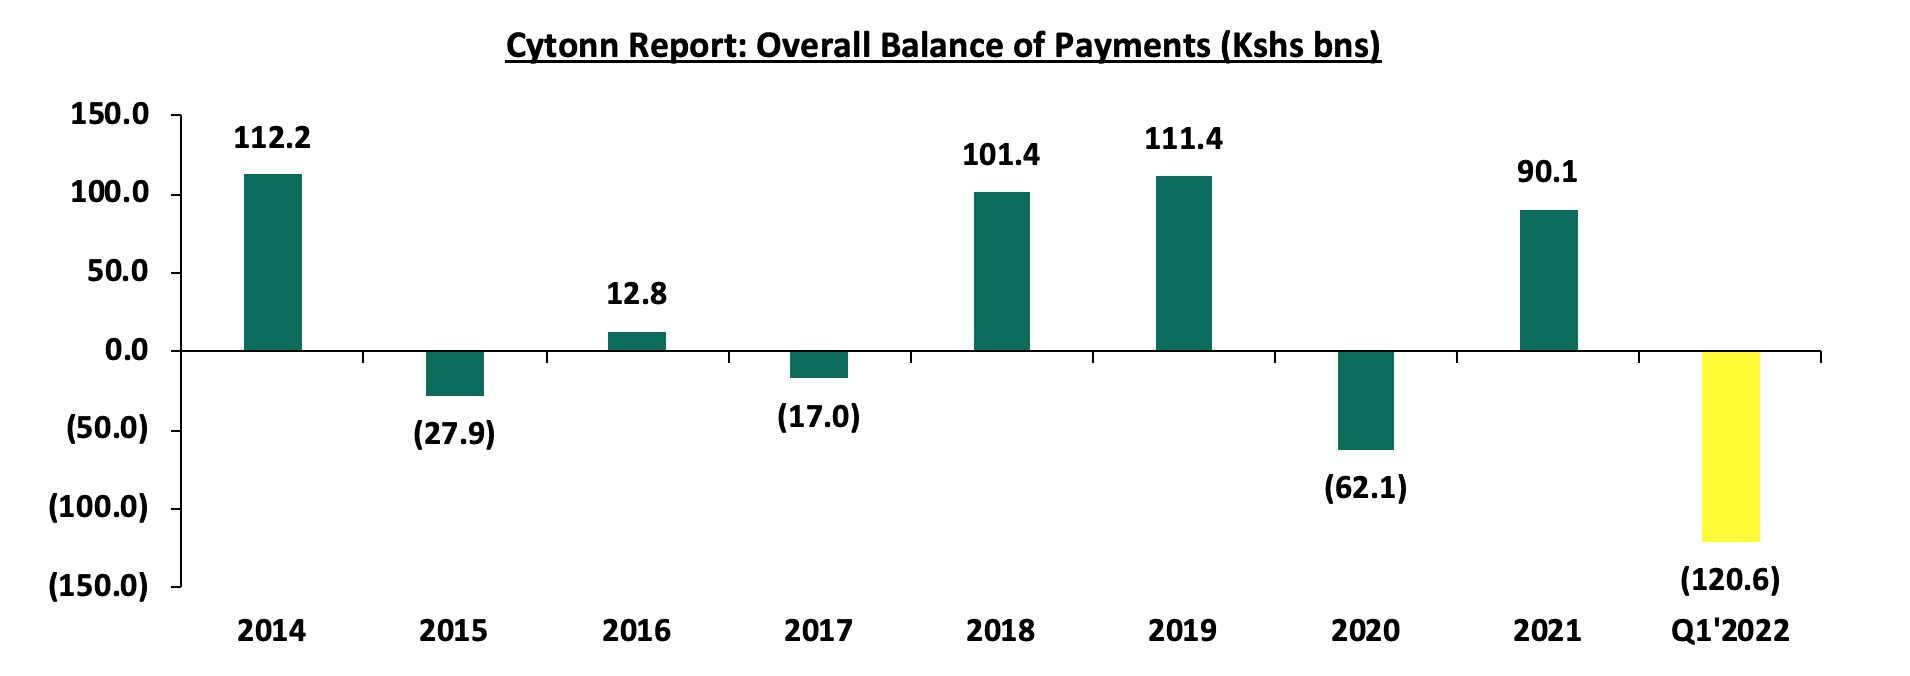
Source: Kenya National Bureau of Statistics (KNBS)
Key take-outs from the chart include;
- In 2021, the balance of payment ended the year at a surplus of Kshs 90.1 bn primarily due to increased capital flows from the rest of the world as the global economy recovered from the pandemic, and,
- Q1’2021 recorded a deficit of Kshs 120.6 bn, a 376.9% increase from a Kshs 25.3 bn deficit in Q1’2021 mainly due to increased drawdowns in the official reserves to service external debt. This was further exacerbated by the depreciation of the Kenyan shilling against the US dollar given that with 57.0% of external debt having been denominated in US dollars as at the end of Q1’2022.
Going forward, we expect the balance of payments to deteriorate further as the local currency continues to depreciate and prices of commodities continue to increase and our exports remains lower. The services earnings will however create a caution due to recovery in the tourism sector.
- Performance Measurements of Balance of Payments
Balance of payments is influenced by a number of factors which include;
- Exports and Imports
Exports are goods and services that are produced domestically, but then sold to consumers residing in other countries. Exports lead to an inflow of funds to the country since the transactions involve selling domestic goods and services to foreigners. Imports on the other hand are goods and services purchased from the rest of the world by residents of a country rather than domestically produced items.
Over the last ten years, imports have been generally more than the exports and they continue to grow at a faster pace than the exports. This continues to be one of the key challenges. The chart below shows the total imports and exports over the last ten years;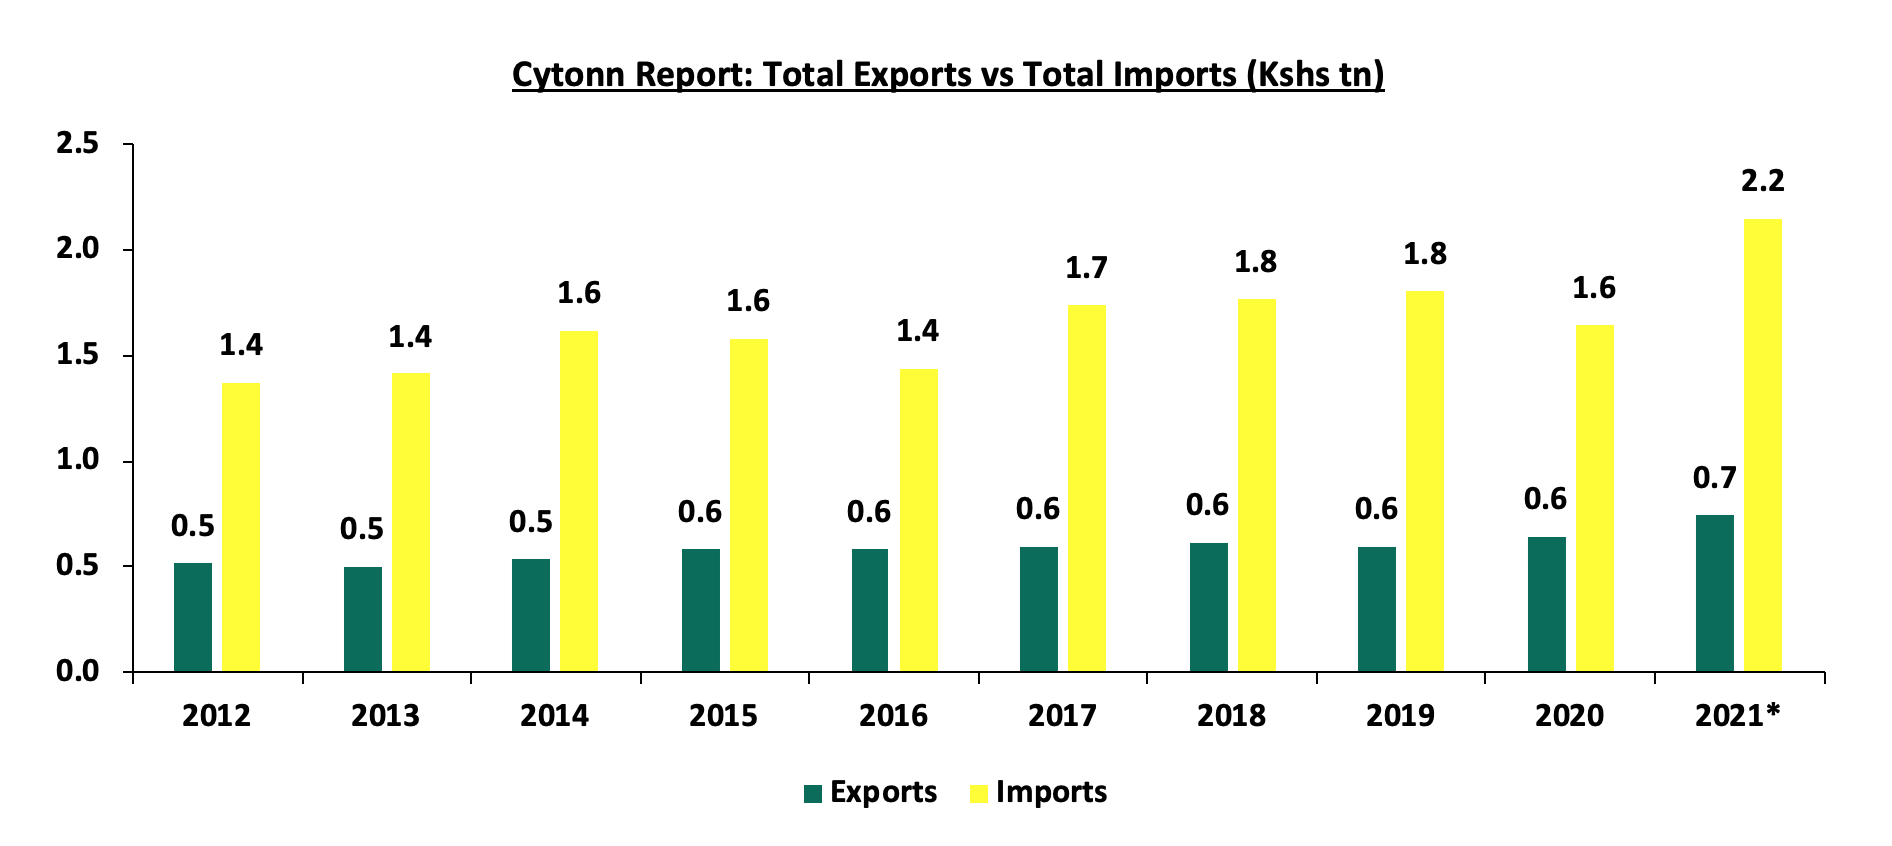
Source: KNBS, *Provisional figures
- Foreign Direct Investments
A Foreign direct investment (FDI) is an investment from a party in one country into a business or corporation in another country with the intention of establishing a lasting interest. Key to note, Kenya has seen a gradual slowdown in FDI despite the improving ease of doing business. The inflows declined by 35.2% to USD 0.5 bn (Kshs 50.7 bn) in 2021, from USD 0.7 bn (Kshs 78.3 bn) in 2020 mainly due to the uncertainties that surrounded the electioneering period coupled with the tough economic environment occasioned by the pandemic. FDIs help with economic growth as it supports businesses and the government. The chart below shows the FDI inflows over the last ten years;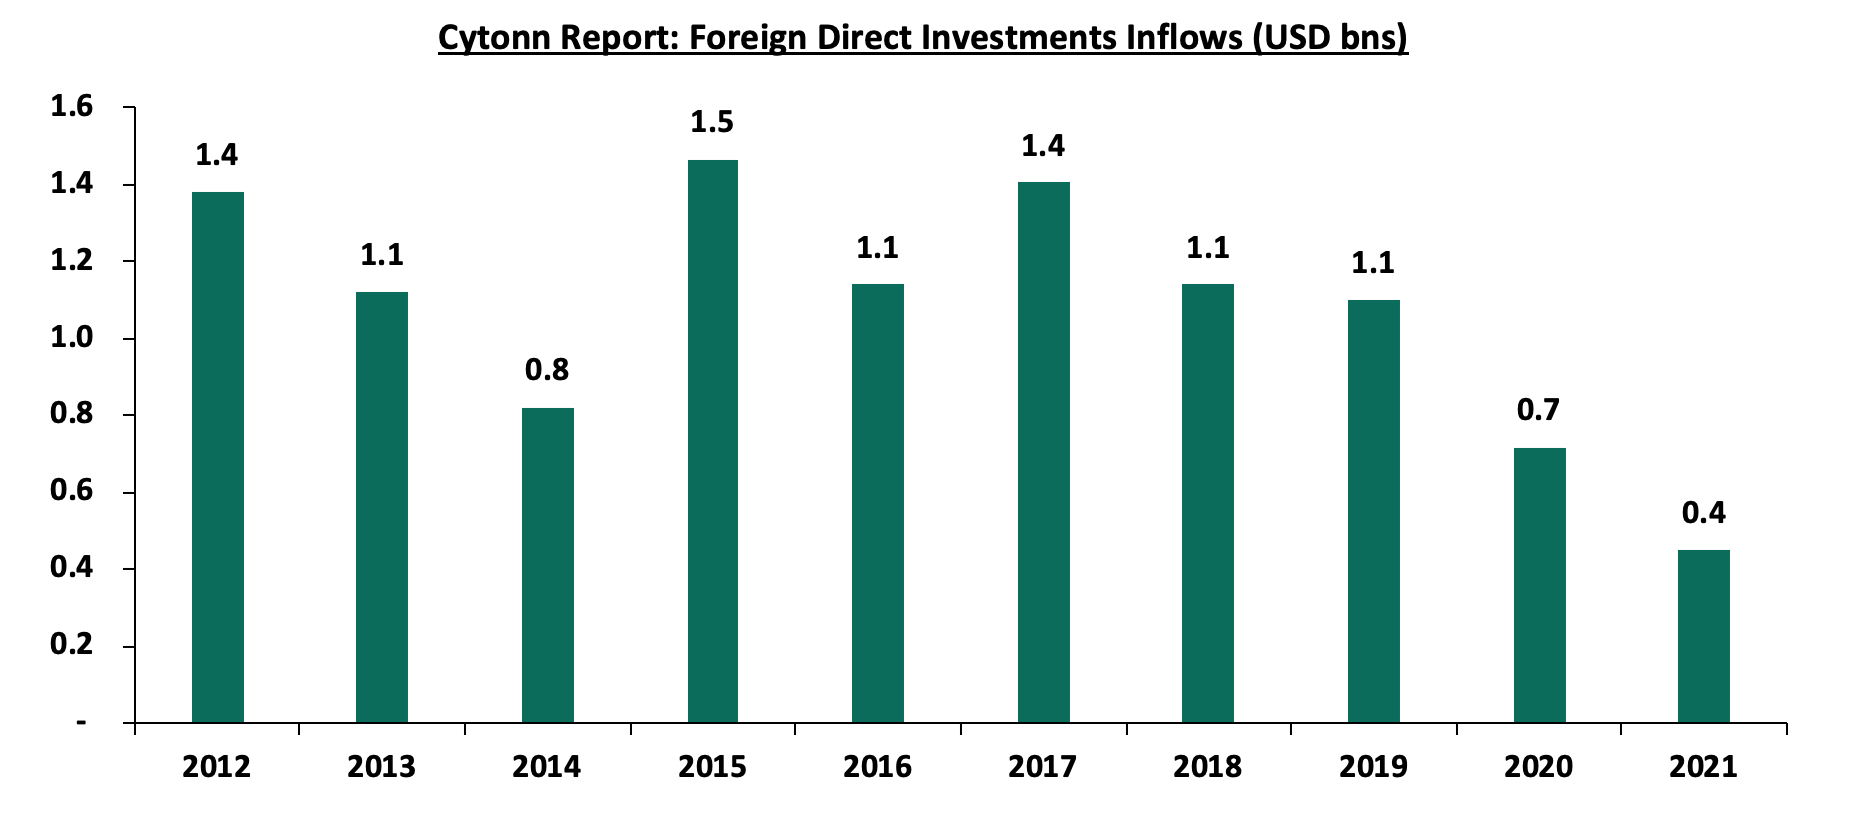
Source: UNCTAD World Investments Report
- Debt
Kenya’s debt stock has continued to increase over the years mainly due to a widening fiscal deficit coupled with increased debt servicing costs. Key to note, the country’s debt stood at Kshs 8.6 tn as of July 2022, equivalent to 68.1% of GDP and 18.1% points above the IMF recommended threshold of 50.0% for developing nations. The increased debt burden has consequently led to a decline in the gross reserves as it necessitates a draw down in the reserves, leading to the deterioration of the balance of payments. The graph below shows the debt servicing costs over the last ten fiscal years: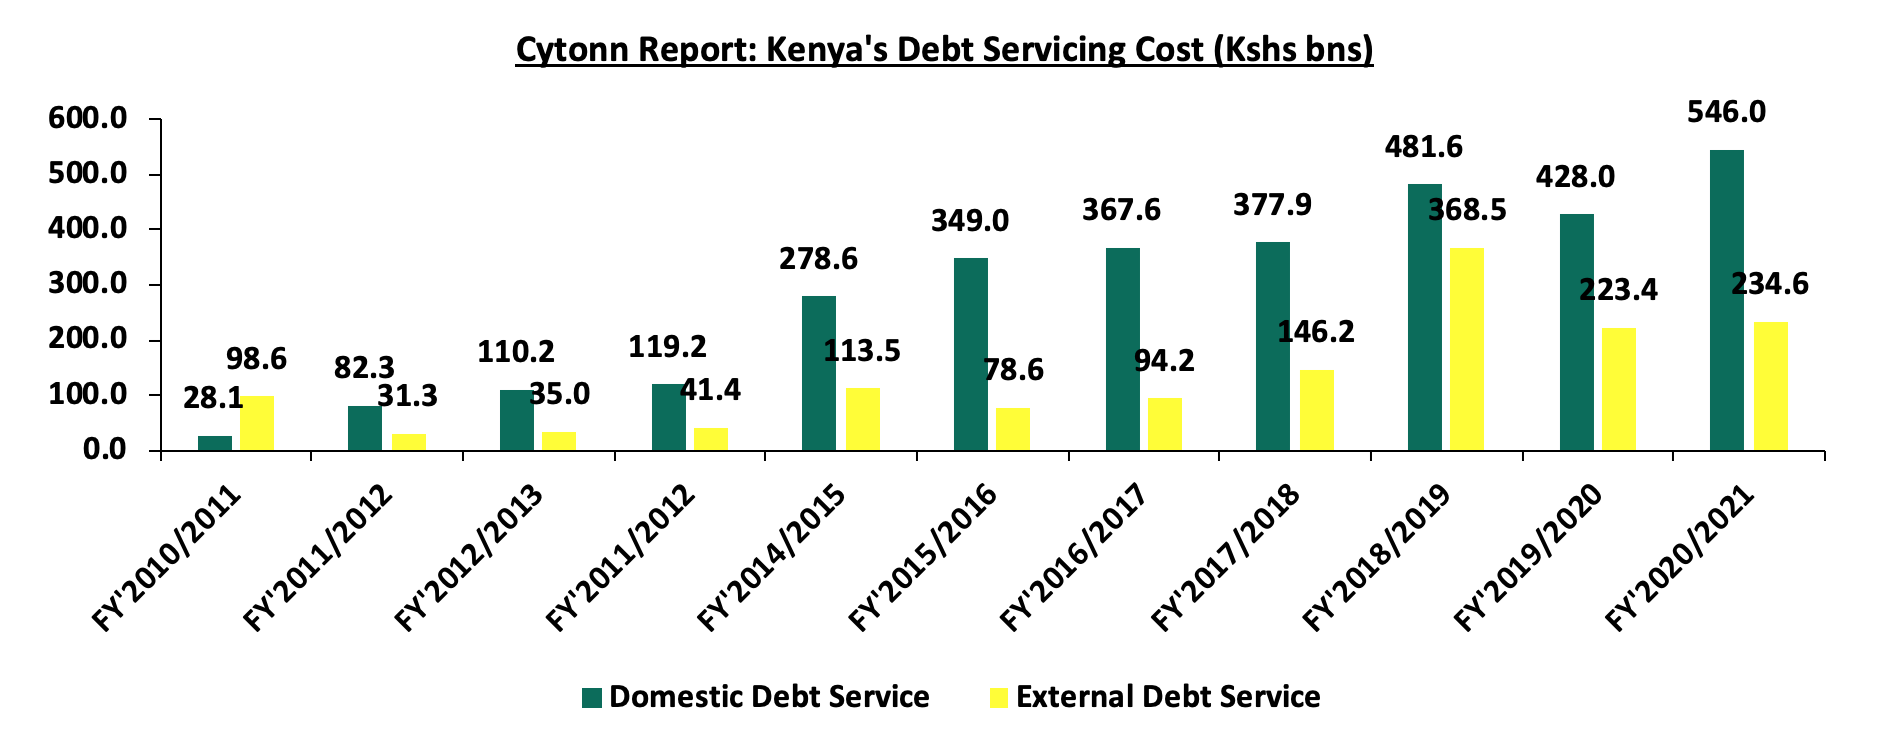
Source: National Treasury
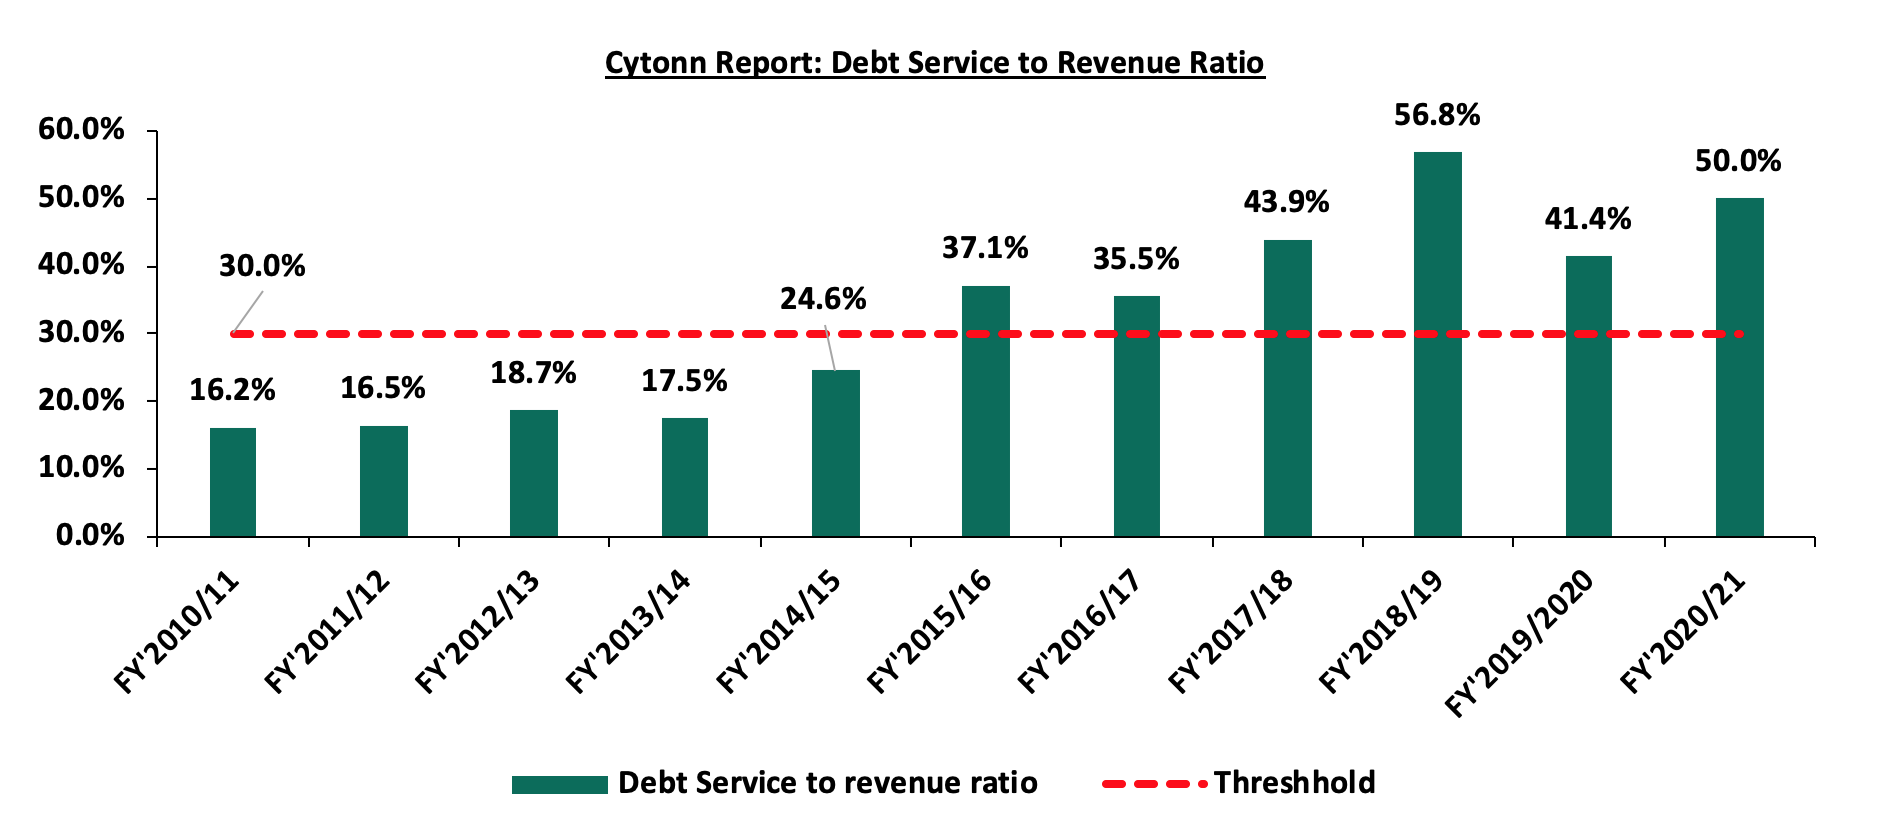
Consequently, the debt service to revenue ratio has continued to increase and was estimated at 50.0% for the FY’2020/2021, 20.0% points higher than IMF’s recommended threshold of 30.0%. The sustained level of debt service to revenue ratio above the recommended threshold is a worrying sign, elevating the refinancing risk following shocks arising from the pandemic and global supply disruptions accelerated by the ongoing Russian-Ukrainian conflict. Below is a chart showing the debt service to revenue ratio for the last ten fiscal years;
Source: National Treasury
Balance of payments deficit indicates that the country is spending more than it is receiving. As such, it is forced to borrow more money to pay for the goods and services from the rest of the world. In the long-term, a country becomes a net consumer and not a net producer of the global economic output which leads to more debt requirements. Additionally, a persistent deficit may necessitate selling of some of the resources to pay its creditors.
Section III: Balance of Payments Outlook and Recommendations
The aim of any government is to ensure self-sufficiency and one of the ways to get here is to strive for a more sustainable balance of payments, which will be driven by sustainable trade and an appealing investment environment. A persistently negative balance of payments exposes the country to a variety of risks including;
- Risk of Capital Flight – A negative balance of payments leads to the reduction of investor confidence by foreign investors. As such, there is a risk of most investors withdrawing their investments which consequently leads to a reduction in forex reserves as well as revenues collected,
- Foreign Ownership of Assets – A current account deficit leads to a deficit on the financial and capital accounts. The deficit in the financial account means foreigners have an increasing claim on the country’s assets which they can desire to be returned at any point in time. When a country’s best assets are purchased by foreigners, the country’s long-term income deteriorates as it leads to future outflows of interest and dividends to foreign investors,
- Risk of Currency Depreciation – When a country is running a large current account deficit, it is at a risk of the country’s currency depreciating due to insufficient capital flows. Additionally, currency depreciation can lead to imported inflation for consumers and firms who rely on imports,
- Debt Unsustainability – If the current account deficit is being financed through borrowing, the debt burden increases and consequently the cost of borrowing. Such high debt burden leads to little finances to spend on investments and various developments, and,
- Depletion of foreign reserves – Increased debt burden translates to increased debt servicing costs which leads to a decline in the foreign reserves if used to fund the repayments. There is risk of running out of official foreign reserves of a country in the long term.
In our view, the government should look into the following broad policies to improve the balance of payments;
- Expenditure-switching policies –Refers to policies aimed at enticing people to switch their spending from imported goods to domestic products such as import tariffs,
- Expenditure reducing policies – Such policies are aimed at reducing domestic expenditure hence reducing the level of imports and may include deflationary monetary and fiscal policies,
- Supply side policies – These are government economic policies aimed at making industries and markets run more smoothly and efficiently, thereby contributing to economic growth. The policies are aimed at improving the competitiveness of domestic firms which may involve increasing quantity and quality of factors of production as well as manufacturing thereby optimizing the export capacity, and,
- Improving macroeconomic stability – Refers to policies that would make a country attractive to inward investments thus raising local production consequently improving capacity for export to bridge the current account deficit.
In light of the above, the government of Kenya should look into key factors such as improving exports, compressing the imports and attracting more direct investments so as to minimize borrowing. Below are our specific recommendations;
- Reduce Imports – To improve Kenya’s current account deficit, the government ought to take steps to reduce imports, primarily through self-sufficiency, which means only importing which it must. For example, a focus on agriculture will reduce the amount we spend on importing food items such as wheat, sugar, maize and other agricultural commodities that we can grow locally,
- Increase Exports – To further improve Kenya’s current account deficit, we expect the government to adopt policies that encourage more exports. In order to enhance productivity of the export sector, the government can promote value addition especially in agro-processing to increase the value of exports. We can also cautiously adopt strategies such as lowering of tariffs, exports subsidies and duty exemption for some of these industries,
- Improving Foreign Direct Investments - According to Foreign Investment Survey 2020 Report, FDI accounted for the largest share of the stock of foreign liabilities at 52.9 per cent in 2018 and 2019. The stock of FDI rose to Kshs 940.9 mn from KSh 870.8 million in 2018 on account of increases in both equity and retained earnings. The government can encourage FDI by improving infrastructure, offering financial incentives and easing some of the regulatory measures that discourage foreign investments. This will consequently lead to an increase in revenues as well as foreign exchange reserves,
- Debt Management - As stated above, Kenya’s external public and public guaranteed debt has been increasing over the years as a result of the need to fund Kenya’s budget deficit. This has consequently led to a decline in the foreign exchange reserves which are used in repaying the debt. To manage the debt levels, the government can i) embark on fiscal consolidation, ii) promote the operations of capital markets so that we have increased local savings, iii) improve the current account deficit, iv) diversify funding of projects to include the private sector, and iv) ensure enhanced parliamentary oversight. Additionally, the government should spur economic growth and address financial weaknesses of essential parastatals, while aggressively privatizing those that can easily be done by private sector such as sugar companies and the national oil corporation. Such actions will reduce the debt burden in the country which will reduce the forex reserves used in financing debt thus improving the balance of payments,
- Effective Tax Policies – In our view, the Kenyan government should focus on ensuring that all tax reforms and policies especially those from economic populists are aligned with economic goals and do not impede productivity. Furthermore, as the country seeks fiscal consolidation, it is worth noting that lowering tax rates across the board may be counterproductive unless accompanied by a reduction in expenditure,
- Acceleration of Local Entrepreneurship – Entrepreneurship is core to producing new and innovative goods and services, which will promote local sufficiency and reducing imported dependency,
- Improve the Ease of Doing Business – To attract more FDI and improve local competitiveness, the government needs to focus intently on ease of doing business so that entrepreneurs are focused on running businesses not chasing approvals, bribing bureaucrats and long waits, and,
- Remove obstacles to local capital formation and savings – Entrepreneurs need capital to finance their businesses, and this capital will come from both banks and capital markets. According to world bank data, in well-functioning markets, banks provide only 40.0% of businesses funding, with the balance of 60.0% of capital coming from capital markets. However, in Kenya, banks provide 99.0% of business funding with only 1.0% coming from our capital markets. This is mainly due to the many obstacles in our capital markets that discourages savings. As such, the government ought to focus on removing obstacles to capital formation.
Section IV: Conclusion
Kenya has been experiencing a current account deficit over the last ten years which has continuously led to a weak balance of payment. Given the current state of the economy characterized by a subdued business environment, elevated inflationary pressures and a high debt burden, we expect that urgent policy measures will be implemented to manage the debt levels, reduce the fiscal deficit, restore economic stability, and mitigate the negative impacts on the Kenyan citizens. We however note that the new government has a significant role to play in stabilizing the economy against a backdrop of unprecedented challenges that continue to weigh on the key macro-economic indicators. As such, we maintain our view that the new administration has limited choices but to focus on ways to boost economic growth, in a bid to reduce the over reliance on debt and imports which stand out as the most critical issues for the country. One of the best ways to accomplish this would be to foster an effective capital markets that enables the business community to raise long-term funds for capital purchases, thereby propelling their growth and the country's economic growth.
Disclaimer: The views expressed in this publication are those of the writers where particulars are not warranted. This publication, which is in compliance with Section 2 of the Capital Markets Authority Act Cap 485A, is meant for general information only and is not a warranty, representation, advice, or solicitation of any nature. Readers are advised in all circumstances to seek the advice of a registered investment advisor.

- Talk to us
- Kenya
- P.O Box 20695 - 00200, Nairobi, Kenya
- Cell +254709101200
- Tel +254709101200
- WhatsApp +254741676635
- United States
- +254709101200
- DOWNLOAD OUR APP
-


- Kenya
- 8th Floor, Pinetree Plaza, Kaburu Drive, Ngong Road, Nairobi, Kenya
- USA
- Suite 1150, 1775 Eye Street NW, USA, Washington DC 20006, USA
- Investments
- High Yield
- Private Equity
- Real Estate
- Real Estate
- RiverRun Estates
- Cytonn Towers
- The Ridge
- Taraji Heights
- The Alma