Kenya’s Balance of Payments Report and Cytonn Weekly #43/2025
By Cytonn Research, Oct 26, 2025
Executive Summary
Fixed Income
During the week, T-bills were oversubscribed for the third consecutive week, with the overall subscription rate coming in at 105.9%, lower than the subscription rate of 114.7% recorded the previous week. Investors’ preference for the shorter 91-day paper persisted, with the paper receiving bids worth Kshs 13.0 bn against the offered Kshs 4.0 bn, translating to a subscription rate of 325.0%, significantly higher than the subscription rate of 91.0%, recorded the previous week. The subscription rates for the 182-day paper increased to 70.3% from the 25.5% recorded the previous week, while that of the 364-day paper decreased to 53.7% from the 213.5% recorded the previous week. The government accepted a total of Kshs 25.3 bn worth of bids out of Kshs 25.4 bn bids received, translating to an acceptance rate of 99.9%. The yields on the government papers were on a downward trajectory with the yields on the 182-day paper decreasing the most by 4.4 bps to 7.87% from the 7.91% recorded the previous week, while the 91-day and 364-day papers decreased by 3.0 bps and 1.8 bps to 7.83% and 9.35% respectively from 7.86% and 9.36% respectively recorded the previous week;
During the week, the National Treasury gazetted the revenue and net expenditures for the third month of FY’2025/2026, ending 30th September 2025, highlighting that the total revenue collected as at the end of September 2025 amounted to Kshs 581.7 bn which is 84.5% of the prorated collections of Kshs 688.7 bn. The overall estimates for revenue collections is Kshs 2,754.7 bn for FY’2025/2026.
During the week, the government announced its second domestic treasury bond buyback of the year, aiming to buyback Kshs 30.0 bn out of the Kshs 76.5 bn outstanding amount for the FXD1/2023/003 with a fixed coupon rate of 14.2% and tenor to maturity of 0.6 years. The period of sale for the bond opened on Thursday, 23rd October 2025 and will close on 17th November 2025, with a settlement date of 19th November 2025. Our expectation is that the bond buyback will be undersubscribed, given the remaining short-term tenor to maturity of the bond, as most investors may prefer to wait till maturity rather than sell at a potential discount. Additionally, if the government’s buyback price is not attractive then investors may prefer not to sell leading to an undersubscription;
In the primary bond market, the government is looking to raise Kshs 40.0 bn through the reopened bonds; FXD1/2012/020 and FXD1/2022/015 with fixed coupon rates of 12.0% and 13.9% respectively and tenors to maturity of 7.0 years and 11.4 years respectively. The period of sale for the two bonds opened on Thursday, 23rd October 2025 and will close on 5th November 2025. The two bonds are currently trading at 12.1% and 12.6% respectively in the secondary market. Our bidding ranges for FXD1/2012/020 and FXD1/2022/015 are 12.50%-13.00% and 14.20%-14.70% respectively;
Equities
During the week, the equities market was on an upward trajectory, with NSE 25, NSE 10, NASI and NSE 20 gaining by 2.4%, 2.1%, 1.9% and 1.9% respectively, taking the YTD performance to gains of 47.7%, 43.5%, 38.6% and 36.0% for NSE 20, NASI, NSE 25, and NSE 10 respectively. The equities market performance was mainly driven by gains recorded by large-cap stocks such as NCBA, EABL and BAT, of 9.3%, 4.6% and 4.0%, respectively. The performance was, however, weighed down by losses by large cap stocks such as Stanbic of 0.4%;
Also, during the week, the banking sector index declined by 2.3% to close at 157.9 from the 161.6 recorded the previous week. This was attributable to losses recorded by stocks such as BK Group and Stanbic of 2.5% and 0.4% respectively. The performance was, however, supported by gains recorded by stocks such as NCBA, Absa and KCB of 9.3%, 2.3% and 2.2% respectively;
Real Estate
During the week, the President assented to the National Land Commission (Amendment) Act, 2025, which seeks to enhance the efficiency, transparency, and accountability of the National Land Commission (NLC). The amendments mainly focus on the review of grants and dispositions of public land, addressing historical land injustices, and improving the Commission’s financial autonomy. The Act comes into effect on 4th November 2025;
During the week, the Financial Reporting Centre (FRC) issued a directive requiring all real estate agents in Kenya to register with the Centre by 14th November 2025. The order aims to strengthen compliance with anti–money laundering (AML) and counter–terrorism financing (CTF) regulations, ensuring that the real estate sector aligns with national and international financial transparency standards;
During the week, Kenya Airways (KQ) and Qatar Airways announced the launch of a codeshare agreement that opens up 19 new destinations across Africa and Asia. The partnership, which took effect from October 26, 2025, will allow both airlines to market and sell seats on each other’s flights, enhancing route connectivity, convenience, and access for passengers;
During the week, Kenya and Senegal signed a reciprocal visa exemption agreement allowing citizens of both countries to travel visa-free for stays not exceeding 90 days. The agreement is part of ongoing efforts to strengthen bilateral relations, promote trade, tourism and cultural exchange, and enhance regional integration between East and West Africa;
On the Unquoted Securities Platform, Acorn D-REIT and I-REIT traded at Kshs 27.4 and Kshs 23.2 per unit, respectively, as per the last updated data on 26th September 2025. The performance represented a 37.0% and 16.0% gain for the D-REIT and I-REIT, respectively, from the Kshs 20.0 inception price. Additionally, ILAM Fahari I-REIT traded at Kshs 11.0 per share as of 26th September 2025, representing a 45.0% loss from the Kshs 20.0 inception price;
Focus of the Week
In pursuit of a stable and sustainable economic future, the Kenyan government prioritizes balancing its economic policies, especially regarding the Balance of Payments. Achieving this balance is essential to ensuring stable trade relations, managing capital inflows and outflows, addressing inflationary pressures, and maintaining a favourable exchange rate system. These efforts are geared towards fostering economic growth, creating employment opportunities, and implementing strategic commercial policies, all of which play pivotal roles in Kenya's pursuit of a robust and sustainable economic trajectory. In light of this, we saw it fit to focus on Kenya’s balance of payments to analyse the current state and what can be done to improve it.
Investment Updates:
- Weekly Rates: Cytonn Money Market Fund closed the week at a yield of 12.6% p.a. To invest, dial *809# or download the Cytonn App from Google Play store here or from the Appstore here;
- We continue to offer Wealth Management Training every Monday, from 10:00 am to 12:00 pm. The training aims to grow financial literacy among the general public. To register for any of our Wealth Management Trainings, click here;
- If interested in our Private Wealth Management Training for your employees or investment group, please get in touch with us through wmt@cytonn.com;
- Cytonn Insurance Agency acts as an intermediary for those looking to secure their assets and loved ones’ future through insurance namely; Motor, Medical, Life, Property, WIBA, Credit and Fire and Burglary insurance covers. For assistance, get in touch with us through insuranceagency@cytonn.com;
- Cytonn Asset Managers Limited (CAML) continues to offer pension products to meet the needs of both individual clients who want to save for their retirement during their working years and Institutional clients that want to contribute on behalf of their employees to help them build their retirement pot. To more about our pension schemes, kindly get in touch with us through pensions@cytonn.com;
Money Markets, T-Bills Primary Auction:
This week, T-bills were oversubscribed for the third consecutive week, with the overall subscription rate coming in at 105.9% ,lower than the subscription rate of 114.7% recorded the previous week. Investors’ preference for the shorter 91-day paper persisted, with the paper receiving bids worth Kshs 13.0 bn against the offered Kshs 4.0 bn, translating to a subscription rate of 325.0%, significantly higher than the subscription rate of 91.0%, recorded the previous week. The subscription rates for the 182-day paper increased to 70.3% from the 25.5% recorded the previous week, while that of the 364-day paper decreased to 53.7% from the 213.5% recorded the previous week. The government accepted a total of Kshs 25.3 bn worth of bids out of Kshs 25.4 bn bids received, translating to an acceptance rate of 99.9%. The yields on the government papers were on a downward trajectory with the yields on the 182-day paper decreasing the most by 4.4 bps to 7.87% from the 7.91% recorded the previous week, while the 91-day and 364-day papers decreased by 3.0 bps and 1.8 bps to 7.83% and 9.35% respectively from 7.86% and 9.36% respectively recorded the previous week.
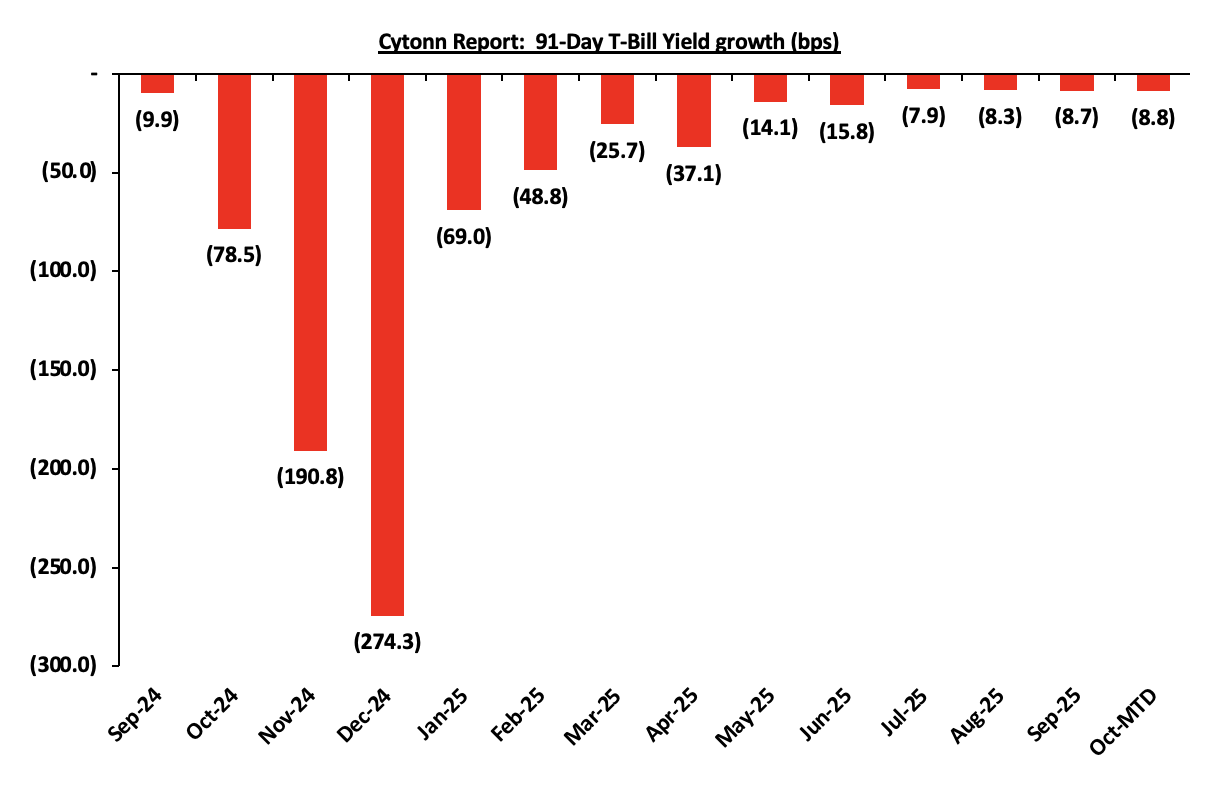
The chart below shows the yield growth rate for the 91-day paper in the year to September 2025 and October month-to-date:
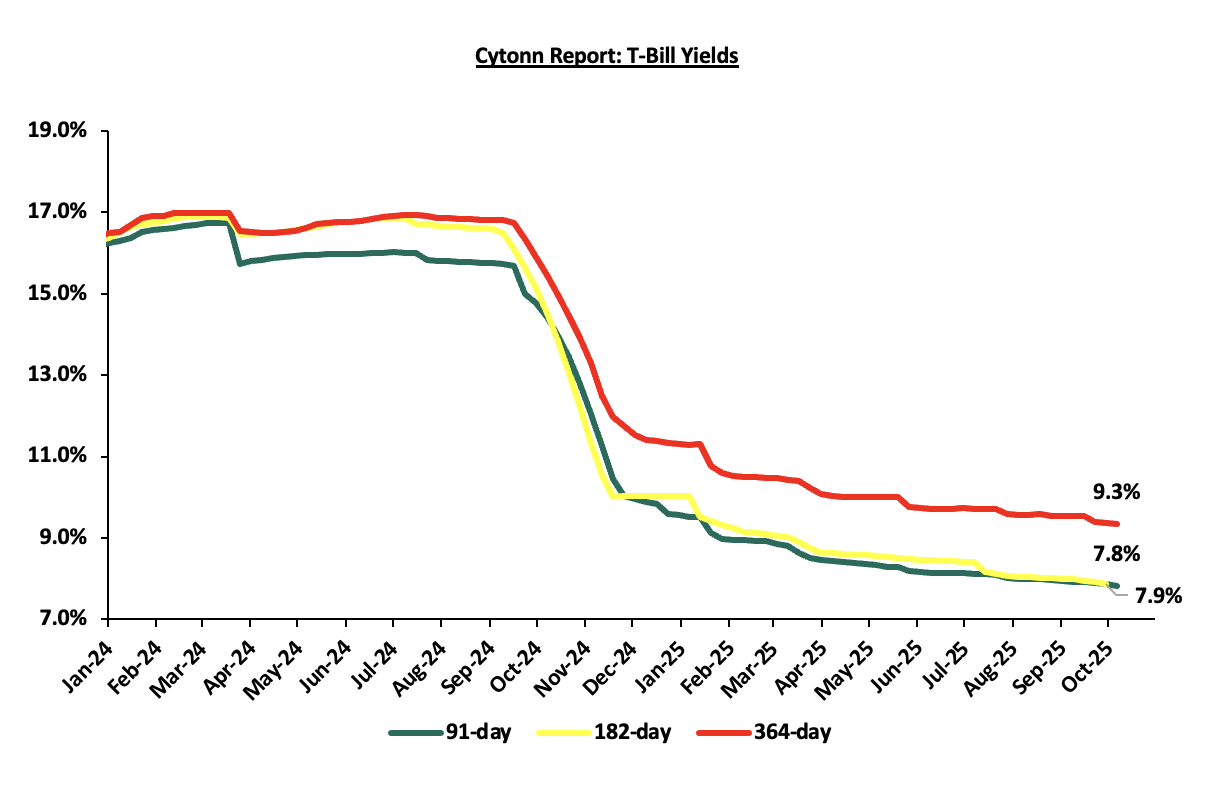
The charts below show the performance of the 91-day, 182-day and 364-day papers from January 2024 to October 2025:
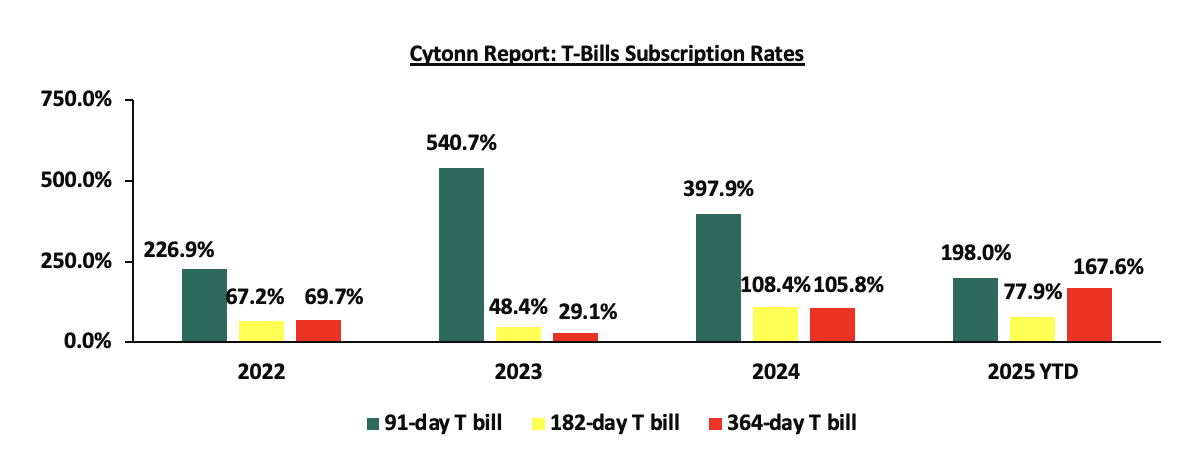
The chart below compares the overall average T-bill subscription rates obtained in 2022,2023, 2024 and 2025 Year-to-date (YTD):
The government announced its second domestic treasury bond buyback of the year, aiming to buyback Kshs 30.0 bn out of the Kshs 76.5 bn outstanding amount for the FXD1/2023/003 with a fixed coupon rate of 14.2% and tenor to maturity of 0.6 years. The period of sale for the bond opened on Thursday, 23rd October 2025 and will close on 17th November 2025, with a settlement date of 19th November 2025. Our expectation is that the bond buyback will be undersubscribed, given the remaining short-term tenor to maturity of the bond, as most investors may prefer to wait till maturity rather than sell at a potential discount. Additionally, if the government’s buyback price is not attractive then investors may prefer not to sell leading to an undersubscription;
In the primary bond market, the government is looking to raise Kshs 40.0 bn through the reopened bonds; FXD1/2012/020 and FXD1/2022/015 with fixed coupon rates of 12.0% and 13.9% respectively and tenors to maturity of 7.0 years and 11.4 years respectively. The period of sale for the two bonds opened on Thursday, 23rd October 2025 and will close on 5th November 2025. Our bidding ranges for FXD1/2012/020 and FXD1/2022/015 are 12.50% - 13.00% and 14.20% - 14.70% respectively;
Money Market Performance:
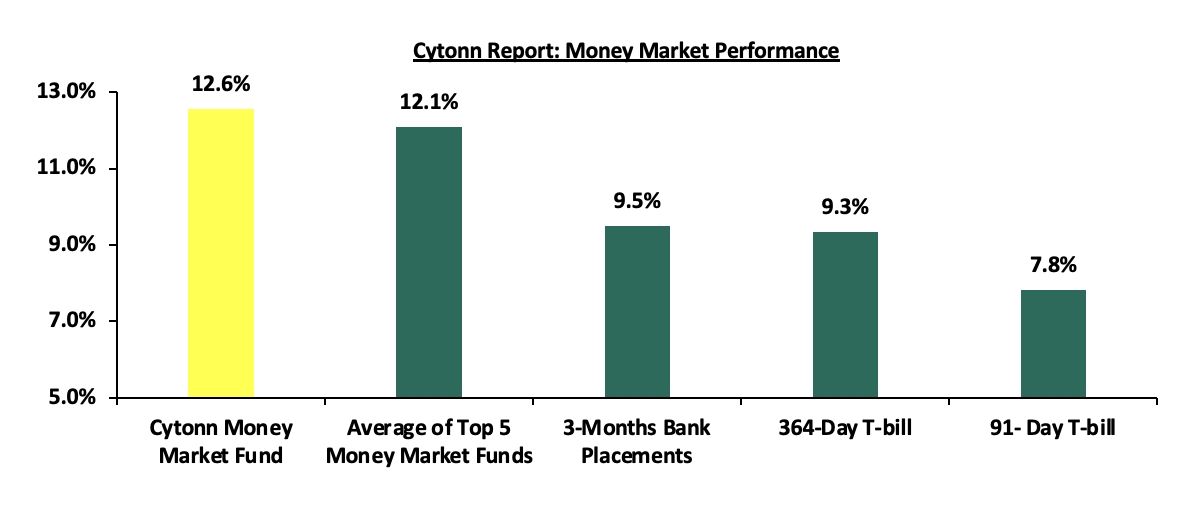
In the money markets, 3-month bank placements ended the week at 9.5% (based on what we have been offered by various banks). The yield on the 91-day and 364-day papers decreased by 3.0 bps and 1.8 bps to 7.83% and 9.35% from the 7.86% and 9.36% respectively recorded the previous week. The yield on the Cytonn Money Market Fund decreased by 11.0 bps to 12.6%, from 12.7% recorded in the previous week, while the average yields on the Top 5 Money Market Funds decreased by 42.6 bps to 12.1% from the 12.5% recorded the previous week.
The table below shows the Money Market Fund Yields for Kenyan Fund Managers as published on 24th October 2025:
|
Money Market Fund Yield for Fund Managers as published on 24th October 2025 |
||
|
Rank |
Fund Manager |
Effective Annual Rate |
|
1 |
Cytonn Money Market Fund (Dial *809# or download Cytonn App) |
12.6% |
|
2 |
Gulfcap Money Market Fund |
12.2% |
|
3 |
Etica Money Market Fund |
12.1% |
|
4 |
Nabo Africa Money Market Fund |
11.8% |
|
5 |
Lofty-Corban Money Market Fund |
11.7% |
|
6 |
Enwealth Money Market Fund |
11.2% |
|
7 |
Kuza Money Market fund |
11.1% |
|
8 |
Orient Kasha Money Market Fund |
11.1% |
|
9 |
Ndovu Money Market Fund |
11.1% |
|
10 |
Old Mutual Money Market Fund |
10.8% |
|
11 |
GenAfrica Money Market Fund |
10.7% |
|
12 |
British-American Money Market Fund |
10.7% |
|
13 |
Jubilee Money Market Fund |
10.5% |
|
14 |
Madison Money Market Fund |
10.2% |
|
15 |
Arvocap Money Market Fund |
10.0% |
|
16 |
Apollo Money Market Fund |
9.9% |
|
17 |
Dry Associates Money Market Fund |
9.9% |
|
18 |
Faulu Money Market Fund |
9.8% |
|
19 |
CPF Money Market Fund |
9.7% |
|
20 |
Sanlam Money Market Fund |
9.4% |
|
21 |
KCB Money Market Fund |
9.4% |
|
22 |
Mali Money Market Fund |
9.0% |
|
23 |
Co-op Money Market Fund |
8.9% |
|
24 |
ICEA Lion Money Market Fund |
8.6% |
|
25 |
CIC Money Market Fund |
8.5% |
|
26 |
Genghis Money Market Fund |
8.5% |
|
27 |
Mayfair Money Market Fund |
8.4% |
|
28 |
Absa Shilling Money Market Fund |
7.9% |
|
29 |
AA Kenya Shillings Fund |
7.4% |
|
30 |
Ziidi Money Market Fund |
6.5% |
|
31 |
Stanbic Money Market Fund |
6.4% |
|
32 |
Equity Money Market Fund |
5.0% |
Source: Business Daily
Liquidity:
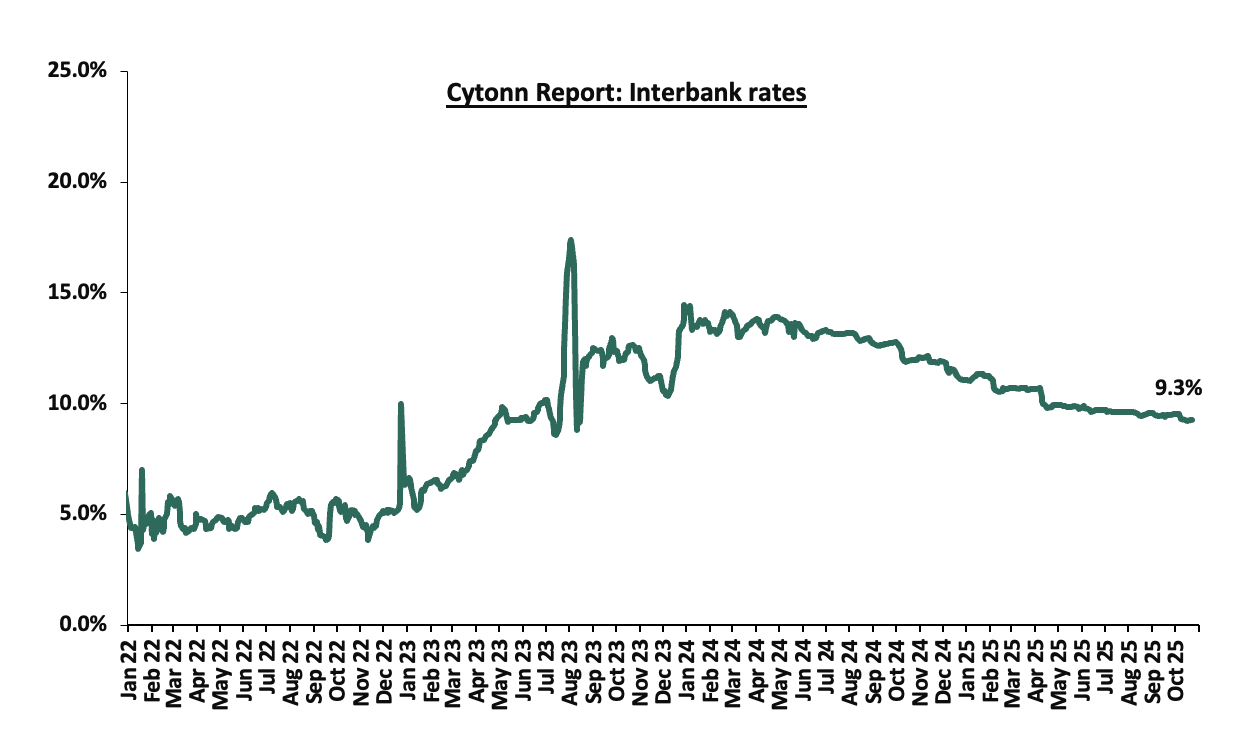
During the week, liquidity in the money markets marginally tightened with the average interbank rate increasing by 0.3 bps, to 9.3% from the 9.2% recorded the previous week, partly attributable to tax remittances that offset government payments. The average interbank volumes traded increased significantly by 72.6% to Kshs 14.5 bn from Kshs 8.4 bn recorded the previous week. The chart below shows the interbank rates in the market over the years:
Kenya Eurobonds:
During the week, the yields on Kenya’s Eurobonds registered mixed performance with the yields on the 7-year Eurobond issued in 2024 decreasing the most by 10.8 bps to 7.9% from the 8.0% recorded the previous week while the 12-year Eurobond issued in 2019 increased by 3.0 bps to 8.3% from the 8.2% recorded the previous week. The table below shows the summary performance of the Kenyan Eurobonds as of 23rd October 2025;
|
Cytonn Report: Kenya Eurobond Performance |
|||||||
|
|
2018 |
2019 |
2021 |
2024 |
2025 |
||
|
Tenor |
10-year issue |
30-year issue |
7-year issue |
12-year issue |
13-year issue |
7-year issue |
11-year issue |
|
Amount Issued (USD) |
1.0 bn |
1.0 bn |
0.9 bn |
1.2 bn |
1.0 bn |
1.5 bn |
1.5 bn |
|
Years to Maturity |
2.5 |
22.5 |
1.7 |
6.7 |
8.8 |
5.5 |
10.5 |
|
Yields at Issue |
7.3% |
8.3% |
7.0% |
7.9% |
6.2% |
10.4% |
9.9% |
|
2-Jan-25 |
9.1% |
10.3% |
8.5% |
10.1% |
10.1% |
10.1% |
|
|
1-Oct-25 |
5.8% |
9.3% |
- |
8.1% |
8.4% |
7.9% |
|
|
16-Oct-25 |
5.9% |
9.4% |
- |
8.2% |
8.6% |
8.0% |
|
|
17-Oct-25 |
6.0% |
9.5% |
- |
8.4% |
8.7% |
8.1% |
|
|
20-Oct-25 |
6.0% |
9.4% |
- |
8.3% |
8.6% |
8.0% |
|
|
21-Oct-25 |
5.9% |
9.3% |
- |
8.2% |
8.5% |
7.9% |
|
|
22-Oct-25 |
5.9% |
9.3% |
- |
8.2% |
8.5% |
7.9% |
10.0% |
|
23-Oct-25 |
5.9% |
9.3% |
- |
8.3% |
8.6% |
7.9% |
|
|
Weekly Change |
0.0% |
(0.1%) |
- |
0.0% |
0.0% |
(0.1%) |
- |
|
MTD Change |
0.0% |
0.0% |
- |
0.1% |
0.2% |
0.0% |
0.0% |
|
YTD Change |
(3.2%) |
(1.0%) |
- |
(1.8%) |
(1.5%) |
(2.2%) |
0.0% |
Source: Central Bank of Kenya (CBK) and National Treasury
Kenya Shilling:
During the week, the Kenya Shilling depreciated marginally by 0.3 bps and ended the week at Kshs.129.2. On a year-to-date basis, the shilling has appreciated by 5.1 bps against the dollar, compared to the 17.6% appreciation recorded in 2024.
We expect the shilling to be supported by:
- Diaspora remittances standing at a cumulative USD 5,080.0 mn in the twelve months to September 2025, 7.6% higher than the USD 4,722.6 mn recorded over the same period in 2024. These has continued to cushion the shilling against further depreciation. In the September 2025 diaspora remittances figures, North America remained the largest source of remittances to Kenya accounting for 58.6% in the period,
- The tourism inflow receipts which are projected to reach KSh 560.0 bn in 2025 up from KSh 452.2 bn in 2024 a 23.9% increase, and owing to tourist arrivals that improved by 9.9% to 2,424,382 in the 12 months to June 2025 from 2,206,469 in the 12 months to June 2024, and
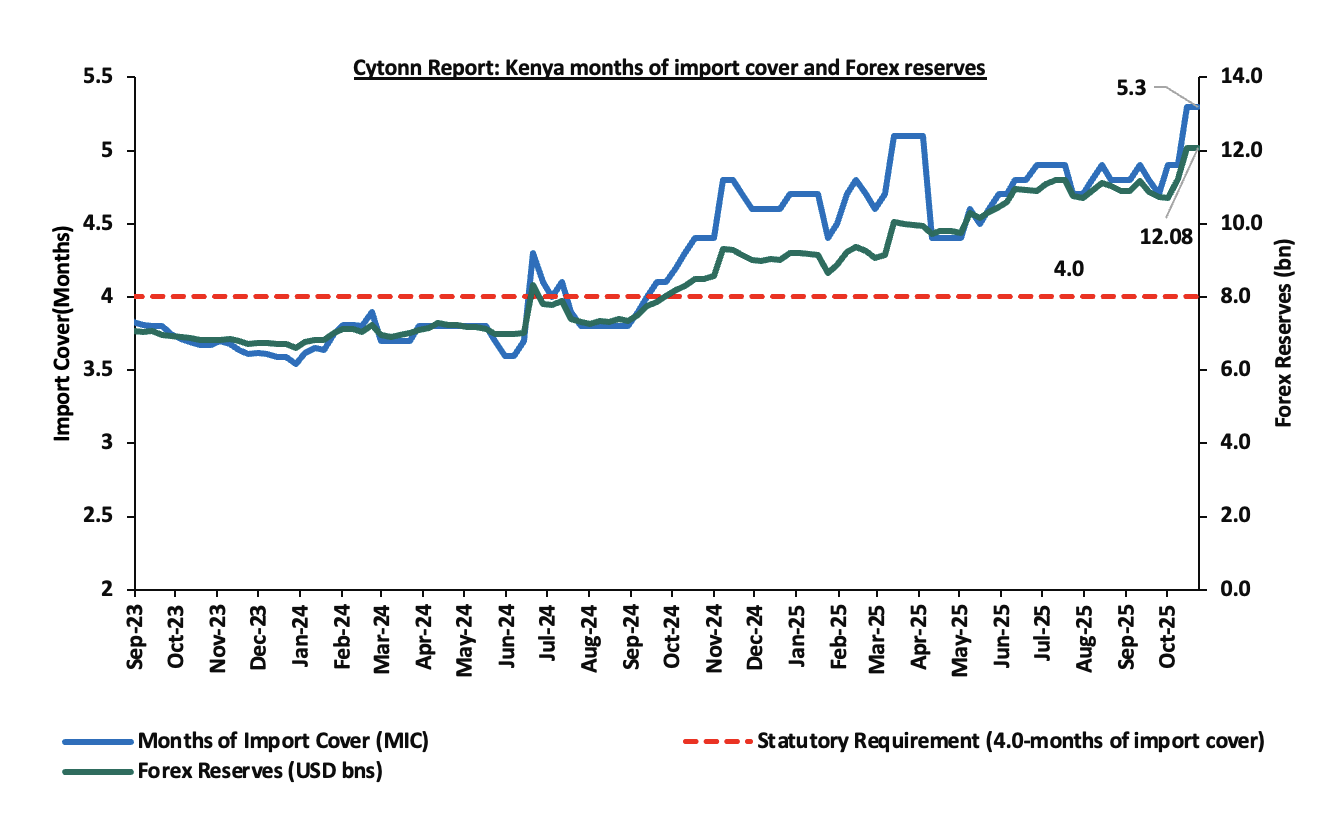
- Improved forex reserves currently at USD 12.1 bn (equivalent to 5.3-months of import cover), which is above the statutory requirement of maintaining at least 4.0-months of import cover and above the EAC region’s convergence criteria of 4.5 months of import cover.
The shilling is however expected to remain under pressure in 2025 as a result of:
- An ever-present current account deficit which came at 2.1% of GDP in the twelve months to August 2025, and,
- The need for government debt servicing, continues to put pressure on forex reserves given that 59.7% of Kenya’s external debt is US Dollar-denominated as of June 2025.
Key to note, Kenya’s forex reserves increased by 0.1% during the week, to USD 12.08 bn from the USD 12.07 bn recorded in the previous week, equivalent to 5.3 months of import cover, and above the statutory requirement of maintaining at least 4.0-months of import cover and above the EAC region’s convergence criteria of 4.5 months of import cover.
The chart below summarizes the evolution of Kenya's months of import cover over the years:
Weekly Highlights
- Exchequer September 2025 highlight
The National Treasury gazetted the revenue and net expenditures for the second month of FY’2025/2026, ending 30th September 2025. Below is a summary of the performance:
|
Item |
12-months Original Estimates |
Actual Receipts/Release |
Percentage Achieved |
Prorated |
% achieved of the Prorated |
|
Opening Balance |
|
6.4 |
|
|
|
|
Tax Revenue |
2,627.1 |
553.7 |
21.1% |
656.8 |
84.3% |
|
Non-Tax Revenue |
127.6 |
21.6 |
16.9% |
31.9 |
67.6% |
|
Total Revenue |
2,754.7 |
581.7 |
21.1% |
688.7 |
84.5% |
|
External Loans & Grants |
569.8 |
18.7 |
3.3% |
142.5 |
13.1% |
|
Domestic Borrowings |
1,098.3 |
425.7 |
38.8% |
274.6 |
155.1% |
|
Other Domestic Financing |
10.8 |
5.5 |
51.0% |
2.7 |
204.0% |
|
Total Financing |
1,678.9 |
450.0 |
26.8% |
419.7 |
107.2% |
|
Recurrent Exchequer issues |
1,470.4 |
366.5 |
24.9% |
367.6 |
99.7% |
|
CFS Exchequer Issues |
2,141.0 |
546.8 |
25.5% |
535.3 |
102.1% |
|
Development Expenditure & Net Lending |
407.1 |
43.3 |
10.6% |
101.8 |
42.6% |
|
County Governments + Contingencies |
415.0 |
66.1 |
15.9% |
103.8 |
63.7% |
|
Total Expenditure |
4,433.6 |
1,022.7 |
23.1% |
1,108.4 |
92.3% |
|
Fiscal Deficit excluding Grants |
1,678.9 |
441.0 |
26.3% |
419.7 |
105.1% |
|
Total Borrowing |
1,668.1 |
444.5 |
26.6% |
417.0 |
106.6% |
|
Public Debt |
1,901.4 |
509.6 |
26.8% |
475.3 |
107.2% |
The Key take-outs from the release include;
- Total revenue collected as at the end of September 2025 amounted to Kshs 581.7 bn, equivalent to 21.1% of the original estimates of Kshs 2,754.7 bn for FY’2025/2026 and is 84.5% of the prorated estimates of Kshs 688.7 bn. Cumulatively, tax revenues amounted to Kshs 553.7 bn, equivalent to 21.1% of the original estimates of Kshs 2,627.1 bn and 84.3% of the prorated estimates of Kshs 656.8 bn,
- Total financing amounted to Kshs 450.0 bn, equivalent to 26.8% of the original estimates of Kshs 1,678.9 bn and is equivalent to 107.2% of the prorated estimates of Kshs 419.7 bn. Additionally, domestic borrowing amounted to Kshs 425.7 bn, equivalent to 38.8% of the original estimates of Kshs 1,098.3 bn and is 155.1% of the prorated estimates of Kshs 274.6 bn,
- The total expenditure amounted to Kshs 1,022.7 bn, equivalent to 23.1% of the original estimates of Kshs 4,433.6 bn, and is 92.3% of the prorated target expenditure estimates of Kshs 1,108.4 bn. Additionally, the net disbursements to recurrent expenditures came in at Kshs 366.5 bn, equivalent to 24.9% of the original estimates of Kshs 1,470.4 and are equivalent to 99.7% of the prorated estimates of Kshs 367.6 bn,
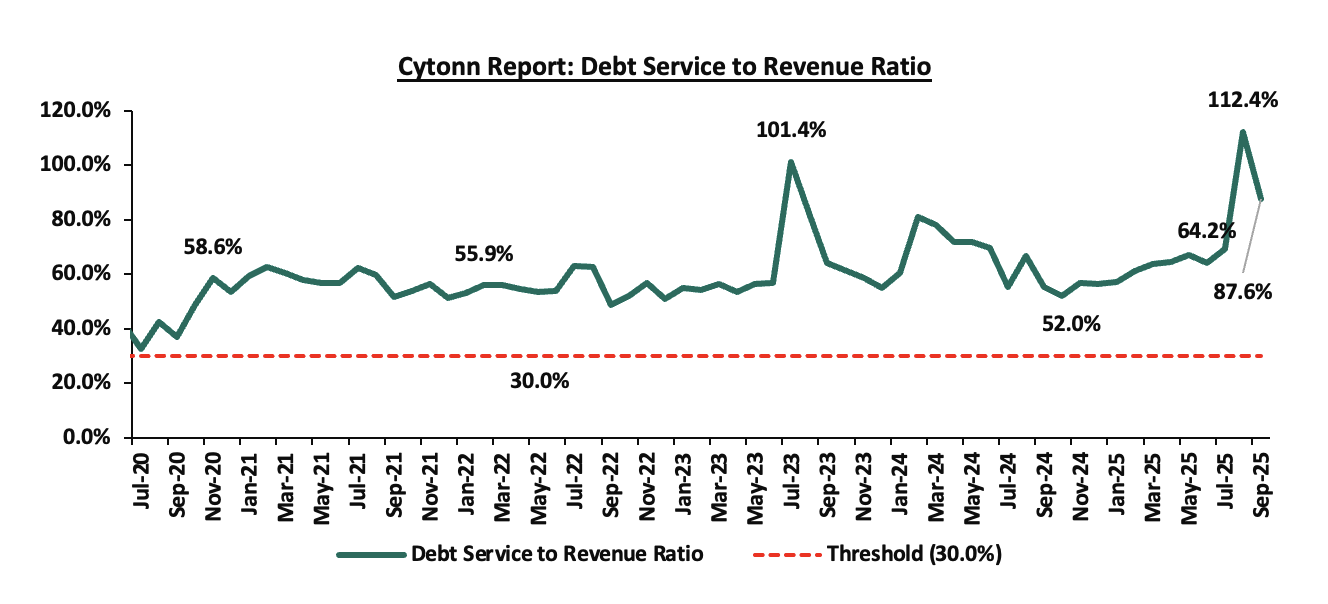
- Consolidated Fund Services (CFS) Exchequer issues came in at Kshs 546.8 bn, equivalent to 25.5% of the original estimates of Kshs 2,141.0 bn, and are 102.1% of the prorated amount of Kshs 535.3 bn. The cumulative public debt servicing cost amounted to Kshs 509.6 bn which is 26.8% of the original estimates of Kshs 1,901.4 bn and is 107.2% of the prorated estimates of Kshs 475.3 bn. Additionally, the Kshs 509.6 bn debt servicing cost is equivalent to 87.6% of the actual cumulative revenues collected as at the end of September 2025. The chart below shows the debt servicing cost to revenue ratio over the period;
- Total Borrowings as at the end of September 2025 amounted to Kshs 444.5 bn, equivalent to 26.6% of the original estimates of Kshs 1,668.1 bn for FY’2025/2026 and are 106.6% of the prorated estimates of Kshs 417.0 bn. The cumulative domestic borrowing of Kshs 1,098.3 bn comprises of Net Domestic Borrowing Kshs 634.8 bn and Internal Debt Redemptions (Rollovers) Kshs 463.5 bn.
The government missed its prorated revenue targets for the third month of the FY’2025/2026, achieving 84.5% of the prorated revenue targets in September 2025, although higher than the 74.8% recorded in August 2025. The shortfall was driven by underperformance in both tax and non-tax revenues, which stood at 84.3% and 67.6% of prorated levels, respectively. External loans and grants remained significantly below target at 13.1%, increasing reliance on domestic borrowing, which came in at 155.1% of the prorated target. The business environment, however, showed signs of recovery, with the Purchasing Managers’ Index (PMI) rising to 51.9 in September 2025 from 49.4 in August 2025, crossing over the 50.0 neutral mark and signalling a slowdown in the contraction of business activity. Expenditure absorption stood at 92.3% of prorated levels, with development spending still lagging at 42.6%, reflecting slow implementation of capital projects. Future revenue performance will depend on how quickly private sector activity strengthens, supported by a stable Shilling, easing credit conditions following the 25.0 bps reduction in the Central Bank Rate to 9.25% from 9.50% in October, and continued efforts to broaden the tax base, curb evasion, and stimulate economic growth.
Rates in the Fixed Income market have been on a downward trend due to high liquidity in the money market which allowed the government to front load most of its borrowing. The government is 129.6% ahead of its prorated net domestic borrowing target of Kshs 205.8 bn, having a net borrowing position of Kshs 472.5 bn (inclusive of T-bills). However, we expect stabilization of the yield curve in the short and medium term, with the government looking to increase its external borrowing to maintain the fiscal surplus, hence alleviating pressure in the domestic market. As such, we expect the yield curve to stabilize in the short to medium-term and hence investors are expected to shift towards the long-term papers to lock in the high returns
Market Performance:
During the week, the equities market was on an upward trajectory, with NSE 25, NSE 10, NASI and NSE 20 gaining by 2.4%, 2.1%, 1.9% and 1.9% respectively, taking the YTD performance to gains of 47.7%, 43.5%, 38.6% and 36.0% for NSE 20, NASI, NSE 25, and NSE 10 respectively. The equities market performance was mainly driven by gains recorded by large-cap stocks such as NCBA, EABL and BAT, of 9.3%, 4.6% and 4.0%, respectively. The performance was, however, weighed down by losses by large cap stocks such as Stanbic of 0.4%.
The banking sector index declined by 2.3% to close at 157.9 from the 161.6 recorded the previous week. This was attributable to losses recorded by large cap stocks such as Stanbic of 0.4%. The performance was however supported by gains recorded by stocks such as NCBA, Absa and KCB of 9.3%, 2.3% and 2.2% respectively.
During the week, equities turnover increased by 184.0% to USD 32.2 mn from USD 11.4 mn recorded the previous week, taking the YTD turnover to USD 852.1 mn. Foreign investors remained net sellers for the third consecutive week, with a net selling position of USD 12.7 mn, from a net selling position of USD 0.5 mn recorded the previous week, taking the YTD net selling position to USD 68.6 mn.
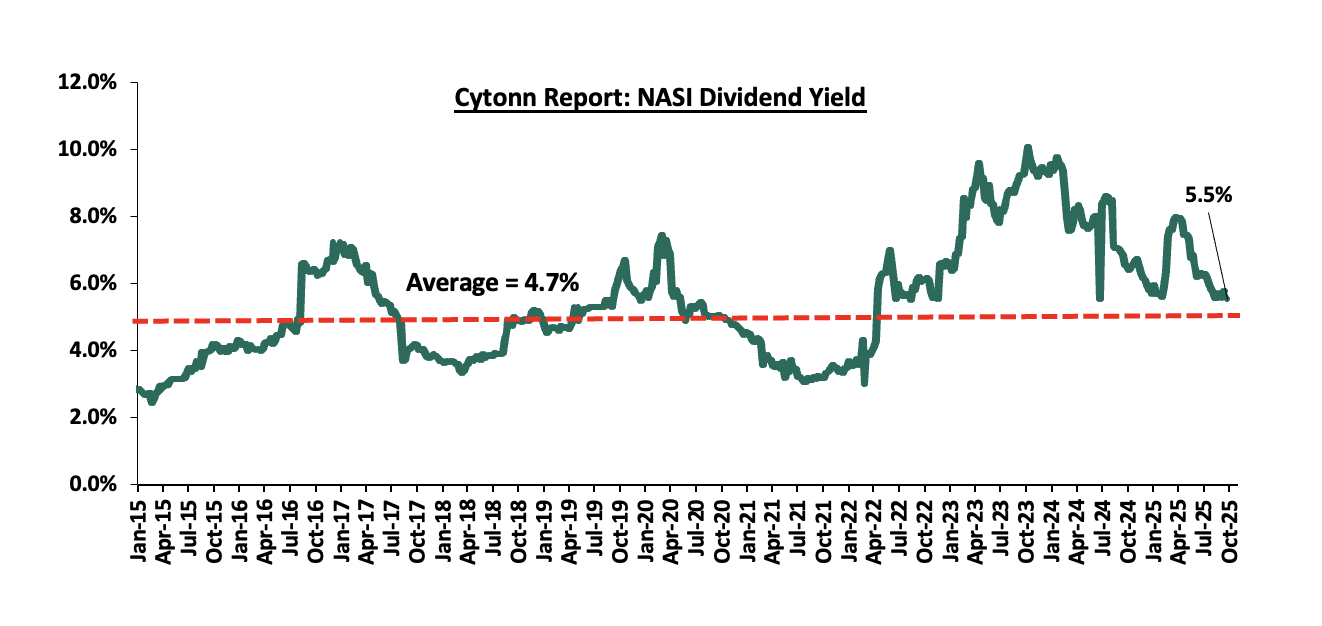
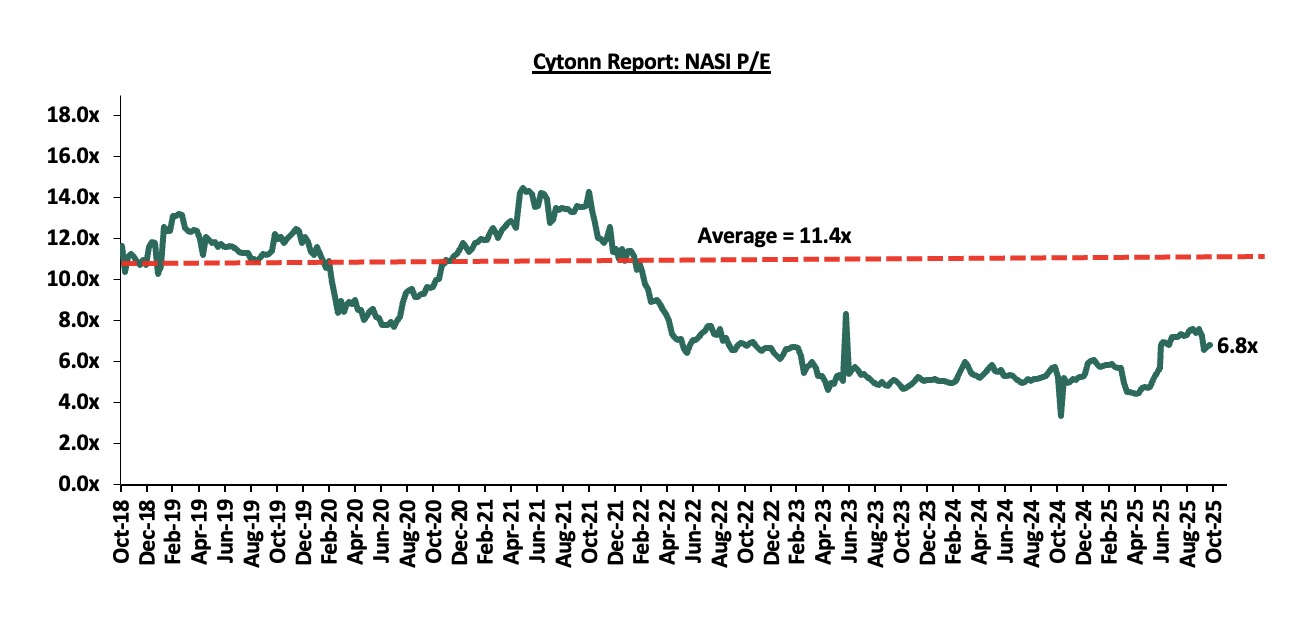
The market is currently trading at a price to earnings ratio (P/E) of 6.8x, 40.0% below the historical average of 11.4x, and a dividend yield of 5.5%, 0.8% points above the historical average of 4.7%. Key to note, NASI’s PEG ratio currently stands at 0.9x, an indication that the market is slightly undervalued relative to its future growth. A PEG ratio greater than 1.0x indicates the market may be overvalued while a PEG ratio less than 1.0x indicates that the market is undervalued.
The charts below indicate the historical P/E and dividend yields of the market;
Universe of Coverage:
|
Cytonn Report: Equities Universe of Coverage |
||||||||||||
|
Company |
Price as at 16/10/2026 |
Price as at 24/10/2026 |
w/w change |
q/q change |
YTD Change |
Year Open 2025 |
Target Price* |
Dividend Yield |
Upside/ Downside** |
P/TBv Multiple |
Recommendation |
|
|
Diamond Trust Bank |
103.75 |
104.00 |
0.2% |
(0.5%) |
55.8% |
66.8 |
128.3 |
6.7% |
30.0% |
0.4x |
Buy |
|
|
Standard Chartered Bank |
290.75 |
295.00 |
1.5% |
3.9% |
3.4% |
285.3 |
314.1 |
15.3% |
21.7% |
1.7x |
Buy |
|
|
I&M Group |
42.10 |
43.75 |
3.9% |
1.7% |
21.5% |
36.0 |
48.2 |
6.9% |
17.0% |
0.8x |
Accumulate |
|
|
ABSA Bank |
22.00 |
22.50 |
2.3% |
4.7% |
19.4% |
18.9 |
24.1 |
7.8% |
14.8% |
1.5x |
Accumulate |
|
|
KCB Group |
57.00 |
58.25 |
2.2% |
2.6% |
37.4% |
42.4 |
63.6 |
5.2% |
14.3% |
0.7x |
Accumulate |
|
|
Britam |
8.56 |
8.50 |
(0.7%) |
(4.7%) |
46.0% |
5.8 |
9.5 |
0.0% |
12.0% |
0.8x |
Accumulate |
|
|
Co-op Bank |
19.95 |
20.35 |
2.0% |
(4.9%) |
16.6% |
17.5 |
21.1 |
7.4% |
11.3% |
0.7x |
Accumulate |
|
|
Equity Group |
59.25 |
59.50 |
0.4% |
2.6% |
24.0% |
48.0 |
61.2 |
7.1% |
10.0% |
1.0x |
Hold |
|
|
Stanbic Holdings |
199.00 |
198.25 |
(0.4%) |
7.6% |
41.9% |
139.8 |
194.8 |
10.5% |
8.7% |
1.2x |
Hold |
|
|
Jubilee Holdings |
321.50 |
319.50 |
(0.6%) |
1.7% |
82.8% |
174.8 |
312.9 |
4.2% |
2.2% |
0.5x |
Lighten |
|
|
NCBA |
83.25 |
91.00 |
9.3% |
31.9% |
78.4% |
51.0 |
79.0 |
6.0% |
(7.1%) |
1.5x |
Sell |
|
|
CIC Group |
4.59 |
4.58 |
(0.2%) |
(5.6%) |
114.0% |
2.1 |
4.0 |
2.8% |
(9.2%) |
1.2x |
Sell |
|
|
*Target Price as per Cytonn Analyst estimates **Upside/ (Downside) is adjusted for Dividend Yield ***Dividend Yield is calculated using FY’2024 Dividends |
||||||||||||
We are “Bullish” on the Equities markets in the short term due to current cheap valuations, lower yields on short-term government papers and expected global and local economic recovery, and, “Neutral” in the long term due to persistent foreign investor outflows. With the market currently trading at a discount to its future growth (PEG Ratio at 0.9x), we believe that investors should reposition towards value stocks with strong earnings growth and that are trading at discounts to their intrinsic value. We expect the current high foreign investors sell-offs to continue weighing down the economic outlook in the short term.
- Industry Highlight
- Financial Reporting Centre directive on Real Estate agent registration
During the week, the Financial Reporting Centre (FRC) issued a directive requiring all Real Estate agents in Kenya to register with the Centre by 14th November 2025. The order aims to strengthen compliance with anti–money laundering (AML) and counter–terrorism financing (CTF) regulations, ensuring that the real estate sector aligns with national and international financial transparency standards.
The FRC’s directive mandates all practicing Real Estate agents, including property developers, brokers and agencies, to formally register with the Centre within the specified deadline. The move comes amid growing concerns that the real estate sector is increasingly being used as a channel for laundering illicit funds due to its high-value transactions and informal practices. Registration will require agents to provide identification details, ownership structures and transaction records to enhance traceability and accountability in property dealings.
Failure to comply with the registration requirement will expose agents to legal penalties, including fines and possible suspension of operations. Once registered, agents will also be obligated to report suspicious transactions, maintain proper client records, and adhere to enhanced due diligence procedures. The directive forms part of Kenya’s broader efforts to meet international standards set by the Financial Action Task Force (FATF) and to avoid being flagged for non-compliance in the global financial system.
The move is expected to bring greater professionalism and credibility to Kenya’s Real Estate sector by curbing illicit financial flows, improving transparency in property ownership, and fostering investor confidence. In the long term, compliance with the FRC guidelines will strengthen governance in the Real Estate market and enhance Kenya’s reputation as a secure and transparent investment destination.
- Hospitality
- Kenya Airways and Qatar Airways launched a codeshare agreement
During the week, Kenya Airways (KQ) and Qatar Airways announced the launch of a codeshare agreement that opens up 19 new destinations across Africa and Asia. The partnership, which took effect from October 26, 2025, will allow both airlines to market and sell seats on each other’s flights, enhancing route connectivity, convenience, and access for passengers
The agreement, which follows a memorandum of understanding signed between the two airlines in July 2025, will enable passengers from both carriers to book flights operated by either airline under a single ticket. Kenya Airways customers will now be able to book codeshare flights between Nairobi and Doha, as well as connect to ten additional destinations through Qatar Airways’ hub at Hamad International Airport. Similarly, Qatar Airways passengers will gain access to Kenya Airways’ extensive African network, including destinations such as Abidjan, Accra, Addis Ababa, Lilongwe, Juba, Nampula, Lusaka, and Victoria Falls. The collaboration is expected to strengthen the airlines’ presence in Africa and enhance connectivity for travelers across multiple continents.
This partnership is expected to significantly boost tourism in Kenya by increasing international connectivity and improving ease of travel for tourists from Asia, the Middle East and Europe. With Kenya now linked to Qatar Airways’ vast global network of over 170 destinations, the country stands to attract more high-value travelers seeking leisure and adventure experiences. The deal also positions Nairobi as a stronger regional hub, enabling multi-destination tourism across Africa, where Kenya serves as a key gateway. Enhanced air access will further support business and conference tourism, drawing more visitors for meetings and exhibitions. Ultimately, the increased tourist arrivals are expected to spur growth in hospitality, transport, and cultural sectors, creating employment opportunities and contributing positively to Kenya’s foreign exchange earnings
- Kenya and Senegal Visa Agreement
During the week, Kenya and Senegal signed a reciprocal visa exemption agreement allowing citizens of both countries to travel visa-free for stays not exceeding 90 days. The agreement is part of ongoing efforts to strengthen bilateral relations, promote trade, tourism and cultural exchange, and enhance regional integration between East and West Africa.
The visa-free arrangement is expected to significantly boost Kenya’s and Senegal’s hospitality industries by facilitating increased cross-border travel. With the removal of visa barriers, more tourists, business travelers, and delegates attending conferences or cultural events will find it easier and cheaper to visit either country. This is likely to result in higher occupancy rates in hotels, lodges, and serviced apartments, as well as increased patronage in restaurants, tour companies, and entertainment venues.
The agreement also opens opportunities for collaboration between hospitality businesses in both countries, including travel agencies, hotel chains, and tourism operators, who can develop joint packages targeting regional travelers. Additionally, the rise in visitor numbers will stimulate demand for related services such as transport, catering, and event management, creating new employment opportunities and boosting revenues within the sector.
In the long term, the increased inflow of visitors could encourage investment in new hospitality infrastructure and service innovation, particularly in emerging travel destinations. Overall, the visa exemption is poised to enhance Kenya’s and Senegal’s competitiveness as tourism and business travel hubs in their respective regions, driving sustainable growth in their hospitality sectors.
- Land Sector
- National Land Commission Amendment Act, 2025
During the week, the President assented to the National Land Commission (Amendment) Act, 2025, which seeks to enhance the efficiency, transparency, and accountability of the National Land Commission (NLC). The amendments mainly focus on the review of grants and dispositions of public land, addressing historical land injustices, and improving the Commission’s financial autonomy. The Act comes into effect on 4th November 2025.
The National Land Commission (Amendment) Act 2025 introduces several key changes to the principal National Land Commission Act. First, Section 14 has been repealed and replaced to empower the Commission to review all grants and dispositions of public land issued before 27th August 2010 within five years of the amendment’s commencement. The review can be initiated by the Commission or upon complaints from individuals, communities, or government entities. The Commission is mandated to hear all affected parties, determine the legality of titles, and direct revocation or correction where land was unlawfully or irregularly acquired. Importantly, bona fide purchasers for value without notice of a defect are protected from revocation, and all determinations must be gazetted.
Second, Section 15 has been repealed and replaced to strengthen the handling of historical land injustices. The Commission is now mandated to initiate, receive, investigate and recommend redress for grievances that occurred between 15th June 1895 (when Kenya became a British protectorate) and 27th August 2010 (when the Constitution was promulgated). The Act outlines specific criteria for admitting claims and specifies forms of redress such as restitution, compensation, resettlement, rehabilitation, affirmative action, or revocation of irregular land allocations. Investigations must be completed within one year, and authorities implementing redress are required to act within three years. The provisions on historical injustices will, however, stand repealed five years after the section takes effect.
Lastly, a new Section 26A introduces provisions on the financial management of the Commission, allowing it to open and maintain bank accounts for effective operations. It also prohibits courts from issuing garnishee or charging orders against the Commission’s accounts, safeguarding its financial stability.
Overall, the amendments reinforce the NLC’s mandate to ensure fair land administration, provide justice for historical grievances, and maintain greater institutional independence in handling land matters across Kenya. This move will affect the Real Estate sector by enhancing land governance, transparency and investor confidence. The strengthened mandate of the National Land Commission to review titles and address historical injustices will reduce ownership disputes and improve the credibility of land transactions, fostering a more secure and predictable investment environment.
- Real Estate Investments Trusts (REITs)
On the Unquoted Securities Platform, Acorn D-REIT and I-REIT traded at Kshs 27.4 and Kshs 23.2 per unit, respectively, as per the last updated data on 26th September 2025. The performance represented a 37.0% and 16.0% gain for the D-REIT and I-REIT, respectively, from the Kshs 20.0 inception price. The volumes traded for the D-REIT and I-REIT came in at Kshs 12.8 mn and Kshs 40.6 mn shares, respectively, with a turnover of Kshs 323.5 mn and Kshs 791.5 mn, respectively, since inception in February 2021. Additionally, ILAM Fahari I-REIT traded at Kshs 11.0 per share as of 26th September 2025, representing a 45.0% loss from the Kshs 20.0 inception price. The volume traded to date came in at 1,235,285 shares for the I-REIT, with a turnover of Kshs 1.5 mn since inception in November 2015.
REITs offer various benefits, such as tax exemptions, diversified portfolios, and stable long-term profits. However, the ongoing decline in the performance of Kenyan REITs and the restructuring of their business portfolios are hindering significant previous investments. Additional general challenges include:
- Insufficient understanding of the investment instrument among investors leading to a slower uptake of REIT products,
- Lengthy approval processes for REIT creation,
- High minimum capital requirements of Kshs 100.0 mn for REIT trustees compared to Kshs 10.0 mn for pension funds Trustees, essentially limiting the licensed REIT Trustee to banks only
- The rigidity of choice between either a D-REIT or and I-REIT forces managers to form two REITs, rather than having one Hybrid REIT that can allocate between development and income earning properties
- Limiting the type of legal entity that can form a REIT to only a trust company, as opposed to allowing other entities such as partnerships, and companies,
- We need to give time before REITS are required to list – they would be allowed to stay private for a few years before the requirement to list given that not all companies may be comfortable with listing on day one, and,
- Minimum subscription amounts or offer parcels set at Kshs 0.1 mn for D-REITs and Kshs 5.0 mn for restricted I-REITs. The significant capital requirements still make REITs relatively inaccessible to smaller retail investors compared to other investment vehicles like unit trusts or government bonds, all of which continue to limit the performance of Kenyan REITs.
We expect Kenya’s Real Estate sector to remain resilient, supported by sustained investor confidence and recent regulatory reforms such as the National Land Commission (Amendment) Act 2025 and the Financial Reporting Centre directive requiring real estate agents to register with the Centre. These measures are expected to strengthen transparency, governance and accountability within the property market. In the hospitality segment, the Kenya Airways–Qatar Airways codeshare agreement and the Kenya–Senegal visa exemption deal are set to boost travel, tourism and demand for accommodation and related services. Meanwhile, the performance of REITs, particularly the Acorn D-REIT and I-REIT, continues to reflect investor confidence in structured Real Estate investment products. However, high construction costs, regulatory complexities, and financing challenges remain key constraints to the sector’s optimal performance.
In pursuit of a stable and sustainable economic future, the Kenyan government prioritizes balancing its economic policies, especially regarding the Balance of Payments. Achieving this balance is essential to ensuring stable trade relations, managing capital inflows and outflows, addressing inflationary pressures, and maintaining a favourable exchange rate system. These efforts are geared towards fostering economic growth, creating employment opportunities, and implementing strategic commercial policies, all of which play pivotal roles in Kenya's pursuit of a robust and sustainable economic trajectory. In light of this, we saw it fit to focus on Kenya’s balance of payments to analyse the current state and what can be done to improve it.
We have previously tacked the subject of balance of payments in our topical titled Kenya’s Balance of Payments - released in October 2024, we explored the country's balance of payments, which reflects its economic transactions with other nations. We examined the key components, including the current account and the capital account, and assessed Kenya's performance. Additionally, we analyzed the factors influencing the balance of payments and provided policy recommendations for addressing the situation.
This week, we will review Kenya’s current balance of payment by covering the following:
- Overview of the Balance of Payments,
- The Current State of Kenya’s Balance of Payments,
- Evolution of Kenya’s Balance of Payments,
- Performance Measurements of Kenya’s Balance of Payments,
- Factors Affecting Kenya’s Balance of Payments, and,
- Policy Recommendations and Conclusion.
Section I: Overview of the Balance of Payments
The balance of payments (BOP) is the method by which countries measure all of the international monetary transactions within a certain period. It is a crucial financial record that captures the economic interactions between Kenya and the rest of the world during a specified timeframe. It provides a systematic account of how the country engages with the global economy, encompassing a wide range of economic activities including trade of goods and services, financial investments, and various transfer payments like foreign aid and grants from other nations. The Balance of Payments (BOP) holds significant importance as a key economic metric, offering a concise representation of the movement of resources between a nation and its trade partners. This financial record categorizes transactions into three primary accounts: the Current Account, the Capital Account, and the Financial Account;
- Current Account
The Current Account is one of the primary components of the BoP and tracks transactions related to the day-to-day economic activities of a country with other countries. The component captures transactions of exports and imports of goods and services, income receipts, and payments. It includes four main sub-accounts;
- Balance of Trade (Trade Balance) - This sub-account records the value of Kenya's exports of goods (like tea, coffee, and flowers) and imports of goods (machinery, petroleum, etc.). If Kenya’s exports are more than its imports, it has a trade surplus in this category, otherwise, it has a trade deficit,
- Services Trade - The services trade accounts for the export and import of services such as tourism, transportation, and financial services. Kenya's income from foreign tourists and revenue from providing services to other nations contribute to the services subsection of the current account,
- Income - In this sub-account, Kenya records income flows from its foreign investments (like profits and dividends from foreign-owned assets in Kenya) and income paid to foreign investors holding assets in Kenya, and,
- Current Transfers - This sub-account captures unilateral transfers of funds, including foreign aid, remittances from Kenyan expatriates working abroad, and other gifts or grants from foreign sources.
- Capital Account
The Capital Account in the BoP records capital transfers and transactions involving non-produced, non-financial assets. It may include items like the transfer of ownership of patents, copyrights, and trademarks;
- Capital transfers – They represent transactions involving the transfer of ownership of non-financial assets between a country and other countries which do not result in any corresponding goods, services, or financial claims, and,
- Acquisition/disposal of non-produced, non-financial assets – These are transactions involving the transfer of ownership rights to assets that are neither produced nor considered financial assets, that is, intangible assets such as brand names and trademarks, and rights to use land resources for various economic activities.
- Financial Account
The Financial Account is a crucial component that records financial transactions between Kenya and other countries. It includes;
- Foreign Direct Investment (FDI) - This sub-account tracks the flow of investments where foreign entities directly invest in Kenyan businesses or assets. For example, foreign companies setting up operations in Kenya,
- Portfolio Investment - Portfolio investment includes transactions involving financial assets like stocks and bonds. It reflects foreign investors' purchases of Kenyan securities and Kenyan investors' purchases of foreign securities,
- Reserves Assets - The official reserves sub-account accounts for changes in Kenya's foreign exchange reserves held by the central bank. This can result from currency interventions or other actions affecting reserves, and,
- Other reserves - This covers various financial transactions such as loans, currency, deposits, and trade credits between Kenya and foreign countries.
Other components under financial account include Financial Derivatives and Other Changes in Financial Assets and Liabilities.
Section II: The Current State of Kenya’s Balance of Payments
In this section, we will analyse the individual components of Kenya’s balance of payments.
- Current Account Balance
Kenya’s current account deficit widened by 76.6% to Kshs 83.7 bn in Q2’2025 from the Kshs 47.4 bn deficit recorded in Q2’2024. The y/y expansion of the deficit registered was driven by;
- The widening of the merchandise trade account deficit (the value of import goods exceeds the value of export goods, resulting in a negative net foreign investment) by 11.7% to Kshs 348.4 bn in Q2’2025, from Kshs 311.8 bn recorded in Q2’2024, driven by the 16.5% decline in merchandise exports to Kshs 351.0 bn, from Kshs 420.2 bn in Q2’2024, compared to the 4.5% decline in merchandise imports to Kshs 699.4 bn from Kshs 732.0 bn recorded in a similar period in 2024, and,
- A 7.5% decline in the services trade balance (the difference between the imports and exports of services) to a surplus of Kshs 65.5 bn from a surplus of Kshs 70.8 bn in Q2’2024, driven by a 2.6% increase in services receipts to Kshs 259.8 bn from Kshs 253.2 bn recorded in Q2’2024, compared to the 6.6% increase in services outflows to Kshs 194.4 bn from Kshs 182.4 bn recorded in Q2’2024.
The table below shows the breakdown of the various current account components on a year-on-year basis, comparing Q2’2025 and Q2’2024:
|
Cytonn Report: Q2’2025 Current Account Balance |
|||
|
Item |
Q2'2024 |
Q2’2025 |
Y/Y % Change |
|
Merchandise Trade Balance |
(311.8) |
(348.4) |
11.7% |
|
Service Trade Balance |
70.8 |
65.5 |
(7.5%) |
|
Primary Income Balance |
(45.2) |
(43.8) |
(3.1%) |
|
Secondary Income (Transfers) Balance |
238.8 |
243.1 |
1.8% |
|
Current Account Balance |
(47.4) |
(83.7) |
76.6% |
Source: Kenya National Bureau of Statistics (KNBS), All values in Kshs bn
We observe that, over the last ten years, Kenya’s current account balance has been running deficits, implying that the country relies more on the outside world for its goods and services. The current account deficit as a percentage of GDP was at 2.3% in 2024. The current account deficit is projected to narrow at 1.7% of GDP in 2025 due to lower import costs driven by a stronger Kenyan shilling, improved export performance supported by favorable weather and agricultural output, and sustained inflows from diaspora remittances and the financial account. The chart below shows the current account deficit over the last 10 years;
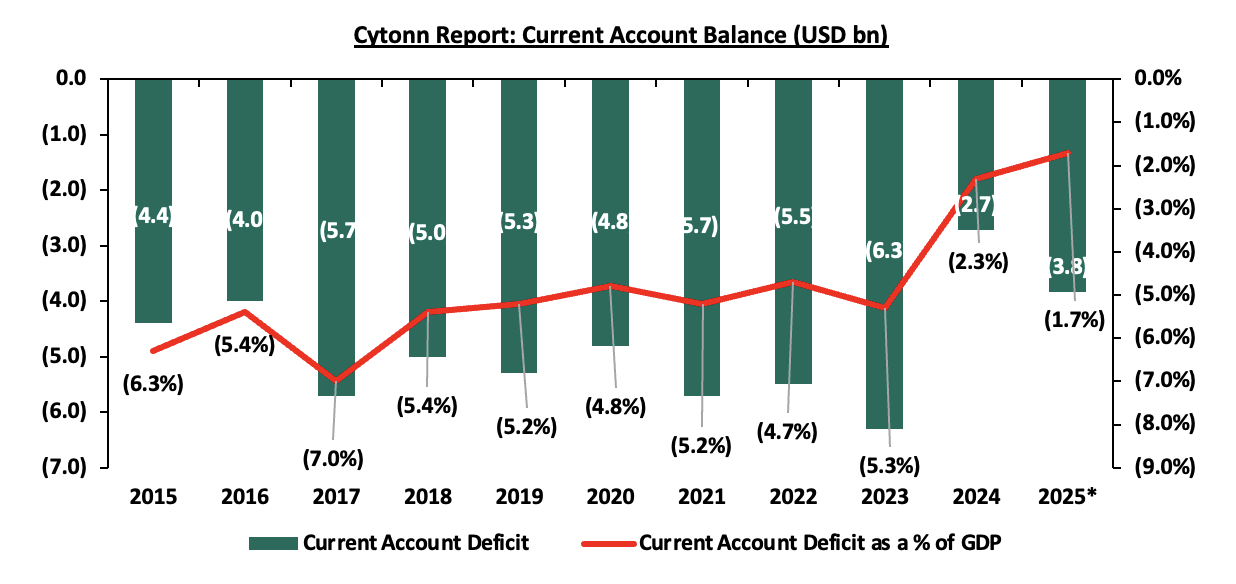
Source: CBK, IMF Data *projected for 2025
- Financial Account and Capital Account
The financial account balance represents the difference between domestic buyers' purchases of foreign assets and foreign buyers' acquisitions of domestic assets. A surplus contributes positively to the balance of payments, while a deficit subtracts from it. This balance reflects the claims or obligations related to financial assets involving non-residents, where an increase in domestic ownership of foreign assets is an outflow and decreases the financial account of the country, while an increase in foreign ownership of domestic assets is an inflow and increases the financial account. The financial account balance recorded a deficit of Kshs 136.5 (USD 1.1 bn) bn in Q2’2025, a significant increase of 282.8% from the deficit of Kshs 35.7 bn (USD 0.3 bn) recorded in Q2’2024, and a 180.7% increase from the deficit of Kshs 48.6 bn (USD 0.4 bn) in Q1’2025. A key point to note is that a deficit in the financial account indicates that there are more investment funds flowing out of the country than inflows, while a surplus in the financial account means that more investment funds are flowing into the country than out, indicating that foreign investors are purchasing more domestic assets than domestic investors are acquiring foreign assets, leading to a net inflow of capital. The chart below shows the trend in the financial account in USD bn over the last ten years;
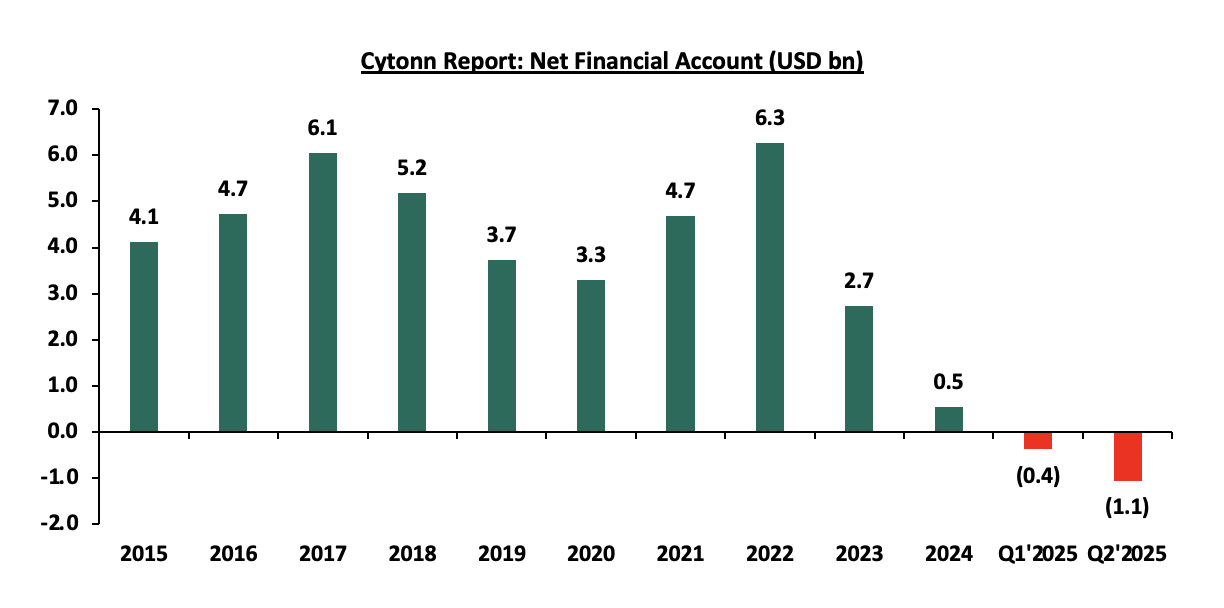
Source: World Bank Data, KNBS Data
On the other hand, the capital account balance increased by 118.9% to a surplus of Kshs 17.6 bn (USD 136.2 mn) in Q2’2025 up from a surplus of Kshs 8.0 bn (USD 61.5 mn) in Q2’2024. Notably, the capital account has shown mixed performance over the past 10 years, with a negative 10-year compound annual growth rate (CAGR) of 1.2%, declining to USD 231.8 mn in 2024 from USD 262.0 mn in 2015. This decline is partly due to a decline in foreign direct investment and capital flight, as many foreign direct investors have become hesitant to invest in the country. Below is a chart highlighting the movement of the capital account in USD mn over the last 10 years;
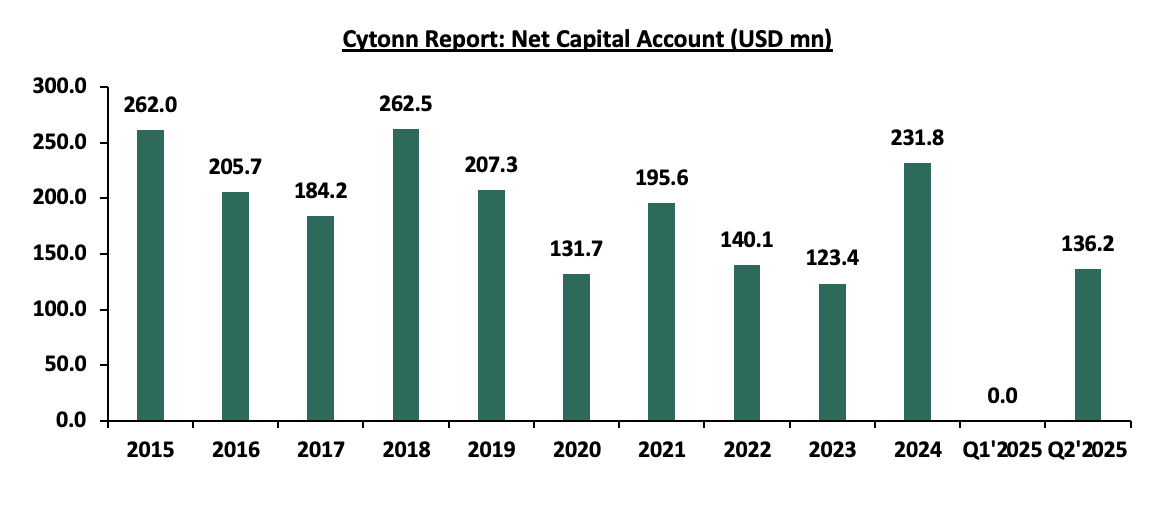
Source: World Bank Data, KNBS Data
Section III: Evolution of Balance of Payments
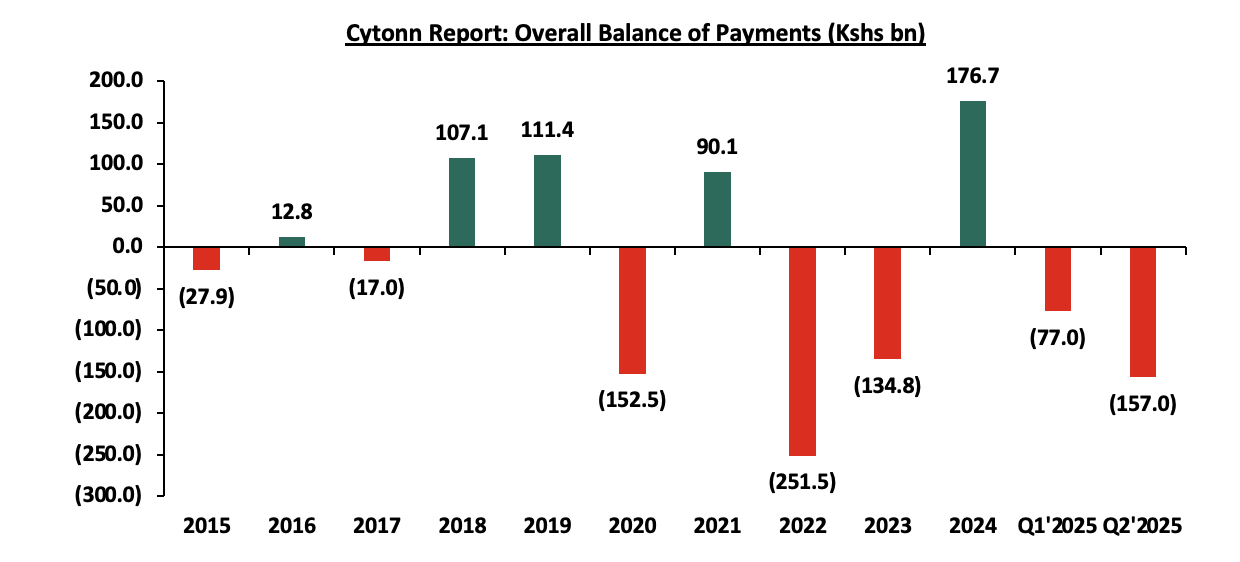
Kenya’s overall balance of payments has been fluctuating over the years, with the balance of payments standing at a deficit of Kshs 157.0 bn in Q2’2025, a significant deterioration from the Kshs 77.0 bn deficit recorded in Q1’2025, and the deficit of Kshs 84.1 bn recorded in Q2’2024. The performance is attributable to the widening in the running current account deficit and the financial account deficit. However, the overall balance of payments has been mainly supported by the capital account, which has increased significantly by 118.9% on a year-on-year basis to Kshs 17.6 bn in Q2’2025 from Kshs 8.0 bn in Q2’2024. Below is a graph highlighting the trend in Kenya’s balance of payments over the last ten years;
Source: Kenya National Bureau of Statistics (KNBS)
Key take-outs from the chart include;
- In 2024 the balance of payment ended the year at a surplus of Kshs 176.7 bn, up from a deficit of Kshs 134.8 bn in 2023, mainly driven by an 81.0% improvement in the capital account balance to Kshs 31.2 bn in FY’2024, from Kshs 17.3 bn in FY’2023, and the 45.4% narrowing in current account deficit to Kshs 208.9 bn in FY’2024 from Kshs 383.7 bn recorded in a similar period in 2023. The performance was however weighed down by a 0.6% decrease in the financial account balance to a surplus of Kshs 246.5 bn from a surplus of Kshs 247.9 bn in FY’2023,
- Kenya’s balance of payment (BoP) position deteriorated by 313.8% in Q1’2025, to a deficit of Kshs 77.0 bn, from a surplus of Kshs 36.0 bn in Q1’2024. The y/y negative performance in BoP was mainly driven by a significant 575.7% increase in financial account deficit to Kshs 48.6 bn from Kshs 7.2 bn in Q1’2024, and,
- The balance of payment deteriorated significantly by 86.6% in Q2’2025, to a deficit of Kshs 157.0 bn, from a deficit of Kshs 84.1 bn in Q2’2024. The y/y negative performance in BoP was mainly driven by a significant 282.8% increase in financial account deficit to Kshs 136.5 bn from a deficit of Kshs 35.7 bn in Q2’2024. The performance was, however, supported by a significant 118.9% improvement in the capital account balance to a surplus of Kshs 17.6 bn from a surplus of Kshs 8.0 bn in Q2’2024.
Looking ahead, we anticipate that the balance of payments will remain in surplus, primarily supported by strong financial account inflows from Eurobond proceeds, sustained diaspora remittances, and increased investor confidence. Additional support is expected from a stable shilling, expanding trade opportunities through agreements with the EU, EAC, SADC, and COMESA, improved agricultural output driven by favorable weather and subsidy programs, and prudent fiscal and monetary policies. However, the expiration of the African Growth and Opportunity Act (AGOA) and the imposition of U.S. tariffs pose a significant risk to export earnings, which could undermine the sustainability of this surplus and exert pressure on the current account balance.
Section IV: Performance Measurements of Balance of Payments
Balance of payments is influenced by several factors which include;
- Exports and Imports
Exports are goods and services that a country sells to other countries. Exports affect the balance of payment by increasing the value of goods and services sold to other countries and reducing the trade deficit. Exports also form a major source of foreign currency, which contributes to the stability of the domestic currency against other currencies. Imports on the other hand are goods and services that a country buys from other countries. Imports affect the balance of payment by offsetting the value of goods and services sold to other countries and thereby increasing the trade deficit. An increase in the value of imports also reduces the foreign currency reserves and the current account balance.
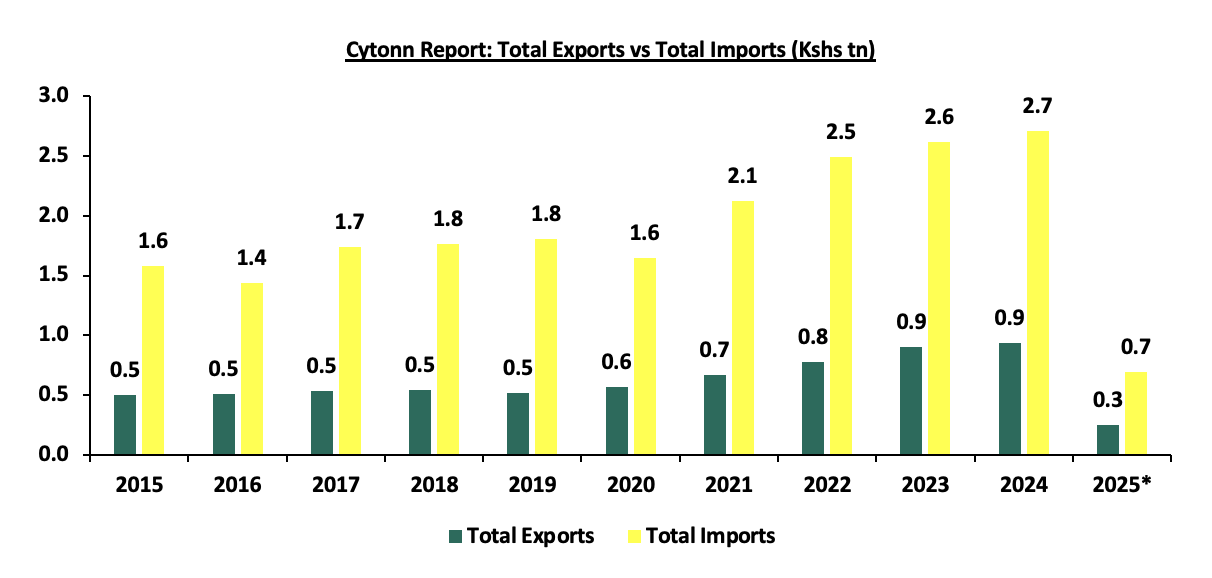
Over the last ten years, Kenya’s annual value of imports has averaged Kshs 2.0 tn, higher than the average annual value of exports of Kshs 0.6 tn, hence resulting in running trade deficits over the period. However, over the same period, exports registered a compounded annual growth rate of 6.4% to Kshs 0.9 tn in 2024 from Kshs 0.5 tn in 2015, which outpaced that of imports at 5.5% to Kshs 2.7 tn in 2024 from Kshs 1.6 tn in 2015, attributable to the government’s efforts to diversify the country’s export base and boost export-oriented sectors like agriculture as well as increased access to regional and international markets. The chart below shows the total imports and exports over the last ten years;
Source: KNBS, *Provisional figures (as of Q2’2025)
- Foreign Direct Investments
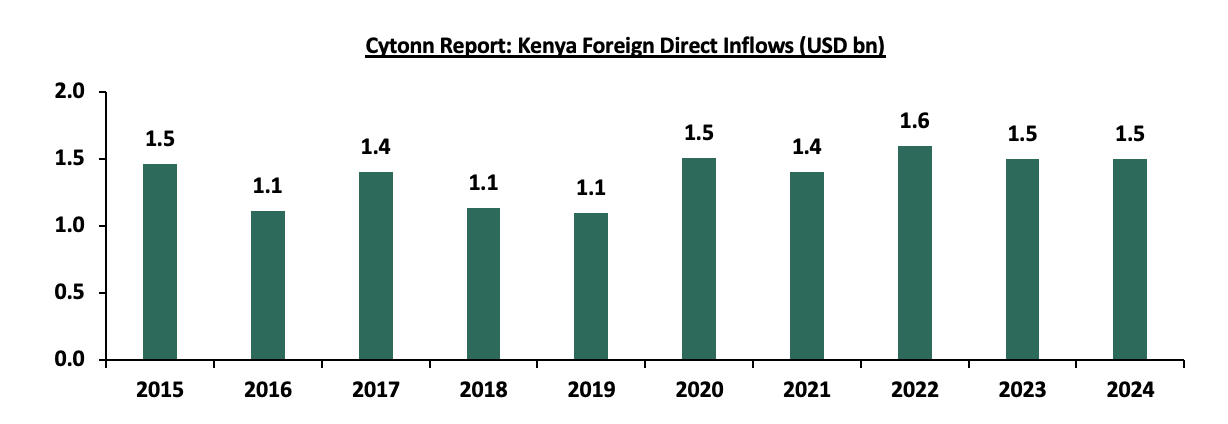
A Foreign direct investment (FDI) is an investment by a business or an individual in one country in an enterprise in another country with the intention of establishing a lasting interest. In 2024, FDI inflows decreased by 0.1% to remain relatively unchanged from the USD 1.5 bn recorded in 2023, attributed to policy changes, including a 10-year cap on incentives for Special Economic Zone (SEZ) developers and the introduction of a significant economic presence rule, which reduced the country's appeal to digital investors.
FDI can improve the current account of the BOP by increasing the exports of goods and services from the host country to the foreign market. This is especially true if the FDI is in export-oriented sectors or if the foreign investor uses local inputs and suppliers. A good example is FDI in Kenya’s horticulture sector which has boosted its exports of flowers, fruits, and vegetables to Europe and other regions. FDI can also worsen the current account of the BOP by increasing the imports of goods and services from the foreign market to the host country if the FDI is in import-dependent sectors. The chart below shows Kenya’s FDI inflows over the last ten years;
Source: UNCTAD World Investments Report
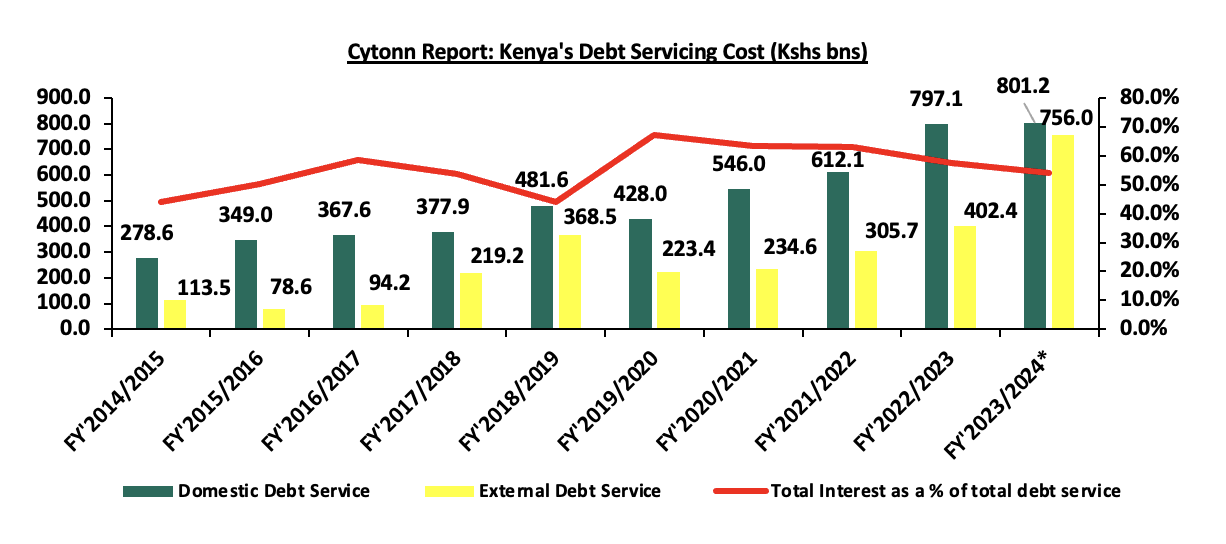
- Debt
Kenya’s debt stock has been on the rise over the years mainly due to a widening fiscal deficit coupled with increased debt servicing costs. Key to note, the country’s debt stood at Kshs 11.8 tn as of June 2025, equivalent to 67.7% of GDP and 17.7% points above the IMF recommended threshold of 50.0% for developing nations. Despite the high debt burden, Kenya’s gross reserves remain adequate, bolstered by proceeds from the USD 1.5 billion Eurobond issued in October 2025, which eased immediate external financing pressures and helped stabilize the balance of payments in the short-term. The graph below shows the debt servicing costs over the last ten fiscal years:
Source: National Treasury, *Provisional figures
The country’s debt service to revenue ratio decreased by 3.8% points to 64.2% in the FY’2024/2025 down from 68.0% observed in FY’2023/2024 and remained a significant 34.2% points above the IMF’s recommended threshold of 30.0%. Notably, Kenya’s debt service-to-revenue ratio stood at 76.4% as of the end of September 2025. This level remains well above the recommended threshold, indicating continued fiscal pressure and limited budgetary flexibility. While the successful Eurobond buyback in February 2025 helped reduce short-term credit risk, it has not yet translated into a meaningful reduction in the debt service burden. The situation is, however, still at risk from global supply disruptions accelerated by the ongoing geo-political tensions in the Israel-Palestine conflicts. Below is a chart showing the debt service to revenue ratio for the last ten fiscal years;
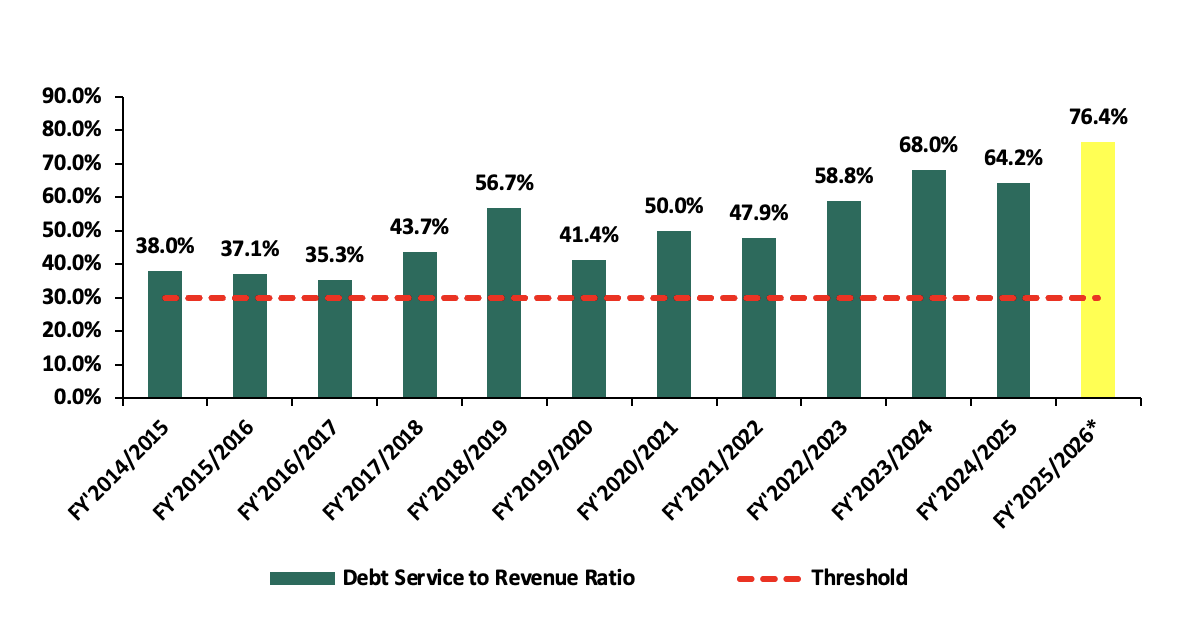
Source: National Treasury, *Provisional figures as of September 2025
Balance of payments deficit indicates that the country is spending more than it is receiving. As such, it is forced to borrow more money to pay for goods and services from the rest of the world. In the long term, a country becomes a net consumer and not a net producer of global economic output which leads to more debt requirements. Additionally, a persistent deficit may necessitate the selling of some of the resources to pay its creditors.
Section V: Factors Affecting Balance of Payments
The balance of payment reflects the economic interaction of a nation with the rest of the world over a specific period. Several factors not limited to economic, political, government policies, global economic conditions as well as currency, determine the state of balance of payment of a nation. These factors include:
- Balance of Trade - When a country’s value of exports of goods and services is more compared to its imports, then it has a trade surplus. This in turn is a good indicator of the balance of payments as it means the inflows outrun the outflows. Further, more import value of goods and services of a country compared to the export value is called a trade deficit and is viewed as an indicator of a poor balance of payment as the nation is spending more on imports than its earnings, which negatively affects the balance of payment,
- Foreign Direct Investment (FDI) - FDI refers to foreign investments in terms of business interests and assets into a foreign country. This in turn increases the inflow of foreign exchange, the development of new technology, increased employment opportunities as well as increased tax revenues. In turn, an increase in FDI is favourable to the balance of payment while a decrease has a negative effect on the country’s BoP,
- Exchange rates - When market forces or deliberate government policies depreciate the currency of a nation, the prices of exports in foreign markets are cheaper compared to the imports. In turn, the export inflows increase due to an increase in demand, resulting from cheaper prices, while the imports decrease as the inflated import prices reduce consumption appetite,
- Economic growth rate - When the differential rate of GDP growth across countries increases, the country’s attractiveness of its assets increases, which in turn leads to increased capital flows. This can be in the form of portfolio investments, loans, and other capital flows. Consequently, this will lead to an improved balance of payment account, by improving the financial account,
- Inflation - When a country’s inflation rate increases compared to its trade partners, the home prices of goods and services increase, which reduces the demand for the country’s exports. Additionally, high inflation increases the cost of imports as they are cheaper compared to domestic products being exported to other countries. In turn, this can lead to a deficit in the BoP,
- Government policies - The government can enact policies that are geared to encourage exports or to reduce the value of imports, which is meant to improve the trade surplus. Some of the policies can be imposing tariffs, quotas on imports, or a total import ban on a product, to reduce the value of imports. Such policies can affect the financial account of the BoP. Tighter controls may prevent foreign investment and restrict outflows, potentially causing capital flight and negatively impacting the balance of payments,
- Global economic conditions and Policies - The balance of payments is highly sensitive to shifts in global economic trends and policy decisions. Factors such as fluctuations in commodity prices, global inflation, interest rate changes, and economic slowdowns or recessions in major economies can significantly affect a country’s trade performance, capital inflows, remittance levels, and overall financial transactions. Moreover, changes in international trade policies can have direct consequences on export competitiveness and market access. For instance, the expiration of the African Growth and Opportunity Act (AGOA) on 30th September 2025 and the imposition of a 10% U.S. tariff on Kenyan exports eliminate preferential access to the U.S. market for key goods like textiles, apparel, and agricultural products, raising their cost and reducing competitiveness. These changes are expected to lower export volumes and earnings, weaken the trade balance, and strain the current account—ultimately putting pressure on the overall balance of payments, particularly if alternative markets or trade agreements fail to fully offset the loss.
- Excessive government borrowing - High levels of foreign debt can increase a country’s risk of financial crises, which can make investors pessimistic about the government’s ability to service debt. As a result, it can lead to the withdrawal of investments, and capital flight as well as negatively impact the financial account of the BoP, and,
- Remittances - Money sent home by citizens working abroad significantly impacts Kenya’s balance of payments, primarily through the current account. These inflows increase foreign exchange reserves, support household consumption, and reduce the need for external borrowing. Remittances are consistently among the top sources of foreign exchange, often surpassing earnings from traditional exports like tea and horticulture. Additionally, when remittances are invested in real estate, business ventures, or financial instruments, they are recorded under the financial account as capital inflows. Therefore, a decline in remittance flows can negatively affect both the current and financial account balances, potentially widening the overall BoP deficit.
- Interest Rates - Fluctuations in a country’s interest rates can influence capital flows, as higher interest rates often attract foreign capital, improving the financial account of the balance of payments. Conversely, low interest rates can encourage capital outflows as investors seek higher returns abroad, potentially leading to a deterioration in the balance of payments,
Section VI: Policy Recommendations and Conclusion
To establish a balance of payment surplus, every government must implement policies that benefit the BOP's health by increasing exports while decreasing imports. As a result, we propose the following specific recommendations for the government to reduce the BoP deficit and enhance the overall status of the BoP account:
- Encourage export diversification - the government should shift from complete over-reliance on traditional exports like tea, horticulture, and coffee, through diversification in promoting value-added processing and manufacturing to increase export revenue,
- Reducing Imports - The government should carefully cut down on imports and only import what is needed while encouraging domestic production of some of the imports. This can be achieved through the introduction of import restrictions like quotas and tariffs. Notably, this should be carefully done to strike a balance between domestic industry protection as well protecting existing trade relationships with other nations,
- Export promotion - The government can employ different strategies to encourage more export volumes and produce. This can be done through actively engaging in trade pacts that favour Kenyan exports in new markets. Additionally, the government can provide export incentives and subsidies to increase Kenyan products’ price competition in foreign markets. For example, Kenya entered into a Comprehensive Economic Partnership Agreement (CEPA) with the United Arab Emirates (UAE) to increase exports to the UAE,
- Encouraging Foreign Direct Investment (FDI)- The government should be strategic in creating an attractive investment environment for foreign investments through improving regulatory transparency as well as reducing hurdles in the process. The Kenyan government can target key investment sectors of global interest like the Renewable energy sector and Sustainable Energy Development Goals (SEDG), and make it favourable for foreign investors,
- Increase agricultural produce- the government should support small-scale farmers with improved agricultural technology and quality inputs, as well as improved access to credit. This will help increase agricultural productivity, thus increasing exports, while reducing the dependence on some of the unnecessary agricultural imports like sugar and wheat, and,
- Maintaining a sustainable debt level- The government should also strike a balance between foreign borrowing which helps increase the foreign reserves, while maintaining a good credit score with its creditors. This ensures that the country remains attractive for investors’ capital and financial flows.
The country’s balance of payments continues to be weighed down by the persistent current account deficit. This has been brought about by the high costs of debt servicing as well as the high import dependency and slower export growth. The government has a significant role to play in managing the debt levels, reducing the fiscal deficit, and restoring economic stability to improve the balance of payments position. Looking ahead, Kenya’s balance of payments looks optimistic, driven by growth in key export sectors, fiscal consolidation, and sustained diaspora remittances which are expected to improve the current account balance. We note that the current administration’s focus on fiscal consolidation will improve the balance of payments performance by reducing the costs of servicing external debts through the change of the public debt mix in the FY’2025/26 budget to consist of 31.9% external financing and 68.1% domestic financing. Moreover, the fertilizer subsidy program is expected to lower the costs of farm inputs, enhance agricultural production in the country, and increase exports of agricultural products. Furthermore, the ongoing stability of the Kenyan Shilling against most trading currencies is expected to lower the import bill hence narrowing the current account deficit. We also expect that multilateral trade partnership deals such as the one between Kenya and the EU and the one among the EAC, SADC, and COMESA, will boost the amount and variety of exports that are needed and offer more opportunities to sell them. Additionally, with the expiration of the African Growth and Opportunity Act (AGOA) on 30th September 2025, the government has proactively pursued alternative trade frameworks, implementing the EU's Economic Partnership Agreement (EPA) and signing a new Comprehensive Economic Partnership Agreement (CEPA) with the UAE, to offset the expected loss in preferential market access and sustain export growth. However, the government needs to reduce the country’s overreliance on debt and imports. One of the best ways to achieve this is to promote domestic production and attract foreign direct investments, especially in export-oriented sectors, to boost the country’s export values.
Disclaimer: The views expressed in this publication are those of the writers where particulars are not warranted. This publication, which is in compliance with Section 2 of the Capital Markets Authority Act Cap 485A, is meant for general information only and is not a warranty, representation, advice, or solicitation of any nature. Readers are advised in all circumstances to seek the advice of a registered investment advisor.

- Talk to us
- Kenya
- P.O Box 20695 - 00200, Nairobi, Kenya
- Cell +254709101200
- Tel +254709101200
- WhatsApp +254741676635
- United States
- +254709101200
- DOWNLOAD OUR APP
-


- Kenya
- 8th Floor, Pinetree Plaza, Kaburu Drive, Ngong Road, Nairobi, Kenya
- USA
- Suite 1150, 1775 Eye Street NW, USA, Washington DC 20006, USA
- Investments
- High Yield
- Private Equity
- Real Estate
- Real Estate
- RiverRun Estates
- Cytonn Towers
- The Ridge
- Taraji Heights
- The Alma