Kenya’s Credit Reference Bureau Framework, & Cytonn Weekly #46/2022
By Cytonn Research, Nov 20, 2022
Executive Summary
Fixed Income
During the week, T-bills remained oversubscribed, albeit at a lower rate, with the overall subscription rate declining to 170.8%, from the 204.5% recorded the previous week. The lower subscription is partly attributable to tightened liquidity in the money market with the average interbank rate increasing to 4.4% from 4.2% recorded the previous week. Investor’s preference for the shorter 91-day paper persisted, with the paper receiving bids worth Kshs 16.3 bn against the offered Kshs 4.0 bn, translating to a subscription rate of 406.3%, down from 662.8% recorded the previous week. The subscription rates for the 364-day and 182-day papers increased to 89.5% and 158.0% from 86.8% and 138.9%, respectively recorded the previous week. The yields on the government papers recorded mixed performance, with the yields on the 182-day and 91-day papers increasing by 1.5 bps and 1.8 bps to 9.7% and 9.2%, respectively, while the yield on the 364-day paper declined by 0.5 bps to 10.2%;
During the week, the Energy and Petroleum Regulatory Authority (EPRA) released their monthly statement on the maximum retail fuel prices in Kenya effective 15th November 2022 to 14th December 2022. Super Petrol, Diesel and Kerosene prices declined by Kshs 1.0 to Kshs 179.3 per litre, Kshs 162.0 per litre and Kshs 145.9 per litre from Kshs 178.3 per litre, Kshs 163.0 per litre and Kshs 146.9 per litre, respectively, translating to a 0.6%, 0.6%, and 0.7% decline, respectively. Additionally, the National Treasury gazetted the revenue and net expenditures for the first four months of FY’2022/2023, ending 31st October 2022, highlighting that the total revenue collected as at the end of October 2022 amounted to Kshs 636.4 bn, equivalent to 89.2% of the prorated estimates of Kshs 713.9 bn. The total expenditure amounted to Kshs 881.5 bn, equivalent to 74.6% of the prorated estimates of Kshs 1,181.5 bn;
The Monetary Policy Committee (MPC) is set to meet on Wednesday, 23rd September 2022 to review the outcomes of its previous policy decisions and to determine the direction of the Central Bank Rate (CBR) and any other policy measure such as the Cash Reserve Ratio (CRR). We expect the MPC to raise the CBR by 25.0 bps to 8.50%, from the current 8.25% and closely monitor the inflation levels given the persistently high food and fuel prices;
Equities
During the week, the equities market recorded mixed performance with NASI and NSE 25 gaining by 0.7% and 1.4% respectively, while NSE 20 declined by 0.1% taking their YTD performance to losses of 22.8%, 13.0% and 16.7% for NASI, NSE 20 and NSE 25 respectively. The equities market performance was mainly driven by gains recorded by stocks such as KCB, EABL and Equity Group of 5.6%, 4.9%, and 3.8% respectively. The gains were, however, weighed down by losses recorded by banking stocks such as NCBA Group and Diamond Trust Bank (DTB-K) of 3.5% and 2.3% respectively;
During the week, the International Finance Corporation (IFC) disclosed that it would extend USD 100.0 mn (Kshs 12.2 bn) to Diamond Trust Bank (DTB) under the WCS COVID-19 FIGE response facility in form of a senior debt investment with 24-month maturity and renewable once on an aggregate of up to 36 months. Also during the week, The Central Bank of Kenya (CBK), released the Commercial Banks’ Credit Survey Report for the quarter ended September 2022, highlighting that banking sector’s loan book recorded a 12.6% y/y growth, with gross loans increasing to Kshs 3.6 tn in September 2022, from Kshs 3.2 tn in September 2021. On a q/q basis, the loan book increased by 2.9% from Kshs 3.5 tn in June 2022;
Additionally, Co-operative Bank of Kenya and KCB Group released their Q3’2022 financial results, indicating an increase in core earnings per share of 47.0% and 21.4% to Kshs 2.5 and Kshs 9.5 respectively;
Real Estate
During the week, local retailer Naivas Supermarket opened a new outlet at Ruai, opposite Ruai Market. In the hospitality sector, global hospitality chain Hilton Hotel, announced plans to open a new hotel in Westlands dubbed Kwetu Nairobi in February 2023. In the Real Estate Investment Trusts (REITs) segment, Fahari I-REIT closed the week trading at an average price of Kshs 6.6 per share on the Nairobi Stock Exchange, a 0.6% decline from Kshs 6.6 per share re the previous week, while Acorn D-REIT and I-REIT closed the week trading at Kshs 23.8 and Kshs 20.9 per unit, respectively, on the Unquoted Securities Platform as at 11th November 2022, a 19.2% and 4.4% gain for the D-REIT and I-REIT, respectively, from the Kshs 20.0 inception price;
Focus of the Week
Last week, in our Cytonn weekly #45/2022, we took a look at Kenya’s Private Sector Credit growth, in which we highlighted that, currently at 26.1% of GDP, Kenya’s Private Sector Credit continues to lag behind other economies. In 2020, Kenya’s Private Sector Credit growth at 32.1% of the GDP was outperformed when compared to advanced economies such as the United States of America and Japan at 216.0% and 192.8%, respectively, as well as Sub-Saharan economies such as South Africa and Mauritius at 112.0% and 95.9%, respectively. We recommended that, there is need to streamline the credit market for transparency and credibility to enhance credit uptake in the country, by reviewing the current credit rating framework. Similarly, the new administration has set it out to overhaul the credit rating system to increase access to credit. The Central Bank of Kenya announced that it had updated the Credit Information Sharing Framework in November 2022, which mandated the Credit Reference Bureaus (CRBs) not to use negative credit scores as the only reason to deny credit, and recommended the fast implementation of the risk based pricing model by commercial banks. Additionally, the CBK announced the rollout of the Credit Repair Framework in November 2022, which waived off 50.0% of non-performing mobile phone digital loans by commercial banks, microfinance banks and mortgage finance companies outstanding at the end of October 2022 for six months, up to end of May 2023. As such, we saw it fit to cover a topical on the Credit Reference Bureau (CRB) Framework in Kenya to analyse on the background and the role of the CRB of the CRB in Kenya, and therefore give our recommendations on the areas to improve the current CRB framework;
Investment Updates:
- Weekly Rates:
- Cytonn Money Market Fund closed the week at a yield of 10.7%. To invest, dial *809# or download the Cytonn App from Google Playstore here or from the Appstore here;
- Cytonn High Yield Fund closed the week at a yield of 13.9% p.a. To invest, email us at sales@cytonn.com and to withdraw the interest, dial *809# or download the Cytonn App from Google Playstore here or from the Appstore here;
- We continue to offer Wealth Management Training every Wednesday and every third Saturday of the month, from 9:00 am to 11:00 am, through our Cytonn Foundation. The training aims to grow financial literacy among the general public. To register for any of our Wealth Management Trainings, click here;
- If interested in our Private Wealth Management Training for your employees or investment group, please get in touch with us through wmt@cytonn.com;
- Any CHYS and CPN investors still looking to convert are welcome to consider one of the five projects currently available for assignment, click here for the latest term sheet;
- Cytonn Insurance Agency acts as an intermediary for those looking to secure their assets and loved ones’ future through insurance namely; Motor, Medical, Life, Property, WIBA, Credit and Fire and Burglary insurance covers. For assistance, get in touch with us through insuranceagency@cytonn.com;
- Cytonnaire Savings and Credit Co-operative Society Limited (SACCO) provides a savings and investments avenue to help you in your financial planning journey. To enjoy competitive investment returns, kindly get in touch with us through clientservices@cytonn.com;
Real Estate Updates:
- For an exclusive tour of Cytonn’s real estate developments, visit: Sharp Investor's Tour, and for more information, email us at sales@cytonn.com;
- Phase 3 of The Alma is now ready for occupation and the show house is open daily. To rent please email properties@cytonn.com;
- We have 8 investment-ready projects, offering attractive development and buyer targeted returns; See further details here: Summary of Investment-ready Projects;
- For Third Party Real Estate Consultancy Services, email us at rdo@cytonn.com;
- For recent news about the group, see our news section here;
Hospitality Updates:
- We currently have promotions for Staycations. Visit com/offers for details or email us at sales@cysuites.com
During the week, T-bills remained oversubscribed, albeit at a lower rate, with the overall subscription rate declining to 170.8%, from the 204.5% recorded the previous week. The lower subscription is partly attributable to tightened liquidity in the money market with the average interbank rate increasing to 4.4% from 4.2% recorded the previous week. Investor’s preference for the shorter 91-day paper persisted, with the paper receiving bids worth Kshs 16.3 bn against the offered Kshs 4.0 bn, translating to a subscription rate of 406.3%, down from 662.8% recorded the previous week. The subscription rates for the 364-day and 182-day papers increased to 89.5% and 158.0% from 86.8% and 138.9%, respectively recorded the previous week. The yields on the government papers recorded mixed performance, with the yields on the 182-day and 91-day papers increasing by 1.5 and 1.8 bps to 9.7% and 9.2%, respectively, while the yield on the 364-day paper declined by 0.5 bps to 10.2%.
In the Primary Bond Market, the government is seeking to raise an additional Kshs 5.0 bn for infrastructure projects by offering a tap sale of the recent November infrastructure bond, IFB1/2022/14. The tap sale period ends on 22nd November 2022 or upon attainment of the Kshs 5.0 bn quantum. Key to note, the tap sale coupon rate is pegged at 13.9%, the highest yield in the bonds market. Given the attractive tax-free nature of the infrastructure bond, high interest rates and the initial bond oversubscription at 153.1%, we anticipate an oversubscription for the tap sale.
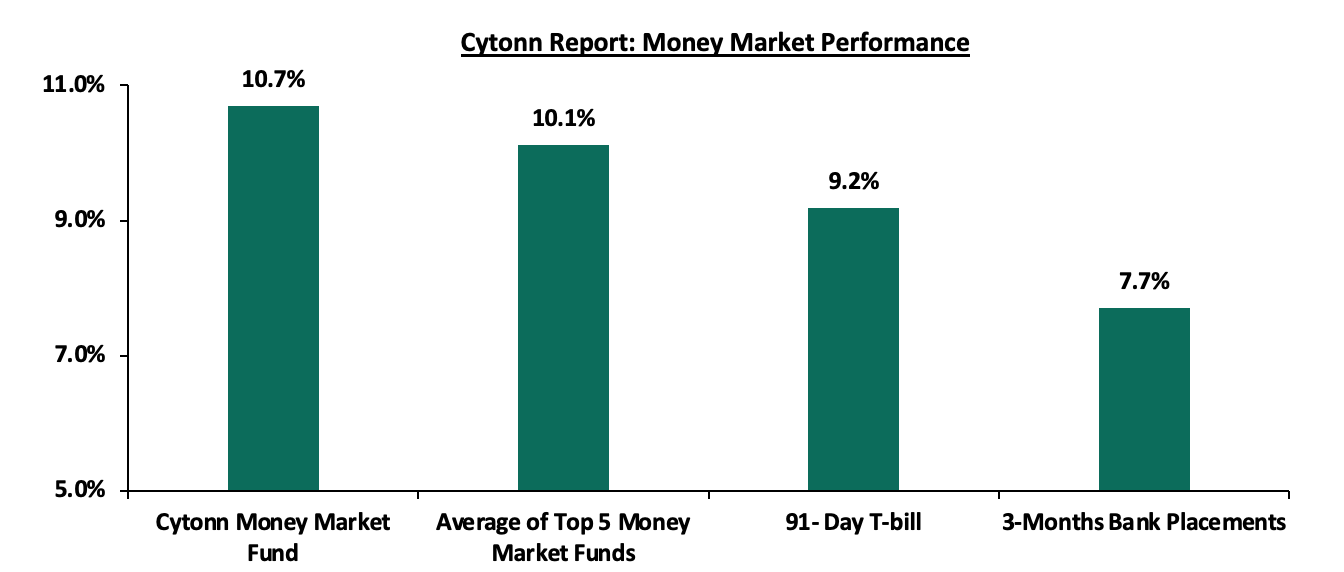
In the money markets, 3-month bank placements ended the week at 7.7% (based on what we have been offered by various banks), while the yield on the 91-day T-bill increased by 1.8 bps to 9.2%. The average yield of the Top 5 Money Market Funds increased to 10.1% from 9.8% recorded the previous week while the Cytonn Money Market Fund remained unchanged at 10.7%.
The table below shows the Money Market Fund Yields for Kenyan Fund Managers as published on 18th November 2022:
|
Cytonn Report: Money Market Fund Yield for Fund Managers as published on 18th November 2022 |
||
|
Rank |
Fund Manager |
Effective Annual Rate |
|
1 |
GenCap Hela Imara Money Market Fund |
10.8% |
|
2 |
Cytonn Money Market Fund |
10.7% |
|
3 |
Zimele Money Market Fund |
9.9% |
|
4 |
NCBA Money Market Fund |
9.7% |
|
5 |
Sanlam Money Market Fund |
9.6% |
|
6 |
Dry Associates Money Market Fund |
9.4% |
|
7 |
Nabo Africa Money Market Fund |
9.3% |
|
8 |
Apollo Money Market Fund |
9.3% |
|
9 |
Old Mutual Money Market Fund |
9.2% |
|
10 |
Co-op Money Market Fund |
9.2% |
|
11 |
Madison Money Market Fund |
9.2% |
|
12 |
CIC Money Market Fund |
9.1% |
|
13 |
AA Kenya Shillings Fund |
9.0% |
|
14 |
British-American Money Market Fund |
8.9% |
|
15 |
ICEA Lion Money Market Fund |
8.6% |
|
16 |
Orient Kasha Money Market Fund |
8.6% |
|
17 |
Absa Shilling Money Market Fund |
7.6% |
|
18 |
Equity Money Market Fund |
5.4% |
Source: Business Daily
Liquidity:
During the week, liquidity in the money markets tightened, with the average interbank rate increasing to 4.4% from 4.2% recorded the previous week, partly attributable to tax remittances offsetting government payments. The average interbank volumes traded increased by 81.7% to Kshs 21.1 bn from Kshs 11.6 bn recorded the previous week.
Kenya Eurobonds:
During the week, the yields on Eurobonds were on a downward trajectory, an indication of declining risk concerns over the economy. The yield on the 10-year Eurobond issued in 2014 declined the most by 1.4% points to 11.4% from 12.8% recorded in the previous week. The table below shows the summary of the performance of the Kenyan Eurobonds as of 17th November 2022;
|
Cytonn Report: Kenya Eurobond Performance |
||||||
|
|
2014 |
2018 |
2019 |
2021 |
||
|
Date |
10-year issue |
10-year issue |
30-year issue |
7-year issue |
12-year issue |
12-year issue |
|
3-Jan-22 |
4.4% |
8.1% |
8.1% |
5.6% |
6.7% |
6.6% |
|
31-Oct-22 |
15.6% |
13.9% |
13.2% |
14.7% |
14.1% |
12.7% |
|
10-Nov-22 |
12.8% |
11.5% |
11.6% |
11.3% |
11.6% |
10.1% |
|
11-Nov-22 |
11.6% |
10.3% |
11.1% |
10.4% |
10.8% |
9.9% |
|
14-Nov-22 |
11.6% |
10.4% |
11.1% |
10.5% |
10.8% |
9.9% |
|
15-Nov-22 |
11.3% |
10.1% |
10.9% |
10.4% |
10.6% |
9.6% |
|
16-Nov-22 |
11.2% |
10.1% |
10.9% |
10.3% |
10.6% |
9.6% |
|
17-Nov-22 |
11.4% |
10.2% |
10.9% |
10.5% |
10.6% |
9.7% |
|
Weekly Change |
(1.4%) |
(1.3%) |
(0.7%) |
(0.8%) |
(1.0%) |
(0.4%) |
|
MTD Change |
(4.1%) |
(3.7%) |
(2.3%) |
(4.2%) |
(3.6%) |
(2.9%) |
|
YTD Change |
7.0% |
2.1% |
2.8% |
4.9% |
3.9% |
3.1% |
Source: Central Bank of Kenya (CBK)
Kenya Shilling:
During the week, the Kenyan shilling depreciated by 0.2% against the US dollar to close the week at Kshs 122.0, from Kshs 121.8 recorded the previous week, partly attributable to increased dollar demand from importers, especially oil and energy sectors against a slower supply of hard currency. On a year to date basis, the shilling has depreciated by 7.9% against the dollar, higher than the 3.6% depreciation recorded in 2021. We expect the shilling to remain under pressure in 2022 as a result of:
- High global crude oil prices on the back of persistent supply chain bottlenecks coupled with high demand,
- An ever-present current account deficit estimated at 5.3% of GDP in the 12 months to September 2022, same as what was recorded in a similar period in 2021,
- The need for Government debt servicing which continues to put pressure on forex reserves given that 68.1% of Kenya’s External debt was US Dollar denominated as of July 2022, and,
- A continued hike in the USA Fed interest rates in 2022 to a range of 3.75%-4.00% in November 2022 has strengthened the dollar against other currencies by causing capital outflows from other global emerging markets.
The shilling is however expected to be supported by:
- Improved diaspora remittances standing at a cumulative USD 4.0 bn as of October 2022, representing an 11.1% y/y increase from USD 3.6 bn recorded over the same period in 2021, and,
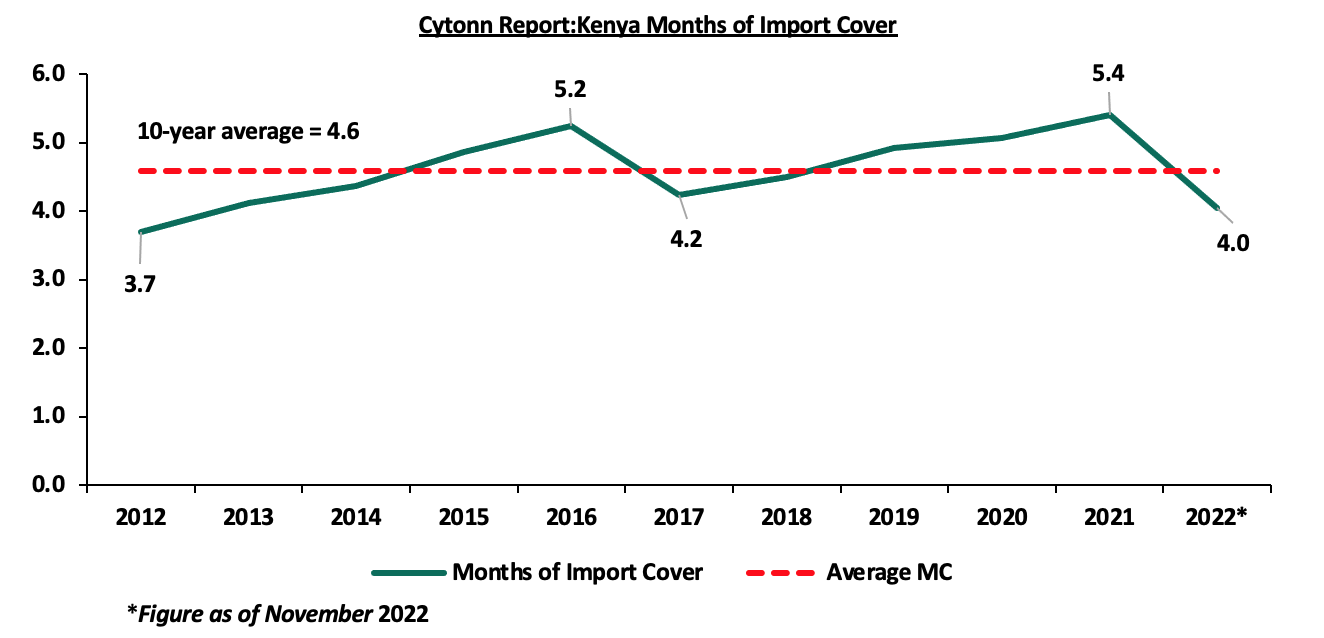
- Sufficient Forex reserves currently at USD 7.2 bn (equivalent to 4.0 months of import cover), which is currently at par with the statutory requirement of maintaining at least 4.0-months of import cover, however it’s important to note that Forex reserves have dropped by 22.2% YTD from USD 8.8 bn. The chart below summarizes the evolution of Kenya months of import cover over the last 10 years;
Weekly Highlights:
- Fuel Prices
During the week, the Energy and Petroleum Regulatory Authority (EPRA) released their monthly statement on the maximum retail fuel prices in Kenya effective 15th November 2022 to 14th December 2022. Super Petrol, Diesel and Kerosene prices all declined by Kshs 1.0 to Kshs 177.3 per litre, Kshs 162.0 per litre and Kshs 145.9 per litre from Kshs 178.3 per litre, Kshs 163.0 per litre and Kshs 146.9 per litre, respectively translating to a 0.6%, 0.6%, and 0.7% declines, respectively. Key to note, this is the second time since October 2021 that fuel prices have declined. The decline in the fuel prices was attributable to:
- Fuel subsidy of Kshs 17.7 on Kerosene has been retained but decreased by 35.6% from Kshs 27.5 in September 2022, while the price of diesel has been cross-subsidized with the price of super petrol,
- The 7.5% decrease in the Free On Board (FOB) price of Murban crude oil to USD 98.1 per barrel from USD 106.0 per barrel in the month of September 2022, and,
- A decline in the average landed costs of 5.6%, 2.3% and 9.1% to USD 686.1, USD 863.8 and USD 803.1 in October 2022 from USD 726.8, USD 884.5 and USD 883.2 per cubic metres of Super Petrol, Diesel and Kerosene in September 2022, respectively.
However, the Kenyan shilling continued to depreciate against the US dollar, having declined by 0.2% to Kshs 124.1 in October 2022 from Kshs 123.9 in September 2022, raising the cost of importing fuel and weighing down the country’s foreign reserves.
Following the continued decline in the average landed costs of imported fuel, fuel prices in Kenya have declined slightly for the second subsequent month since October 2021, despite the partial removal of the fuel subsidies in September 2022 by the new administration after noting that the subsidies were unsustainable. We have maintained that the subsidy program is unsustainable and is a burden to the country’s expenditure. Going forward, we expect the current administration to completely do away with the fuel subsidy program evidenced by the 35.6% decline in kerosene subsidy to Kshs 17.7 in October 2022, from Kshs 27.5 in September 2022, adjust the domestic fuel prices to ease pressure on expenditure, and consequently reduce the need for excessive borrowing. We expect global oil prices to ease slightly following reduced demand in USA following the Fed interest rate hikes and in China due to heightened COVID-19 restrictions. Month to date, Murban crude oil prices have eased by 6.3% to USD 86.8/barrel from USD 92.7/barrel at the end of October 2022. However, we expect the cost of living to remain elevated given that fuel is a major contributor to Kenya’s inflation. As such, the business environment is expected to remain unfavorable because of the decline in consumer spending.
- Revenue and Net Exchequer for FY’2022/2023
The National Treasury gazetted the revenue and net expenditures for the fourth month of FY’2022/2023, ending 31st October 2022. Below is a summary of the performance:
|
Cytonn Report: FY'2022/2023 Budget Outturn - As at 31st October 2022 |
|||||
|
Amounts in Kshs billions unless stated otherwise |
|||||
|
Item |
12-months Original Estimates |
Actual Receipts/Release |
Percentage Achieved |
Prorated |
% achieved of prorated |
|
Opening Balance |
|
0.6 |
|
|
|
|
Tax Revenue |
2,071.9 |
607.9 |
29.3% |
690.6 |
88.0% |
|
Non-Tax Revenue |
69.7 |
27.8 |
40.0% |
23.2 |
119.9% |
|
Total Revenue |
2,141.6 |
636.4 |
29.7% |
713.9 |
89.2% |
|
External Loans & Grants |
349.3 |
107.4 |
30.7% |
116.4 |
92.2% |
|
Domestic Borrowings |
1,040.5 |
124.7 |
12.0% |
346.8 |
36.0% |
|
Other Domestic Financing |
13.2 |
15.3 |
115.8% |
4.4 |
347.5% |
|
Total Financing |
1,403.0 |
247.4 |
17.6% |
467.7 |
52.9% |
|
Recurrent Exchequer issues |
1,178.4 |
358.6 |
30.4% |
392.8 |
91.3% |
|
CFS Exchequer Issues |
1,571.8 |
359.9 |
22.9% |
523.9 |
68.7% |
|
Development Expenditure & Net Lending |
424.4 |
77.5 |
18.3% |
141.5 |
54.8% |
|
County Governments + Contingencies |
370.0 |
85.4 |
23.1% |
123.3 |
69.2% |
|
Total Expenditure |
3,544.6 |
881.5 |
24.9% |
1,181.5 |
74.6% |
|
Fiscal Deficit excluding Grants |
1,403.0 |
245.0 |
17.5% |
467.7 |
52.4% |
|
Total Borrowing |
1389.8 |
232.1 |
16.7% |
463.3 |
50.1% |
Key take-outs from the release include;
- Total revenue collected as at the end of October 2022 amounted to Kshs 636.4 bn, equivalent to 29.7% of the original estimates of Kshs 2,141.6 bn for FY’2022/2023 and is 89.2% of the prorated estimates of Kshs 713.9 bn. We note that the government has not been able to meet its prorated revenue targets four months into the FY’2022/2023 partly attributable to the subdued business environment as seen by the decline in the PMI index for October 2022 to 50.2, from 51.7 recorded in September 2022, driven by the elevated inflationary pressures that have seen consumers continue to cut on spending. Cumulatively, tax revenues amounted to Kshs 607.9 bn, equivalent to 29.3% of the original estimates of Kshs 2,071.9 bn and 88.0% of the prorated estimates of Kshs 690.6 bn,
- Total financing amounted to Kshs 247.4 bn, equivalent to 17.6% of the original estimates of Kshs 1,403.0 bn and is equivalent to 52.9% of the prorated estimates of Kshs 467.7 bn. Additionally, domestic borrowing amounted to Kshs 124.7 bn, equivalent to 12.0% of the original estimates of Kshs 1,040.5 bn and is 36.0% of the prorated estimates of Kshs 346.8 bn,
- The total expenditure amounted to Kshs 881.5 bn, equivalent to 24.9% of the original estimates of Kshs 3,544.6 bn, and is 74.6% of the prorated target expenditure estimates of Kshs 1,181.5 bn. Additionally, the net disbursements to recurrent expenditures came in at Kshs 358.6 bn, equivalent to 30.4% of the original estimates of Kshs 1,178.4 bn and 91.3% of the prorated estimates of Kshs 392.8 bn,
- Consolidated Fund Services (CFS) Exchequer issues came in at Kshs 359.9 bn, equivalent to 22.9% of the original estimates of Kshs 1,571.8 bn, and are 68.7% of the prorated amount of Kshs 523.9 bn. The cumulative public debt servicing cost amounted to Kshs 331.5 bn which is 23.8% of the original estimates of Kshs 1,393.1 bn, and is 71.4% of the prorated estimates of Kshs 464.4 bn. Additionally, the Kshs 331.5 bn debt servicing cost is equivalent to 52.1% of the actual revenues collected as at the end of October 2022, further emphasizing on how much public debt weighs on the country’s expenditure, and,
- Total Borrowings as at the end of October 2022 amounted to Kshs 232.1 bn, equivalent to 16.7% of the original estimates of Kshs 1,389.8 bn for FY’2022/2023 and are 50.1% of the prorated estimates of Kshs 463.3 bn. The cumulative domestic borrowing target of Kshs 1,040.5 bn comprises of adjusted Net domestic borrowings of Kshs 579.1 bn and Internal Debt Redemptions (Roll-overs) of Kshs 461.4 bn.
As expected, the revenue performance for the first four months of the FY’2022/2023 reflects the economic uncertainties that emanated from the elevated inflationary pressures. The slow-down in economic environment is expected to persist in the short term as consumers continue to cut on spending. As such, we believe that the performance of revenue collection in the coming months will be largely determined by how soon the country’s business environment stabilizes and how fast the new regime implements its economic growth related initiatives. However, risks lie on the downside given the high global commodity prices coupled with the persistent supply bottlenecks which continue to weigh on the economy.
- November 2022 MPC Meeting
The Monetary Policy Committee (MPC) is set to meet on Wednesday, 23rd November to review the outcomes and effectiveness of its previous policy decisions against recent economic developments, and decide on the direction of the Central Bank Rate (CBR) and any other policy measure like the Cash Reserve Ratio (CRR). In the previous meeting held on Wednesday 29th September 2022 the committee raised the CBR by 75.0 bps to 8.25% from 7.50% in their July sitting, going against our expectation, citing the elevated inflationary pressures, the global risks and their impacts on the domestic economy and concluded that there was need to tighten the monetary policy to anchor inflation. We expect the MPC to raise the Central Bank Rate (CBR) by 25.0 bps to 8.50%, from the current 8.25% as it closely monitors the rising inflation rates. The key drivers shall include;
- Inflation rates declining to the government’s target range of 2.5% - 7.5%. The October inflation rate came in at 9.6%, the highest since October 2017, and an increase from the 9.2% inflation recorded in September 2022, on the back of high food and fuel prices, driving headline inflation. We expect the Inflation rates to remain high in the short term as the new administration continues to do away with fuel subsidy program and adjust domestic fuel prices to ease pressure on expenditure, and,
- The need to anchor the shilling from further depreciation as other Central Banks have raised their interest rates. The Kenyan shilling has depreciated by 7.9% to an all-time low of Kshs 122.0 as of 18th November 2022, from Kshs 113.1 year to date driven by increased dollar demand by importers, especially, in the oil and energy sectors on the back of high fuel prices. We expect the Kenyan shilling to depreciate further in the short term due to high import bill attributable to high fuel prices against declining forex reserves, given that Kenya is a net importer.
For a more detailed analysis, please see our MPC note here.
Rates in the Fixed Income market have remained relatively stable due to the relatively ample liquidity in the money market. The government is 9.1% ahead of its prorated borrowing target of Kshs 225.3 bn having borrowed Kshs 245.8 bn of the Kshs 581.7 bn borrowing target for the FY’2022/2023. We expect sustained gradual economic recovery as evidenced by the revenue collections of Kshs 636.4 bn in the FY’2022/2023, equivalent to a 29.7% of its target of Kshs 2.1 tn. Despite the performance, we believe that the projected budget deficit of 6.2% is relatively ambitious given the downside risks and deteriorating business environment occasioned by high inflationary pressures. We however expect the support from the IMF and World Bank to finance some of the government projects and thus help maintain a stable interest rate environment since the government is not desperate for cash. Owing to this, our view is that investors should be biased towards short-term fixed-income securities to reduce duration risk.
During the week, the equities market recorded mixed performance with NASI and NSE 25 gaining by 0.7% and 1.4% respectively, while NSE 20 declined by 0.1% taking their YTD performance to losses of 22.8%, 13.0% and 16.7% for NASI, NSE 20 and NSE 25 respectively. The equities market performance was mainly driven by gains recorded by stocks such as KCB, EABL and Equity Group of 5.6%, 4.9%, and 3.8% respectively, while Co-operative Bank and Standard Chartered Bank Kenya both gained by 1.3%. The gains were however weighed down by losses recorded by banking stocks such as NCBA Group and Diamond Trust Bank (DTB-K) of 3.5% and 2.3% respectively.
During the week, equities turnover increased by 65.0% to USD 16.0 mn from USD 9.7 mn recorded the previous week, taking the YTD turnover to USD 739.1 mn. Additionally, foreign investors remained net sellers, with a net selling position of USD 1.8 mn, from a net selling position of USD 2.2 mn recorded the previous week, taking the YTD net selling position to USD 188.0 mn.
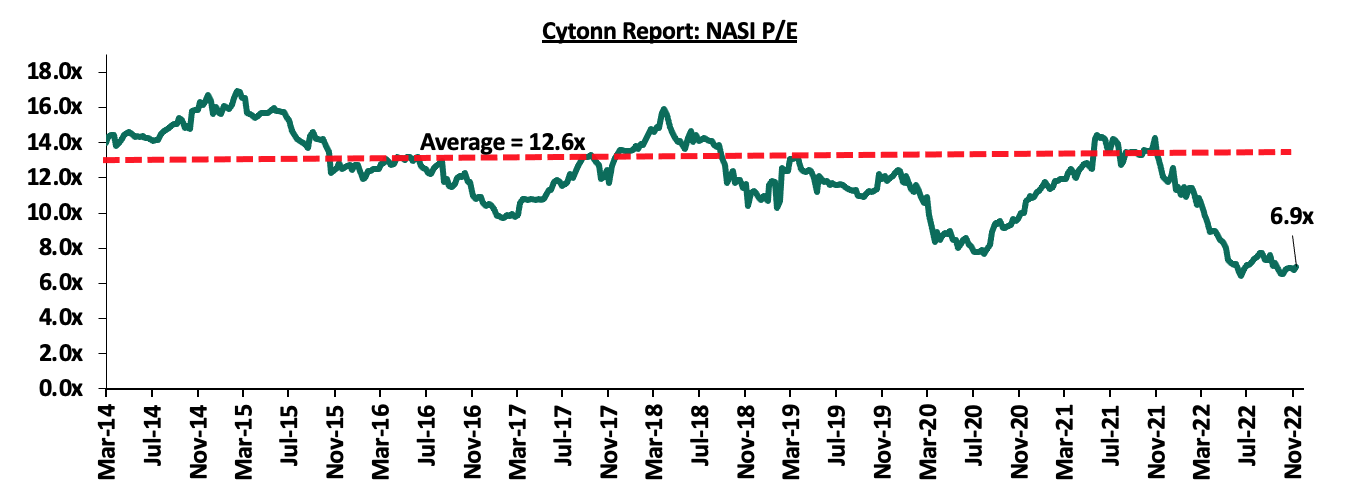
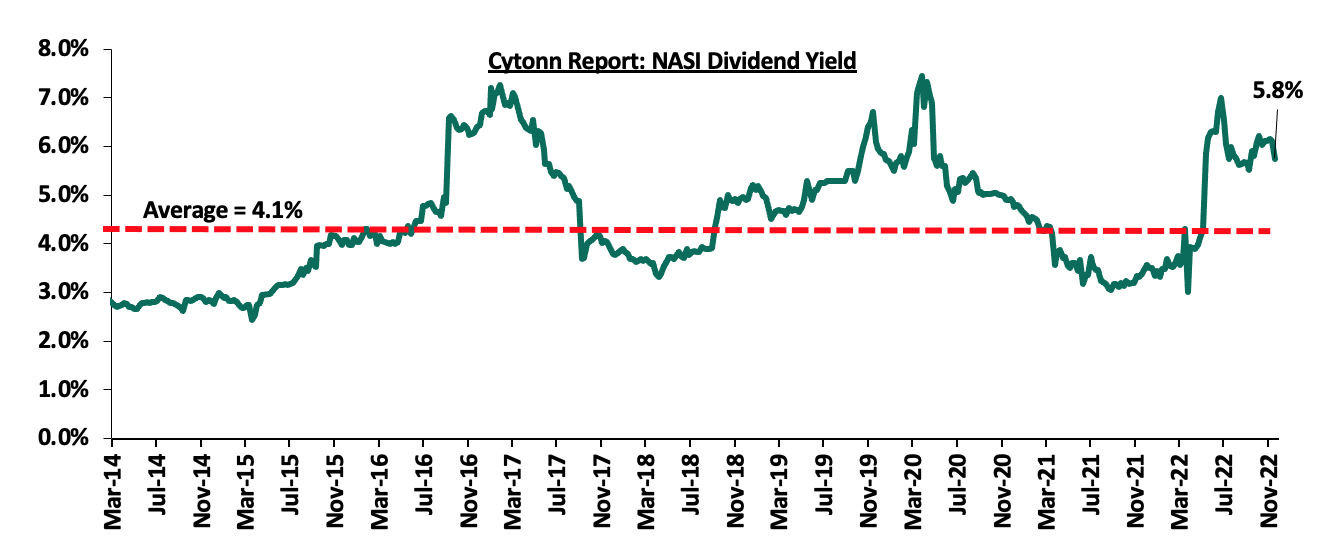
The market is currently trading at a price to earnings ratio (P/E) of 6.9x, 45.0% below the historical average of 12.6x, and a dividend yield of 5.8%, 1.7% points above the historical average of 4.1%. Key to note, NASI’s PEG ratio currently stands at 0.9x, an indication that the market is undervalued relative to its future growth. A PEG ratio greater than 1.0x indicates the market may be overvalued while a PEG ratio less than 1.0x indicates that the market is undervalued. The charts below indicate the historical P/E and dividend yields of the market;
Weekly Highlight:
- Diamond Trust Bank (DTB) IFC loan Facility
During the week, the International Finance Corporation (IFC) disclosed that it would extend USD 100.0 mn (Kshs 12.2 bn) to Diamond Trust Bank (DTB) under the WCS COVID-19 FIGE response facility in form of a senior debt investment with 24-month maturity and renewable once on an aggregate of up to 36 months. The facility is aimed at providing loans to Small and Medium Enterprises (SMEs) in Kenya operating in sectors such as Real Estate, Trade and Agriculture among others which are yet to fully recover from the effect of the pandemic. This is the second facility the last three years that IFC is lending to DTB following a USD 50.0 mn (Kshs 5.4 bn) loan facility in August 2020 which was also aimed at supporting SMEs that had been affected by the COVID-19 pandemic. Additionally, this is the third loan facility during this year that IFC has extended to Kenyan banks following a USD 165.0 mn (Kshs 19.2 bn) it extended to Equity Group in May 2022 and USD 150.0 mn (Kshs 18.0 bn) it extended to KCB Group in August 2022.
Upon disbursement, the credit facility will provide DTB additional liquidity to sustain lending to SMEs amid the current adverse macroeconomic situation coupled with elevated the cost of borrowing following the MPC decision to hike Central Bank Rate up by 75.0 bps to 8.25% in September 2022, from the previous 7.50%. Further, we expect such facilities from Development Finance Institutions such as IFC to continue boosting credit access to the private sector which is currently low at 26.1% of GDP.
- Central Bank of Kenya Credit Survey Report-Q3’2022
During the week, the Central Bank of Kenya released the Commercial Banks’ Credit Survey Report for the quarter ended September, 2022. The quarterly Credit Officer Survey is undertaken by the CBK to identify the potential drivers of credit risk in the banking sector. For the quarter ended 30th September 2022, 38 operating commercial banks and 1 mortgage finance company participated in the survey. The report highlights that the banking sector’s loan book recorded a 12.6% y/y growth, with gross loans increasing to Kshs 3.6 tn in September 2022, from Kshs 3.2 tn in September 2021. On a q/q basis, the loan book increased by 2.9% from Kshs 3.5 tn in June 2022, mainly driven by increase in credit extended for working capital purposes, and loans granted to individual borrowers, Other Key take-outs from the report include;
- The aggregate balance sheet recorded a 10.2% increase y/y to Kshs 6.4 tn in Q3’2022, from Kshs 5.8 tn in Q3’2021, attributable to an 12.6% increase in gross loans to Kshs 3.6 tn, from Kshs 3.2 tn in Q3’2021 coupled with a 6.4% growth in deposits to Kshs 4.6 tn in Q3’2022, from Kshs 4.3 tn in Q3’2021. Quarterly, the balance sheet grew by 2.6% to Kshs 6.4 tn in September 2022, from Kshs 6.2 tn in June 2022,
- Profit before Tax (PBT) for the banking sector increased by 36.9% y/y to Kshs 67.2 bn in Q3’2022, from Kshs 49.1 bn in Q3’2021. Quarterly, Profit before Tax increased by 7.5% to Kshs 67.2 bn in September 2022, from Kshs 62.5 bn in June 2022 attributable to the higher increase in operating income by Kshs 10.7 bn, compared to the Kshs 5.9 bn increase recorded by operating expenses. Additionally, Return on Equity (RoE) increased by 40 bps to 27.2% in September 2022, from 26.8% in June 2022. The chart below compares the banking sector’s return on equity in Kenya to other economies around the world.
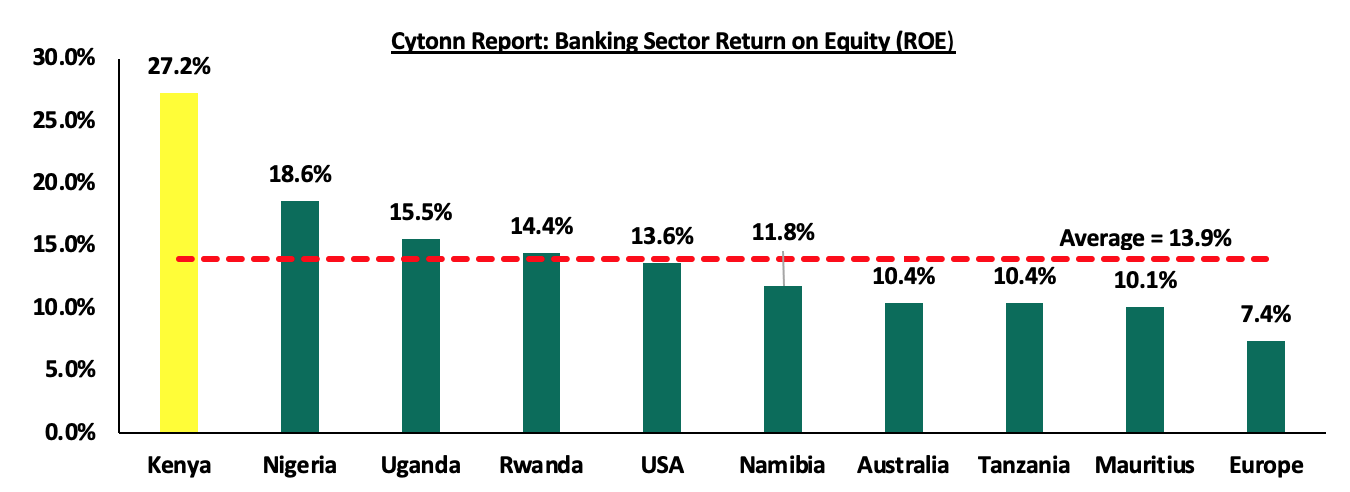
The Kenyan banking sector’s Return on Equity (ROE) of 27.2% compared to other economies’ average of 13.9%, indicates an overreliance on banks as a source of capital, which pose challenges to the ordinary person due to high cost of lending. To avoid the overreliance on banks, there is a need to stimulate the capital markets to offer alternative sources of capital,
- The sector Asset Quality improved to 13.7% in September 2022, from 14.7% recorded in June 2022, attributable to a 4.4% decrease in gross non-performing loans and a 2.9% increase in gross loans. The improvement in asset quality during the quarter is attributable to the improved business environment in the country following a peaceful general election held in August 2022 which has in turn led to improved loan repayment capacity by creditors and helped reduce credit risk,
- The Capital Adequacy ratio remained above the statutory requirement of 14.5% with the ratio increasing marginally by 0.2% points to 19.0% in September 2022 from 18.8% recorded in June 2022. The increase was mainly attributable to higher increase in Total Capital of 3.3% compared to 2.5% increase in Total Risk Weighted Assets, and
- Liquidity in the banking sector declined marginally to 51.5% in September 2022 from 52.5% in June 2022, however, it was 31.5% above the statutory minimum requirement of 20.0%.
The increased lending by the banking sector is expected to continue supporting the banking sector profitability due a subsequent increase in interest income. Additionally, we expect the continued shift to risk based pricing to positively affect the bottom-lines as seen by the average lending rate increasing to 12.7% in June 2022 from 12.2% in May 2022. However, risks abound mainly on the back of the increased inflationary pressures in the country, with the y/y inflation for the month of October 2022 increasing to 9.6%, the highest since June 2017, coupled with the increased currency depreciation risks which have seen Kenya’s Purchasing Managers Index (PMI) come in at an average of 48.8 for the first 10 months in 2022, signaling a deterioration in business environment.
- Earnings Release
During the week, KCB Group and Co-operative Bank of Kenya released their Q3’2022 financial results. Below is a summary of their performance;
- KCB Group
|
Balance Sheet Items |
Q3'2021 |
Q3'2022 |
y/y change |
|
Net Loans and Advances |
651.8 |
758.8 |
16.4% |
|
Government Securities |
252.4 |
269.9 |
6.9% |
|
Total Assets |
1,122.5 |
1,276.3 |
13.7% |
|
Customer Deposits |
859.1 |
922.3 |
7.4% |
|
Deposits per Branch |
1.7 |
1.9 |
5.8% |
|
Total Liabilities |
958.1 |
1,086.1 |
13.4% |
|
Shareholders’ Funds |
163.0 |
187.8 |
15.2% |
|
Balance Sheet Ratios |
Q3'2021 |
Q3'2022 |
% y/y change |
|
Loan to Deposit Ratio |
75.9% |
80.1% |
4.3% |
|
Return on average equity |
22.7% |
22.6% |
(0.1%) |
|
Return on average assets |
3.2% |
3.3% |
0.1% |
|
Income Statement |
Q3'2021 |
Q3'2022 |
y/y change |
|
Net Interest Income |
56.4 |
61.6 |
9.1% |
|
Net non-Interest Income |
23.5 |
30.6 |
30.2% |
|
Total Operating income |
79.9 |
92.1 |
15.3% |
|
Loan Loss provision |
(9.3) |
(7.3) |
(22.1%) |
|
Total Operating expenses |
(44.1) |
(48.8) |
10.8% |
|
Profit before tax |
35.8 |
43.3 |
20.9% |
|
Profit after tax |
25.2 |
30.6 |
21.4% |
|
Core EPS |
7.8 |
9.5 |
21.4% |
|
Income Statement Ratios |
Q3'2021 |
Q3'2022 |
y/y change |
|
Yield from interest-earning assets |
10.9% |
10.9% |
- |
|
Cost of funding |
2.6% |
3.0% |
0.4% |
|
Net Interest Spread |
8.3% |
7.9% |
(0.4%) |
|
Net Interest Margin |
8.4% |
8.1% |
(0.3%) |
|
Cost of Risk |
11.7% |
7.9% |
(3.8%) |
|
Net Interest Income as % of operating income |
70.6% |
66.8% |
(3.8%) |
|
Non-Funded Income as a % of operating income |
29.4% |
33.2% |
3.8% |
|
Cost to Income Ratio |
55.2% |
53.0% |
(2.2%) |
|
Capital Adequacy Ratios |
Q3'2021 |
Q3'2022 |
% points change |
|
Core Capital/Total Liabilities |
17.0% |
15.6% |
(1.4%) |
|
Minimum Statutory ratio |
8.0% |
8.0% |
|
|
Excess |
9.0% |
7.6% |
(1.4%) |
|
Core Capital/Total Risk Weighted Assets |
17.3% |
14.5% |
(2.8%) |
|
Minimum Statutory ratio |
10.5% |
10.5% |
|
|
Excess |
6.8% |
4.0% |
(2.8%) |
|
Total Capital/Total Risk Weighted Assets |
20.6% |
18.1% |
(2.5%) |
|
Minimum Statutory ratio |
14.5% |
14.5% |
|
|
Excess |
6.1% |
3.6% |
(2.5%) |
|
Liquidity Ratio |
41.3% |
38.5% |
(2.8%) |
|
Minimum Statutory ratio |
20.0% |
20.0% |
|
|
Excess |
21.3% |
18.5% |
(2.8%) |
Key take-outs from the earnings release include;
- Earnings Growth - Core earnings per share rose by 21.4% to Kshs 9.5, from Kshs 7.8 in Q3’2021, higher than our expectations of a 14.7% increase to Kshs 9.0, with the variance stemming from the 15.3% increase in total operating income, which was slightly higher than our projection of a 13.0% increase. The performance was driven by the 15.3% growth in total operating income to Kshs 92.1 bn, from Kshs 79.9 bn in Q3’2021, which outpaced the 10.8% growth in total operating expenses to Kshs 48.8 bn, from Kshs 44.1 bn in Q3’2021,
- Deterioration of the Asset Quality - The group’s asset quality deteriorated, with the NPL ratio increasing to 17.8% in Q3’2022, from 13.7% in Q3’2021, attributable to the continued high exposure to corporate loans at 47.8% in Q3’2022, which have been impacted by delayed recovery from COVID-19, increased inflationary pressures and pending government bills. Additionally, increase in NPLs have been recorded from sectors such as building and construction, manufacturing, and transport and communication. Key to note, the group’s asset quality was further weighed down by the high NPL ratio from NBK which came in at 24.5%, despite having recorded an improvement y/y, from 35.1% in Q3’2021. On the other hand, KCB-K subsidiary recorded a significant increase in the NPL ratio to 19.8%, from 11.8% in Q3’2021, attributable to loan stocks by corporates due to delayed payments from government contracts. On a q/q basis, KCB’s Asset quality improved by 3.6% points to 17.8%, from 21.4% recorded in Q2’2022,
- Reduced Provisioning – The NPL coverage declined to 52.8% in Q3’2022 from 63.4% in Q3’2021, attributable to the faster 52.1% growth in Gross non-performing loans, which outpaced the 30.6% growth in general Loan Loss Provisions. With the slow recovery in some sectors locally and the high NPL ratios in some of the group’s subsidiaries, we expected the group to provision more to cater for the prevailing credit risk,
- Improved efficiency levels – The group’s cost to income ratio without LLP improved to 53.0% from 55.2% in Q3’2021, an indication of improved efficiency, and,
- Improved Lending – Q3’2022 was characterized by a faster 16.4% growth in loans which outpaced the 6.9% growth in government securities, and 7.4% increase in deposits, highlighting the Group’s strategy to increase lending despite the deterioration in the Group’s asset quality.
For a comprehensive analysis, please see our KCB Group’s Q3’2022 Earnings Note
- Co-operative Bank of Kenya Limited
|
Balance Sheet Items (Kshs bn) |
Q3'2021 |
Q3'2022 |
y/y change |
|
Government Securities |
193.3 |
182.4 |
(5.7%) |
|
Net Loans and Advances |
306.3 |
335.2 |
9.4% |
|
Total Assets |
592.9 |
622.1 |
4.9% |
|
Customer Deposits |
420.4 |
432.0 |
2.8% |
|
Deposits per Branch |
2.38 |
2.39 |
0.5% |
|
Total Liabilities |
497.5 |
520.9 |
4.7% |
|
Shareholders’ Funds |
95.0 |
100.9 |
6.2% |
|
Balance Sheet Ratios |
Q3'2021 |
Q3'2022 |
y/y change |
|
Loan to Deposit Ratio |
72.9% |
77.6% |
4.7% |
|
Return on average equity |
14.2% |
22.5% |
8.3% |
|
Return on average assets |
2.3% |
3.6% |
1.3% |
|
Income Statement (Kshs bn) |
Q3'2021 |
Q3'2022 |
y/y change |
|
Net Interest Income |
28.7 |
32.0 |
11.7% |
|
Non-Interest Income |
15.7 |
20.2 |
28.3% |
|
Total Operating income |
44.4 |
52.2 |
17.6% |
|
Loan Loss provision |
(6.0) |
(5.7) |
(5.3%) |
|
Total Operating expenses |
(28.0) |
(29.6) |
6.0% |
|
Profit before tax |
16.5 |
22.7 |
37.9% |
|
Profit after tax |
11.6 |
17.1 |
47.0% |
|
Earnings per share (Kshs) |
1.7 |
2.5 |
47.0% |
|
Income Statement Ratios |
Q3'2021 |
Q3'2022 |
Y/Y Change |
|
Yield from interest-earning assets |
11.5% |
11.4% |
(0.1%) |
|
Cost of funding |
3.3% |
3.2% |
(0.1%) |
|
Net Interest Spread |
8.2% |
8.2% |
- |
|
Net Interest Income as % of Total Income |
64.6% |
61.4% |
(3.2%) |
|
Non-Funded Income as a % of Total Income |
35.4% |
38.6% |
3.2% |
|
Cost to Income |
63.0% |
56.8% |
(6.2%) |
|
Cost to Income Ratio without provisions |
49.4% |
45.8% |
(3.6%) |
|
Cost to Assets |
3.7% |
3.8% |
0.1% |
|
Net Interest Margin |
8.5% |
8.5% |
- |
|
Capital Adequacy Ratios |
Q3'2021 |
Q3'2022 |
% points change |
|
Core Capital/Total deposit Liabilities |
18.0% |
19.7% |
1.7% |
|
Minimum Statutory ratio |
8.0% |
8.0% |
|
|
Excess |
10.0% |
11.7% |
1.7% |
|
Core Capital/Total Risk Weighted Assets |
15.0% |
15.7% |
0.7% |
|
Minimum Statutory ratio |
10.5% |
10.5% |
|
|
Excess |
4.5% |
5.2% |
0.7% |
|
Total Capital/Total Risk Weighted Assets |
16.5% |
16.8% |
0.3% |
|
Minimum Statutory ratio |
14.5% |
14.5% |
|
|
Excess |
2.0% |
2.3% |
0.3% |
|
Liquidity Ratio |
56.5% |
52.1% |
(4.4%) |
|
Minimum Statutory ratio |
20.0% |
20.0% |
|
|
Excess |
36.5% |
32.1% |
(4.4%) |
|
Adjusted Core Capital/Total Deposit Liabilities |
15.0% |
15.2% |
0.2% |
|
Adjusted Core Capital/Total Risk Weighted Assets |
12.5% |
12.1% |
(0.4%) |
|
Adjusted Total Capital/Total Risk Weighted Assets |
14.0% |
13.2% |
(0.8%) |
Key take-outs from the earnings release include;
- Earnings Growth - Core earnings per share increased by 47.0% to Kshs 2.5 in Q3’2022, from Kshs 1.7 in Q3’2021, higher than our projections of 24.8% increase to Kshs 2.1. The performance was driven by a 17.6% increase in total operating income to Kshs 52.2 bn in Q3’2022, from Kshs 44.4 bn in Q3’2021, which outpaced the 6.0% increase in the total operating expenses to Kshs 29.6 bn in Q3’2022, from Kshs 28.0 bn in Q3’2021,
- Improvement in Asset Quality – The group’s asset quality improved, with the NPL ratio reducing to 14.0% in Q3’2022, from 14.6% in Q3’2021, owing to the 9.5% growth in gross loans to Kshs 371.1 bn, from Kshs 338.7 bn in Q3’2021, which outpaced the 4.7% increase in gross non-performing loans. The improved asset quality was attributable to the continued economic recovery which has seen more business pick up and more people going back to their jobs given that the group’s loan book constituted 50.5% personal consumer loans as at H1’2022. The group has also embarked on proactive credit management strategies that have seen increased loan repayments, and,
- Improved Efficiency - The group enhanced their efficiency levels evidenced by an improvement in Cost to Income Ratio (CIR) improving to 56.8% in Q3’2022, from 63.0% in Q3’2021 owing to the 17.6% increase in the total operating income which outpaced the 6.0% increase in the total operating expenses. Without LLP, the Cost to Income ratio improved as well to 45.8%, from 49.4% in Q3’2021.
For a comprehensive analysis, please see our Co-operative Banks of Kenya Limited’s Q3’2022 Earnings Note
Asset Quality
The table below is a summary of the asset quality for the listed banks that have released their Q3’2022 results
|
Bank |
Q3'2021 NPL Ratio** |
Q3'2022 NPL Ratio* |
Q3'2021 NPL Coverage** |
Q3'2022 NPL Coverage* |
% point change in NPL Ratio |
% point change in NPL Coverage |
|
KCB |
13.7% |
17.8% |
63.4% |
52.8% |
4.1% |
(10.6%) |
|
Co-operative Bank of Kenya |
14.6% |
14.0% |
65.5% |
69.3% |
(0.6%) |
3.8% |
|
Mkt Weighted Average |
14.0% |
16.4% |
64.2% |
58.8% |
2.4% |
(5.4%) |
|
*Market cap weighted as at 18/11/2022 |
||||||
|
**Market cap weighted as at 10/12/2021 |
||||||
Key take-outs from the table include;
- Asset quality for the listed banks that have released deteriorated during the period, with the weighted average NPL ratio increasing by 2.4% points to a market cap weighted average of 16.4%, from an average of 14.0% in Q3’2021. This is mainly skewed by a deterioration in KCB’s NPL ratio to 17.8% in Q3’2022 from 14.0% in Q3’2021, following reclassification of 9 large accounts as NPLs in H1’2022 and,
- NPL Coverage for the listed banks declined to a market cap weighted average of 58.8% in Q3’2022, from 64.2% recorded in Q3’2021, mainly skewed by reduced NPL coverage by KCB Group following NPLs growth outpacing provision.
Summary performance
The table below highlights the performance of the listed banks, showing the performance using several metrics, and the key take-outs of the performance;
|
Bank |
Core EPS Growth |
Interest Income Growth |
Interest Expense Growth |
Net Interest Income Growth |
Net Interest Margin |
Non-Funded Income Growth |
NFI to Total Operating Income |
Growth in Total Fees & Commissions |
Deposit Growth |
Growth in Govt. Securities |
Loan to Deposit Ratio |
Loan Growth |
Return on Average Equity |
|
Co-op |
47.0% |
10.5% |
7.2% |
11.7% |
8.2% |
28.3% |
38.6% |
31.7% |
4.9% |
(5.7%) |
77.6% |
9.4% |
22.5% |
|
KCB |
21.4% |
13.6% |
28.4% |
9.1% |
8.1% |
30.2% |
33.2% |
17.3% |
7.4% |
6.9% |
80.1% |
16.4% |
22.6% |
|
Q3'22 Mkt Weighted Average* |
30.6% |
12.5% |
20.7% |
10.0% |
8.1% |
29.5% |
35.1% |
22.5% |
6.5% |
2.4% |
79.2% |
13.9% |
22.6% |
|
Q3'21 Mkt Weighted Average ** |
102.0% |
15.9% |
14.9% |
16.9% |
7.3% |
14.3% |
35.2% |
13.8% |
14.3% |
11.7% |
69.7% |
12.4% |
18.7% |
|
*Market cap weighted as at 18/11/2022 |
|||||||||||||
|
**Market cap weighted as at 10/12/2021 |
|||||||||||||
Key take-outs from the table include:
- The listed banks recorded a 30.6% weighted average growth in core Earnings per Share (EPS), compared to a weighted average increase of 102.0% in Q3’2021,
- The Banks recorded a weighted average deposit growth of 6.5%, slower than the 14.3% growth recorded in Q3’2021, an indication of reduced investment risk in the business environment,
- Interest income grew by 12.5%, compared to a growth of 15.9% recorded in Q3’2021. With Net Interest Margin (NIM) standing at 8.1%, 0.8% points higher than the 7.3% recorded in Q3’2021, and,
- Non-Funded Income grew by 29.5%, compared to the 14.3% growth recorded in Q3’2021.
Universe of coverage:
|
Company |
Price as at 11/11/2022 |
Price as at 18/11/2022 |
w/w change |
YTD Change |
Target Price* |
Dividend Yield |
Upside/ Downside** |
P/TBv Multiple |
Recommendation |
|
Jubilee Holdings |
210.0 |
187.8 |
(10.6%) |
(40.7%) |
305.9 |
0.5% |
63.5% |
0.3x |
Buy |
|
Kenya Reinsurance |
1.9 |
1.8 |
(2.1%) |
(20.1%) |
2.5 |
5.5% |
42.6% |
0.1x |
Buy |
|
KCB Group*** |
36.8 |
38.8 |
5.6% |
(14.8%) |
53.5 |
2.6% |
40.5% |
0.6x |
Buy |
|
Liberty Holdings |
5.0 |
4.8 |
(3.2%) |
(31.7%) |
6.8 |
0.0% |
40.0% |
0.4x |
Buy |
|
Co-op Bank*** |
11.9 |
12.0 |
1.3% |
(7.7%) |
15.6 |
8.3% |
38.3% |
0.7x |
Buy |
|
Equity Group*** |
45.1 |
46.8 |
3.8% |
(11.3%) |
59.7 |
6.4% |
33.9% |
1.1x |
Buy |
|
Sanlam |
8.7 |
9.0 |
3.2% |
(22.1%) |
11.9 |
0.0% |
32.3% |
0.9x |
Buy |
|
Diamond Trust Bank*** |
48.5 |
47.4 |
(2.3%) |
(20.3%) |
59.5 |
6.3% |
31.9% |
0.2x |
Buy |
|
I&M Group*** |
17.2 |
17.0 |
(0.9%) |
(20.6%) |
20.5 |
8.8% |
29.6% |
0.4x |
Buy |
|
ABSA Bank*** |
11.7 |
11.7 |
0.0% |
(0.4%) |
14.9 |
1.7% |
29.1% |
1.0x |
Buy |
|
Britam |
5.7 |
5.8 |
1.4% |
(23.3%) |
7.1 |
0.0% |
22.8% |
1.0x |
Buy |
|
CIC Group |
2.0 |
1.9 |
(3.1%) |
(12.9%) |
2.3 |
0.0% |
22.8% |
0.7x |
Buy |
|
Standard Chartered*** |
137.0 |
138.8 |
1.3% |
6.7% |
155.0 |
10.1% |
21.8% |
0.9x |
Buy |
|
NCBA*** |
31.7 |
30.6 |
(3.5%) |
20.2% |
35.2 |
6.5% |
21.4% |
0.7x |
Buy |
|
HF Group |
3.1 |
3.0 |
(2.3%) |
(21.1%) |
3.5 |
0.0% |
16.7% |
0.2x |
Accumulate |
|
Stanbic Holdings |
100.0 |
97.5 |
(2.5%) |
12.1% |
99.9 |
9.2% |
11.7% |
0.8x |
Accumulate |
|
Target Price as per Cytonn Analyst estimates **Upside/ (Downside) is adjusted for Dividend Yield ***For Disclosure, these are stocks in which Cytonn and/or its affiliates are invested in |
|||||||||
We are “Neutral” on the Equities markets in the short term due to the current adverse operating environment and huge foreign investor outflows, and, “Bullish” in the long term due to current cheap valuations and expected global and local economic recovery. With the market currently trading at a discount to its future growth (PEG Ratio at 0.9x), we believe that investors should reposition towards value stocks with strong earnings growth and that are trading at discounts to their intrinsic value. We expect the current
- Retail Sector
During the week, local retailer Naivas Supermarket opened a new outlet at Ruai, opposite Ruai Market. This brings the retailer’s number of operating outlets countrywide to 89. This also comes two weeks after the retailer opened new outlets at Meru’s Greenwood City Mall and at Kahawa Sukari, with plans to also open another outlet at Parklands by the end of the year, indicating its rapid expansion drive. The opening of the new outlet in Ruai can be attributed to:
- Strategic location of the outlet along Kangundo Road and near QuickMart Ruai supermarket which enhances the footfall and accessibility to the Naivas store,
- Increased financial muscle following purchase of 30.0% stake for Kshs 3.7 bn by a consortium comprising of IBL Group and other firms such as Proparco and DEG Group,
- The need to step up on competition and maintain dominance in the market against other retailers such as QuickMart and Carrefour, and,
- Increased infrastructure developments in the region such as the expansion of the Eastern Bypass which has opened up new areas for development hence need to bring services closer to consumers.
The table below shows the number of stores operated by key local and international retail supermarket chains in Kenya;
|
Cytonn Report: Main Local and International Retail Supermarket Chains |
|
|
|
||||||||
|
Name of retailer |
Category |
Branches as at FY’ 2018 |
Branches as at FY’ 2019 |
Branches as at FY’ 2020 |
Branches as at FY’ 2021 |
Branches opened in 2022 |
Closed branches |
Current branches |
Branches expected to be opened |
Projected branches FY’2022 |
|
|
Naivas |
Local |
46 |
61 |
69 |
79 |
10 |
0 |
89 |
1 |
90 |
|
|
QuickMart |
Local |
10 |
29 |
37 |
48 |
3 |
0 |
51 |
0 |
51 |
|
|
Chandarana |
Local |
14 |
19 |
20 |
23 |
1 |
1 |
24 |
4 |
28 |
|
|
Carrefour |
International |
6 |
7 |
9 |
16 |
0 |
0 |
16 |
0 |
16 |
|
|
Cleanshelf |
Local |
9 |
10 |
11 |
12 |
0 |
0 |
12 |
0 |
12 |
|
|
Tuskys |
Local |
53 |
64 |
64 |
3 |
0 |
61 |
3 |
0 |
3 |
|
|
Game Stores |
International |
2 |
2 |
3 |
3 |
0 |
0 |
3 |
0 |
3 |
|
|
Uchumi |
Local |
37 |
37 |
37 |
2 |
0 |
35 |
2 |
0 |
2 |
|
|
Choppies |
International |
13 |
15 |
15 |
0 |
0 |
13 |
0 |
0 |
0 |
|
|
Shoprite |
International |
2 |
4 |
4 |
0 |
0 |
4 |
0 |
0 |
0 |
|
|
Nakumatt |
Local |
65 |
65 |
65 |
0 |
0 |
65 |
0 |
0 |
0 |
|
|
Total |
|
257 |
313 |
334 |
186 |
14 |
179 |
200 |
5 |
205 |
|
Source: Cytonn Research
Kenya’s retail sector continues to witness rapid expansion activities by various retailers owing to their efforts to compete for market dominance, which in turn cushions the performance of the sector. However, the performance of the retail sector continues to be weighed down by the rapid developments in the e-commerce sector, and the existing oversupply of retail spaces at 1.7 mn SQFT in Kenya, which in turn affect occupancy rates and overall return to investors.
- Hospitality Sector
During the week, global hospitality chain Hilton Hotel, announced plans to open a new hotel in Westlands dubbed Kwetu Nairobi in February 2023. According to our Cytonn Weekly #20/2022, the hotel which will be located at the junction of Peponi and Kitisuru Roads junction, will consist of 102 rooms, a restaurant and a rooftop bar within five interconnected blocks. Additionally, it will be the third operating hotel under Hilton Brand, with the other two being Hilton Nairobi Hurlingham, and, Hilton Garden Inn Nairobi. This comes seven months after Hilton announced plans to shut down its Nairobi’s Central Business District (CBD) iconic branch indefinitely as from 31st December 2022, owing to reduced demand by high-spending clients who have been avoiding the CBD for meetings, conferences and accommodation due to its noisy and chaotic location which has negatively impacted the business of the hotel in the recent past. However, the addition of the Kwetu branch signals the continuous existence and resilience of Hilton in Kenya.
Kenya’s hospitality sector continues to exhibit growth in terms of performance, expansion, new acquisitions, and developments. This is mainly attributed to; i) increased leisure, sport activities, conferences and foreign arrivals by both tourists and expatriates into the country, following the full resumption of businesses, and removal of all travel advisories and restrictions, ii) the resumption of operations by several hotels such as Norkfolk and Radisson Blu hotels which shut down their businesses temporarily in 2020, and, iii) increased acquisitions and mergers among hotels such as PrideInn Hotels and Azure Hotels.
Further and pointing to renewed optimism on the sector following the robust signs of recovery and resilience from the effects of the pandemic, the W hospitality Group’s Hotel Chain Development Pipelines in Africa 2022 report highlighted that 24 global hotel brands are considering to develop new facilities in Kenya which will bring the number of new hotel rooms to 3,155 in 2022. This places Kenya at the top ten hotspot countries for new luxury hotels in the African Continent as shown below. The graph below shows number of hotel rooms in the pipeline in several African countries;
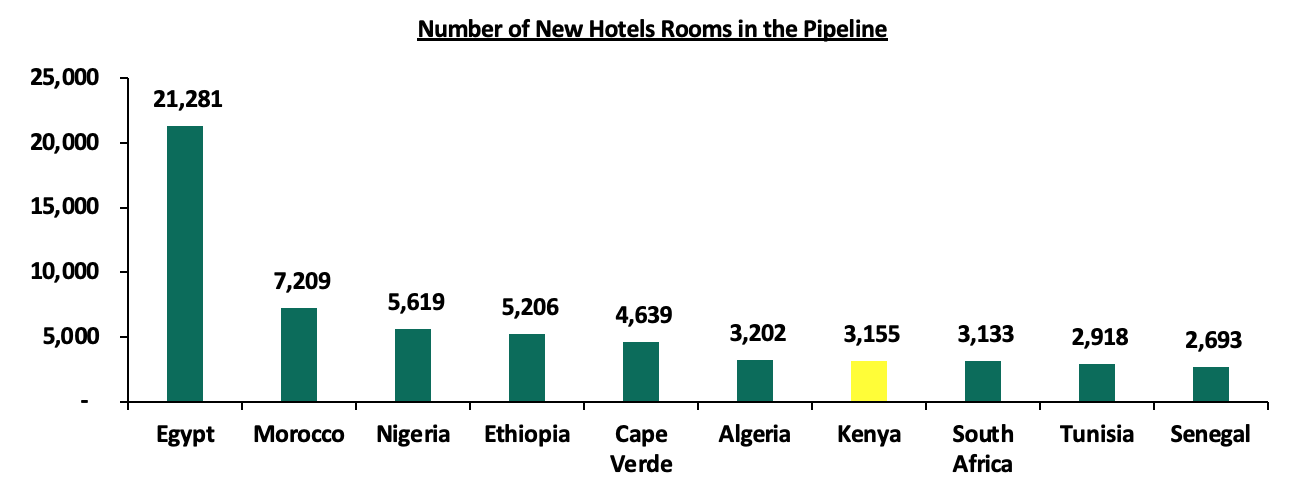
Source: Hotel Chain Development Pipelines in Africa 2022
Generally, we expect the performance of the hospitality sector to be resilient driven by growth factors such as; i) continuous improvement of the economy after the August general elections, ii) aggressive marketing of the tourism sector via Magical Kenya and Kenya Tourism Board, iii) increased conferences and meetings from the private sector with businesses and companies organizing Annual General Meeting towards end of the year until beginning of next year, iii) increased leisure activities during the festive season and sporting activities with the hosting of Annual Safari Rally competition until 2026, iv) positive accolades awarded to several local and foreign hotel brands based in Kenya in different categories such as the World Travel Awards thus boosting investors’ confidence in the sector. However, the government’s directive to indefinitely suspend hotel meetings, conferences and trainings will weigh down the optimum performance of the conferencing, food and accommodation sub-sectors.
- Real Estate Investment Trusts (REITs)
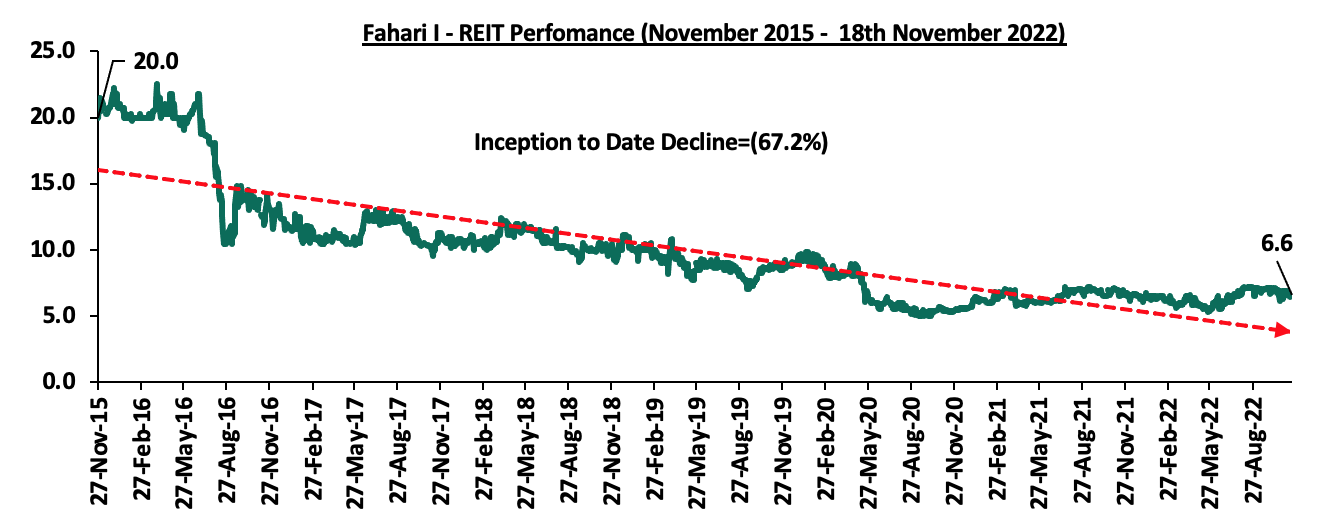
In the Nairobi Stock Exchange, ILAM Fahari I-REIT closed the week trading at an average price of Kshs 6.6 per share. The performance represented a 0.6% decline from the Kshs 6.6 per share recorded last week, taking it to a 4.8% Year-to-Date (YTD) gain. However, the performance also represented a 67.2% Inception-to-Date (ITD) decline from Kshs 20.0. The graph below shows Fahari I-REIT’s performance from November 2015 to 18th November 2022:
In the Unquoted Securities Platform, Acorn D-REIT and I-REIT closed the week at Kshs 23.8 and Kshs 20.9 per unit, respectively, as at 11th November 2022. The performance represented a 19.2% and 4.4% gain for the D-REIT and I-REIT, respectively, from the Kshs 20.0 inception price. The volumes traded for the D-REIT and I-REIT came in at 5.5 mn and 14.9 mn shares, respectively, with a turnover of Kshs 116.9 mn and Kshs 308.8 mn, respectively, since its Inception in February 2021.
We expect Kenya’s Real Estate sector performance to be on an upward trajectory supported by; i) rapid expansion drive by local retailers in a bid to achieve market dominance, and, ii) continued growth and resilience of the hospitality sector amid recovery of the economy and the increase in activities during the festive season. However, the performance of the Real state sector in Kenya is expected to be weighed down by; i) rising construction costs amid inflationary pressures in the economy, ii) existing oversupply of retail spaces currently at 1.7 mn SQFT, and, iii) low investor appetite in listed Real Estate due to high investment amounts.
Last week, in our Cytonn weekly #45/2022, we took a look at Kenya’s Private Sector Credit growth, in which we highlighted that, currently at 26.1% of GDP, Kenya’s Private Sector Credit continues to lag behind other economies. In 2020, Kenya’s Private Sector Credit growth at 32.1% of the GDP was outperformed when compared to advanced economies such as the United States of America and Japan at 216.0% and 192.8%, respectively, as well as Sub-Saharan economies such as South Africa and Mauritius at 112.0% and 95.9%, respectively. The graph below shows the comparison of Kenya’s domestic credit extended to the private sector as a % of Gross Domestic Product (GDP) in 2020 against other select economies;
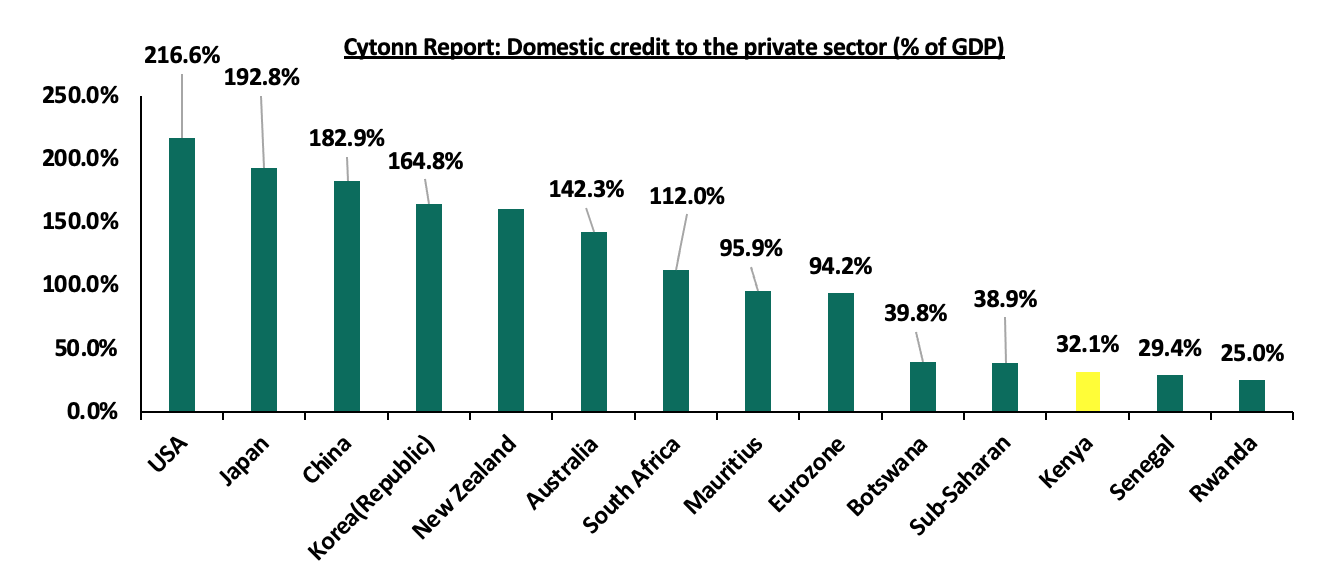
Source: World Bank
We recommended that, there is need to streamline the credit market for transparency and credibility to enhance credit uptake in the country, by reviewing the current credit rating framework. Similarly, the new administration has set it out to overhaul the credit rating system to increase access to credit. The Central Bank of Kenya (CBK) in November 2021, released an update to suspend for 12 months the listing of negative credit information for borrowers who had performing loans below Kshs 5.0 mn, and became non-performing on the beginning of October 2021. As such, defaulted loans during that year would not lead to blacklisting of the borrowers in the Credit Reference Bureaus (CRBs). Additionally, in a bid to increase credit uptake, the new administration through the CBK, has continued to update the CRB Framework. Notably, in November 2022, the CBK updated the Credit Information Sharing Framework, which mandated the CRBs to not use the negative credit score as the only reason to deny credit, and recommended the fast implementation of the risk based pricing model by commercial banks. Furthermore, on 14th November 2022, the CBK announced the rollout of the Credit Repair Framework, which waived off 50.0% of non-performing mobile phone digital loans by commercial banks, microfinance banks and mortgage finance companies outstanding at the end of October 2022 for six months, up to end of May 2023. In light of the ongoing credit sector reforms, we will analyse the current CRB framework in Kenya and its role in boosting the ability to access credit to promote financial inclusion. We shall cover the topic as follows;
- Introduction
- Evolution of the Credit Reference Framework in Kenya
- Kenya’s CRBs framework
- Developments from the 2020 CRB Regulations
- The role of CRBs in Kenya
- Recommendations to improve the CRB Framework and Conclusion
Section I: Introduction
Credit is an agreement in which a borrower receives money from a lender and commits to pay it later, usually with some interest, while credit reference refers to a collection of historical credit information that is used to rate individuals or institutions seeking to borrow funds. As such, a Credit Reference Bureau (CRB) in Kenya is an agency that is licensed by the Central Bank of Kenya (CBK) to collect, compile and analyse a borrower’s credit history, and the information is shared at request of financial institutions to gauge the credit worthiness of borrowers. The main objective of credit reference is to collect data on previous loans issued to customers by different institutions, and from that information, they are able to draw the repayment patterns of the borrowers. Consequently, with the credit reports shared to those financial institutions, they are the able to avoid credit risk, which is the possibility of a borrower defaulting to repay back loans by determining if they will issue the borrower with a loan. Notably, credit risk has remained elevated in Kenya especially post COVID-19, evidenced by the increase of gross NPLs to gross loans ratio to 14.7% in the Q2’2022, from 14.0% in Q1’2022. Below is a graph showing the NPL ratio over the last 10 years;
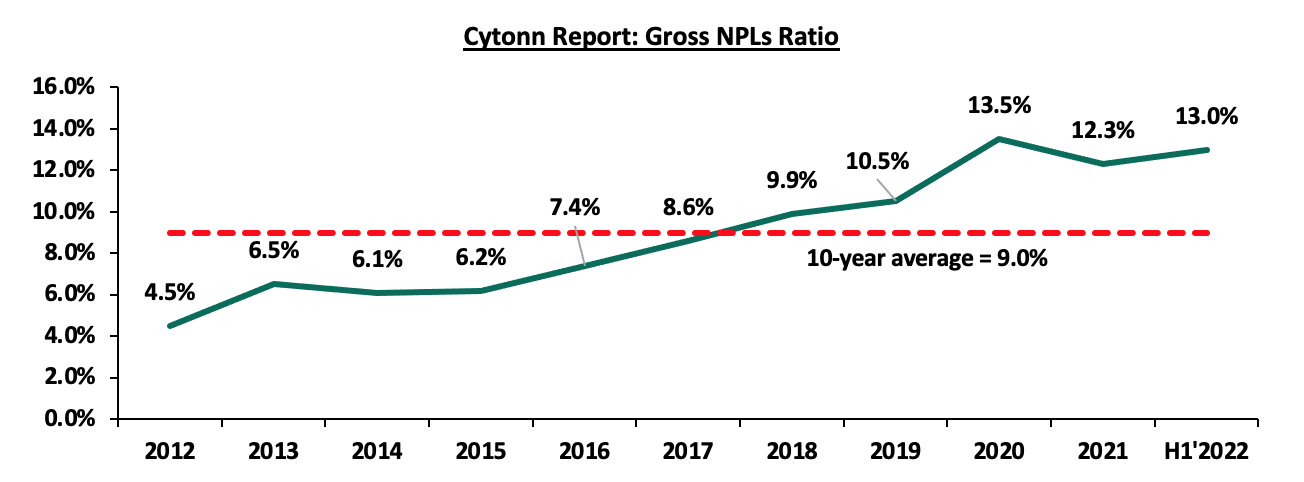
Source: Cytonn Report
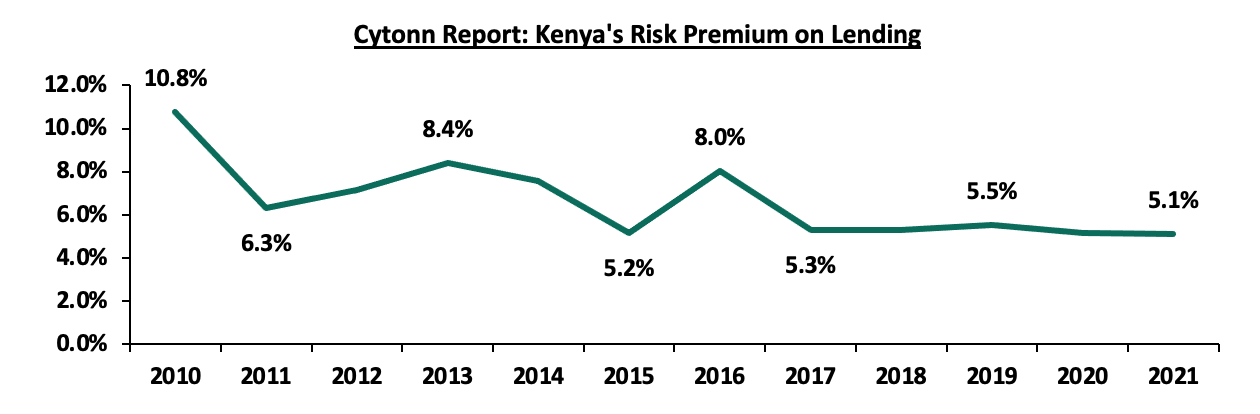
However, according to the World Bank, Kenya’s risk premium on lending, which reflects the overall country’s confidence on its lending sector, has declined to 5.1% in 2021 from 5.5% recorded in 2019, an indication of increasing confidence in the country’s credit sector, due to the measures the CBK has taken to make the sector more efficient. The graph below shows the Kenya’s risk premium on lending for the last 10 years;
Source: World Bank
Factors affecting credit risk
Kenya, like many other developing countries, has been facing a myriad of economic challenges that contribute to the decline in loan servicing determining the credit risk. The following are some of the factors affecting loan repayments in Kenya;
- Inflation rate: Inflation refers to the continued rise in the prices of commodities which increases the cost of living. Kenya’s y/y inflation rose to 9.6% in October 2022 from 9.2% recorded a month earlier, a historic high since May 2017, mainly due to increase in food and fuel prices. As inflation rises with incomes remaining constant, ability of individuals and businesses to service loans is impaired. Additionally, Kenya’s average Purchasing Managers Index (PMI) declined to 50.2% in October 2022 from 51.7% in September 2022 an indication towards deterioration of business operating environment, mainly due to concerns of high costs of living leading to low sales income to businesses,
- Economic growth: The rate of development of a country directly affects the ability of the citizens and organizations to service their loans. An increase in the Gross Domestic Product (GDP) indicates an increase in consumption of good and services, increase in exports which translates to an increase in revenue to businesses and increase in disposable income enabling repayment of obligations to such individuals,
- Interest rates: An increase in the Central Bank Rate (CBR) in a country leads to increase in the lending rates of financial institutions. The Central Bank of Kenya (CBK) increased the CBR rates by 75.0 bps to 8.25% in September 2022, which led to many commercial banks increasing their lending rates by up to 1.1% by October 2022. Such CBR hikes increases leads to costlier interest repayments to loans, thus impeding the ability to service the loans,
- Loan term: Short term loans are always characterised by small amounts especially from digital lending providers and attracting high interest rates, hence reducing the ability to service them. Contrarily, loans with longer periods of repayment such as mortgages require financial management and thorough credit analysis of the borrower, and therefore face low default rates,
- Random/irregular events: On the advent of COVID-19, many borrowers faced challenges to generate revenue, due to the supply chain disruptions and lock downs. This is evidenced by the rise in the NPLs ratio movement in 2020 to 13.5%, the highest in over 10 years. Additionally, political events in the country are always associated with a cautious stance by investors to invest and consumers to spend, and this reduces the ability of businesses to generate revenue to service loans,
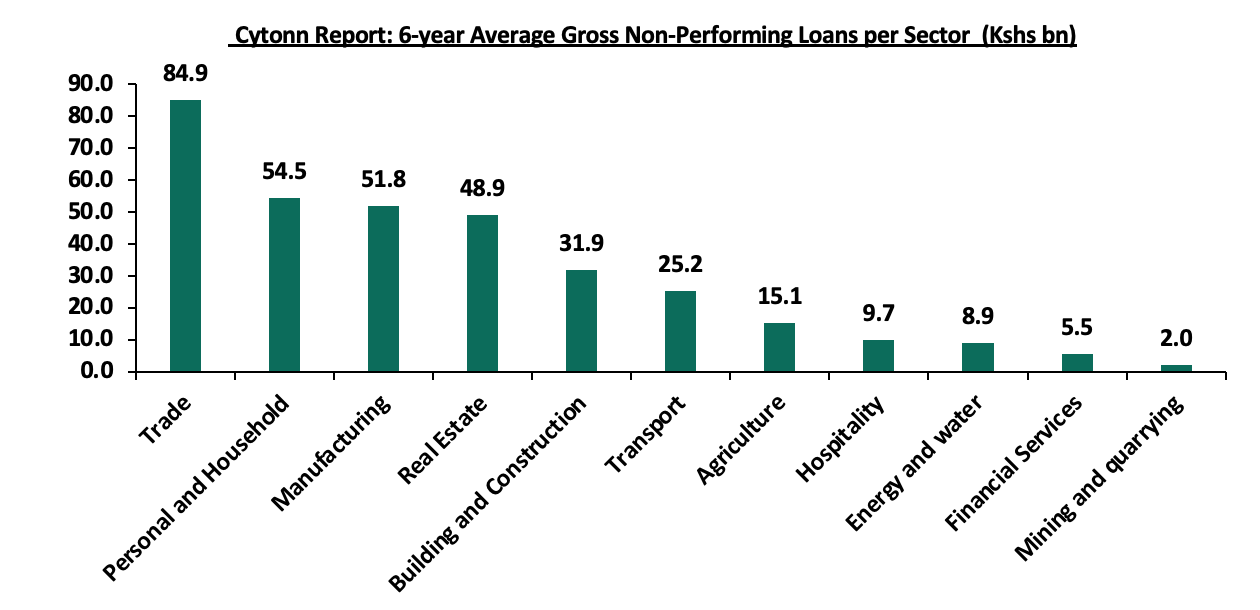
- Sector specific risk: The trade sector in Kenya has the highest average amount of non-performing loans for the last six years, amounting to Kshs 84.9 bn, representing 25.1% of the total NPLs in the banking sector, due to the deterioration of the business environment attributable to factors such as high inflation and delays in payments especially from government contracts. This reduces the ability of industry to service the loan repayments and increasing the sector’s credit risk. On the other hand, mining and quarrying has the lowest concentration of NPLs mainly due to low economic activity in the mining and quarrying industry. The graph below shows the 6- year average amount of non-performing loans in Kenya;
Source: Central Bank of Kenya
Section II: Evolution of Kenya’s Credit Reference framework
Before 2006, the Kenya Banking sector and credit sector in general lacked a system to gauge the credit worthiness of a borrower and as such banks, being the main lenders suffered high Non Performing Loans ratios, averaging 18.9% in 2006. However, assertion of the Banking and Finance Act of 2006 on 30th December 2006 allowed the establishment and operation of Credit Reference Bureaus (CRBs) for the purpose of collecting and disseminating customer information among financial institutions. To achieve more on the establishment of the CRBs and develop a sustainable information sharing system, the Banking (Credit Reference Bureau) Regulations 2008 were adopted to guide the sharing of credit information between lending institutions. This was followed by the roll out of the Credit Information Sharing Framework in July 2010, allowing the banking sector to share negative credit information from their borrowers to a licensed credit reference bureau. The first CRB, Credit Reference Bureau Africa was licensed in February 2010 with Metropol Credit Reference Bureau Limited and Creditinfo Credit Reference Bureau Kenya following in April 2011 and May 2015, respectively.
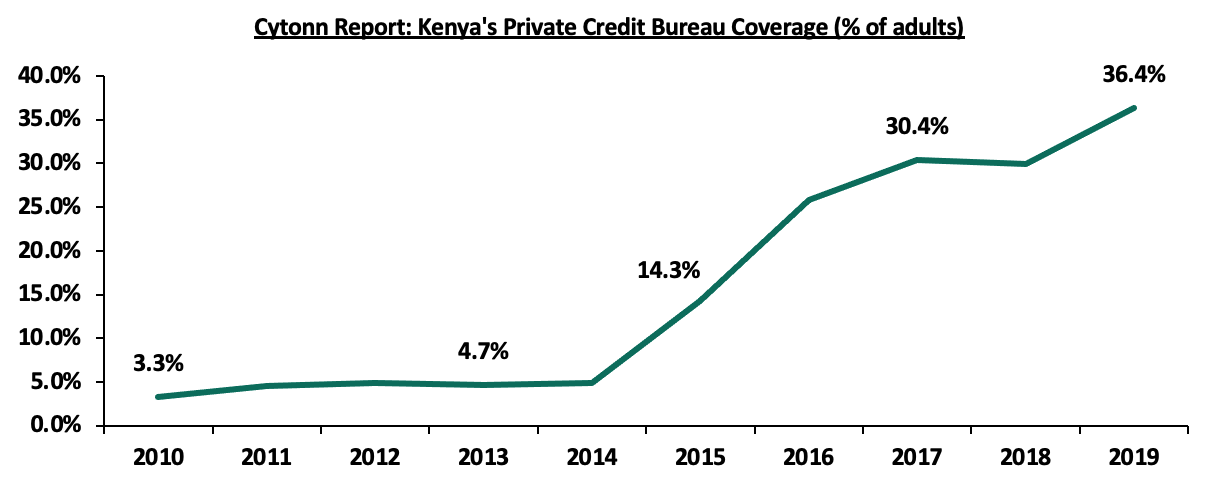
In 2013, the Credit Reference Bureau regulations of 2010 were amended to allow commercial banks and microfinance banks to share both positive and negative information to CRBs from the end of February 2014. Additionally, to enhance the CRB framework, the CBK then revised the 2013 CRB regulations, releasing the CRB regulations of 2020 that called for ceasing of listing of loan defaulters of amounts less than Kshs 1,000.0. According to the World Bank, the number of Kenyans that were covered by private credit bureau increased to 36.4% in 2019 of the adult population from 4.7% in 2013, majorly attributable to the new regulations, that put forth measures to improve credit risk management in the country. The graph below shows the growth of the Kenyans covered by the private credit bureau in Kenya;
Source: World Bank
- Components of Credit Rating
Credit rating refers to assigning a borrower a scale used to show the creditworthiness of the individual. There are three different aspects of the CRB,
- Credit score: Credit score is a rating between the range of 200-900, with a score below 400 showing a borrower is a defaulter, and therefore a high default risk is attached to the borrower. On the other hand, a score ranging between 800-900 indicates that a borrower has a high rating and that, creditors are confident for a repayment. A good credit score is very crucial as it improves the chances of a borrower getting a loan, a mortgage or any other form of financing from lenders. Several factors that affect one’s credit score include; commitment of payment of past loans, type and number of credit accounts that one holds, total debt outstanding, an event of filing for bankruptcy and any inquiries made from one’s credit report,
- Credit report: A credit report is a collection of information in a form of communication regarding one’s credit history usually from CRBs, and contains current information such as the borrower’s ability to repay a loan and current status of credit accounts and it is used to establish one’s eligibility for credit, and,
- Certificate of Clearance (CoC): A CRB clearance certificate is an official document from the CRBs that show a borrower has been fully committed to repay outstanding loans, and that, he does not have any non-performing account. Normally in Kenya, a CoC is normally issued upon request by a borrower at a cost of Kshs 2,200.0 and valid only on the date of issue. Currently, the CoC has become a vital document for employers and borrowers, as it forms part of the “Know Your Client (KYC)”.
- Licensed CRB Firms in Kenya
In Kenya, there are three licensed Credit Reference Bureaus which are;
- Credit Reference Bureau Africa Limited: Currently trading as TranUnion Africa, it was licensed by the CBK in February 2010 to offer credit rating and debt management services to banks, credit card companies, micro-finance institutions in order to reduce their credit risk. It operates in several African countries, which include Botswana, Namibia and Zambia,
- Metropol Credit Reference Bureau: It was established in Kenya in 1966 as a business Information and credit management company, and is located in Nairobi. It was licensed by the CBK in April 2011 to provide CRB services in Kenya to all banks, with the aim of improving the lending capacity of financial institutions. A CRB credit score, a credit report and a clearance certificate from Metropol usually costs Kshs 150.0, Kshs 250.0 and Kshs 2,200.0, respectively. Notably, in July 2014, through the CBK, Metropol CRB was licenced to launch the Metropol Consumer and SME Bureau credit scores. As of 30th September 2022, Metropol had over 19.0 mn Kenyans listed in their CRB system, with 6.0 mn blacklisted as loan defaulters, and,
- Credit Info Credit Reference Bureau: This was the third CRB to be licensed in Kenya in May 2015, to offer credit sharing services in Kenya as well as customer support in risk management. Its parent company, Credit Info International GmbH was established in 1997, has the largest stake in Credit Info CRB Kenya, and operates in other fifteen countries such as the Baltic States, Cape Verde, among others.
Section III: CRB Framework in Kenya
In Kenya, the Central Bank of Kenya (CBK) is mandated to license and regulate the CRBs. The first CRB regulations were published in 2013 which allowed CRBs to share both positive and negative information to lenders, In April 2020, the CBK amended and published the CRB regulations 2013, adopting the current CRB regulations 2020. Notably, in a major change from the 2013 CRB regulations, in the new regulations, the CBK mandated that;
- Default of amounts less than Kshs 1000.0 would not be submitted to the CRBs, and the borrowers that were blacklisted for defaulting of the loans less than Kshs 1000.0 would be then delisted,
- Saving and Credit Cooperatives (SACCOs) would be included as authorised subscribers of CRBs, and would then submit borrower’s information to the CRBs and would also receive reports from the CRBs, and,
- CRBs would process first time applications of the Certificate of Clearance (CoC) at no cost.
Additionally, in 2020, the CBK announced that;
- It had stopped the approvals given to the digital (mobile-based) and credit-only lenders as third party credit information providers to the CRBs, due to public complaints regarding the misuse of information by such parties, and therefore, the unregulated digital and credit-only providers would no longer submit credit information from their borrowers to the CRBs, and,
- It would suspend the listing of negative credit information from borrowers for six months from the beginning of April 2020 on the loans that were performing but had become non-performing on the date of commencement of the policy, and as such, the loans that fall in arears in the six months would not lead to blacklisting of the borrowers.
Section IV: Developments on the 2020 regulations
In November 2021, the CBK suspended for twelve months from the beginning of October 2021, the listing of negative credit information for borrowers with loans less than Kshs 5.0 mn, which were performing earlier and had becoming non-performing from the beginning of the suspension period. As such, the loans below Kshs 5.0 mn that fell in arrears during the one-year period suspension would not lead to blacklisting of the borrower by CRBs. Consequently, any negative credit information for the loans of less than Kshs 5.0 mn would be not be included in the credit report for that one year. This was in a bid to boost credit uptake especially to the Micro, Small and Medium Enterprises (MSMEs), and therefore boost economic recovery post COVID-19.
Since September 2022, there has been renewed conversations around changing the Credit Reference Framework in line with the new administration focus of increasing credit access and changing the current CRB Framework to a more accommodative structure from the current blacklisted-no credit framework. The government through the CBK has been updating the 2020 CRB regulations as follows;
- The CBK released in November 2022 an update on the Credit Information Sharing(CIS) Framework and mandated all existing CRBs to include that the credit score of a customer should be used as the sole reason to impede access to borrowing, and as such, the CBK noted that it was working with the CRBs to improve the scoring models thus improving the quality of the credit scores,
- Additionally, the CBK noted that it is supporting the banks with the implementation of the risk based credit pricing. This model is an improvement of the Annual Percentage pricing, refers to the application of different lending interest to borrowers, depending on the perception of default. This would mean that borrowers who have a positive credit history will be loaned at lower interest rates compared to the defaulters. If fully implemented, it would grant the already blacklisted borrowers access to credit at a higher cost, while at the same time getting access to credit. As of September 2022, 22 out of the 38 commercial banks had received approval to proceed and adopt the model. However, small businesses and start-ups, since they are considered riskier, will be charged more on their loans, and,
- The CBK released the Credit Repair Framework on 14th November 2022, announcing that institutions such as Commercial banks, microfinance banks and mortgage finance companies will provide a discount of 50.0% of the non-performing mobile digital loans offered for a repayment period of 30 days or less, and therefore update the credit standing of such borrowers from non-performing to performing for the period up to 31st May 2023. The credit score of the borrowers would then depend on their repayment for the period of the six months. The total value of loans restructured under this arrangement stands at Kshs 30.0 bn, approximately 0.8% of the gross banking sector portfolio of Kshs 3.6 tn as at end of October 2022.
Section V: Role of CRBs in Kenya
The main role of the Credit Reference Bureaus in Kenya is to perform credit risk rating for borrowers thus helping financial institutions such as banks, microfinance institutions and digital credit providers to reduce non-performing loans. The benefits and disadvantages of CRBs include;
- Benefits of CRBs to borrowers;
- Better negotiation terms during borrowing - Low risk borrowers receive better terms and repay loans at lower interest rates as compared to high risk borrowers, and therefore, they receive leverage to negotiate for good credit terms,
- It promotes debt management- Being aware that a default will lead to poor credit rating makes a borrower committed to service the loans, and this goes in hand in improving the credit score, and,
- Reduction in costs of sharing information - Although the cost to obtain CoC are considerably high, it reduces the charges of rating a borrower since the information is available from the different CRBs.
- Disadvantages to borrowers;
- Blacklisting of defaulters has denied many the ability to access of credit, and leaves them for exploitation by many middlepersons who charge exorbitant interest rates on borrowing,
- Credit repayment bias - The model only uses one’s credit repayment history, and does not consider other loans aspects such as, therefore denying the many blacklisted borrowers from access to credit, and,
- High certificate fees - The fees charged to access from CRBs are high, for example the clearance fee of Kshs 2,200.0 is high and this acts as hindrance for majority of Kenyans to get clearance.
- Advantages to lenders;
- It reduces the risk of default – As the main objective to the lending industry, financial institutions are able to ascertain the credit worthiness of the customers, therefore reducing the non-performing loans,
- CRBs minimizes rating costs – Adoption of the CRBs has saved lending institutions the cost that would be incurred for rating borrowers themselves and develop the systems to store and model the information collected, and,
- CRBs enhances the credibility of lending businesses and establishment of lenders – This is especially to the digital credit providers, who were initially cautious to start such business due to unreliable information to offer credit.
Section VI: Recommendations and Conclusion
In addition to the current reforms to the CRB framework, we note that there are areas of improvement to enhance the effectiveness of the framework consequently enhancing access to credit as discussed below;
- Adopt the risk based pricing model to the digital credit providers-The risk based pricing model is only being implemented to banks. The various digital credit providers will still continue using the credit rating to grant credit, which will deny access to the current negatively listed borrowers,
- Reduction of costs of obtaining a credit report and clearance certificate- Although the current 2020 CRB regulations abolished the charges to obtain a Certificate of Clearance from a CRB for first time applicants, the certificate obtained is only valid on the date of issue. This means further costs would be incurred for the subsequent certificates, which is expensive,
- Increase the number of CRBs in Kenya - Kenya’s Credit reference sector is underserved, and the CBK should make it easier for new entrants by removing the various regulatory barriers, which would spur competition and innovation of better credit rating models,
- Borrower education- The Central Bank as the sole regulator of CRBs should make it a priority to educate borrowers on the importance of having a positive credit score and debt management techniques, and this would spur growth in the borrowing sector,
- Lending rates ceiling- In addition to the introduction of the Risk Based pricing model to the banking sector, the CBK should introduce the ceiling of lending interest rate ceiling to prevent predatory lending to the high risky borrowers, who will be charged higher interest rates, and,
- Inclusion of other credit predictors in credit scoring- Loan repayment patterns have been used to determine a borrower’s creditworthiness in Kenya. However, the credit scoring system should also include other predictors such as a borrower’s utilities bill payments and non-traditional data like digital footprints as done in advanced economies, in order to make the credit scoring system more robust.
In conclusion, a sound CRB framework is key to boosting the access to credit by both individuals and businesses. We recommend continuous updating of the CRB framework depending on the prevailing economic conditions in the country. Going forward, we expect increased uptake and shift to risk based pricing models for lending, which will unlock necessary credit for individuals and businesses in the current tough prevailing macroeconomic environment which would in the long term enable them to repair their credit worthiness. However, in the short term, we expect credit risk is expected to remain elevated and non-performing loans to remain elevated in the short-term. Additionally, we recommend that in addition to improving the CRB framework to boost access to credit, the government should also create an enabling environment for alternative providers of capital such as capital markets to thrive which would also boost private sector credit growth.
Disclaimer: The views expressed in this publication are those of the writers where particulars are not warranted. This publication, which is in compliance with Section 2 of the Capital Markets Authority Act Cap 485A, is meant for general information only and is not a warranty, representation, advice or solicitation of any nature. Readers are advised in all circumstances to seek the advice of a registered investment advisor

- Talk to us
- Kenya
- P.O Box 20695 - 00200, Nairobi, Kenya
- Cell +254709101200
- Tel +254709101200
- WhatsApp +254741676635
- United States
- +254709101200
- DOWNLOAD OUR APP
-


- Kenya
- 8th Floor, Pinetree Plaza, Kaburu Drive, Ngong Road, Nairobi, Kenya
- USA
- Suite 1150, 1775 Eye Street NW, USA, Washington DC 20006, USA
- Investments
- High Yield
- Private Equity
- Real Estate
- Real Estate
- RiverRun Estates
- Cytonn Towers
- The Ridge
- Taraji Heights
- The Alma