Kenya’s FY’2024/2025 Budget Review, & Cytonn Weekly #27/2024
By Research Team, Jul 7, 2024
Executive Summary
Fixed Income
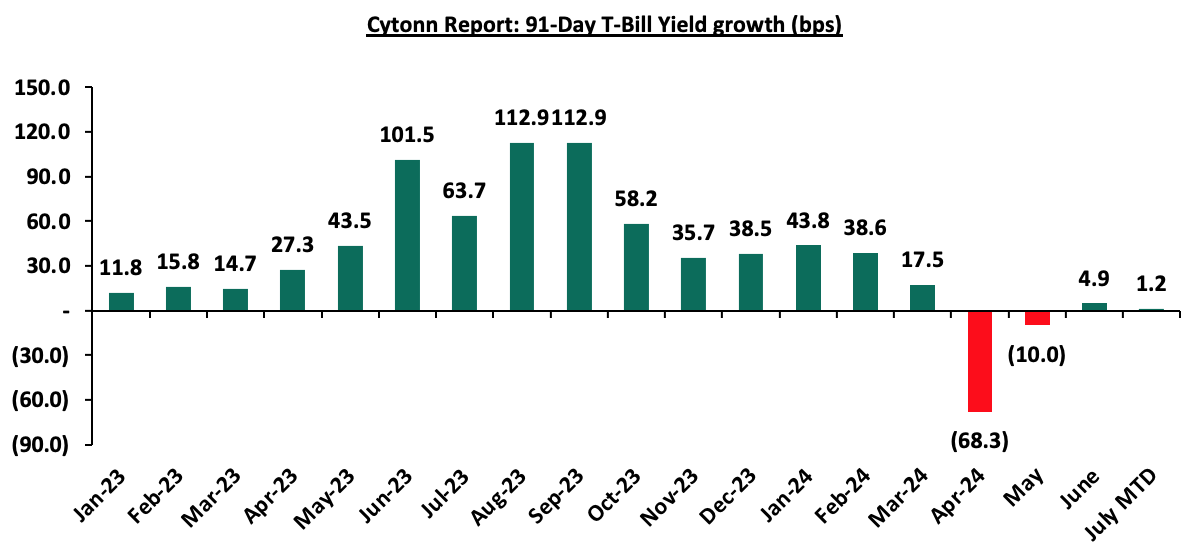
During the week, T-bills were oversubscribed for the first time in four weeks, with the overall oversubscription rate coming in at 124.4%, a reversal from the undersubscription rate of 32.0% recorded the previous week. Investors’ preference for the shorter 91-day paper persisted, with the paper receiving bids worth Kshs 14.8 bn against the offered Kshs 4.0 bn, translating to an oversubscription rate of 370.1%, higher than the oversubscription rate of 109.0% recorded the previous week. The subscription rates for the 182-day and 364-day papers increased significantly to 94.2% and 56.3% respectively from the 14.9% and 18.3% respectively recorded the previous week. The government accepted a total of Kshs 27.9 bn worth of bids out of Kshs 29.9 bn bids received, translating to an acceptance rate of 93.4%. The yields on the government papers were on an upward trajectory, with the yields on the 364-day, 182-day and 91-day papers increasing by 3.9 bps, 3.1 bps and 1.0 bps to 16.83%, 16.80% and 15.99% respectively from 16.79%, 16.76% and 15.98% respectively recorded the previous week;
Also, during the week, the Central Bank of Kenya released the auction results for the tap sale issue for the FXD1/2023/002 bond with a tenor to maturity of 1.2 years, and a fixed coupon rate of 17.0%. The bond was undersubscribed with the overall subscription rate coming in at 2.4%, receiving bids worth Kshs 0.5 bn against the offered Kshs 20.0 bn. The government accepted bids worth Kshs 0.5 bn, translating to an acceptance rate of 99.8%. The weighted average yield of accepted bids for the FXD1/2023/002 came in at 17.1%, remaining unchanged from the last issue. With the Inflation rate at 4.6% as of June 2024, the real return of the FXD1/2023/002 is 12.5%;
During the week, the Kenya National Bureau of Statistics (KNBS) released the Q1’2024 Quarterly Gross Domestic Product Report, highlighting that the Kenyan economy recorded a 5.0% growth in Q1’2024, slower than the 5.5% growth recorded in Q1’2023. The main contributor to Kenyan GDP remains to be the Agriculture, Fishing and Forestry sector which grew by 6.1% in Q1’2024, lower than the 6.4% expansion recorded in Q1’2023. All sectors in Q1’2024, except Mining and Quarrying, recorded positive growths, with varying magnitudes across activities. Most sectors recorded a decline compared to Q1’2023 with Accommodation and Food Services, Mining & Quarrying and Construction Sectors recording the highest declines of 19.1%, 3.8%, and 2.9% points, respectively. Other sectors that recorded a contraction in growth rate, from what was recorded in Q1’2023 were Transport and Storage, Other Services and Public Administration sectors of 2.8%, 2.1%, and 1.8% points respectively;
During the week, the Kenya National Bureau of Statistics released the Q1’2024 Quarterly Balance of Payment & International Trade Report highlighting that Kenya’s balance of payments position improved by by 126.4% in Q1’2024, coming in at a surplus of Kshs 33.8 bn, from a deficit of Kshs 127.8 bn in Q1’2024, and a significant improvement from the Kshs 134.8 bn deficit recorded in FY’2023;
During the week, Stanbic Bank released its monthly Purchasing Manager's Index (PMI) highlighting that the index for the month of June 2024 sharply deteriorated, coming in at 47.2, below the 50.0 neutral, down from 51.8 in May 2024, signaling a deterioration in the operating conditions across Kenya;
Equities
During the week, the equities market recorded mixed performance, with NSE 20 gaining by 0.2% while NASI declined the most by 0.4%; NSE 25 and NSE 10 declined by 0.2% each taking the YTD performance to gains of 22.3%, 19.6%, 18.5% and 10.0% for NSE 10, NSE 25, NASI and NSE 20 respectively. The equities market performance was driven by losses recorded by large-cap stocks such as EABL, Stanbic, and Equity Group of 2.4%, 1.1%, and 0.6% respectively. The performance was, however, supported by gains recorded by large-cap stocks such as Bamburi, KCB Group, and ABSA Bank of 6.7%, 2.4%, and 0.4% respectively;
Also, during the week, NCBA Group Plc announced the completion of its acquisition of 66.7% of the issued share capital of AIG Kenya Insurance Company Ltd from AIG MEA Ltd. As a result of this acquisition, AIG Kenya has become a wholly owned subsidiary of NCBA Group Plc. The transaction, which was finalized following meticulous regulatory scrutiny and corporate approvals, including clearances from the Competition Authority of Kenya, the Insurance Regulatory Authority, and the Central Bank of Kenya, solidifies NCBA Group Plc's position in the insurance market;
Real Estate
During the week, the Kenya National Bureau of Statistics (KNBS) released the Q1’2024 GDP Report which highlighted that the Real Estate sector posted steady growth of 6.6% in Q1’2024, which is 0.7% points slower than the 7.3% growth registered in Q1’2023;
In the residential sector, Fairdeal Properties, a private construction company, launched a Kshs 2.0 bn affordable housing project in Bamburi, Mombasa County, which will see the construction of over 500 housing units;
On the Unquoted Securities Platform, Acorn D-REIT and I-REIT traded at Kshs 24.5 and Kshs 22.0 per unit, respectively, as per the last updated data on 28th June, 2024. The performance represented a 22.5% and 10.0% gain for the D-REIT and I-REIT, respectively, from the Kshs 20.0 inception price;
Focus of the Week
Following the release of Kenya’s FY’2024/2025 National Budget, this week we analyze the fiscal components of the budget including revenue expectation, expenditure, and public debt. We shall also look at the key tax changes proposed in the withdrawn Finance Bill 2024;
Investment Updates:
- Weekly Rates:
- Cytonn Money Market Fund closed the week at a yield of 18.37% p.a. To invest, dial *809# or download the Cytonn App from Google Play store here or from the Appstore here;
- We continue to offer Wealth Management Training every Mondays and Thursdays, from 7:00 pm to 8:30 pm. The training aims to grow financial literacy among the general public. To register for any of our Wealth Management Trainings, click here;
- If interested in our Private Wealth Management Training for your employees or investment group, please get in touch with us through wmt@cytonn.com;
- Cytonn Insurance Agency acts as an intermediary for those looking to secure their assets and loved ones’ future through insurance namely; Motor, Medical, Life, Property, WIBA, Credit and Fire and Burglary insurance covers. For assistance, get in touch with us through insuranceagency@cytonn.com;
- Cytonn Asset Managers Limited (CAML) continues to offer pension products to meet the needs of both individual clients who want to save for their retirement during their working years and Institutional clients that want to contribute on behalf of their employees to help them build their retirement pot. To more about our pension schemes, kindly get in touch with us through pensions@cytonn.com;
Real Estate Updates:
- For more information on Cytonn’s real estate developments, email us at sales@cytonn.com;
- Phase 3 of The Alma is now ready for occupation and the show house is open daily. To join the waiting list to rent, please email properties@cytonn.com;
- For Third Party Real Estate Consultancy Services, email us at rdo@cytonn.com;
- For recent news about the group, see our news section here;
Hospitality Updates:
- We currently have promotions for Staycations. Visit cysuites.com/offers for details or email us at sales@cysuites.com;
Money Markets, T-Bills Primary Auction:
During the week, T-bills were oversubscribed for the first time in four weeks, with the overall oversubscription rate coming in at 124.4%, a reversal from the undersubscription rate of 32.0% recorded the previous week. Investors’ preference for the shorter 91-day paper persisted, with the paper receiving bids worth Kshs 14.8 bn against the offered Kshs 4.0 bn, translating to an oversubscription rate of 370.1%, higher than the oversubscription rate of 109.0% recorded the previous week. The subscription rates for the 182-day and 364-day papers increased significantly to 94.2% and 56.3% respectively from the 14.9% and 18.3% respectively recorded the previous week. The government accepted a total of Kshs 27.9 bn worth of bids out of Kshs 29.9 bn bids received, translating to an acceptance rate of 93.4%. The yields on the government papers were on an upward trajectory, with the yields on the 364-day, 182-day and 91-day papers increasing by 3.9 bps, 3.1 bps and 1.0 bps to 16.83%, 16.80% and 15.99% respectively from 16.79%, 16.76% and 15.98% respectively recorded the previous week; The chart below shows the yield growth rate for the 91-day paper over the period:
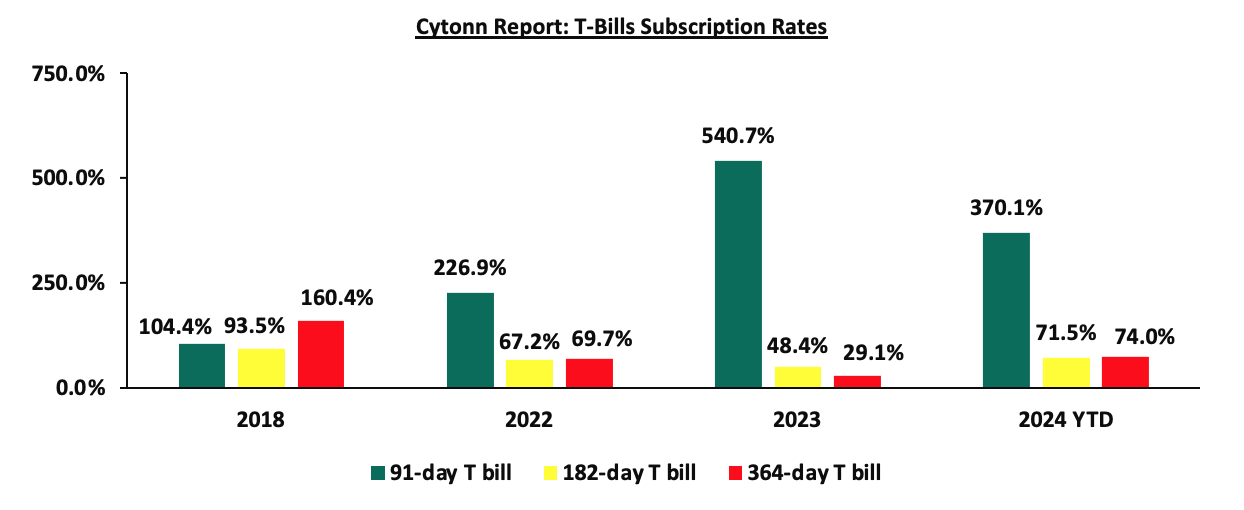
The chart below compares the overall average T-bill subscription rates obtained in 2018, 2022, 2023, and 2024 Year-to-date (YTD):
Also, during the week, the Central Bank of Kenya released the auction results for the tap sale issue for the FXD1/2023/002 bond with a tenor to maturity of 1.2 years, and a fixed coupon rate of 17.0%. The bond was undersubscribed with the overall subscription rate coming in at 2.4%, receiving bids worth Kshs 0.5 bn against the offered Kshs 20.0 bn. The government accepted bids worth Kshs 0.5 bn, translating to an acceptance rate of 99.8%. The weighted average yield of accepted bids for the FXD1/2023/002 came in at 17.1%, remaining unchanged from the last issue. With the Inflation rate at 4.6% as of June 2024, the real return of the FXD1/2023/002 is 12.5%;
Money Market Performance:
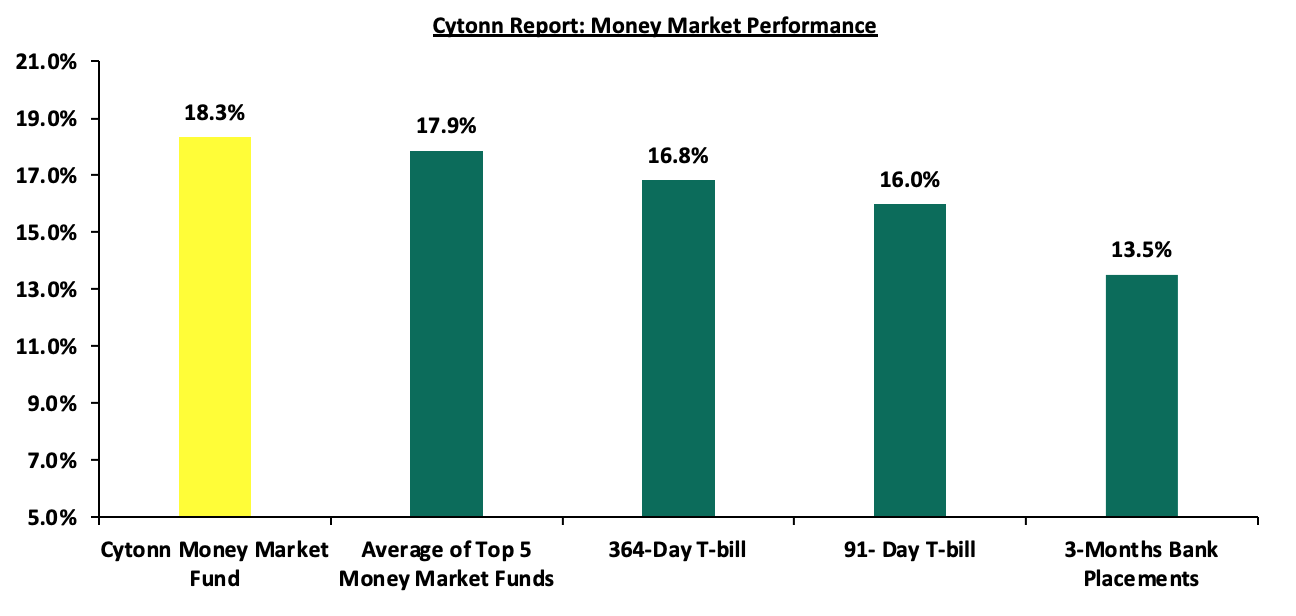
In the money markets, 3-month bank placements ended the week at 13.5% (based on what we have been offered by various banks), and the yields on the government papers were on an upward trajectory, with the yields on the 364-day and 91-day papers increasing by 3.9 bps and 1.0 bps to 16.83% and 15.99% respectively from 16.79% and 15.98% respectively recorded the previous week. The yields on the Cytonn Money Market Fund increased by 75.0 bps to close the week at 18.3% from the 17.6% recorded the previous week, while the average yields on the Top 5 Money Market Funds increased by 16.8 bps to 17.9% from the 17.7% recorded the previous week.
The table below shows the Money Market Fund Yields for Kenyan Fund Managers as published on 5th July 2024:
|
Cytonn Report: Money Market Fund Yield for Fund Managers as published on 5th July 2024 |
||
|
Rank |
Fund Manager |
Effective Annual Rate |
|
1 |
Cytonn Money Market Fund (Dial *809# or download the Cytonn App) |
18.3% |
|
2 |
Lofty-Corban Money Market Fund |
18.3% |
|
3 |
Etica Money Market Fund |
18.3% |
|
4 |
Kuza Money Market fund |
17.2% |
|
5 |
Arvocap Money Market Fund |
17.1% |
|
6 |
GenAfrica Money Market Fund |
16.7% |
|
7 |
Nabo Africa Money Market Fund |
16.5% |
|
8 |
Enwealth Money Market Fund |
15.9% |
|
9 |
GenCap Hela Imara Money Market Fund |
15.8% |
|
10 |
Apollo Money Market Fund |
15.7% |
|
11 |
Jubilee Money Market Fund |
15.7% |
|
12 |
KCB Money Market Fund |
15.6% |
|
13 |
Co-op Money Market Fund |
15.4% |
|
14 |
Mayfair Money Market Fund |
15.4% |
|
15 |
Madison Money Market Fund |
15.3% |
|
16 |
Sanlam Money Market Fund |
15.2% |
|
17 |
Mali Money Market Fund |
15.2% |
|
18 |
Absa Shilling Money Market Fund |
15.1% |
|
19 |
AA Kenya Shillings Fund |
15.0% |
|
20 |
Dry Associates Money Market Fund |
14.1% |
|
21 |
Equity Money Market Fund |
14.0% |
|
22 |
Old Mutual Money Market Fund |
13.7% |
|
23 |
Orient Kasha Money Market Fund |
13.6% |
|
24 |
CIC Money Market Fund |
13.5% |
|
25 |
British-American Money Market Fund |
13.5% |
|
26 |
ICEA Lion Money Market Fund |
12.4% |
Source: Business Daily
Liquidity:
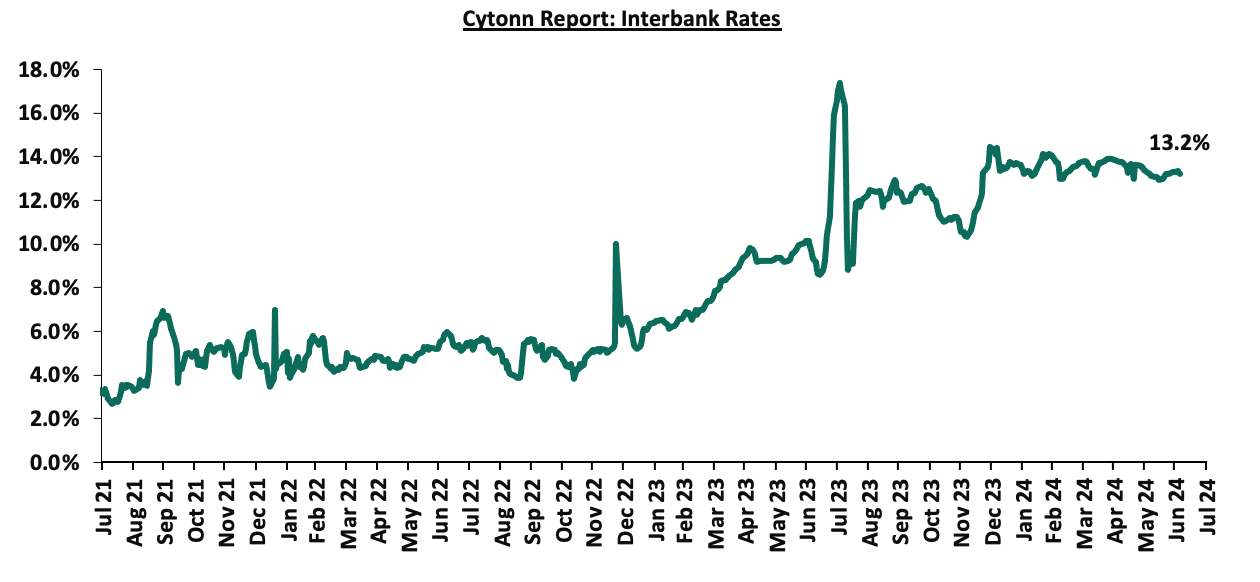
During the week, liquidity in the money markets marginally tightened, with the average interbank rate increasing by 2.4 bps, to remain relatively unchanged at 13.3% recorded the previous week, partly attributable to tax remittances that offset government payments. The average interbank volumes traded decreased by 2.3% to Kshs 20.0 bn from Kshs 20.4 bn recorded the previous week. The chart below shows the interbank rates in the market over the years:
Kenya Eurobonds:
During the week, the yields on Eurobonds recorded a mixed performance, with the yields on the 7-year Eurobond issued in 2024 increasing the most by 19.1 bps to 10.9% from 10.7% recorded the previous week, while the yields on the 30-year Eurobond issued in 2018 decreasing marginally 1.7 bps to remain relatively unchanged from the 10.9% recorded the previous week. The table below shows the summary of the performance of the Kenyan Eurobonds as of 4th July 2024;
|
Cytonn Report: Kenya Eurobonds Performance |
||||||
|
|
2018 |
2019 |
2021 |
2024 |
||
|
Tenor |
10-year issue |
30-year issue |
7-year issue |
12-year issue |
13-year issue |
7-year issue |
|
Amount Issued (USD) |
1.0 bn |
1.0 bn |
0.9 bn |
1.2 bn |
1.0 bn |
1.5 bn |
|
Years to Maturity |
3.7 |
23.7 |
2.9 |
7.9 |
10.0 |
6.7 |
|
Yields at Issue |
7.3% |
8.3% |
7.0% |
7.9% |
6.2% |
10.4% |
|
1-Jan-24 |
9.8% |
10.2% |
10.1% |
9.9% |
9.5% |
|
|
1-Jul-24 |
10.6% |
11.1% |
10.3% |
11.0% |
11.0% |
11.1% |
|
27-Jun-24 |
10.3% |
10.9% |
9.9% |
10.8% |
10.8% |
10.7% |
|
28-Jun-24 |
10.4% |
11.0% |
10.1% |
10.8% |
10.8% |
10.8% |
|
1-Jul-24 |
10.6% |
11.1% |
10.3% |
11.0% |
11.0% |
11.1% |
|
2-Jul-24 |
10.5% |
11.1% |
10.3% |
11.0% |
11.0% |
11.1% |
|
3-Jul-24 |
10.4% |
10.9% |
10.0% |
10.9% |
10.9% |
10.9% |
|
4-Jul-24 |
10.4% |
10.9% |
10.0% |
10.9% |
10.9% |
10.9% |
|
Weekly Change |
0.0% |
(0.0%) |
0.1% |
0.1% |
0.1% |
0.2% |
|
MTD Change |
(0.2%) |
(0.2%) |
(0.3%) |
(0.2%) |
(0.1%) |
(0.1%) |
|
YTD Change |
0.5% |
0.7% |
(0.1%) |
1.0% |
1.4% |
- |
Source: Central Bank of Kenya (CBK) and National Treasury
Kenya Shilling:
During the week, the Kenya Shilling appreciated against the US Dollar by 0.8%, to close at Kshs 128.5, from Kshs 129.5 recorded the previous week. On a year-to-date basis, the shilling has appreciated by 18.2% against the dollar, a contrast to the 26.8% depreciation recorded in 2023.
We expect the shilling to be supported by:
- Diaspora remittances standing at a cumulative USD 4,509.8 mn in the 12 months to May 2024, 12.8% higher than the USD 3,997.3 mn recorded over the same period in 2023, which has continued to cushion the shilling against further depreciation. In the May 2024 diaspora remittances figures, North America remained the largest source of remittances to Kenya accounting for 56.0% in the period, and,
- The tourism inflow receipts which came in at USD 352.5 bn in 2023, a 31.5% increase from USD 268.1 bn inflow receipts recorded in 2022, and owing to tourist arrivals that improved by 27.2% to 2.1 mn in the 12 months to March 2024, from 1.6 mn recorded during a similar period in 2023.
The shilling is however expected to remain under pressure in 2024 as a result of:
- An ever-present current account deficit which came at 3.2% of GDP in Q1’2024 from 3.0% recorded in Q1’2023,
- The need for government debt servicing, continues to put pressure on forex reserves given that 67.3% of Kenya’s external debt is US Dollar denominated, and,
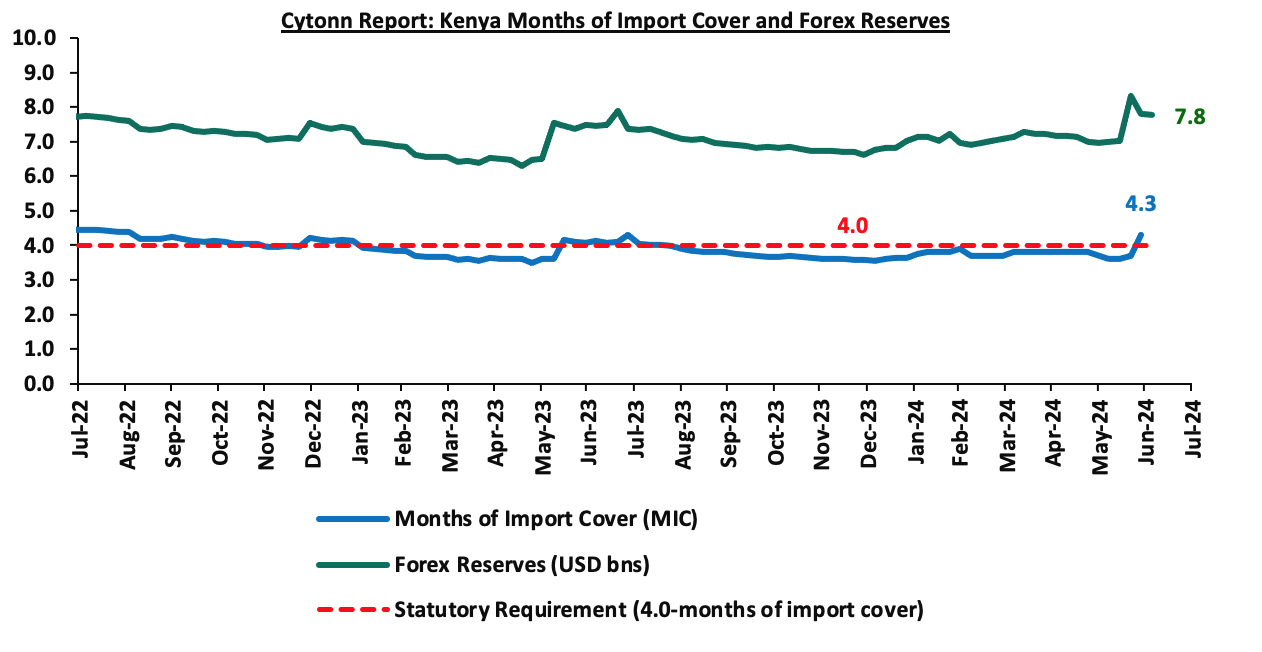
- Dwindling forex reserves, currently at USD 7.8 mn (equivalent to 4.0 months of import cover), which is at par with the statutory requirement of maintaining at least 4.0 months of import cover.
Key to note, Kenya’s forex reserves decreased marginally by 0.3% during the week to remain relatively unchanged from the USD 7.8 bn recorded the previous week, equivalent to 4.0 months of import cover, a decrease from the 4.1 months recorded the previous week, and at par with the statutory requirement of maintaining at least 4.0-months of import cover. The chart below summarizes the evolution of Kenya's months of import cover over the years:
Weekly Highlights
- Kenya Q1’2024 GDP Growth Highlight
During the week, the Kenya National Bureau of Statistics (KNBS) released the Q1’2024 Quarterly Gross Domestic Product Report, highlighting that the Kenyan economy recorded a 5.0% growth in Q1’2024, slower than the 5.5% growth recorded in Q1’2023. The main contributor to Kenyan GDP remains to be the Agriculture, Fishing and Forestry sector which grew by 6.1% in Q1’2024, lower than the 6.4% expansion recorded in Q1’2023. All sectors in Q1’2024, except Mining and Quarrying, recorded positive growths, though the rate of growth was slower than that recorded the same time last year. Accommodation and Food Services, Mining & Quarrying and Construction Sectors growth declined by 19.1%, 3.8%, and 2.9% points, respectively. Other sectors that recorded a slower growth rate, from what was recorded in Q1’2023 were Transport and Storage, Other Services, and Public Administration sectors whose growth slowed by 2.8%, 2.1%, and 1.8% points respectively.
The key take-outs from the report include;
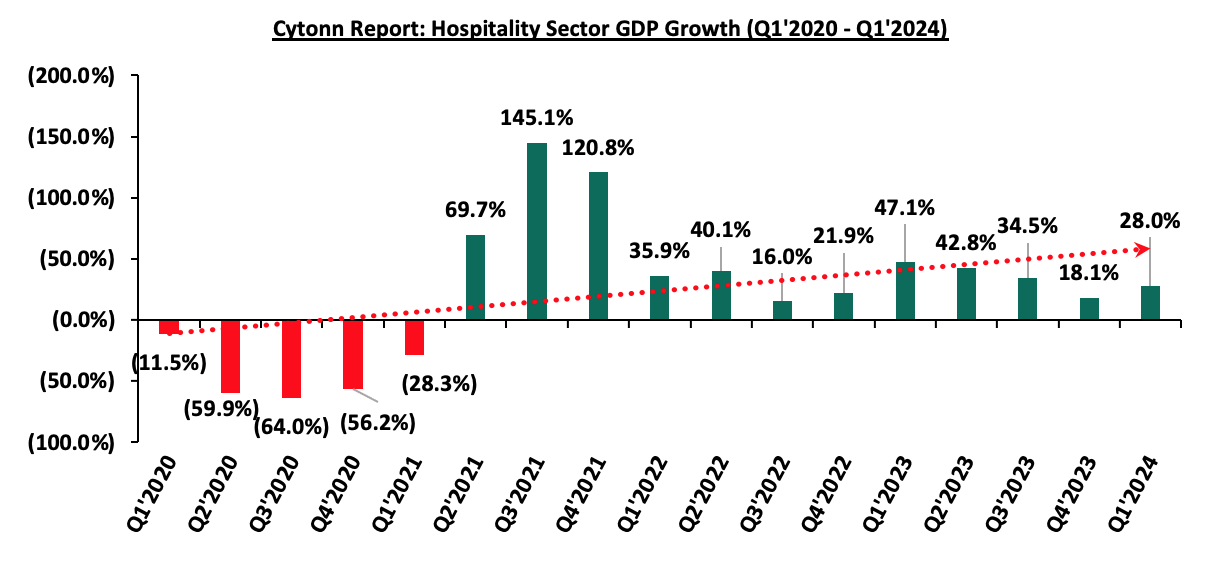
- Sectoral Contribution to Growth - The biggest gainer in terms of sectoral contribution to GDP was the Accommodation and Food Services sector, increasing by 0.3% points to 1.5% in Q1’2024 from 1.2% in Q1’2023, while the Manufacturing sector was the biggest loser, declining by 0.3% points to 7.8% in Q1’2024, from 8.1% in Q1’2023. Real Estate was the second largest contributor to GDP at 10.2% in Q1’2024, up from 10.1% recorded in Q1’2023, indicating sustained growth. The Accommodation and Food Services sector recorded the highest growth rate in Q1’2024 growing by 28.0%, slower than the 47.1% growth recorded in Q1’2023. The chart below shows the top contributors to GDP by sector in Q1’2024:
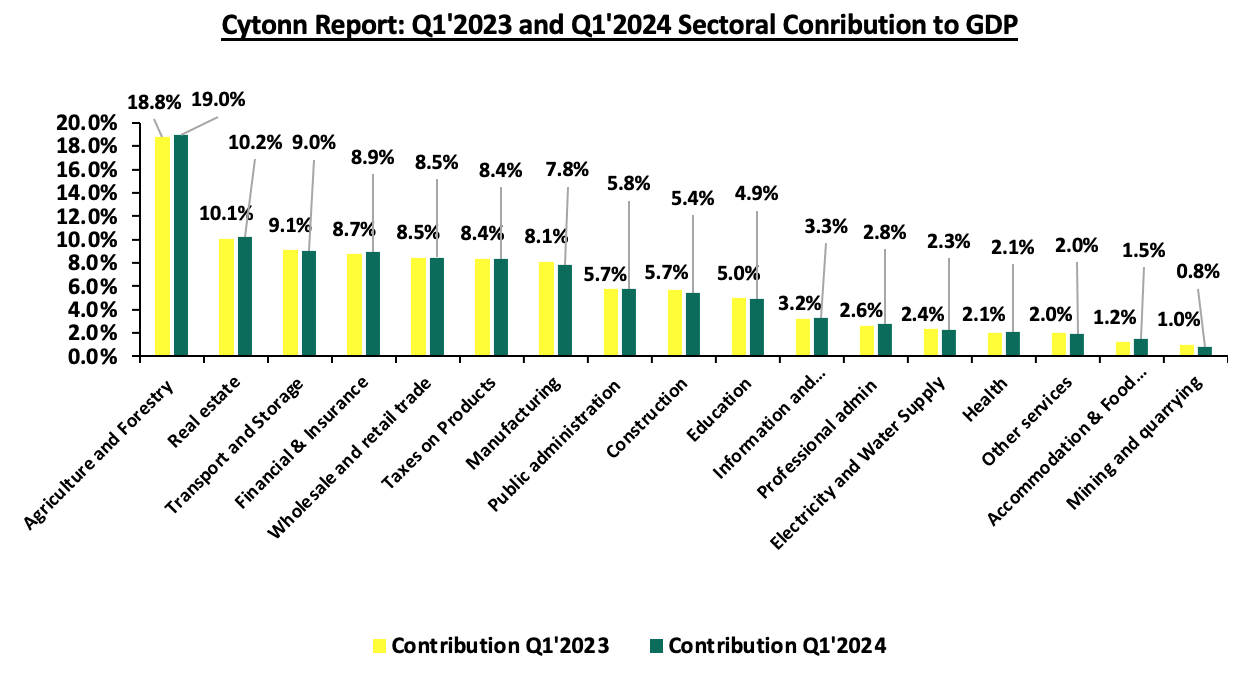
Source: KNBS Q1’2023 and Q1’2024 GDP Report
- Slowed growth in the Agricultural Sector– Agriculture and Forestry recorded a growth of 6.1% in Q1’2024. The performance was a decrease of 0.3% points, from the expansion of 6.4% recorded in Q1’2023. The slower growth recorded during the quarter was mainly attributable to decline in exports of coffee, fruit and cut flowers. Coffee exports declined by 13.8% to stand at 9,722.3 metric tonnes in Q1’2024 from the 11,284.9 metric tonnes recorded in Q1’2023.
- Increased growth in the Financial and Insurance Sector: The Financial and Insurance sector registered a growth increase of 1.1% points to 7.0% in Q1’2024 compared to the 5.9% in Q1’2023. Similarly, the contribution to GDP increased to 8.9%, from 8.7% in Q1’2023. In line with the prevailing monetary policy stance, the Central Bank Rate was raised to 13.0% in March 2024 from 9.5% in March 2023. The cost of credit rose Q1’2024, with average interest rates on loans and other advances by commercial banks increasing to 16.3% in March 2024 from 13.1% in March 2023.
- Decelerated growth in the Manufacturing sector - The manufacturing sector recorded a decelerated growth of 1.3% in Q1’2024 compared to a 1.7% growth in a similar period in 2023. Additionally, the sectoral contribution to GDP decreased to 7.8% in Q1’2024, from 8.1% recorded in Q1’2023.
- Significant growth in the Accommodation and Food Service sector: Accommodation and Food Services sector is the only sector that recorded double digit growth in Q1’2024, having expanded by 28.0%, albeit slower than the 47.1% recorded in Q1’2023. Additionally, the contribution to GDP increased by 0.3% points, to 1.5% in Q1’2024, compared to 1.2% recorded in Q1’2023
The chart below shows the different sectoral GDP growth rates for Q1’2024
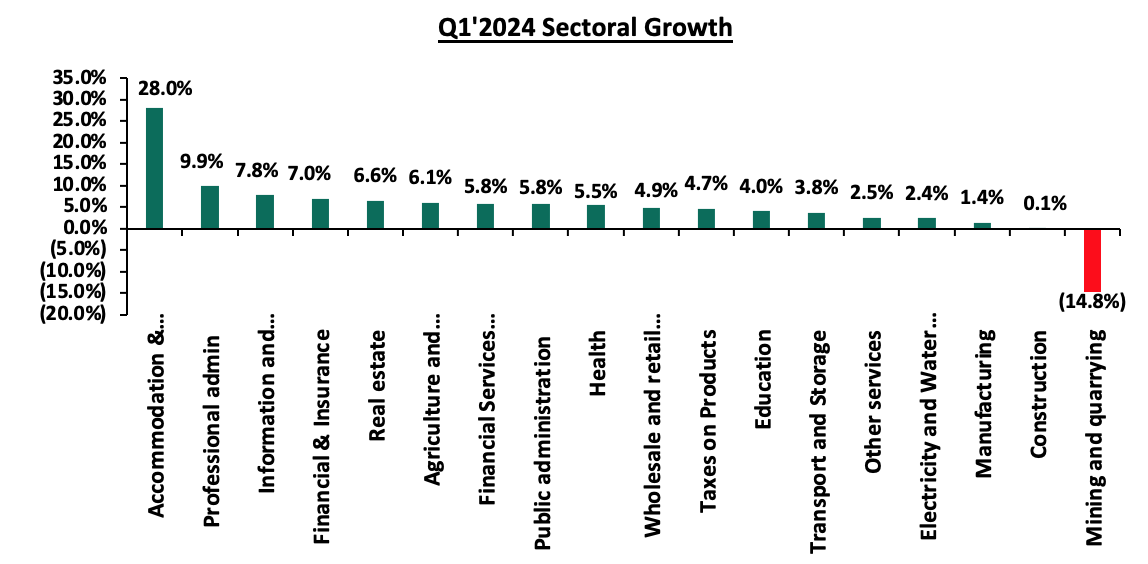
Source: KNBS Q1’2024 GDP Report
In the near-term, we expect the economy to grow at a slower pace given the restrained business as a result of the difficult economic environment caused by increasing taxes, and an overall rise in the cost of living. Additionally, the Central Bank of Kenya’s Monetary Policy Committee’s (MPC) decision on 5th June 2024 to maintain the Central Bank Rate (CBR) at 13.0% in a bid to curb inflation and maintain price stability is expected to curtail economic growth. The higher CBR is set to maintain the cost of credit issued by lenders high, hence discouraging borrowing, which will in turn lead to reduced investment spending in the economy by both individuals and businesses. Additionally, the inflation in the country remains within the Central Bank’s range of 2.5%-7.5%, and risks going high mainly on the back of a possible increase in fuel prices due to an increase in international fuel prices resulting from geo-political tensions, as well as the proposed road maintenance levy which will push the fuel prices up if approved. Thus, consumer purchasing power remains restrained despite an ease in inflation, resulting in reduced demand for goods and services and consequentially slowed economic growth. However, we expect the agricultural sector to continue backing economic growth in the country, as the country continues to experience sufficient rain during the year. The sector remains Kenya’s largest contributor to GDP, as well as food prices being a major contributor to headline inflation. Additionally, we expect we expect the economy to benefit from the strengthening Shilling and the ease in inflationary pressures.
- Kenya Q1’2024 Balance of Payments
Kenya’s balance of payment (BoP) position improved by 126.4% in Q1’2024, with a surplus of Kshs 33.8 bn, from a deficit of Kshs 127.8 bn in Q1’2023, and a significant improvement from the deficit of Kshs 134.8 bn recorded in FY’2023. The y/y positive performance in BoP was mainly driven by a 246.1% improvement in the financial account balance to a surplus of Kshs 121.6 bn in Q1’2024, from a deficit of Kshs 83.2 bn in Q1’2023, and a 22.2% increase in capital account balance to Kshs 8.5 bn from Kshs 6.9 bn recorded in a similar period in 2023. The performance was however weighed down by an 18.8% deterioration in the current account balance to a deficit of Kshs 131.2 bn from a deficit of Kshs 110.5 bn in Q1’2023. The table below shows the breakdown of the various balance of payments components, comparing Q1’2023 and Q1’2024;
|
Cytonn Report: Kenya’s Balance of Payments |
|||
|
Item |
Q1'2023 |
Q1'2024 |
Y/Y % Change |
|
Current Account Balance |
(110.5) |
(131.2) |
18.8% |
|
Capital Account Balance |
6.9 |
8.5 |
22.2% |
|
Financial Account Balance |
(83.2) |
121.6 |
(246.1%) |
|
Net Errors and Omissions |
59.0 |
34.9 |
(40.8%) |
|
Balance of Payments |
(127.8) |
33.8 |
126.4% |
All values in Kshs bns
Key take-outs from the table include;
- The current account deficit (value of goods and services imported exceeds the value of those exported) widened by 18.8% to Kshs 131.2 bn from the Kshs 110.5 bn deficit in Q1’2023. The y/y widening of the current account was brought about by the 10.3% widening in Merchandise trade deficit to Kshs 341.6 bn in Q1’2024, from Kshs 309.6 bn recorded in Q1’2023. This is attributable to the 28.1% growth in merchandise exports to Kshs 298.1 bn, from Kshs 233.0 bn in Q1’2023 compared to the 19.3% growth in merchandise imports to Kshs 640.0 bn from Kshs 536.6 bn recorded in a similar period in 2023,
- The capital account balance (shows capital transfers receivable and payable between residents and non-residents, including the acquisition and disposal of non-produced non-financial items), which includes foreign direct investments (FDIs), increased by 22.2% to a surplus of Kshs 8.5 bn in Q1’2024 up from a surplus of Kshs 6.9 bn in Q1’2023,
- The financial account balance (the difference between the foreign assets purchased by domestic buyers and the domestic assets purchased by foreign buyers) recorded a surplus of Kshs 121.6 bn in Q1’2024, An increase of 246.1% from the deficit of Kshs 83.2 bn recorded in Q1’2023. During the review period, reserve assets were depleted by Kshs 90.8 bn, and the government received Kshs 74.0 bn from the International Monetary Fund (IMF), a 35.8% increase from Kshs 54.5 bn in 2023, and,
- Consequently, the Balance of Payments (BoP) position improved to a surplus of Kshs 33.8 bn in Q1’2024, from a deficit of Kshs 127.8 bn recorded in Q1’2023.
Current Account Balance
Kenya’s current account deficit widened by 18.8% to Kshs 131.2 bn in Q1’2024 from the Kshs 110.5 bn deficit recorded in Q1’2023. The y/y expansion registered was driven by:
- The widening of the merchandise trade account deficit (the value of import goods exceeds the value of export goods, resulting in a negative net foreign investment) by 10.3% to Kshs 341.6 bn in Q1’2024, from Kshs 309.6 bn recorded in Q1’2023, and,
- A 35.3% deterioration in the services trade balance (transfer) balance to a deficit of Kshs 26.4 bn from a deficit of Kshs 40.7 bn in Q1’2023.
The table below shows the breakdown of the various current account components on a year-on-year basis, comparing Q1’2023 and Q1’2024:
|
Cytonn Report: Kenya’s Current Account Balance |
|||
|
Item |
Q1'2023 |
Q1'2024 |
Y/Y % Change |
|
Merchandise Trade Balance |
(309.6) |
(341.6) |
10.3% |
|
Services Trade Balance |
40.7 |
26.4 |
(35.3%) |
|
Primary Income Balance |
(62.0) |
(90.8) |
46.6% |
|
Secondary Income (transfer) Balance |
220.3 |
274.9 |
24.7% |
|
Current Account Balance |
(110.5) |
(131.2) |
18.8% |
All values in Kshs bns
Kenya's balance of payments improved in Q1'2024, mainly on the back of a 246.1% improvement in the financial account to a surplus of Kshs 121.6 bn in Q1’2024, from a deficit of Kshs 83.2 bn in Q1’2023 reflecting significant inflows of financing into the country. This follows depletion of reserve assets by Kshs 90.8 bn, as the government received Kshs 74.0 bn from the International Monetary Fund (IMF), a 35.8% increase from Kshs 54.5 bn in 2022. The current account deficit (value of goods and services imported exceeds the value of those exported) widened by 18.8% to Kshs 131.2 bn from the Kshs 110.5 bn deficit in Q1’2023. The y/y widening of the current account was brought about by the 10.3% widening in Merchandise trade deficit to Kshs 341.6 bn in Q1’2024, from Kshs 309.6 bn in Q1’2023 driven by the 28.1% growth in merchandise exports to Kshs 298.4 bn, from Kshs 233.0 bn in Q1’2023 which outpaced the 19.3% increase in merchandise imports to Kshs 640.0 bn from Kshs 536.6 bn recorded in a similar period in 2023. Additionally, the secondary income balance saw a substantial increase, bolstered by strong growth in diaspora remittances. Looking ahead, the outlook for Kenya's current account is optimistic, as continued growth in key export sectors and sustained diaspora remittances are expected to further improve the current account balance. Efforts to diversify exports and enhance value addition in agricultural products, along with prudent fiscal and monetary policies, will be crucial in sustaining this positive trajectory. Furthermore, the ongoing strengthening of Kenyan Shilling against most trading currencies is expected to lower the import bill hence narrowing the current account deficit. We expect that the current administration’s renewed focus on fiscal consolidation will improve the balance of payments performance by minimizing the costs of servicing external debts. Additionally, the favorable weather conditions and government intervention through subsidy programs are set to boost agricultural production in the country, thereby increasing the export of agricultural products, and supporting the current account. We anticipate that the balance of payments will continue being stable with the help of multiple trade agreements, such as the one between Kenya and the EU and the one among the EAC, SADC and COMESA, as the agreements will boost the amount and variety of exports that are needed and offer more opportunities to sell them.
- Stanbic Bank’s June 2024 Purchasing Manager’s Index (PMI)
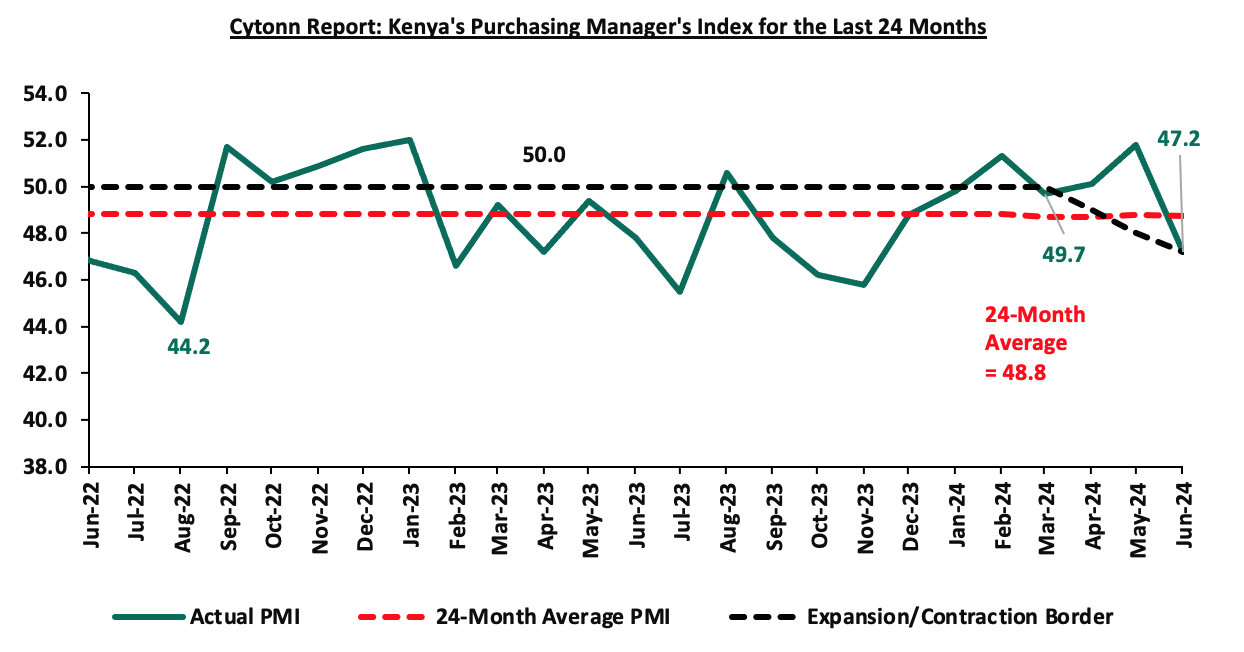
During the week, Stanbic Bank released its monthly Purchasing Manager's Index (PMI) highlighting that the index for the month of May 2024 sharply deteriorated, coming in at 47.2, above the 50.0 neutral, down from 51.8 in May 2024, signaling a deterioration in the operating conditions across Kenya. This was the sharpest decline recorded in seven months. Private sector output dropped markedly in the month of June, reflecting a renewed and steep fall in new business intakes. On a year-to-year basis, the index recorded a 5.2% decline from the 49.8 recorded in January 2024. This sharp decline in the general business environment is mainly attributable to the cost of living crisis, as well as protests surrounding the country’s finance bill which hurt sales volumes. This downturn was partially softened by a rise in new orders across manufacturing, which was the only monitored sector to register growth in June. In addition to the easing inflation, which came in at 4.6%, from 5.1% in June 2024, well below the CBK’s preferred target of 5.0%, and remaining within the Central Bank of Kenya (CBK) target range of 2.5% to 7.5% for the twelfth consecutive month, and a decrease of 0.4% points from 5.1% in May. Notably, the prices for Super Petrol, Diesel and Kerosene decreased by Kshs 3.0, Kshs 6.1 and Kshs 5.7 each respectively, and will retail at Kshs 192.8, Kshs 179.2 and Kshs 168.7 per litre respectively from the May 2024 prices of Kshs 189.8, Kshs 173.1 and Kshs 163.1 respectively.
The average input charges rose for the first time in three months in June, attributable to higher taxation on products was commonly noted by respondents as driving up costs. Meanwhile, output prices recorded a mild increase in anticipation of the increased taxes proposed in the Finance Bill 2024. The sector data showed an increase in output, for the first time since February, with expansions recorded in the services, manufacturing and wholesale & retail segments. Agriculture, services, wholesale and retail sectors were the ones that recorded increases during the month, as manufacturing and construction sectors registered declines. Similarly, the employment levels improved for the sixth consecutive month in June, though mildly, with a rise in staff costs, increased inventories and prospects of new business driven by an uptick in customer demand.
Supplier performance also improved in June , attributable to greater availability of raw materials and competition between various vendors. Notably, overall sentiment towards future activity of the Kenyan business environment slipped for the first time in a while, recording a four-month low. The firms cited economic challenges as the reason for the reduced optimism. Key to note, a PMI reading of above 50.0 indicates an improvement in the business conditions, while readings below 50.0 indicate a deterioration. The chart below summarizes the evolution of PMI over the last 24 months:
Going forward, we expect the business climate to be restrained in the short to medium term as a result of the difficult economic environment and the recent unrest following the anti-finance bill protests in addition to the high interest rates from tightening monetary policy and an overall rise in the cost of living. However, we expect firms to benefit from reduced inflationary pressures and an appreciating Shilling, which will lower input prices.
Rates in the Fixed Income market have been on an upward trend given the continued high demand for cash by the government and the occasional liquidity tightness in the money market. The government is 154.4% ahead of its prorated net domestic borrowing target of Kshs 5.1 bn, and 95.1% behind the total domestic net borrowing target of Kshs 263.2 bn for FY’2024/2025, having a net borrowing position of Kshs 12.9 bn. However, we expect a downward readjustment of the yield curve in the short and medium term, with the government looking to increase its external borrowing to maintain the fiscal surplus, hence alleviating pressure in the domestic market. As such, we expect the yield curve to normalize in the medium to long-term and hence investors are expected to shift towards the long-term papers to lock in the high returns.
Market Performance:
During the week, the equities market recorded mixed performance, with NSE 20 gaining by 0.2% while NASI declined the most by 0.4%; NSE 25 and NSE 10 declined by 0.2% each taking the YTD performance to gains of 22.3%, 19.6%, 18.5% and 10.0% for NSE 10, NSE 25, NASI and NSE 20 respectively. The equities market performance was driven by losses recorded by large-cap stocks such as EABL, Stanbic, and Equity Group of 2.4%, 1.1%, and 0.6% respectively. The performance was, however, supported by gains recorded by large-cap stocks such as Bamburi, KCB Group, and ABSA Bank of 6.7%, 2.4%, and 0.4% respectively.
During the week, equities turnover increased by 9.3% to USD 7.5 mn from USD 6.9 mn recorded the previous week, taking the YTD total turnover to USD 355.8 mn. Foreign investors became net buyers with a net buying position of USD 0.6 mn, from a net selling position of USD 1.1 mn recorded the previous week, taking the YTD foreign net buying position to USD 7.2 mn.
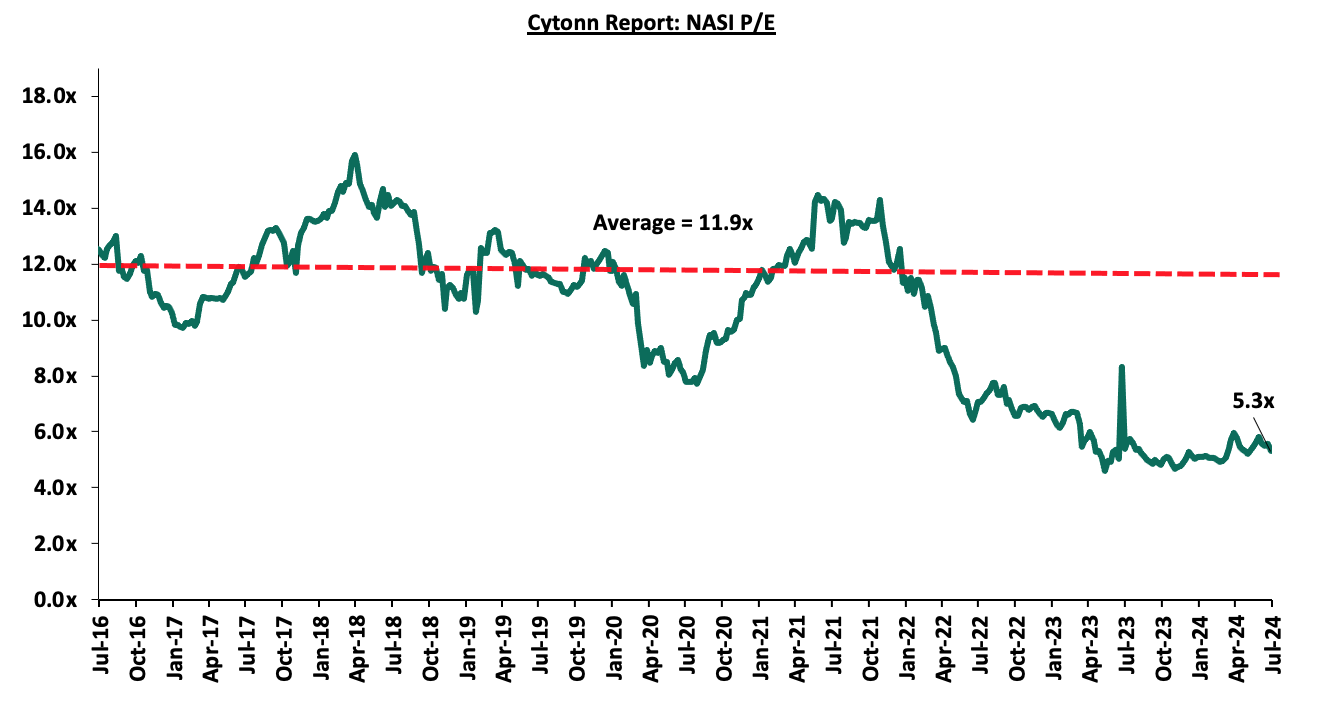
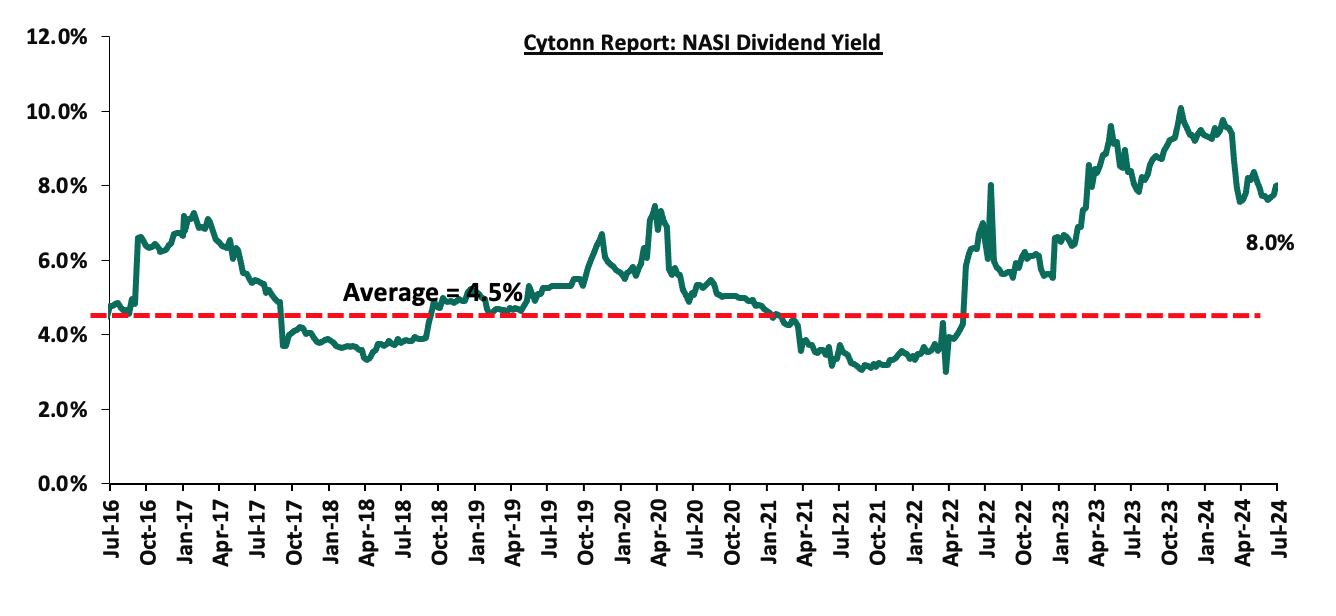
The market is currently trading at a price-to-earnings ratio (P/E) of 5.3x, 55.4% below the historical average of 11.9x. The dividend yield stands at 8.0%, 3.5% points above the historical average of 4.5%. Key to note, NASI’s PEG ratio currently stands at 0.7x, an indication that the market is undervalued relative to its future growth. A PEG ratio greater than 1.0x indicates the market is overvalued while a PEG ratio less than 1.0x indicates that the market is undervalued. The charts below indicate the historical P/E and dividend yields of the market;
Universe of Coverage:
|
Cytonn Report: Equities Universe of Coverage |
||||||||||
|
Company |
Price as at 28/06/2024 |
Price as at 05/07/2024 |
w/w change |
YTD Change |
Year Open 2024 |
Target Price* |
Dividend Yield |
Upside/ Downside** |
P/TBv Multiple |
Recommendation |
|
Kenya Reinsurance |
1.4 |
1.4 |
(1.4%) |
(24.3%) |
185.0 |
3.5 |
21.4% |
171.4% |
0.1x |
Buy |
|
Jubilee Holdings |
179.0 |
168.0 |
(6.1%) |
(9.2%) |
44.8 |
260.7 |
8.5% |
63.7% |
0.3x |
Buy |
|
Sanlam |
5.9 |
5.7 |
(4.7%) |
(5.7%) |
34.2 |
8.8 |
0.0% |
55.7% |
1.6x |
Buy |
|
Equity Group*** |
42.3 |
42.0 |
(0.6%) |
22.8% |
6.0 |
60.2 |
9.5% |
52.9% |
0.8x |
Buy |
|
Diamond Trust Bank*** |
46.5 |
46.4 |
(0.3%) |
3.6% |
38.9 |
65.2 |
10.8% |
51.5% |
0.2x |
Buy |
|
Co-op Bank*** |
12.7 |
12.7 |
(0.4%) |
11.5% |
11.4 |
17.2 |
11.9% |
47.8% |
0.6x |
Buy |
|
NCBA*** |
41.1 |
41.1 |
0.0% |
5.8% |
106.0 |
55.2 |
11.6% |
45.9% |
0.8x |
Buy |
|
KCB Group*** |
31.3 |
32.0 |
2.4% |
45.8% |
22.0 |
46.7 |
0.0% |
45.8% |
0.5x |
Buy |
|
Stanbic Holdings |
114.3 |
113.0 |
(1.1%) |
6.6% |
160.3 |
145.3 |
13.6% |
42.2% |
0.8x |
Buy |
|
CIC Group |
2.1 |
2.2 |
0.9% |
(6.1%) |
11.6 |
2.8 |
6.0% |
36.3% |
0.7x |
Buy |
|
Standard Chartered*** |
194.0 |
193.8 |
(0.1%) |
20.9% |
2.3 |
233.1 |
15.0% |
35.3% |
1.3x |
Buy |
|
ABSA Bank*** |
14.0 |
14.1 |
0.4% |
21.6% |
1.9 |
17.3 |
11.0% |
34.2% |
1.1x |
Buy |
|
I&M Group*** |
21.6 |
21.7 |
0.5% |
24.1% |
17.5 |
25.5 |
11.8% |
29.6% |
0.4x |
Buy |
|
Britam |
6.0 |
6.0 |
(1.0%) |
16.3% |
5.1 |
7.5 |
0.0% |
25.4% |
0.8x |
Buy |
|
Liberty Holdings |
5.3 |
5.3 |
0.4% |
37.8% |
3.9 |
6.1 |
7.0% |
21.7% |
0.4x |
Buy |
|
HF Group |
4.0 |
4.1 |
2.5% |
19.7% |
3.5 |
4.5 |
0.0% |
9.0% |
0.2x |
Hold |
|
Target Price as per Cytonn Analyst estimates **Upside/ (Downside) is adjusted for Dividend Yield ***For Disclosure, these are stocks in which Cytonn and/or its affiliates are invested in |
||||||||||
Weekly Highlights
- NCBA Group Plc Completes Acquisition of AIG Kenya Insurance Company Ltd
During the week, NCBA Group Plc announced the completion of its acquisition of 66.7% of the issued share capital of AIG Kenya Insurance Company Ltd from AIG MEA Ltd. As a result of this acquisition, AIG Kenya has become a wholly-owned subsidiary of NCBA Group Plc. The transaction, which was finalized following meticulous regulatory scrutiny and corporate approvals, including clearances from the Competition Authority of Kenya, the Insurance Regulatory Authority, and the Central Bank of Kenya, solidifies NCBA Group Plc's position in the insurance market.
NCBA Group Plc, formed out of a merger between NIC Group and CBA Group in 2019, has swiftly ascended to become the third-largest banking group in East Africa, serving a vast customer base exceeding 63.0 mn across Kenya, Uganda, Tanzania, and Rwanda. The group’s network spans 107 branches and is supported by strong physical and digital distribution platforms, which are poised to integrate seamlessly with AIG Kenya’s specialized insurance capabilities.
AIG Kenya Insurance Company Limited, a reputable insurer licensed by the Insurance Regulatory Authority, and a subsidiary of the American International Group Inc (AIG), brings a wealth of experience and a robust portfolio of insurance products to NCBA Group Plc. With over five decades of experience, AIG Kenya has carved out a distinguished reputation for delivering sophisticated general insurance solutions to a diverse clientele including corporates, SMEs, and individual customers. Its established market presence across East Africa aligns seamlessly with NCBA’s ambitious growth trajectory since its inception.
By leveraging NCBA's wide distribution networks and AIG Kenya's experience, the group hopes to speed its journey to becoming a universal bank that holistically satisfies consumers' financial needs. The acquisition represents more than a strategic business move; it symbolizes NCBA’s commitment to driving financial inclusion and innovation across East Africa, while propelling AIG Kenya towards greater heights of service excellence and customer satisfaction.
We are “Neutral” on the Equities markets in the short term due to the current tough operating environment and huge foreign investor outflows, and, “Bullish” in the long term due to current cheap valuations and expected global and local economic recovery. With the market currently being undervalued for its future growth (PEG Ratio at 0.7x), we believe that investors should reposition towards value stocks with strong earnings growth and that are trading at discounts to their intrinsic value. We expect the current high foreign investors’ sell-offs to continue weighing down the equities outlook in the short term.
- Industry Report
During the week, the Kenya National Bureau of Statistics (KNBS) released the Q1’2024 GDP Report, and below are the key take-outs related to the Real Estate sector:
- Steady growth in the Real Estate Sector - The Real Estate sector posted steady growth of 6.6% in Q1’2024, which is 0.7% points slower than the 7.3% growth registered in Q1’2023. This growth can be attributed to the increasing need for housing in the country. However, the growth remained subdued compared to Q1’2023 due to the sustained increase in the cost of construction materials, which posed a hurdle to investors and reduced the number of activities in the sector during the period under review. This is evidenced by the reduction in approved building plans in the Nairobi Metropolitan Area (NMA), a major contributor to the Real Estate market in the country. The value of approved buildings reduced by 31.2% to Kshs0 bn in Q1’2024, down from Kshs 56.7 bn recorded in Q1’2023. On a q/q basis, this represented a 0.4%-points increase from the 6.2% growth recorded in Q4’2023. The increased growth in the sector can be linked to heightened activities in the residential sector as investors seek to leverage the rising demand for housing in the country. The graph below shows the Real Estate sector growth rates from Q1’2020 to Q1’2024.
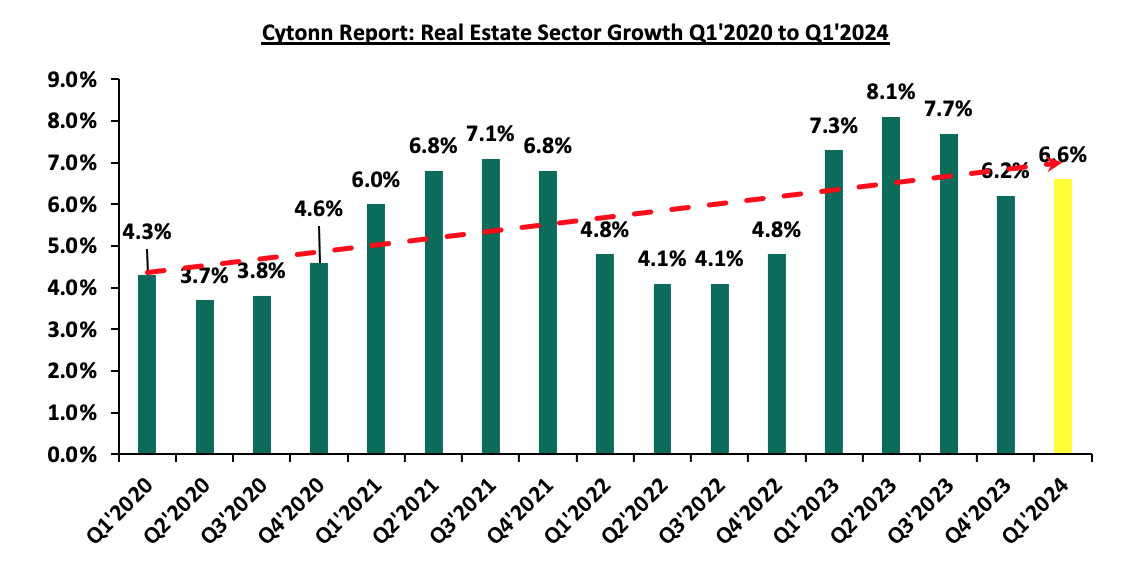
Source: Kenya National Bureau of Statistics (KNBS)
- Subdued growth in the construction sector - The construction sector grew by 0.1% in Q1’2024, which is 2.9% points slower than the 3.0% growth in Q1 2023. On a q/q basis, this performance represented a 2.1%-points decrease from the 2.2% growth recorded in Q4’2023. The subdued performance is attributable to; i) an increase in non-performing loans (NPLs) in the Real Estate sector, making lenders ask for more security, which has slowed projects, ii) a reduction in approved building plans, especially in the NMA, evidenced by a 31.2% reduction in the value of building plans approved in NMA to Kshs 39.0 bn in Q1’2024, down from Ksh 56.7 bn in Q1’2023, iii) a 27.0% increase in construction costs due to rising prices of major building materials such as cement, steel, and paint, now averaging Kshs 71,200 per SQM, and iv) delays in the approval of construction permits, generally impacting construction activities. The graph below shows the construction sector growth rates from Q1’2020 to Q1’2024;
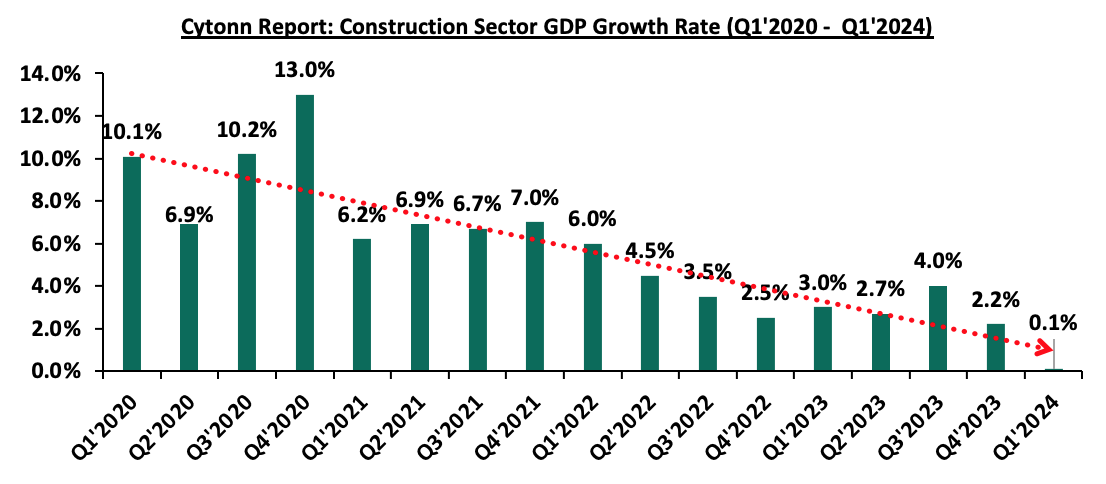
Source: Kenya National Bureau of Statistics (KNBS)
- Sustained Recovery in Accommodation and Restaurant Sector – The accommodation and restaurant services grew by 28.0% during Q1’2024, representing a 19.1%-points y/y decline from the 47.1% growth recorded in Q1’2023. On a q/q basis, this performance represented a 9.9%-points increase from the 18.1% growth recorded in Q4’ 2022. The year-on-year performance can be linked to increased operational expenses due to tough macro-economic pressures from the disruption of the global supply chain by the Russia-Ukraine war and the Israel-Palestine conflict. However, the performance portrays a steady recovery post-COVID-19, amid the lifting of travel restrictions. The sector is poised to gain from an increased number of international arrivals; for instance, in January 2024, the number of arrivals was 134,665, representing a 6% increase compared to 128,772 arrivals in January 2023. The graph below shows the accommodation and restaurant sector growth rates from Q1’2020 to Q1’2024;
Source: Kenya National Bureau of Statistics (KNBS)
We expect the Real Estate sector in Kenya to grow, supported by several factors such as: i) an increase in the number of international arrivals, ii) demand for housing driven by above-average demographics, such as the urbanization rate and population growth rate, which stand at 3.7% and 1.9%, respectively, iii) the continued rollout of the Affordable Housing Programme by the government, and iv) increased activities by industry players, especially in the residential sector. However, we expect the sector’s growth to be impeded by the current political environment in the country, the increased cost of construction, and the increased cost of borrowing for Real Estate projects.
- Residential Sector
During the week, Fairdeal Properties, a private construction company, launched a Kshs 2.0 bn affordable housing project in Bamburi, Mombasa County, which will see the construction of over 500 housing units. The project will be developed in three phases and completion is expected within three and half years. The first phase project will consist of 200 units of one, two, and three-bedroom typology within a gated community, spanning a five-acre parcel of land. According to the project team there will be 68 one-bedroom units at Kshs 2.4 mn each, 182 two-bedroom units at Ksh 3.5 mn each, and 278 three-bedroom units at Kshs 4.4 mn each totaling 528 apartments. The project is estimated to cost Kshs 2.0 bn with buyers required to pay a Kshs 300,000 signing fee and a Kshs 530,000 deposit upon breaking ground. Buyers interested in two- and three-bedroom apartments will pay a signing fee of Kshs 500,000 and deposits of Kshs 710,000 and Kshs 890,000 upon breaking ground. The project is set to significantly contribute to the country’s growth and create job opportunities with the company planning further projects in Mombasa, Nairobi, and Naivasha. The table below summarizes various affordable housing projects by the private sector in Kenya;
|
Cytonn Report: Affordable Housing Projects Initiated by Private Sector Players in Kenya |
||
|
Project Name |
Location |
Number of Units |
|
Great Wall Gardens Phase 6 |
Athi River, Machakos County |
3,000 |
|
Great Wall Gardens Phase 5 |
Mavoko, Machakos County |
1,128 |
|
Samara Estate |
Ruiru |
1,824 |
|
Moke Gardens |
Athi River |
30,000 |
|
Habitat Heights |
Mavoko |
8,888 |
|
Tsavo Apartments |
Embakasi, Riruta, Thindigua, Roysambu, and, Rongai |
3,200 |
|
Unity West |
Tatu City |
3,000 |
|
RiverView |
Athi River |
561 |
|
Kings Serenity |
Ongata Rongai, Kajiado County |
734 |
|
Joinven Estate |
Syokimau, Machakos County |
440 |
|
Kisima Park |
Lukenya |
17,152 |
|
Oasis Park, Athi River |
Athi River |
20,000 |
|
Muselele Estate |
Mavoko |
3,250 |
|
Joinven Investments Ltd |
Syokimau |
400 |
|
Jewel Heights |
1,550 |
|
|
Benvar Estates |
Juja, Kiambu |
15,034 |
|
Kentek Ventures |
Syokimau, Machakos |
53,716 |
|
Samara Estates |
Migaa, Kiambu |
1,824 |
|
Edeville |
Donholm |
1,300 |
|
Breezewood Gardens |
4,950 |
|
|
Centum Investments, Rea Vipingo |
Vipingo, Kilifi |
5,300 |
|
The Creek Village |
Mshomoroni, Mombasa |
968 |
|
Buxton Point |
Buxton, Mombasa |
1,984 |
|
Fairdeal Properties |
Bamburi, Mombasa |
528 |
|
Total |
180,731 |
|
Source: Boma Yangu, Online Research
Going forward, we expect the sector to grow, supported by: i) more activities by private players, especially in the residential sector, to cater to the annual housing deficit, which currently stands at 2.0 mn housing units, ii) the initiation and completion of major infrastructure developments, opening up satellite areas for investment opportunities, and, iii) positive demographics in the country. Additionally, development by private players is expected to increase home ownership in the country. The chart below shows national home ownership percentages of other countries as compared to Kenya;
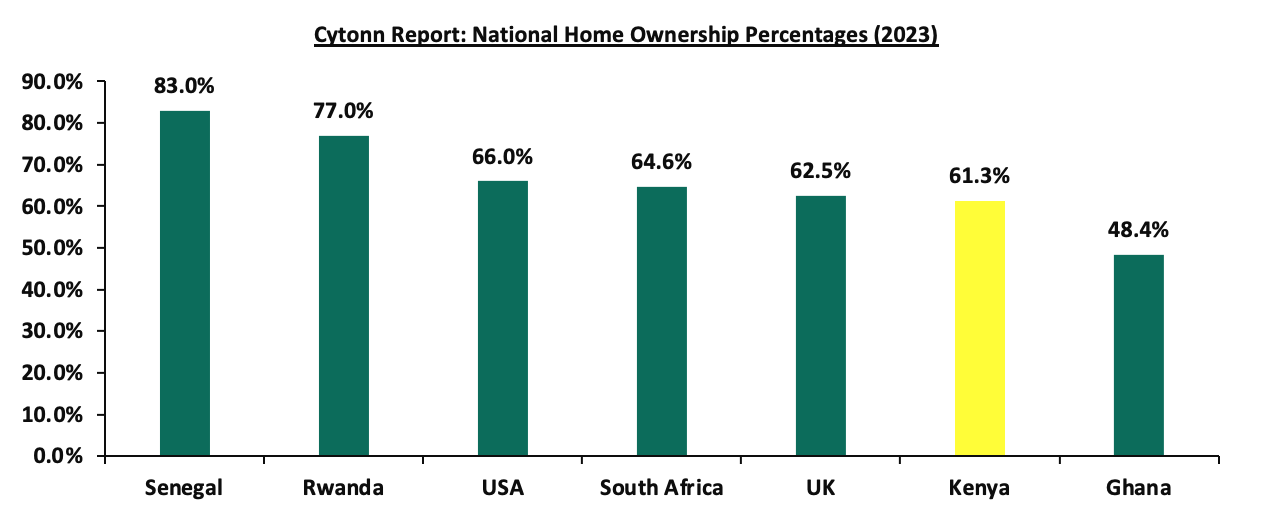
Source: Centre for Affordable Housing Africa, US Census Bureau, United Kingdom Office for National Statistics
- Real Estate Investments Trusts (REITs)
On the Unquoted Securities Platform, Acorn D-REIT and I-REIT traded at Kshs 24.5 and Kshs 22.0 per unit, respectively, as per the last updated data on 28th June, 2024. The performance represented a 22.5% and 10.0% gain for the D-REIT and I-REIT, respectively, from the Kshs 20.0 inception price. The volumes traded for the D-REIT and I-REIT came in at 12.3 mn and 30.7 mn shares, respectively, with a turnover of Kshs 257.5 mn and Kshs 633.8 mn, respectively, since inception in February 2021.
REITs provide several advantages, including tax exemptions, diversified portfolios, and stable long-term profits. However, the ongoing decline in the performance of Kenyan REITs and the restructuring of their business portfolios are hindering substantial past investments. Other general challenges include: i) a lack of understanding of the investment instrument among investors, ii) lengthy approval processes for REIT creation, iii) high minimum capital requirements of Kshs 100.0 mn for trustees, and iv) minimum investment amounts set at Kshs 5.0 mn for Investment REITs, all of which continue to limit the performance of the Kenyan REITs market.
We expect Kenya’s Real Estate sector to remain on a growth trend, supported by: i) an increase in the number of international arrivals in the hospitality sector, ii) the initiation and completion of major infrastructure projects, opening up areas for development, iii) demand for housing sustained by positive demographics, such as population and urbanization growth rates, which stood at 1.9% and 3.7% respectively, above the global averages of 0.8% and 1.5% as of 2022, iv) activities by the government under the Affordable Housing Agenda (AHP), v) heightened activities by private players in the residential sector, vi) demand for quality offices, especially in the Nairobi Metropolitan Area, and vii) increased investment by local and international investors in the retail sector. However, challenges such as rising construction costs, strain on infrastructure development (including drainage systems), high capital requirements for REITs, and existing oversupply in select Real Estate sectors will continue to hinder the sector’s optimal performance by limiting developments and investments.
On 13 June 2024, the National Treasury presented Kenya’s FY’2024/2025 National Budget to the National Assembly highlighting that the total budget estimates for FY’2024/25 increased by 3.1% to Kshs 4.0 tn from the Kshs 3.9 tn in FY’2023/2024 while the total revenue inclusive of grants increased by 15.2% to Kshs 3.4 tn from Kshs 2.9 tn in FY’2023/2024. The increase is mainly due to an 18.5% increase in ordinary revenue to Kshs 2.9 tn for FY’2024/2025, from the Kshs 2.5 tn in FY’2023/24.
The FY’2024/2025 budget focuses mainly on providing solutions to the heightened concerns on the high cost of living, the measures put in to accelerate economic recovery as well as undertaking a growth-friendly fiscal consolidation to preserve the country’s debt sustainability. Notably, the government projects to narrow the fiscal deficit to 3.3% of GDP in FY’2024/25, from the estimate of 5.7% of GDP in FY’2023/24. As such, this week, we shall discuss the recently released budget and the withdrawn Finance Bill 2024 with a key focus on Kenya’s fiscal components. We shall do this in four sections, namely:
- FY’2023/2024 Budget Outturn as at May 2024,
- Comparison between FY'2023/2024 and FY'2024/2025 Budget estimates,
- Analysis and House-view on Key Aspects of the 2024 Budget,
- The Withdrawn Finance Bill 2024, and,
- Conclusion and Our View.
Section I: FY’2023/2024 Budget Outturn as at May 2024
The National Treasury gazetted the revenue and net expenditures for the eleventh month of FY’2023/2024, ending 31st May 2024. Below is a summary of the performance:
|
Amounts in Kshs billions unless stated otherwise |
||||||
|
Cytonn Report: FY'2023/2024 Budget Outturn - As at 31st May 2024 |
||||||
|
Item |
12-months Original Estimates |
Revised Estimates I |
Actual Receipts/Release |
Percentage Achieved of the Revised Estimates |
Prorated |
% achieved of the Prorated |
|
Opening Balance |
|
|
2.6 |
|
|
|
|
Tax Revenue |
2,495.8 |
2,495.83 |
1,928.8 |
77.3% |
2,287.8 |
84.3% |
|
Non-Tax Revenue |
75.3 |
80.9 |
94.2 |
116.3% |
74.2 |
126.9% |
|
Total Revenue |
2,571.2 |
2,576.8 |
2,025.6 |
78.6% |
2,362.0 |
85.8% |
|
External Loans & Grants |
870.2 |
849.8 |
527.5 |
62.1% |
779.0 |
67.7% |
|
Domestic Borrowings |
688.2 |
851.9 |
704.7 |
82.7% |
780.9 |
90.2% |
|
Other Domestic Financing |
3.2 |
3.2 |
3.5 |
111.1% |
2.9 |
121.2% |
|
Total Financing |
1,561.6 |
1,704.9 |
1,235.7 |
72.5% |
1,562.8 |
79.1% |
|
Recurrent Exchequer issues |
1,302.8 |
1,360.1 |
1,112.8 |
81.8% |
1,246.8 |
89.3% |
|
CFS Exchequer Issues |
1,963.7 |
2,078.8 |
1,594.7 |
76.7% |
1,905.6 |
83.7% |
|
Development Expenditure & Net Lending |
480.8 |
457.2 |
261.1 |
57.1% |
419.1 |
62.3% |
|
County Governments + Contingencies |
385.4 |
385.4 |
287.1 |
74.5% |
353.3 |
81.3% |
|
Total Expenditure |
4,132.7 |
4,281.6 |
3,255.8 |
76.0% |
3,924.8 |
83.0% |
|
Fiscal Deficit excluding Grants |
1,561.6 |
1,704.9 |
1,230.2 |
72.2% |
1,562.8 |
78.7% |
|
Total Borrowing |
1,558.4 |
1,701.7 |
1,232.2 |
72.4% |
1,559.9 |
79.0% |
Source: National Treasury of Kenya
The Key take-outs from the release include;
- Total revenue collected as at the end of May 2024 amounted to Kshs 2,025.6 bn, equivalent to 78.6% of the revised estimates of Kshs 2,576.8 bn for FY’2023/2024, and is 85.8% of the prorated estimates of Kshs 2,362.0 bn. Cumulatively, tax revenues amounted to Kshs 1,928.8 bn, equivalent to 77.3% of the revised estimates of Kshs 2,495.8 bn and 84.3% of the prorated estimates of Kshs 2,287.8 bn,
- Total financing amounted to Kshs 1,235.7 bn, equivalent to 72.5% of the revised estimates of Kshs 1,704.9 bn and is equivalent to 79.1% of the prorated estimates of Kshs 1,562.8 bn. Additionally, domestic borrowing amounted to Kshs 704.7 bn, equivalent to 82.7% of the revised estimates of Kshs 851.9 bn and is 90.2% of the prorated estimates of Kshs 780.9 bn,
- The total expenditure amounted to Kshs 3,255.8 bn, equivalent to 76.0% of the revised estimates of Kshs 4,281.6 bn, and is 83.0% of the prorated target expenditure estimates of Kshs 3,924.8 bn. Additionally, the net disbursements to recurrent expenditures came in at Kshs 1,112.8 bn, equivalent to 81.8% of the revised estimates of Kshs 1,360.1 and 89.3% of the prorated estimates of Kshs 1,246.8 bn,
- Consolidated Fund Services (CFS) Exchequer issues came in at Kshs 1,594.7 bn, equivalent to 76.7% of the revised estimates of Kshs 2,078.8 bn, and are 83.7% of the prorated amount of Kshs 1,905.6 bn. The cumulative public debt servicing cost amounted to Kshs 1,455.8 bn which is 78.0% of the revised estimates of Kshs 1,866.0 bn, and is 85.1% of the prorated estimates of Kshs 1,710.5 bn. Additionally, the Kshs 1,455.8 bn debt servicing cost is equivalent to 71.9% of the actual revenues collected as at the end of May 2024, and,
- Total Borrowings as at the end of May 2024 amounted to Kshs 1,232.2 bn, equivalent to 72.4% of the revised estimates of Kshs 1,701.7 bn for FY’2023/2024, and are 79.0% of the prorated estimates of Kshs 1,559.9 bn. The cumulative domestic borrowing of Kshs 851.9 bn comprises of Net Domestic Borrowing Kshs 471.4 bn and Internal Debt Redemptions (Rollovers) Kshs 380.5 bn.
The government has been unable to meet its prorated revenue targets for the eleven months of the FY’2023/2024, attaining 85.8% of the revenue targets in May 2024, mainly on the back of the tough economic situation exacerbated by higher taxes and high interest rates. Notably, the cost of living remains elevated in the country, despite an ease inflation, with the inflation rate easing to 4.6% in June 2024 from 5.1% in May 2024 which continues to impede revenue collection. Additionally, the business environment worsened in June 2024 to 47.2 from 51.8 in May 2024 mainly on the back of the anti-Finance Bill 2024 protests. In light of this, the government is yet to fully benefit from the strategies put in place to improve revenue collection such as expanding the revenue base and sealing tax leakages, and suspension of tax relief payments. The coming months' revenue collection performance will largely depend on how quickly the country's business climate stabilizes. This stabilization is expected to be aided by the ongoing appreciation of the Shilling, and a further ease in inflationary pressures in the country.
Section II: Comparison between FY’2023/2024 and FY’2024/2025 Budgets estimates
The Kenyan Government budget has been growing over the years on the back of increasing recurrent and development expenditures. The chart below shows the evolution of the government budget over a thirteen-year period:
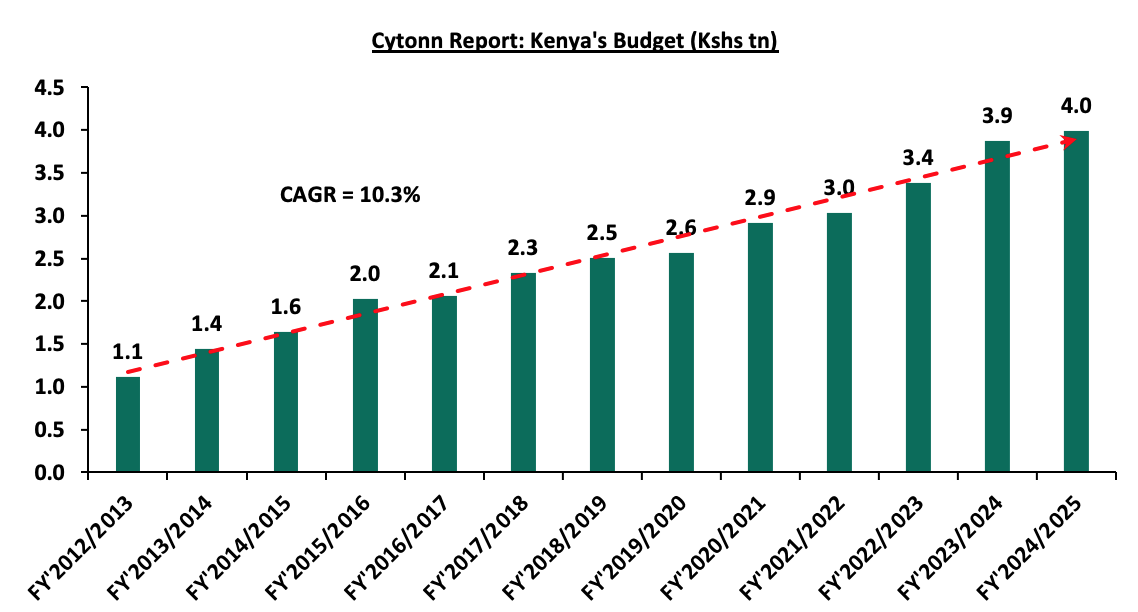
Source: National Treasury of Kenya
For the FY’2024/2025, the budget is projected to increase by 3.1% to Kshs 4.0 tn, from Kshs 3.9 tn in FY’2023/2024. The expenditure will be funded by revenue collections of Kshs 3.4 tn and borrowings amounting to Kshs 597.0 bn.
The table below summarizes the key buckets and the projected changes:
|
Amounts in Kshs billions unless stated otherwise |
|||
|
Cytonn Report: Comparison between FY’2023/2024 and FY’2024/2025 Budgets Estimates |
|||
|
Item |
FY'2023/24 Supplementary Budget II |
FY'2024/25 Estimates |
Change y/y (%) |
|
Ordinary Revenue |
2,461.0 |
2,917.2 |
18.5% |
|
Total Appropriation-in-Aid |
446.5 |
426.0 |
(4.6%) |
|
Total grants |
38.4 |
51.8 |
34.7% |
|
Total Revenue & Grants |
2,946.0 |
3,395.0 |
15.2% |
|
Recurrent expenditure |
1,719.9 |
1,628.6 |
(5.3%) |
|
Recurrent Consolidated Funds Services (CFS) |
1,057.7 |
1,213.4 |
14.7% |
|
Development expenditure |
669.3 |
745.9 |
11.4% |
|
County Transfer & Contingencies |
425.1 |
404.1 |
(4.9%) |
|
Total expenditure |
3,872.0 |
3,992.0 |
3.1% |
|
Fiscal deficit inclusive of grants |
(926.1) |
(597.0) |
(35.5%) |
|
Projected Deficit as % of GDP |
(5.7%) |
(3.3%) |
(2.4%) pts |
|
Net foreign borrowing |
319.3 |
333.8 |
4.5% |
|
Net domestic borrowing |
606.8 |
263.2 |
(56.6%) |
|
Total borrowing |
926.1 |
597.0 |
(35.5%) |
Source: Financial Statement For the FY 2024/2025-Budget , The Mwananchi Guide for the FY’2024/25, National Treasury of Kenya
Some of the key take-outs include;
- The government projects total revenue inclusive of grants for FY’2024/25 to increase by 18.5% to Kshs 3.4 tn (equivalent to 18.8% of GDP), from the Kshs 2.9 tn in FY’2024/2025 (equivalent to 18.3% of GDP). The increase is mainly due to a 18.5% increase in ordinary revenue to Kshs 2.9 tn (equivalent to 16.2% of GDP) for FY’2024/2025, from the Kshs 2.5 tn in FY’2023/24 (equivalent to 15.3% of GDP),
- Total expenditure is set to increase by 3.1% to Kshs 4.0 tn (equivalent to 22.2% of GDP), from Kshs 3.9 tn (equivalent to 24.0% of GDP) in the FY’2023/24 Budget estimates,
- Recurrent expenditure is set to decrease by 5.3% to Kshs 1.6 tn in FY’2023/2024, from Kshs 1.7 tn in the FY’2023/2024 budget estimates, while Consolidated Funds Services (CFS) expenditure is expected to increase by 14.7% to Kshs 1,213.4 bn, from Kshs 1,057.7 bn in the FY’2023/2024 budget estimates. Also, Development expenditure is set to increase by 11.4% to Kshs 745.9 bn, from Kshs 669.3 bn in the FY’2023/2024 budget estimates,
- Public debt is expected to continue growing in FY’2024/25, as the approximate Kshs 597.0 bn fiscal deficit will be financed through domestic debt totaling Kshs 263.2 bn and foreign debts totaling Kshs 333.8 bn. However, the total borrowing is expected to reduce by 35.5% to Kshs 597.0 bn in the FY’2024/25, from Kshs 926.1 bn as per the FY’2023/2024 supplementary budget II, in a bid to reduce Kenya’s public debt burden which was estimated at 73.4% of GDP as of December 2023, surpassing the 50.0% recommended threshold by 23.4% points, and,
- The budget deficit is projected to decline by 2.4% points to 3.3% of GDP, from the 5.7% of GDP in the FY’2023/2024 budget, mainly as growth in revenues outpace growth in expenditure.
Section III: Analysis and House-view on Key Aspects of the FY’2022/2023 Budget
- Revenue
Revenue is projected to increase by 15.2% to Kshs 3.4 tn in FY’2024/25, from Kshs 2.9 tn in the FY’2023/24 supplementary budget II. The increased revenue projections in the FY’2024/25 are mainly attributable to the projected 18.5% growth in ordinary revenue to Kshs 2.9 tn in FY’2024/25, from Kshs 2.5 tn in the FY’2023/24 budget. The main sources of revenue will be:
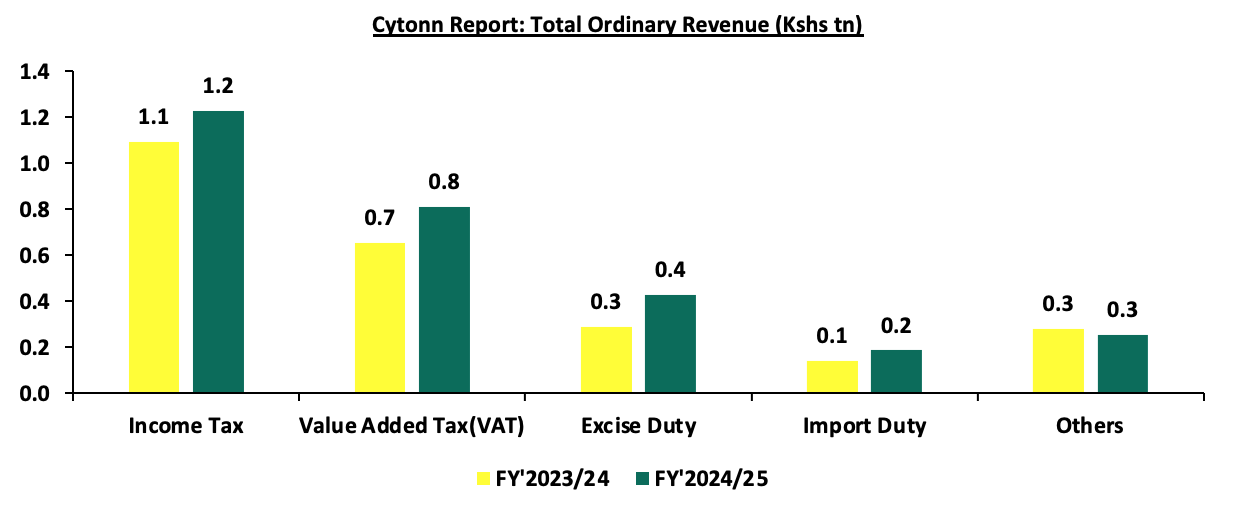
- Income Tax, which remains the highest contributor to government revenue, contributing 36.2% of the total revenue projections of Kshs 3.4 tn, is expected to increase by 12.5% to Kshs 1.2 tn in FY’2024/25, from Kshs 1.1 tn in FY’2023/2024,
- Value Added Tax (VAT) contributing 23.9% of the projected total revenue is projected to increase by 24.0% to Kshs 812.2 bn in FY’2024/25 budget, from Kshs 654.8 bn in the FY’2023/24 budget,
- Excise Duty contributing 12.7% to the projected revenues for the FY’2024/25 is expected to increase by 48.1% to Kshs 429.6 bn, from Kshs 290.1 bn in FY’2023/24 budget estimates, and,
- Import Duty contributing 5.5% to the projected revenues for the FY’2024/25 is expected to increase by 31.6% to Kshs 187.4 bn, from Kshs 142.4 bn in FY’2023/24 budget estimates.
The chart below compares ordinary revenue projections for FY’2024/25 and FY’2023/24:
The government relies on the effectiveness of the Kenya Revenue Authority in collecting taxes as well as increase in some of the existing taxes to meet its revenue target. Historically, the government has struggled to meet its target revenue collections resulting to an ever-present fiscal deficit. As such, there are still concerns about the government's ability to meet its revenue collection targets in FY’2024/2025, mainly on the back of the withdrawal of the Finance Bill 2024, which sought to raise an additional Kshs 302.0 bn, as well as the current operating environment, where the cost of living remains elevated despite an ease in inflationary pressures. The chart below shows the ordinary revenue performance in the previous fiscal years:
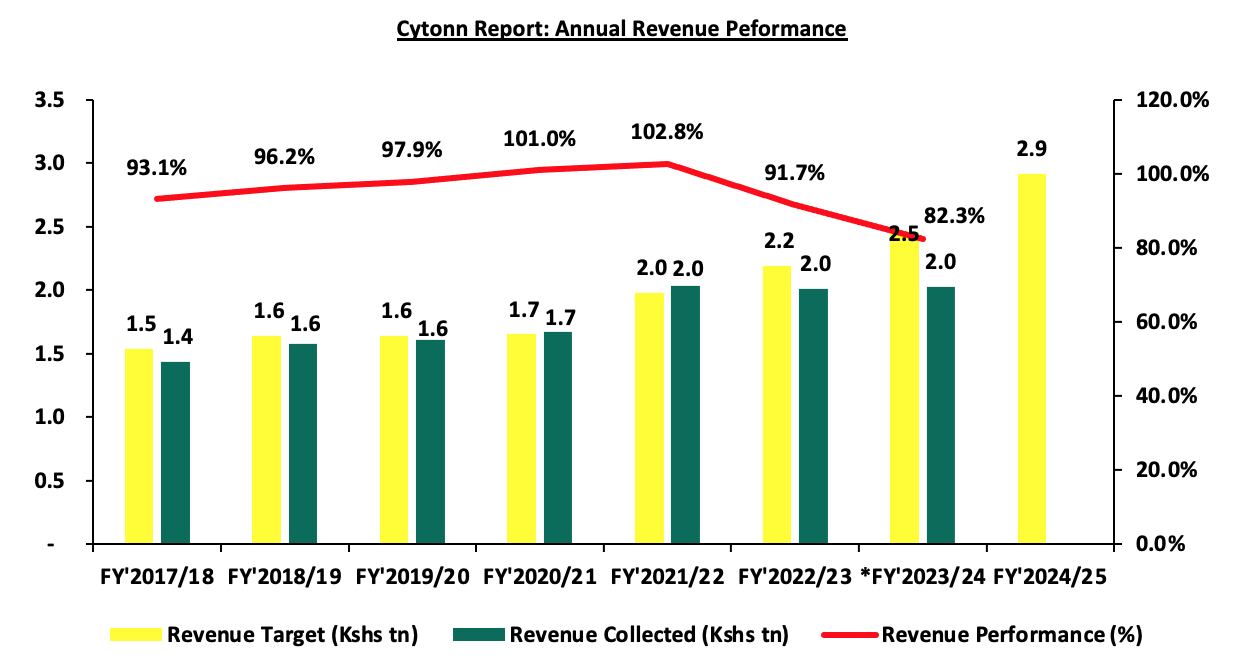
Source: National Treasury of Kenya and Kenya Revenue Authority
*Total Revenue collection as of 31 May 2024
- Expenditure
Expenditure is expected to increase by 3.1% to Kshs 4.0 tn, from Kshs 3.9 tn in the FY’2023/24 budget with recurrent expenditure taking up 71.2% of the total expenditure for FY’2023/2024, in comparison to the 71.7% in FY’2023/2024. The chart below shows the comparison between the recurrent expenditure allocations and development expenditure allocations over the past five fiscal years:
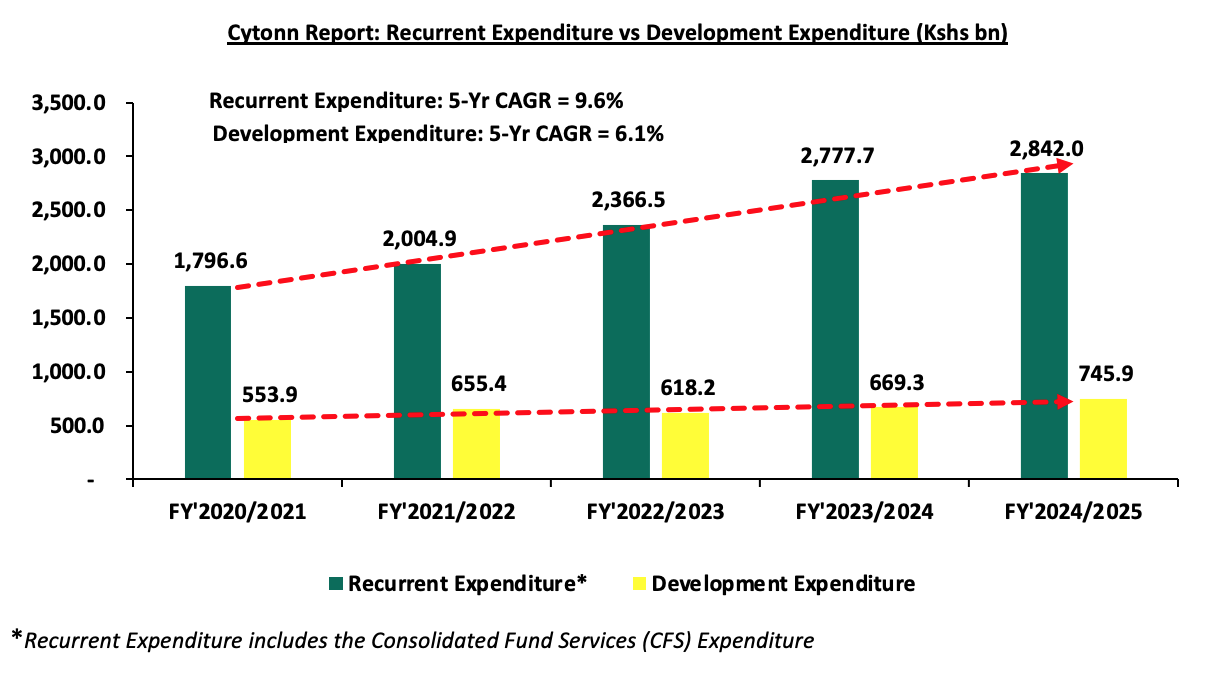
Some of the key take-outs include;
- Recurrent expenditure takes the largest proportion of government expenditure over the last five fiscal years growing at a 5-year CAGR of 9.6% to Kshs 2,842.0 bn in FY’2024/25, from Kshs 1,796.6 bn in FY’2020/2021. For the FY’2024/2025, the recurrent expenditure is estimated to increase by 2.3% to Kshs 2,842.0 bn, from Kshs 2,777.7 bn in FY’2023/2024 mainly due to a 14.7% increase in Consolidated Fund Services (CFS) expenditure to Kshs 1,213.4 bn from Kshs 1057.7 bn in FY’2023/2024. The increase can be mainly attributed to the increased debt servicing cost which represented 91.3% of the CFS expenditure in FY’2023/2024 as of 31st May 2024. We expect the debt servicing cost to continue increasing as the government is expected to borrow more to close the revenue gap following the withdrawal of Finance Bill 2024, and,
- Development expenditure on the other hand continues to lag behind contributing only 18.7% of the FY’2024/25 expenditure estimates. Allocation to infrastructure remains the highest taking 64.0% of the development expenditure. In the FY’2024/2025, infrastructure expenditure is set to increase by 1.9% to Kshs 477.2 bn, from Kshs 468.2 bn in FY’2023/2024 in line with the government’s agenda of increasing the development of critical infrastructure in the road, rail, sea, and airport sectors in order to open many areas to economic activities and spur growth in cross border trade and regional integration. The table below shows the sectors with the highest expenditure allocation over the last five fiscal years:
|
Amounts in Kshs billions unless stated otherwise |
|||||||
|
Cytonn Report: Kenya Budget Highest Expenditure Allocations |
|||||||
|
Item |
FY'2020/2021 |
FY'2021/2022 |
FY'2022/2023 |
FY'2023/2024 |
FY'2024/2025 |
Change |
CAGR |
|
Interest Payments, Pensions & Net Lending |
586.5 |
718.3 |
867.8 |
1,057.7 |
1,213.4 |
14.7% |
15.7% |
|
Education |
505.1 |
503.9 |
544.4 |
628.6 |
656.6 |
4.5% |
5.4% |
|
Infrastructure |
363.3 |
383.3 |
416.4 |
468.2 |
477.2 |
1.9% |
5.6% |
|
County Shareable Revenue |
316.5 |
370.0 |
399.6 |
423.9 |
400.1 |
(5.6%) |
4.8% |
|
Public Admin & Int. Relations |
289.3 |
299.7 |
342.2 |
327.0 |
322.4 |
(1.4%) |
2.2% |
|
Total |
2,060.7 |
2,275.2 |
2,570.4 |
2,905.4 |
3,069.7 |
5.7% |
8.3% |
Source: The Mwananchi Guide for the FY’2024/25 National Treasury of Kenya
Notably, the allocation to interest payment, pension and net lending increased by 14.7% to Kshs 1,213.4 bn in FY’2024/25 from Kshs 1,057.7 bn in FY’2023/24, partly attributable to high cost of servicing debt.
- Borrowing
The total borrowing for the FY’2024/25 is set to reduce by 35.5% to Kshs 597.0 bn, from Kshs 926.1 bn, in FY’2023/24 budget estimates. The public debt mix is projected to comprise of 55.9% foreign debt and 44.1% domestic debt, from 34.5% foreign financing and 65.5% domestic financing as per the FY’2023/24 Supplementary Budget II. The rise in debt servicing expenses can be partly attributed to the government’s high affinity for debt to finance the wide budget deficits, partly fueled by the ballooning recurrent expenditure and debt costs. The chart below shows the evolution of public borrowing to fill the fiscal deficit gap over the last five years:
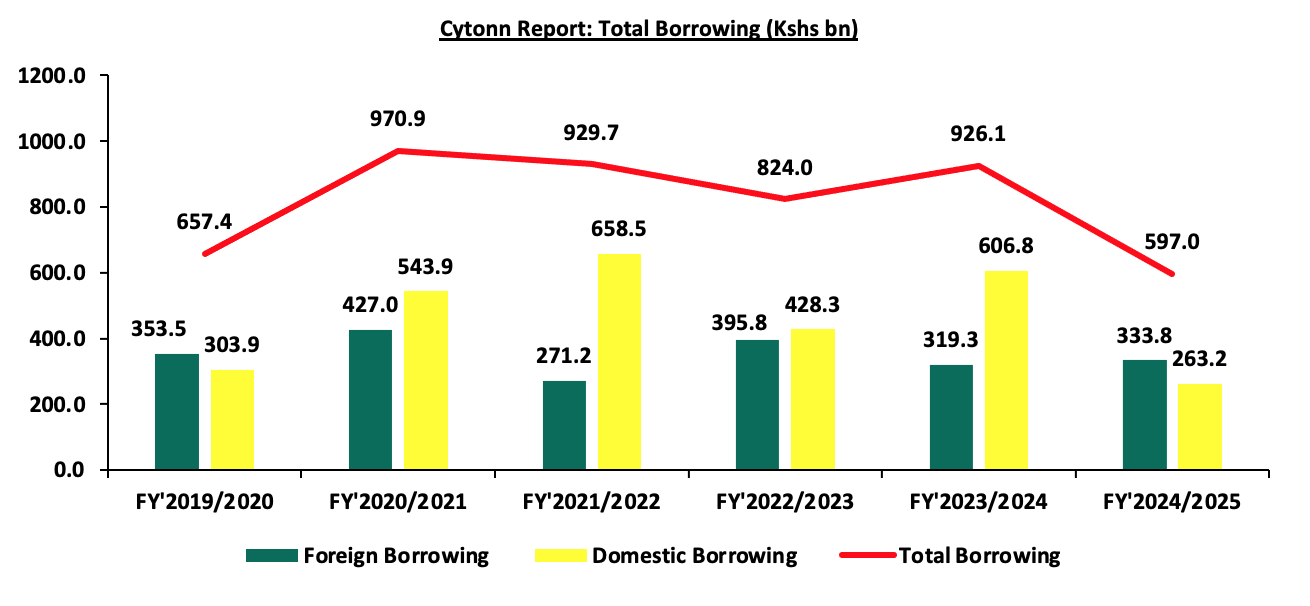
The key take-outs from the chart include:
- The proportion of domestic financing is estimated to decrease to 44.1% in FY’2024/25 from 65.5% in FY’2023/24. The decline is expected to reduce the crowding out of the private sector by the government as banks prefer lending to the government as opposed to the private sector which is considered riskier, with a possible decline in interest rates, and,
- The total borrowing is expected to decline by 35.5% to Kshs 597.0 bn, from 926.1 bn in FY’2023/24, reflecting the government’s fiscal consolidation efforts aimed at reducing the fiscal deficit and dependence on debt through rationalization of tax expenditures and ensuring the sustainability and value for money from the available resources.
We therefore note the persistent fiscal deficit is mainly on the back of low revenue collection and high expenditure. As such, the government needs to minimize spending through the implementation of structural reforms and the reduction of amounts extended to recurrent expenditure. This would allow the government to refinance other critical sectors, such as agriculture, resulting in increased revenue.
Section IV: Withdrawal of the Finance Bill 2024
Following nationwide protests that peaked on Tuesday 25th June 2024, President William Ruto, on Wednesday 26th June 2024 conceded to pressure from the public and declined to sign the controversial Finance Bill 2024 into law.
The proposed raft of tax changes in the Finance Bill 2024 were geared towards expanding the tax base and increasing revenues, with an expectation of raising Kshs 302.0 bn. This revenue was intended to support the government's budget of Kshs 4.0 tn for the FY’2024/2025, and to address a budget deficit of Kshs 597.0 bn. The deficit is planned to be financed through external borrowing of Kshs 333.8 bn and domestic borrowing of Kshs 263.2 bn. Kenya’s total public debt to GDP ratio currently stands at 69.7%, which is higher than the 55.0% preferred by the World Bank and the International Monetary Fund (IMF). Below we highlight some of the key tax proposals contained in the Finance Bill 2024, changes made and the implications of the withdrawal of the Bill:
- Under the Income Tax Act:
- Motor vehicle tax: The Bill proposed a new 2.5% tax on the value of motor vehicles, payable when issuing insurance cover,
- Withholding Tax on Goods Supplied to Public Entities: The Bill suggested a withholding tax on goods supplied to public entities by residents and non-residents without a permanent establishment. The rate is 3.0% for resident suppliers and 5.0% for non-residents,
- Taxation of Digital Marketplaces and Content Monetization: The Bill proposed taxing income from digital marketplaces or platforms and digital content monetization at 20.0% for non-residents and 5.0% for residents,
- Repeal of Digital Service Tax and Introduction of Significant Economic Presence Tax: The Bill sought to repeal the digital service tax (DST) and introduce a significant economic presence tax at 30.0% of deemed taxable profit for non-residents earning income from services provided through digital marketplaces in Kenya,
- Tax Deductibility of Contributions to Medical Funds and Housing Levy: The Bill proposed making contributions to the Social Health Insurance Fund, post-retirement medical fund, and affordable housing levy deductible expenses when calculating taxable income,
- Investment Deduction on Spectrum Licence Purchases: The Bill introduced an investment deduction for capital expenditure on spectrum licenses by telecommunications operators at 10% in equal installments. For licenses purchased before 01 July 2024, the deduction is limited to the unamortized portion over the remaining useful life, and,
- Tax on Interest Income from Infrastructure Bonds: The Bill proposed taxing interest income from infrastructure bonds for resident persons, while non-residents' interest income remains exempt. Interest from previously listed infrastructure bonds will continue to be exempt.
- Under the Excise Duty Act:
- Introduction of Excise Duty on Digital Services by Non-Residents: The Bill proposed a 20.0% excise duty on services provided by non-residents through digital platforms in Kenya. This applies to; Telephone and internet data services, fees for money transfer services by banks, money transfer agencies, and other financial service providers, betting, lottery, gaming, and prize competitions, and fees on digital lending,
- Increase of Excise Duty on Money Transfer Services: The Bill suggested raising excise duty from 15.0% to 20.0% on fees for money transfer services provided by banks, money transfer agencies, and other financial service providers, and cellular phone service providers or payment service providers licensed under the National Payment Systems Act, 2011,
- Extension of Timeline for Excise Duty Payment by Alcoholic Beverage Manufacturer: The Bill proposed extending the payment timeline for excise duty by licensed alcoholic beverage manufacturers to five working days after removing goods from the stockroom. The previous requirement was to pay within 24 hours, and,
- Repeal of Automatic Adjustment for Inflation: The Bill proposed removing provisions for the automatic adjustment of excise duty rates on excisable goods for inflation.
- Under the Value Added Tax (VAT) Act
- VAT on Financial Services: The Bill proposed removing VAT exemptions for several financial services, making them subject to the standard VAT rate of 16.0%. These services include: Issuing credit and debit cards, telegraphic money transfers, foreign exchange transactions, cheque handling and processing, issuing securities for money, debt assignment for consideration, financial services provided on a commission basis,
- Increase of VAT Registration Threshold: The Bill proposed raising the threshold for mandatory VAT registration from Kshs 5.0 mn to Kshs 8.0 mn,
- Exemption for Transfer of Business: The Bill proposed exempting the transfer of a business as a going concern from VAT, which is currently taxed at 16.0%,
- VAT on Insurance Premiums: The Bill proposed limiting VAT exemptions to insurance and reinsurance premiums only, subjecting other related services to the standard VAT rate of 16.0%.
- VAT on Betting, Gaming, and Lotteries: The Bill proposed removing the VAT exemption for betting, gaming, and lotteries, making them subject to the standard VAT rate of 16.0%,
- Removal of VAT Exemptions in Tourism: The Bill proposed deleting the following VAT exemptions in the tourism sector: Goods for the construction of tourism facilities and recreational parks of 50 acres or more, locally assembled vehicles for transporting tourists, purchased by tour operators, services for the construction of tourism facilities and recreational parks of 50 acres or more, and,
- Removal of VAT Exemptions in Manufacturing and Construction: The Bill proposed deleting the following VAT exemptions for the manufacturing and construction sectors: Capital goods promoting investment in manufacturing with a value of at least Kshs 2.0 bn, plant, machinery, and equipment for constructing plastics recycling plants, and goods and services for constructing and equipping specialized hospitals with a minimum bed capacity of 50, approved by the Cabinet Secretary for Health
Changes effected to the Finance Bill 2024 included:
- Removal of VAT on Bread: The Finance Committee scrapped the proposed 16.0% VAT on bread following public backlash,
- Excise Duty on Vegetable Oil: The President approved the removal of a proposed 25.0% excise duty on vegetable oil,
- VAT on Sugar Cane Transportation: The State House eliminated the proposed 16.0% VAT on transporting sugar cane to factories, which could have led to higher sugar prices,
- VAT on Financial Services: The Committee removed VAT on financial services and foreign exchange transactions, preventing a potential increase from 15.0% to 40.0% that could have affected forex transactions,
- Mobile Money Transfer Charges: The proposed increase of excise duty on mobile money transfer charges from 15.0% to 20.0% was reversed,
- Motor Vehicle Tax: The proposed annual motor vehicle tax of 2.5% of car value, with a minimum of Kshs 5,000 and a maximum of Kshs 100,000, was removed due to public outcry,
- Housing Fund and Social Health Insurance Levies: These proposed levies were converted to tax-deductible expenses, exempting them from income tax and benefiting employees,
- Eco Levy Adjustments: The Eco Levy will now apply only to imported finished products, not locally manufactured goods, addressing concerns about stifling local manufacturing growth,
- Exemptions on Locally Manufactured Products: The Eco Levy will not apply to locally made products, including sanitary towels, diapers, phones, computers, tyres, and motorcycles,
- VAT Registration Threshold: Small businesses with a turnover of less than Kshs 8.0 mn are exempt from VAT registration, up from the previous threshold of Kshs 5.0 mn,
- eTIMS Exemption: Farmers and small businesses with a turnover below Kshs 1.0 mn are exempt from registering for the electronic Tax Invoice Management System (eTIMS),
- Excise Duty on Imported Agricultural Products: The Committee imposed excise duty on imported table eggs, onions, and potatoes to protect local farmers, scrapping the proposed 16.0% VAT,
- Excise Duty on Alcoholic Beverages: Excise duty will be based on alcohol content rather than volume, encouraging the production of safer and more affordable alcohol,
- Pension Contributions: The exemption threshold for pension contributions was increased from Kshs 20,000 to Kshs 30,000,
- Funding for Junior Secondary School Interns: The budget for recruiting Junior Secondary School interns was increased from Kshs 13.4 bn to Kshs 18.0 bn, and,
- Teacher Intern Recruitment: Funds have been allocated to hire 20,000 teacher interns, with a policy shift to transition these teachers to permanent and pensionable terms.
The withdrawal of the Finance Bill 2024 in Kenya has significant implications for the country's economy and investment landscape. The withdrawal of the Bill will create a revenue shortfall for the FY’2024/2025 budget, and will likely result in Kenya missing the 3.3% fiscal deficit target this year and lead to a possible cut in development expenditure, increased borrowing, higher interest rates, and a potential rise in public debt. Furthermore, after reaching a staff-level agreement with the IMF, the proposed tax measures reversal will possibly impede the disbursement of future IMF funds. Uncertainty about the budgetary trajectory and the IMF program would further complicate the government's efforts to increase external funding.
The Finance Bill's withdrawal may affect investor confidence, especially if the market perceives it as a sign of political or economic instability, and could impact both domestic and foreign investment inflows. Investors may adopt a wait-and-see approach, leading to decreased market activity.
Section V: Conclusion and Our View
The Kenyan economy has continued to remain resilient despite recording a slowdown in growth to 5.0% in Q1’2024 compared to a growth of 5.5% recorded in Q1’2023. We expect the economy to grow at a slower pace given the restrained business as a result of the difficult economic environment caused by increasing taxes, and an overall rise in the cost of living. Additionally, the Central Bank of Kenya’s Monetary Policy Committee’s (MPC) decision on 5th June 2024 to maintain the Central Bank Rate (CBR) at 13.0% in a bid to curb inflation and maintain price stability is expected to curtail economic growth. The higher CBR is set to maintain the cost of credit issued by lenders high, hence discouraging borrowing, which will in turn lead to reduced investment spending in the economy by both individuals and businesses. However, the economy is expected to record a growth rate of 5.4% in 2024, mainly supported by private sector growth, continued strong growth of the financial services sector, and recoveries in the agricultural sector. Furthermore, in the FY’2024/2025 budget, the government has allocated Kshs 10.0 bn for the fertilizer subsidy program aimed at lowering the cost of farm input and enhancing food supply in the country.
The government has reduced its appetite for debt, projecting to borrow Kshs 597.0 bn in total debt in the FY’2024/25, a 35.5% decrease from 926.1 bn in the FY’2023/24. The move is expected to lower the cost of debt servicing, given that both foreign and domestic debt has been ballooning as a result of wide budget deficits. Additionally, the government's shift to borrow less domestically, by projecting to decrease its domestic borrowing by 56.6% to Kshs 263.2 bn in FY’2024/25, from Kshs 606.8 bn in FY’2024/25, is expected to increase credit to the private sector, with reduced credit demand by the government.
Overall, we are of the view that the main driver of the growing public debt is the fiscal deficit occasioned by lower revenues as compared to expenditures. As a result, implementing robust fiscal consolidation would help the government bridge the deficit gap. This can be achieved by minimizing spending through the implementation of structural reforms and the reduction of amounts extended to recurrent expenditure. Fiscal consolidation would also allow the government to refinance other critical sectors, such as agriculture, resulting in increased revenue. However, the overall risk to the economy remains high, owing to the high debt servicing costs in the next fiscal year.
Disclaimer: The views expressed in this publication are those of the writers where particulars are not warranted. This publication is meant for general information only and is not a warranty, representation, advice or solicitation of any nature. Readers are advised in all circumstances to seek the advice of a registered investment advisor.

- Talk to us
- Kenya
- P.O Box 20695 - 00200, Nairobi, Kenya
- Cell +254709101200
- Tel +254709101200
- WhatsApp +254741676635
- United States
- +254709101200
- DOWNLOAD OUR APP
-


- Kenya
- 8th Floor, Pinetree Plaza, Kaburu Drive, Ngong Road, Nairobi, Kenya
- USA
- Suite 1150, 1775 Eye Street NW, USA, Washington DC 20006, USA
- Investments
- High Yield
- Private Equity
- Real Estate
- Real Estate
- RiverRun Estates
- Cytonn Towers
- The Ridge
- Taraji Heights
- The Alma