Kenya’s FY’2025/2026 Budget Review, & Cytonn Weekly #26/2025
By Research Team, Jun 29, 2025
Executive Summary
Fixed Income
During the week, T-bills were undersubscribed for the first time in eight weeks, with the overall subscription rate coming in at 60.4%, albeit lower than the subscription rate of 114.1% recorded the previous week. Investors’ preference for the shorter 91-day paper waned, with the paper receiving bids worth Kshs 1.4 bn against the offered Kshs 4.0 bn, translating to a subscription rate of 36.2%, lower than the subscription rate of 93.6%, recorded the previous week. The subscription rates for the 182-day paper decreased to 12.0% from the 26.1% recorded the previous week, while that of the 364-day paper decreased to 118.4% from the 210.4% recorded the previous week. The government accepted a total of Kshs 14.4 bn worth of bids out of Kshs 14.5 bn bids received, translating to an acceptance rate of 99.7%. The yields on the government papers were on a downward trajectory with the yields on the 91-day paper decreasing the most by 3.0 bps to 8.14% from the 8.17% recorded the previous week, while the yields on the 364-day and 182-day papers decreased by 1.7 bps and 1.5 bps to 9.72% and 8.46%, from the 9.74% and 8.48% respectively recorded the previous week;
In the primary bond market, the government is looking to raise Kshs 50.0 bn for budgetary support through the reopened bonds; FXD1/2018/020 and FXD1/2018/025 with fixed coupon rates of 13.2% and 13.4% respectively and tenors to maturity of 12.8 years and 18.0 years respectively. The period of sale for the two bonds opened on Tuesday, 24th June 2025 and will close on 9th July 2025. Our bidding range for FXD1/2018/020 and FXD1/2018/025 is 12.25%-13.00% and 12.35%-13.00% respectively;
Also, we are projecting the y/y inflation rate for June 2025 to increase marginally to within the range of 3.9% - 4.1% mainly on the back of increased electricity and petrol prices;
Equities
During the week, the equities market was on an upward trajectory, with NSE 20 gaining the most by 5.3% while NASI, NSE 10 and NSE 25 gained by 4.6%, 4.1% and 4.0% respectively, taking the YTD performance to gains of 21.6%, 16.4%, 13.6% and 13.1% for NASI, NSE 20, NSE 10 and NSE 25. The equities market performance was driven by gains recorded by large-cap stocks such as KCB, Equity and NCBA of 6.7%, 5.9% and 4.9%, respectively;
Additionally, in the regional equities market, the East African Exchanges 20 (EAE 20) share index gained by 33.1 bps, attributable to gains recorded by large cap stocks such as Safaricom PLC, Cooperative Bank and MTN Uganda of 3.9%, 1.8% and 1.0% respectively. The performance was however weighed down by losses recorded by large cap stocks such as Tanzania Breweries, Tanga Cement Ltd and Tanzania cigarette of 4.5%, 2.6% and 2.6% respectively;
During the week, Equity Bank placed TransCentury Plc and its subsidiary East African Cables under receivership to recover a combined Kshs 4.7 billion debt, after the lapse of a 90-day court injunction. This development adds to a growing list of firms facing insolvency amid high debt levels, reduced access to credit, and a challenging operating environment. As of May, and June 2025, several companies across manufacturing, real estate, and services entered receivership or liquidation, reflecting broader financial strain.
During the week, the Capital Markets Authority (CMA) suspended trading of TransCentury Plc and East African Cables due to insolvency proceedings, raising the number of suspended companies on the Nairobi Securities Exchange (NSE) to six out of 63 listed. The suspensions reflect increasing financial strain on over-leveraged firms and highlight the urgent need for regulatory reforms to restore investor confidence and end the decade-long IPO drought.
Real Estate
During the week, the Kenya National Bureau of Statistics (KNBS) released the Leading Economic Indicators (LEI) April 2025 Reports, which highlighted the performance of major economic indicators.
During the week, the Cabinet approved the Affordable Housing Regulations, 2024, reducing the minimum housing deposit under the Affordable Housing Programme from 10.0% to 5.0% in a bid to enhance accessibility for low and middle-income earners. The new regulations also introduce supportive frameworks such as structured home loans, deposit support and tenant purchase schemes to boost uptake. This comes as the government seeks to accelerate housing delivery and bridge the homeownership gap under the Bottom-Up Economic Transformation Agenda (BETA).
On the Unquoted Securities Platform, Acorn D-REIT and I-REIT traded at Kshs 26.7 and Kshs 22.9 per unit, respectively, as per the last updated data on 27th June 2025. The performance represented a 33.4% and 14.5% gain for the D-REIT and I-REIT, respectively, from the Kshs 20.0 inception price. Additionally, ILAM Fahari I-REIT traded at Kshs 11.0 per share as of 20th June 2025, representing a 45.0% loss from the Kshs 20.0 inception price. The volume traded to date came in at 1.2 mn shares for the I-REIT, with a turnover of Kshs 1.5 mn since inception in November 2015.
Focus of the Week
Following the release of Kenya’s FY’2025/2026 National Budget, this week we analyze the fiscal components of the budget including revenue expectation, expenditure, and public debt. We shall also look at the key tax changes in the recently signed Finance Bill 2025
Investment Updates:
- Weekly Rates: Cytonn Money Market Fund closed the week at a yield of 13.5% p.a. To invest, dial *809# or download the Cytonn App from Google Play store here or from the Appstore here;
- We continue to offer Wealth Management Training every Tuesday, from 7:00 pm to 8:00 pm. The training aims to grow financial literacy among the general public. To register for any of our Wealth Management Trainings, click here;
- If interested in our Private Wealth Management Training for your employees or investment group, please get in touch with us through wmt@cytonn.com;
- Cytonn Insurance Agency acts as an intermediary for those looking to secure their assets and loved ones’ future through insurance namely; Motor, Medical, Life, Property, WIBA, Credit and Fire and Burglary insurance covers. For assistance, get in touch with us through insuranceagency@cytonn.com;
- Cytonn Asset Managers Limited (CAML) continues to offer pension products to meet the needs of both individual clients who want to save for their retirement during their working years and Institutional clients that want to contribute on behalf of their employees to help them build their retirement pot. To more about our pension schemes, kindly get in touch with us through pensions@cytonn.com;
Hospitality Updates:
- We currently have promotions for Staycations. Visit cysuites.com/offers for details or email us at sales@cysuites.com;
Money Markets, T-Bills Primary Auction:
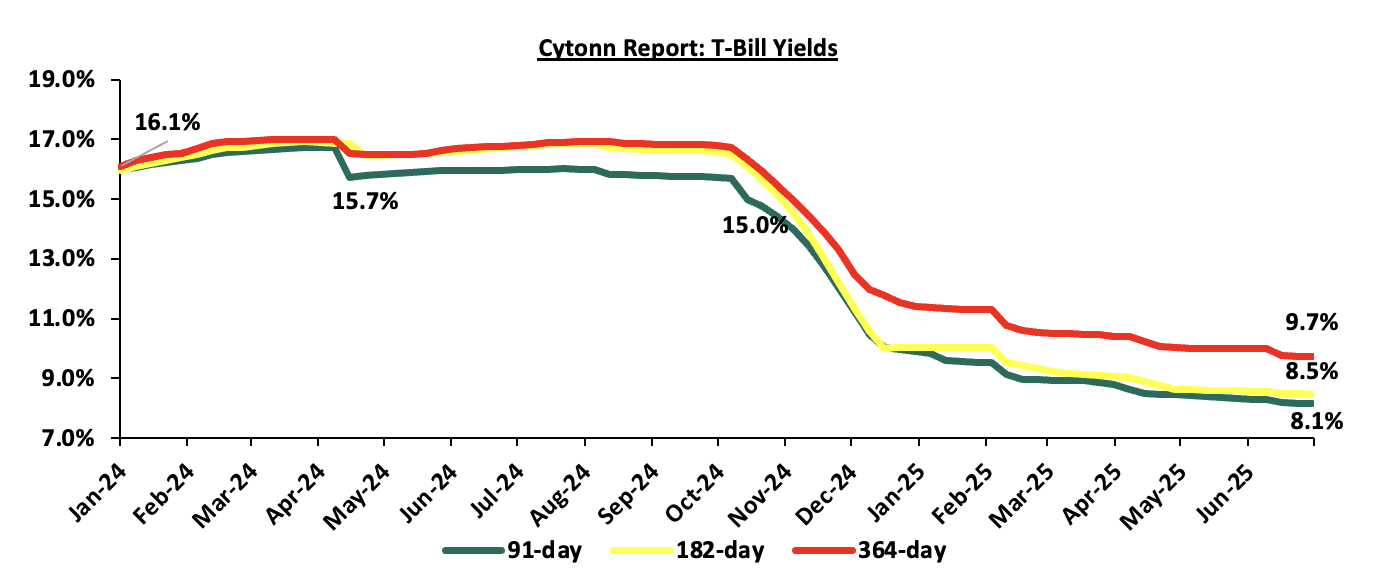
During the week, T-bills were undersubscribed for the first time in eight weeks, with the overall subscription rate coming in at 60.4%, albeit lower than the subscription rate of 114.1% recorded the previous week. Investors’ preference for the shorter 91-day paper waned, with the paper receiving bids worth Kshs 1.4 bn against the offered Kshs 4.0 bn, translating to a subscription rate of 36.2%, lower than the subscription rate of 93.6%, recorded the previous week. The subscription rates for the 182-day paper decreased to 12.0% from the 26.1% recorded the previous week, while that of the 364-day paper decreased to 118.4% from the 210.4% recorded the previous week. The government accepted a total of Kshs 14.4 bn worth of bids out of Kshs 14.5 bn bids received, translating to an acceptance rate of 99.7%. The yields on the government papers were on a downward trajectory with the yields on the 91-day paper decreasing the most by 3.0 bps to 8.14% from the 8.17% recorded the previous week, while the yields on the 364-day and 182-day papers decreased by 1.7 bps and 1.5 bps to 9.72% and 8.46%, from the 9.74% and 8.48% respectively recorded the previous week.
The chart below shows the yield performance of the 91-day, 182-day and 364-day papers over the period;
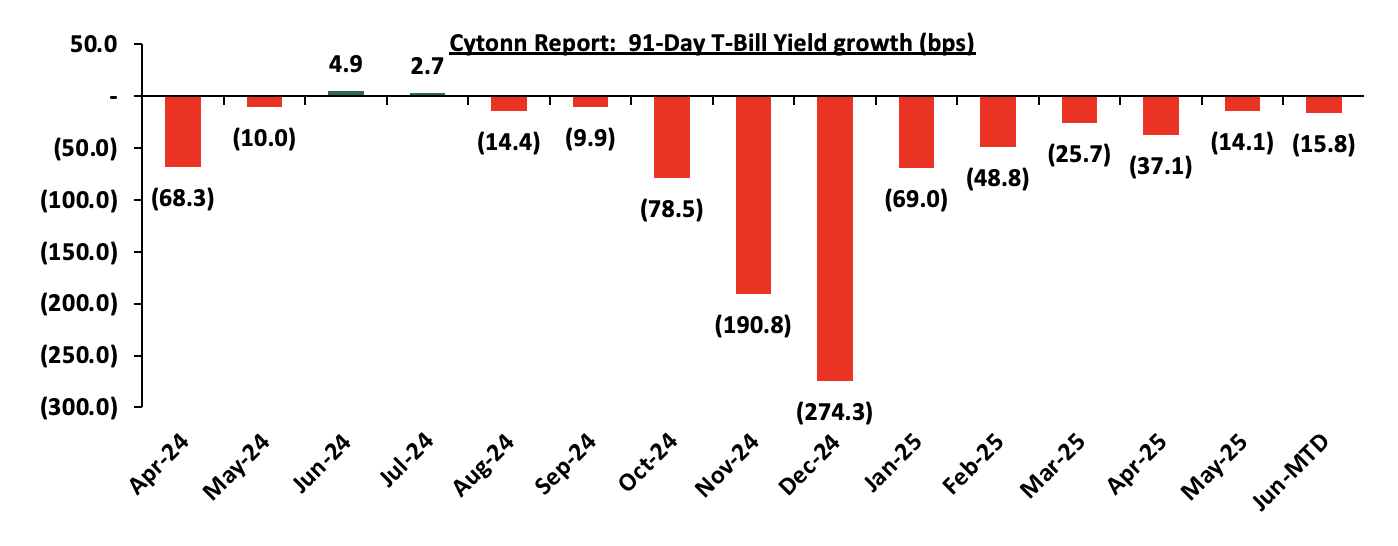
The chart below shows the yield growth for the 91-day T-bill:
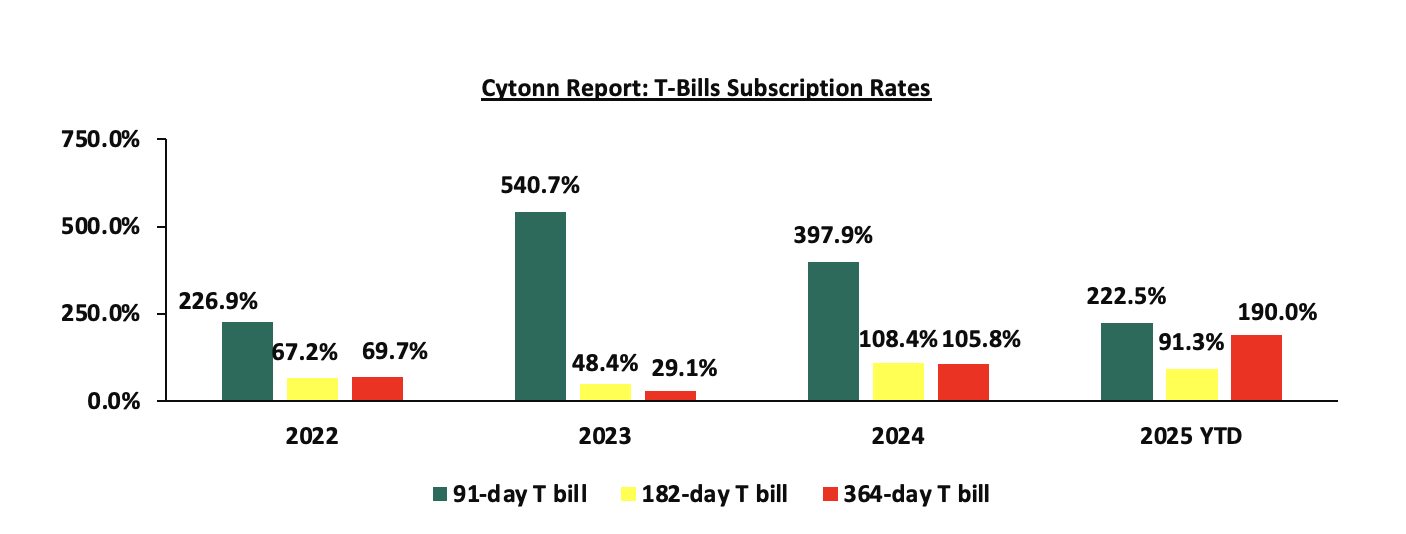
The chart below compares the overall average T-bill subscription rates obtained in 2022,2023, 2024 and 2025 Year-to-date (YTD):
In the primary bond market, the government is looking to raise Kshs 50.0 bn for budgetary support through the reopened bonds; FXD1/2018/020 and FXD1/2018/025 with fixed coupon rates of 13.2% and 13.4% respectively and tenors to maturity of 12.8 years and 18.0 years respectively. The period of sale for the two bonds opened on Tuesday, 24th June 2025 and will close on 9th July 2025. Our bidding range for FXD1/2018/020 and FXD1/2018/025 is 12.25%-13.00% and 12.35%-13.00% respectively.
Money Market Performance:
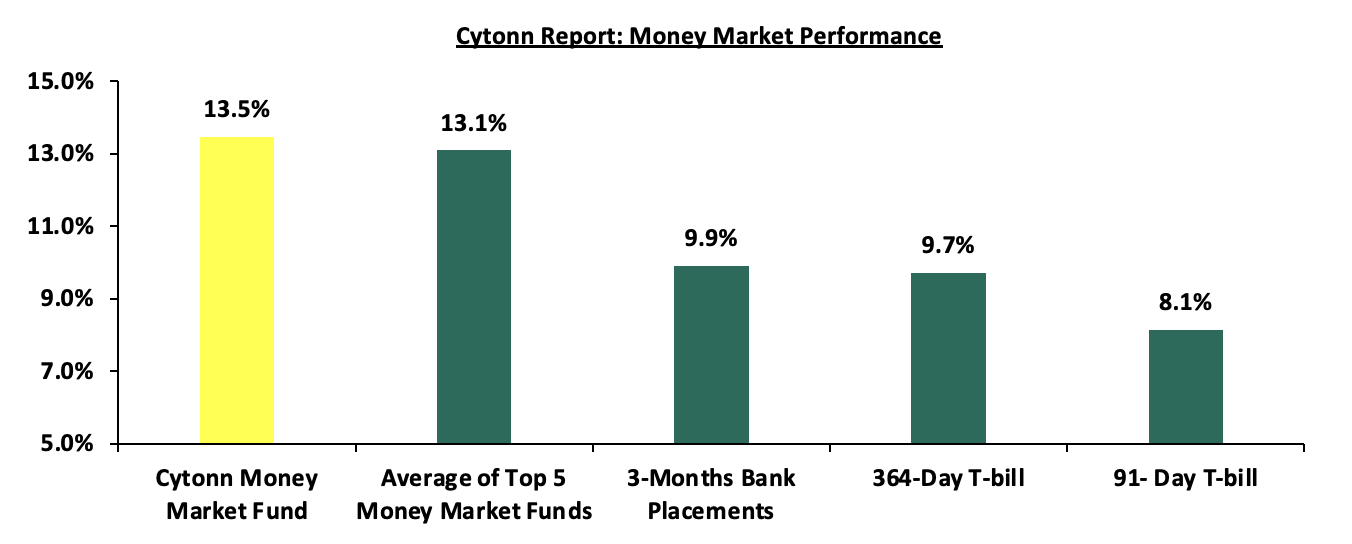
In the money markets, 3-month bank placements ended the week at 9.9% (based on what we have been offered by various banks) and the yields on the government papers were on a downward trajectory with the yields on 91-day and 364-day papers decreasing by 3.0 bps and 1.7 bps respectively to 8.1% and 9.7% from the 8.2% and 9.7% respectively recorded the previous week. The yield on the Cytonn Money Market Fund decreased by 2.0 bps to remain relatively unchanged from the 13.5% recorded the previous week, while the average yields on the Top 5 Money Market Funds decreased by 17.0 bps to 13.1% from the 13.3% recorded the previous week.
The table below shows the Money Market Fund Yields for Kenyan Fund Managers as published on 27th June 2025:
|
Cytonn Report: Money Market Fund Yield for Fund Managers as published on 27th June 2025 |
||
|
Rank |
Fund Manager |
Effective Annual Rate |
|
1. |
Cytonn Money Market Fund (Dial *809# or download Cytonn App) |
13.5% |
|
2. |
Gulfcap Money Market Fund |
13.1% |
|
3. |
Ndovu Money Market Fund |
13.1% |
|
4. |
Kuza Money Market fund |
12.9% |
|
5. |
Orient Kasha Money Market Fund |
12.9% |
|
6. |
Lofty-Corban Money Market Fund |
12.8% |
|
7. |
Etica Money Market Fund |
12.7% |
|
8. |
GenAfrica Money Market Fund |
12.6% |
|
9 |
Arvocap Money Market Fund |
12.0% |
|
10. |
Nabo Africa Money Market Fund |
11.6% |
|
11. |
Enwealth Money Market Fund |
11.3% |
|
12. |
Madison Money Market Fund |
11.3% |
|
13. |
Old Mutual Money Market Fund |
11.2% |
|
14. |
British-American Money Market Fund |
11.0% |
|
15. |
Jubilee Money Market Fund |
10.9% |
|
16. |
Apollo Money Market Fund |
10.6% |
|
17. |
Faulu Money Market Fund |
10.5% |
|
18. |
Sanlam Money Market Fund |
10.3% |
|
19. |
Dry Associates Money Market Fund |
10.1% |
|
20. |
KCB Money Market Fund |
10.1% |
|
21. |
Absa Shilling Money Market Fund |
9.9% |
|
22. |
Genghis Money Market Fund |
9.8% |
|
23. |
CIC Money Market Fund |
9.8% |
|
24. |
Mali Money Market Fund |
9.6% |
|
25. |
ICEA Lion Money Market Fund |
9.5% |
|
26. |
Co-op Money Market Fund |
9.5% |
|
27. |
Mayfair Money Market Fund |
8.4% |
|
28. |
AA Kenya Shillings Fund |
8.0% |
|
29. |
Stanbic Money Market Fund |
7.2% |
|
30. |
Ziidi Money Market Fund |
7.1% |
|
31. |
Equity Money Market Fund |
5.3% |
Source: Business Daily
Liquidity:
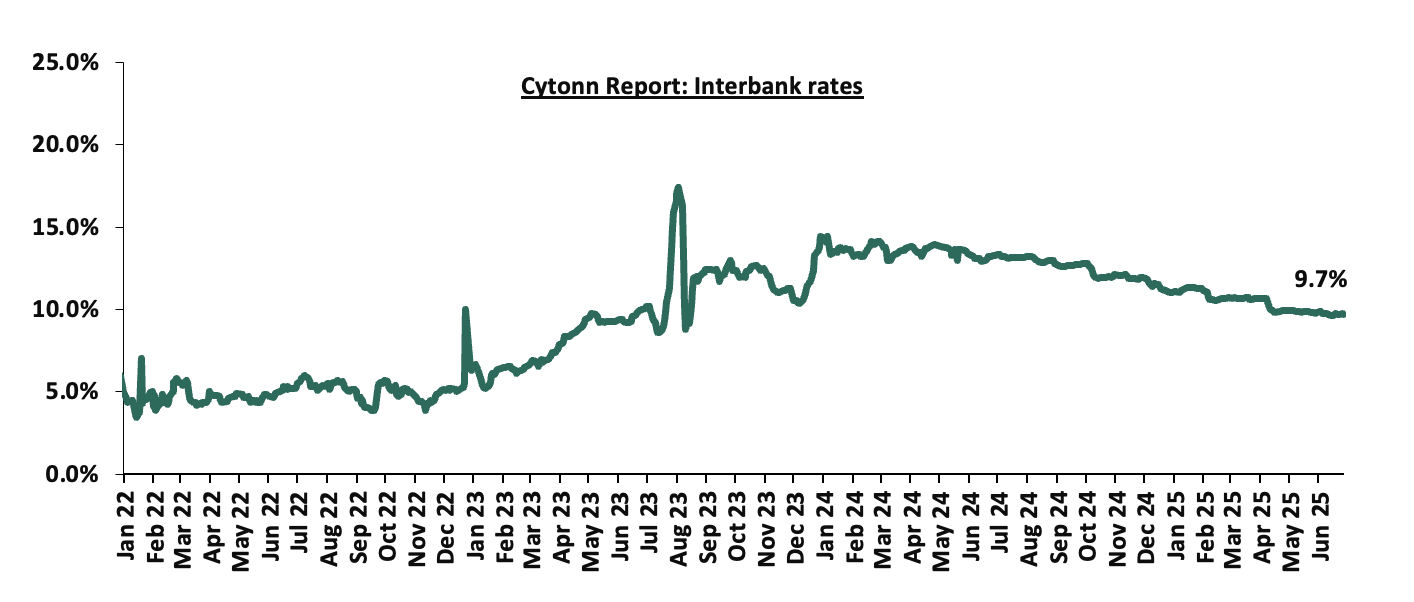
During the week, liquidity in the money markets marginally tightened, with the average interbank rate increasing by 2.2 bps, to remain relatively unchanged from the 9.7% recorded the previous week, partly attributable to government payments that were offset by tax remittances. The average interbank volumes traded increased significantly by 415.7% to Kshs 23.0 bn from Kshs 4.5 bn recorded the previous week. The chart below shows the interbank rates in the market over the years:
Kenya Eurobonds:
During the week, the yields on Kenya’s Eurobonds were on a downward trajectory with the yield on the 10-year Eurobond issued in 2018 decreasing the most by 20.8 bps to 8.3% from the 8.5% recorded the previous week. The table below shows the summary performance of the Kenyan Eurobonds as of 26th June 2025;
|
Cytonn Report: Kenya Eurobond Performance |
|||||||
|
|
2018 |
2019 |
2021 |
2024 |
2025 |
||
|
Tenor |
10-year issue |
30-year issue |
7-year issue |
12-year issue |
13-year issue |
7-year issue |
11-year issue |
|
Amount Issued (USD) |
1.0 bn |
1.0 bn |
0.9 bn |
1.2 bn |
1.0 bn |
1.5 bn |
1.5 bn |
|
Years to Maturity |
2.7 |
22.7 |
1.9 |
6.9 |
9.0 |
5.6 |
10.7 |
|
Yields at Issue |
7.3% |
8.3% |
7.0% |
7.9% |
6.2% |
10.4% |
9.9% |
|
02-Jan-25 |
9.1% |
10.3% |
8.5% |
10.1% |
10.1% |
10.1% |
9.95% |
|
02-Jun-25 |
8.7% |
10.8% |
- |
10.0% |
10.1% |
9.9% |
|
|
19-Jun-25 |
8.5% |
10.7% |
- |
9.8% |
10.0% |
9.7% |
|
|
20-Jun-25 |
8.6% |
10.8% |
- |
9.9% |
10.1% |
9.8% |
|
|
23-Jun-25 |
8.5% |
10.6% |
- |
9.9% |
10.2% |
9.8% |
|
|
24-Jun-25 |
8.4% |
10.6% |
- |
9.7% |
10.0% |
9.6% |
|
|
25-Jun-25 |
8.3% |
10.6% |
- |
9.6% |
9.9% |
9.5% |
|
|
26-Jun-25 |
8.3% |
10.6% |
- |
9.7% |
9.9% |
9.5% |
|
|
Weekly Change |
(0.2%) |
(0.1%) |
- |
(0.1%) |
(0.1%) |
(0.2%) |
- |
|
MTD Change |
(0.4%) |
(0.2%) |
- |
(0.3%) |
(0.2%) |
(0.4%) |
- |
|
YTD Change |
(0.8%) |
0.3% |
- |
(0.4%) |
(0.2%) |
(0.6%) |
- |
Source: Central Bank of Kenya (CBK) and National Treasury
Kenya Shilling:
During the week, the Kenyan Shilling remained stable, appreciating marginally against the US Dollar by 1.5 bps, to remain relatively unchanged from the Kshs 129.3 recorded the previous week. On a year-to-date basis, the shilling has appreciated by 4.0 bps against the dollar, compared to the 17.4% appreciation recorded in 2024.
We expect the shilling to be supported by:
- Diaspora remittances standing at a cumulative USD 5,033.0 mn in the twelve months to May 2025, 11.6% higher than the USD 4,510.0 mn recorded over the same period in 2024. These has continued to cushion the shilling against further depreciation. In the May 2025 diaspora remittances figures, North America remained the largest source of remittances to Kenya accounting for 57.0% in the period,
- The tourism inflow receipts which came in at Kshs 452.2 bn in 2024, a 19.8% increase from Kshs 377.5 bn inflow receipts recorded in 2023, and owing to tourist arrivals that improved by 8.0% to 2,303,028 in the 12 months to February 2025 from 2,133,612 in the 12 months to February 2024 and,
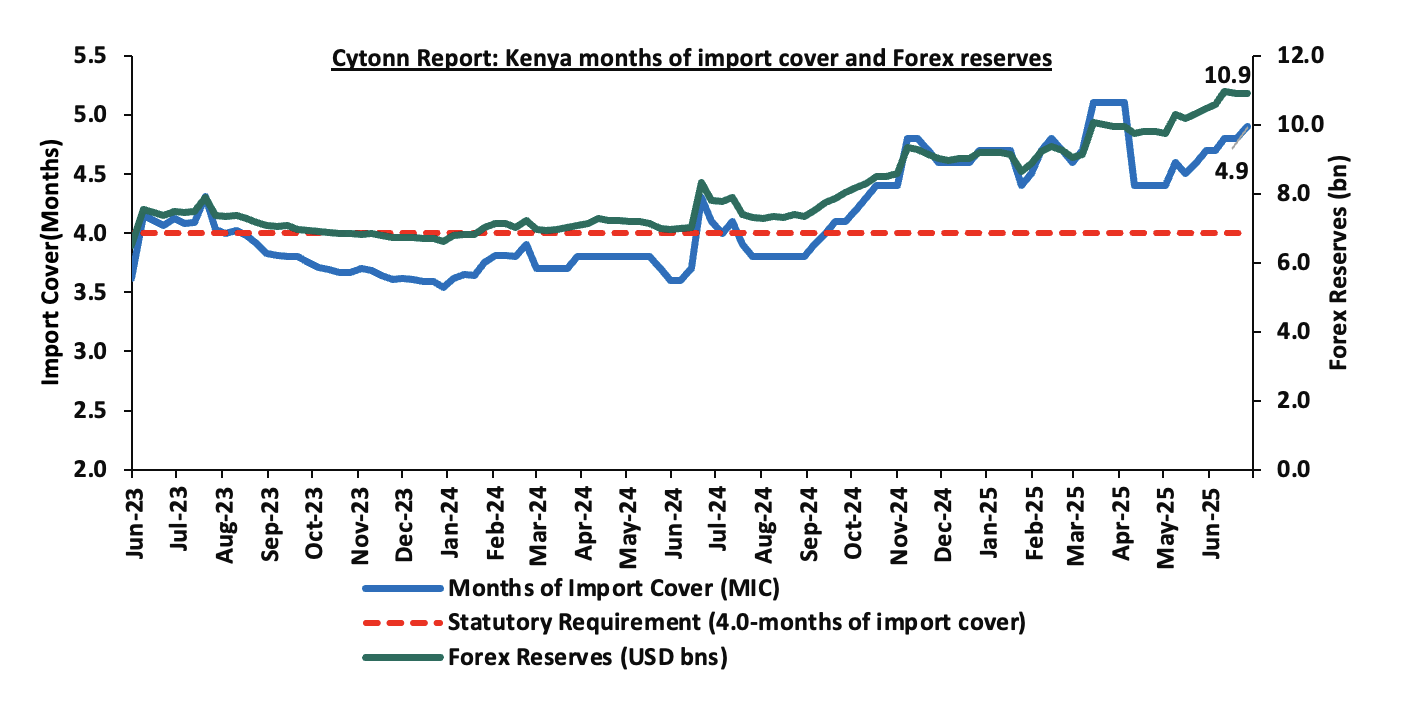
- Improved forex reserves currently at USD 10.9 bn (equivalent to 4.9-months of import cover), which is above the statutory requirement of maintaining at least 4.0-months of import cover and above the EAC region’s convergence criteria of 4.5-months of import cover.
The shilling is however expected to remain under pressure in 2025 as a result of:
- An ever-present current account deficit which came at 1.8% of GDP in the twelve months to April 2025, and,
- The need for government debt servicing, continues to put pressure on forex reserves given that 62.0% of Kenya’s external debt is US Dollar-denominated as of December 2024.
Key to note, Kenya’s forex reserves decreased slightly by 0.2% during the week, to remain relatively unchanged from the USD 10.9 bn recorded in the previous week, (equivalent to 4.9 months of import cover), and above the statutory requirement of maintaining at least 4.0-months of import cover and above the EAC region’s convergence criteria of 4.5-months of import cover.
The chart below summarizes the evolution of Kenya's months of import cover over the years:
Weekly Highlights
- June 2025 Inflation Projection Highlight
We are projecting the y/y inflation rate for June 2025 to increase marginally to within the range of 3.9% - 4.1% mainly on the back of:
- Increased electricity prices – In June 2025, electricity prices increased marginally on the back of a rise in fuel cost charges. EPRA set the fuel cost charge at Kshs 3.8, up from Kshs 3.7 in May 2025. However, the forex adjustment decreased to Kshs 0.7 from Kshs 1.3 in May 2025. With electricity being one the major inputs of inflation, this increase is expected to increase production costs for businesses as well as increase electricity costs for households and thus tightening inflation,
- Rising Fuel Prices in June– In their last fuel prices release, EPRA announced that the maximum allowed price for Super Petrol increased by Kshs 2.7, while Diesel and Kerosene decreased by Kshs 2.0 and Kshs 2.1 respectively. Consequently, Super Petrol, Diesel and Kerosene retail at Kshs 177.3, Kshs 162.9 and Kshs 146.9 per litre respectively, from Kshs 174.6, Kshs 164.9 and Kshs 149.0 per litre respectively, effective from 15th June 2025 to 14th July 2025. Despite the decline in Diesel and Kerosene prices, the notable increase in Super Petrol will continue to exert upward pressure on inflation, given petrol's significant role in transportation and production costs across the economy,
- The decrease in the Central Bank Rate (CBR) by 25.0 bps to 9.75% from 10.00% – In 2025, the CBK Monetary Policy Committee continued reducing the Central Bank Rate (CBR) with a 25.0 bps cut in June, lowering it to 9.75% from 10.00%. In their previous meeting on 8th April 2025, they implemented a more significant reduction, cutting the CBR by 75.0 bps to 10.00%. This reduction in the CBR is likely to increase the money supply through lower borrowing costs, which may cause a slight rise in inflation rates as the effects of the CBR gradually take hold in the broader economy.
Going forward, we expect inflationary pressures to remain anchored in the short term, remaining within the CBK’s target range of 2.5%-7.5% aided by the more stable fuel prices and stability in the exchange rate. However, risks remain, particularly in both fuel and electricity prices. Additionally, the potential increase in demand-driven inflation due to accommodative monetary policy could also pose a risk to inflationary pressures. The decision to lower the CBR to 9.75% during the latest MPC meeting will likely increase money supply, in turn increasing inflation, especially with further, albeit cautious, cuts expected in the coming meetings. The CBK’s ability to balance growth and inflation through close monitoring of both inflation and exchange rate stability will be key to maintaining inflation within the target range.
Rates in the Fixed Income market have been on a downward trend due to high liquidity in the money market which allowed the government to front load most of its borrowing. The government is 81.2% ahead of its prorated net domestic borrowing target of Kshs 597.2 bn, and 81.2% ahead of the total FY’2024/25 net domestic borrowing target of Kshs 597.2 bn, having a net borrowing position of Kshs 1,082.1 bn (inclusive of T-bills). However, we expect a stabilization of the yield curve in the short and medium term, with the government looking to increase its external borrowing to maintain the fiscal surplus, hence alleviating pressure in the domestic market. As such, we expect the yield curve to stabilize in the short to medium-term and hence investors are expected to shift towards the long-term papers to lock in the high returns
Market Performance
During the week, the equities market was on an upward trajectory, with NSE 20 gaining the most by 5.3% while NASI, NSE 10 and NSE 25 gained by 4.6%, 4.1% and 4.0% respectively, taking the YTD performance to gains of 21.6%, 16.4%, 13.6% and 13.1% for NASI, NSE 20, NSE 10 and NSE 25. The equities market performance was driven by gains recorded by large-cap stocks such as KCB, Equity and NCBA of 6.7%, 5.9% and 4.9%, respectively;
Additionally, in the regional equities market, the East African Exchanges 20 (EAE 20) share index gained by 33.1 bps, attributable to gains recorded by large cap stocks such as Safaricom PLC, Cooperative Bank and MTN Uganda of 3.9%, 1.8% and 1.0% respectively. The performance was however weighed down by losses recorded by large cap stocks such as Tanzania Breweries, Tanga Cement Ltd and Tanzania cigarette of 4.5%, 2.6% and 2.6% respectively;
During the week, equities turnover decreased by 32.6% to USD 12.9 mn, from USD 19.1 mn recorded the previous week, taking the YTD total turnover to USD 418.2 mn. Foreign investors remained net buyers for the third consecutive time, with a net buying position of USD 0.9 mn, from a net buying position of USD 3.1 mn recorded the previous week, taking the YTD foreign net selling position to USD 27.0 mn, compared to a net selling position of USD 16.9 mn in 2024.
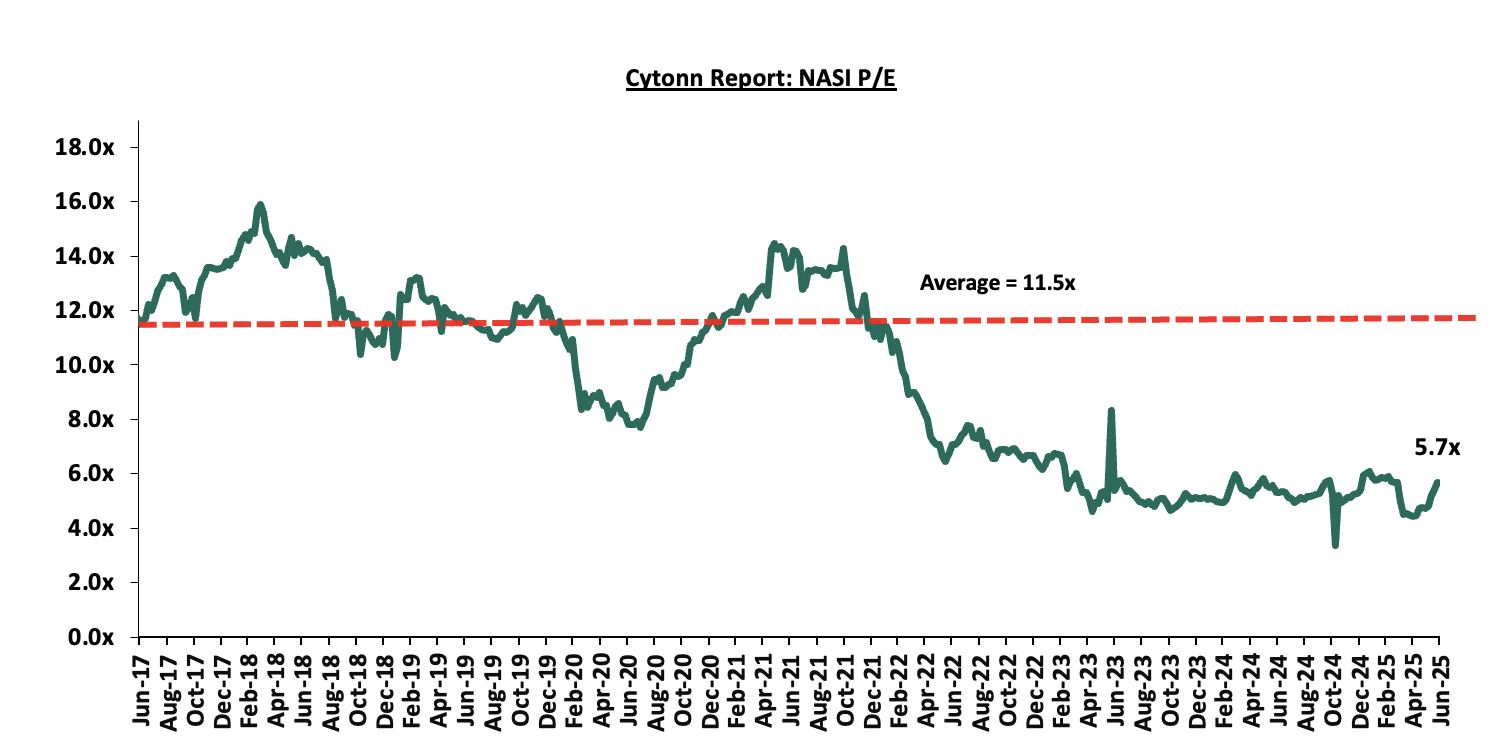
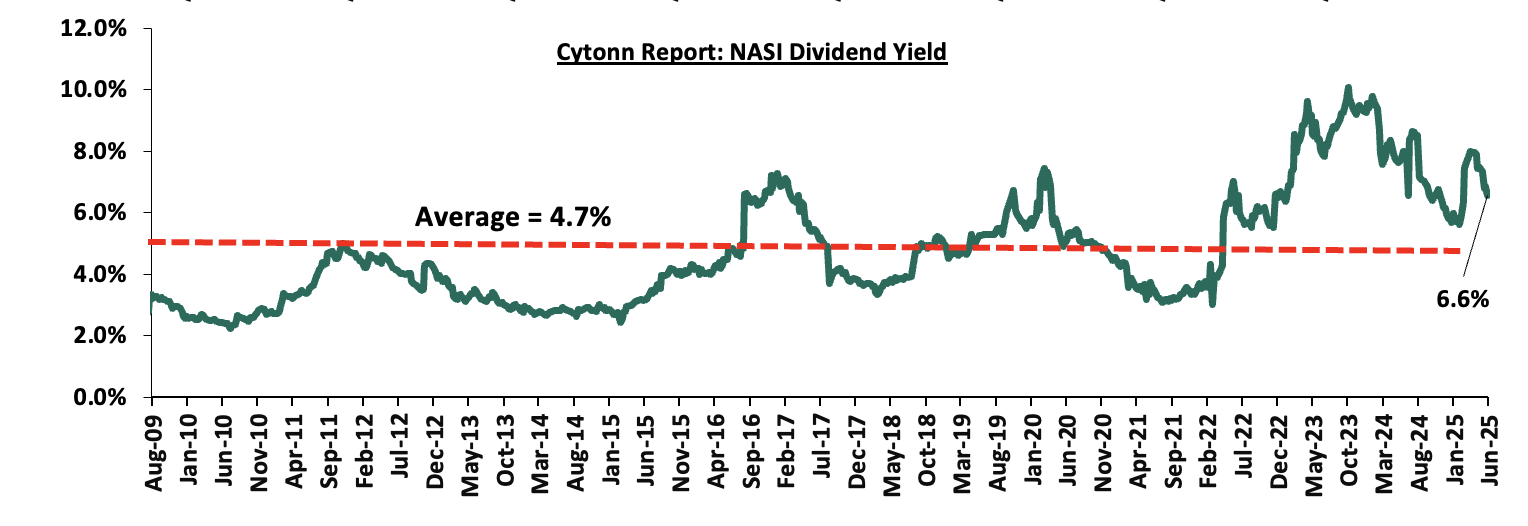
The market is currently trading at a price-to-earnings ratio (P/E) of 5.7x, 50.4% below the historical average of 11.5x. The dividend yield stands at 6.6%, 1.9% points above the historical average of 4.7%. Key to note, NASI’s PEG ratio currently stands at 0.7x, an indication that the market is undervalued relative to its future growth. A PEG ratio greater than 1.0x indicates the market is overvalued while a PEG ratio less than 1.0x indicates that the market is undervalued. The charts below indicate the historical P/E and dividend yields of the market;
Universe of Coverage:
|
Cytonn Report: Equities Universe of Coverage |
||||||||||
|
Company |
Price as at 20/06/2026 |
Price as at 27/06/2025 |
w/w change |
YTD Change |
Year Open 2025 |
Target Price* |
Dividend Yield |
Upside/ Downside** |
P/TBv Multiple |
Recommendation |
|
Diamond Trust Bank |
74.0 |
75.5 |
2.0% |
13.1% |
66.8 |
90.4 |
9.3% |
31.4% |
0.3x |
Buy |
|
Standard Chartered Bank |
283.0 |
296.5 |
4.8% |
3.9% |
285.3 |
328.8 |
15.2% |
31.4% |
1.7x |
Buy |
|
KCB Group |
43.6 |
46.5 |
6.7% |
9.7% |
42.4 |
53.7 |
6.5% |
29.6% |
0.6x |
Buy |
|
Stanbic Holdings |
160.3 |
161.5 |
0.8% |
15.6% |
139.8 |
185.8 |
12.8% |
28.8% |
1.0x |
Buy |
|
Equity Group |
46.2 |
48.9 |
5.9% |
1.8% |
48.0 |
58.0 |
8.7% |
27.4% |
0.8x |
Buy |
|
Co-op Bank |
16.7 |
17.4 |
4.2% |
(0.6%) |
17.5 |
18.9 |
8.6% |
22.3% |
0.6x |
Buy |
|
I&M Group |
34.3 |
35.6 |
3.6% |
(1.3%) |
36.0 |
39.0 |
8.4% |
22.1% |
0.6x |
Buy |
|
Jubilee Holdings |
225.0 |
225.0 |
0.0% |
28.8% |
174.8 |
260.7 |
6.0% |
21.8% |
0.3x |
Buy |
|
ABSA Bank |
18.7 |
19.0 |
1.6% |
0.5% |
18.9 |
21.0 |
9.2% |
21.8% |
1.2x |
Buy |
|
NCBA |
56.0 |
58.8 |
4.9% |
15.2% |
51.0 |
60.2 |
9.4% |
16.8% |
0.9x |
Accumulate |
|
CIC Group |
2.8 |
2.9 |
2.1% |
34.6% |
2.1 |
3.1 |
4.5% |
14.4% |
0.8x |
Accumulate |
|
Britam |
7.5 |
7.8 |
4.0% |
33.3% |
5.8 |
7.5 |
0.0% |
0.5% |
0.7x |
Lighten |
|
*Target Price as per Cytonn Analyst estimates **Upside/ (Downside) is adjusted for Dividend Yield ***Dividend Yield is calculated using FY’2024 Dividends |
||||||||||
We are “Bullish” on the Equities markets in the short term due to current cheap valuations, lower yields on short-term government papers and expected global and local economic recovery, and, “Neutral” in the long term due to persistent foreign investor outflows. With the market currently trading at a discount to its future growth (PEG Ratio at 0.7x), we believe that investors should reposition towards value stocks with strong earnings growth and that are trading at discounts to their intrinsic value. We expect the current high foreign investors sell-offs to continue weighing down the economic outlook in the short term.
Weekly Highlights
- Insolvency
During the week, Equity Bank escalated efforts to recover a combined debt of Kshs 4.7 billion from investment firm TransCentury Plc and its subsidiary, East African Cables (CABL), marking a critical point in the protracted insolvency dispute. The lender appointed receivers to take control of both firms after a 90-day High Court injunction expired, paving the way for enforcement actions.
East African Cables, weighed down by a Kshs 1.9 billion debt, succumbed to the receivership on Thursday, June 20, when Equity Bank’s administrators, Mr. George Weru and Mr. Muniu Thoithi, took over operations at the firm’s Industrial Area headquarters.
The action followed months of legal back-and-forth, including CABL’s attempt to block the enforcement of three statutory notices issued by the bank in 2023. The Court of Appeal recently upheld the bank’s right to proceed with enforcement, noting Equity’s ability to pay damages even if the debt remained in dispute. The court also refused to stop the bank from selling CABL’s four charged properties, effectively greenlighting the receivership.
Despite this heavy blow, CABL had been trying to regain its footing. In recent court filings, the firm revealed it was negotiating with TLG Africa Growth Impact Fund and Kuramo Capital to secure Kshs 1.0 billion in debt financing in January 2025. Though progress was made including payment of Kshs 16.1 million between February and March 2025, the courts ruled these were not sufficient to delay enforcement.
Similar to its subsidiary, TransCentury’s debt spiral began over a decade ago with the issuance of a Kshs 6.7 billion convertible bond in Mauritius shortly before its listing on the Nairobi Securities Exchange (NSE). By the time the bond matured in March 2016, a weaker shilling and accrued interest had ballooned the liability to Kshs 8.0 billion. TransCentury argued that it had made “significant progress” in its debt restructuring plan, which includes a proposed sale of 51.0% in EA Cables (Tanzania) to Msufini Ltd. .
Kuramo Capital’s initial injection of Kshs 2.0 billion in 2016 was used to partially redeem the Mauritius-issued convertible bond, following a negotiated haircut by bondholders. However, the balance was restructured repeatedly over the years, and by June 2025, over Kshs 1.0 billion remained outstanding, just days before Equity Bank moved to enforce its security. Notably, TransCentury’s financial position remains deeply distressed, with total liabilities exceeding assets by Kshs 12.9 billion, underscoring the severity of the company’s insolvency. A breakdown of assets and liabilities is provided in the table below.
|
Cytonn Report: TransCentury Financial position as of December 2024 |
|
|
Assets |
|
|
Non-Current Assets |
6.6 |
|
Current Assets |
4.2 |
|
Total assets |
10.8 |
|
Liabilities |
|
|
Non-Current liabilities |
2.8 |
|
Current Liabilities |
20.9 |
|
Total liabilities |
23.7 |
Several other companies joined the insolvency list in May 2025 and June 2025. The table below provides an overview of these cases.
|
Company Name |
Sector |
Insolvency Action |
Insolvency Practitioner |
Date |
|
Diamond Industries Limited |
Manufacturing |
Receivership |
Joy Vipinchandra Bhatt |
May-25 |
|
Kabianga Dairy Limited |
Manufacturing |
Receivership |
Swaroop Rao Ponangipalli |
May-25 |
|
The Lynx at Ngong Road Limited |
Real Estate |
Administration |
Kamal Anatroy Bhatt |
May-25 |
|
Redhouse Group Limited |
Public Relations |
Liquidation |
Official Receiver |
May-25 |
|
Mitini Scapes Development Ltd |
Real Estate |
Receivership |
Swaroop Rao Ponangipalli and P.V. Rao |
May-25 |
|
Banda Homes Limited |
Real Estate |
Liquidation |
Official Receiver |
May-25 |
|
Africa Spirits Limited |
Alcoholic Beverages |
Administration |
Peter Kahi |
May-25 |
|
Runda Royal Limited |
Real Estate |
Receivership |
KVSK Sastry |
Jun-25 |
According to the latest statistics by the Kenya’s State Receiver’s office, the total number of petitions for liquidation of companies by courts has averaged 32 every year. Additionally, on average, the total number of companies under administration, companies under receivership, and companies under voluntary liquidation during the year is 6, 3, and 8, respectively. This situation is partly attributable to the increase in Gross non-performing loans, with the banking sector recording a 5-year CAGR growth of 15.1% to Kshs 672.6 bn in December 2024 from Kshs 333.0 bn in December 2019. Similarly, the Gross Non-Performing Loans (NPL) ratio has increased to 16.4% as of December 2024, from 14.8% in December 2023. Additionally, the tough business operating environment characterized by the 3.3% decrease in average Purchasing Manager’s Index (PMI) to 50.9 in 2025 so far from 52.6 average recorded in 2019 has led to a significant increase in business operating expenses, which has affected the profitability of businesses.
The graph below shows the trend in the number of applications for insolvency during each year;
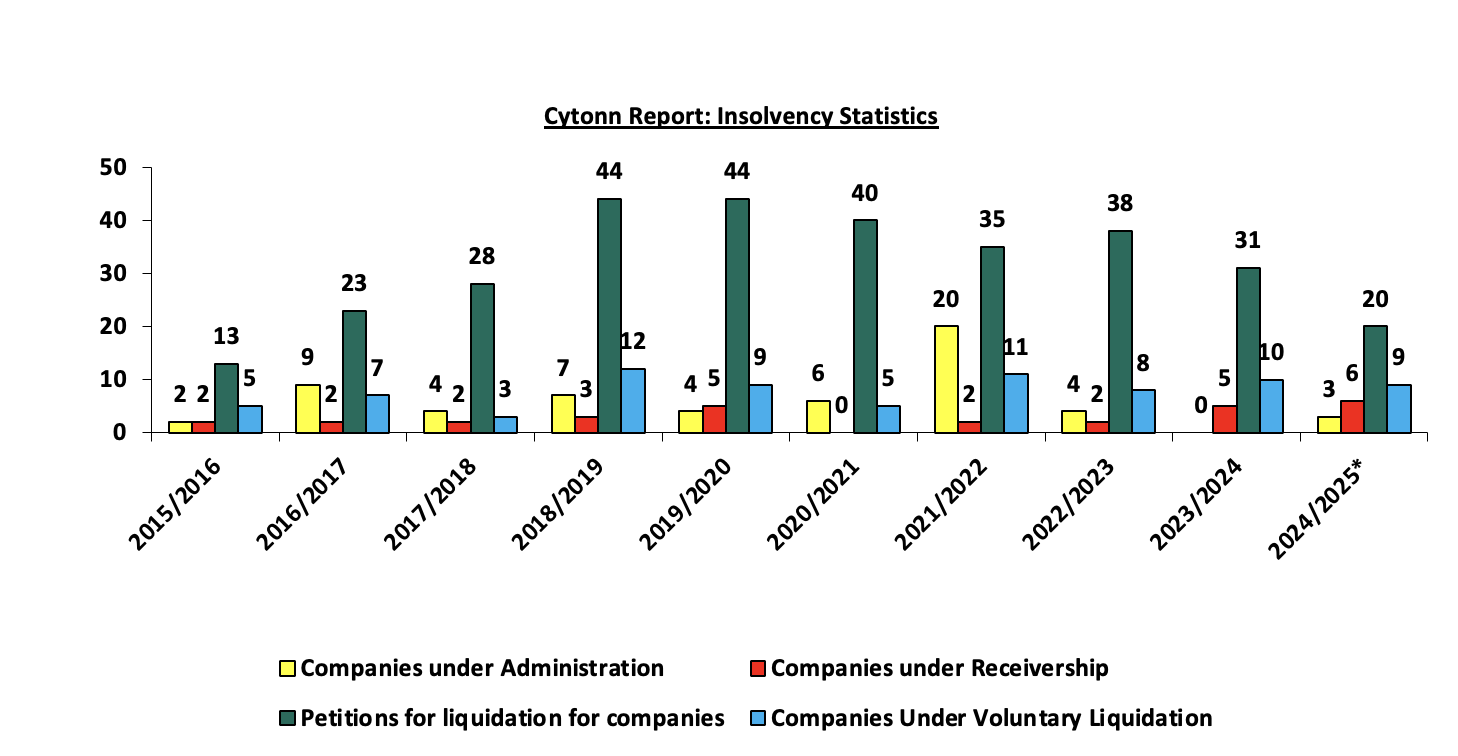
Source: Cytonn Research
Kenya’s business environment remains challenging, with firms grappling with high debt levels, economic slowdowns, and stiff competition. The reduced access to credit by the private sector due to high borrowing costs and a tough operating climate, making it hard to honor debt maturities have led to an increase in corporate insolvencies. The insolvency process, often marked by administration and receivership, aims to restructure firms and preserve value for creditors while ensuring business continuity where possible. However, lengthy legal proceedings, personal interests by insolvency practitioners and creditor disputes often complicate recovery efforts, making asset sales and investor attraction the norm to resolving financial distress. Here’s a concise summary paragraph that incorporates your points while maintaining clarity and focus.
To improve outcomes, Kenya requires urgent reforms to enhance efficiency, transparency, and stakeholder collaboration. Despite the Insolvency Act of 2015 being in place for a decade, Parliament has yet to assess its effectiveness against its original intent. Key priorities include encouraging early intervention in financial distress, promoting out-of-court settlements, and enhancing transparency in communication. The sector also needs a turnaround success story to shift perceptions of insolvency professionals from “business undertakers” to recovery enablers. Strengthening professional standards, streamlining asset realization, and exploring solutions like debt-to-equity swaps can boost outcomes. Clear regulatory frameworks and better oversight are critical to ensuring that the Act delivers on its promise of preserving business value and protecting creditors' rights.
- Nairobi Securities Exchange (NSE) Listings
During the week, the Capital Markets Authority (CMA) indefinitely suspended trading in the shares of TransCentury Limited (TCL) and its subsidiary, East African Cables (CABL), after Equity Bank initiated recovery proceedings for a Kshs 4.7 billion debt. The move follows the expiry of a 90-day High Court injunction, which had temporarily restrained the lender from taking enforcement action.
On June 20, 2025, Equity Bank appointed George Weru and Muniu Thoithi of PricewaterhouseCoopers as joint receivers and managers for TCL and EAC. The Nairobi Securities Exchange (NSE) subsequently announced the trading suspension on June 23, 2025. The decision affects investors in both counters, who now face an indefinite freeze on share activity as the companies undergo restructuring and restoration of the company to enable debt recovery.
The two companies have been placed under different legal frameworks. TCL has entered receivership under the repealed Companies Act, which generally prioritizes asset disposal to recover amounts owed to secured creditors like Equity Bank, followed by preferential creditors such as employees. Unsecured creditors, including holders of the convertible bond, rank below and face steep losses due to the firm’s Kshs 12.9 billion negative equity. Shareholders, including Kuramo Capital and founding investors, are last and unlikely to recover anything. In contrast, CABL has been placed under administration under the Insolvency Act of 2015, which is geared toward rehabilitating distressed firms. Administration allows for the possibility of restructuring, though liquidation remains an option if recovery efforts prove unsuccessful. The placement of TCL under receivership as opposed to administration thus indicates that its debts were contracted before the Insolvency Act was put in place, and are therefore treated under receivership laws of the Companies Act.
Market activity prior to the suspension reflected heightened investor anxiety. On their final day of trading, TCL’s share price declined by 36.6% to Kshs 0.7 from Kshs 1.1 that was recorded the previous day, while EAC fell 14.5% to Kshs 1.0 from Kshs. 1.17 that was recorded the previous day. TCL recorded a notable spike in trading volumes, moving 493,600 shares compared to just 14,900 in the previous session, suggesting a rush to exit positions. EAC traded 74,400 shares. As of the end of the week, TCL’s market capitalization stood at Kshs 266.0 mn, while CABL’s was Kshs 253.0 mn, both reflecting the companies’ distressed valuations. The following graph shows the number of companies suspended from trading on the NSE for the past 6 years.
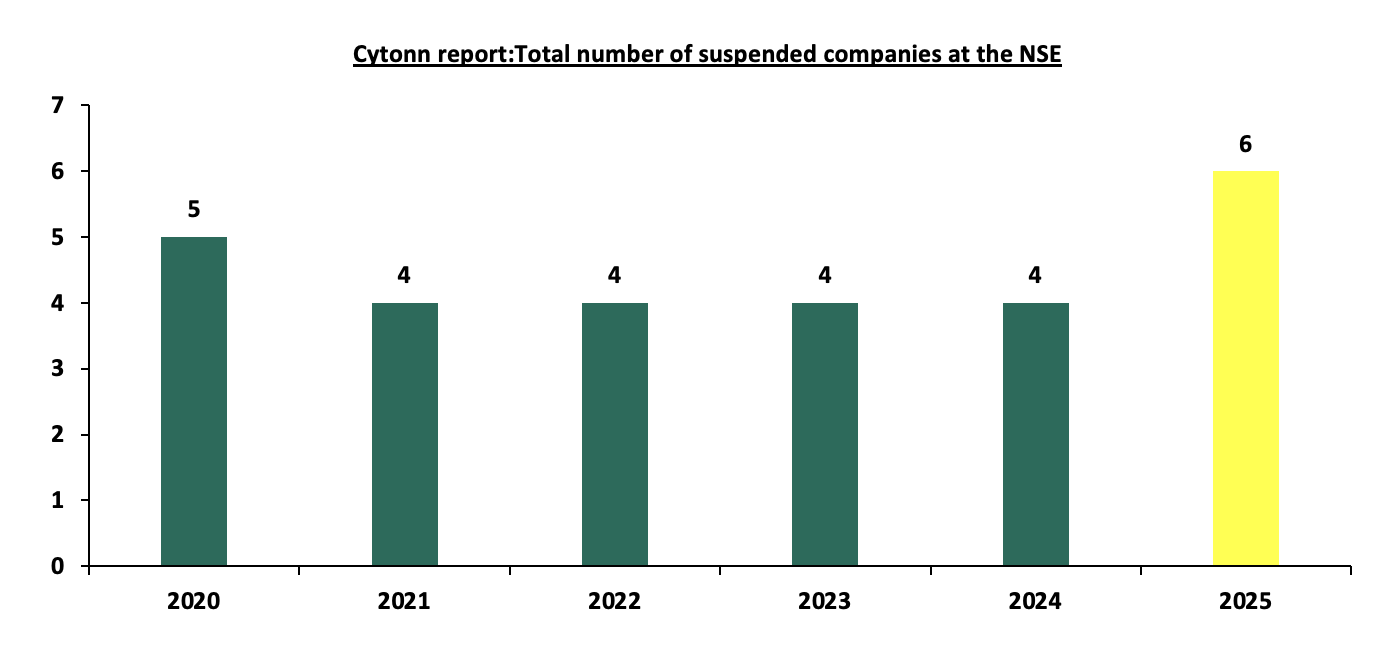
Source: Nairobi Securities Exchange (NSE)
With the addition of TCL and CABL, the number of companies currently suspended from trading on the NSE has risen to six. The other four are Mumias Sugar Company, Bamburi Cement, ARM Cement, and Deacons East Africa, all of which have faced various forms of financial distress or corporate restructuring. Bamburi’s suspension was put in place earlier in the year on February,27 2025, to facilitate the squeeze out process for Amsons to acquire the remaining 3.5% of Bamburi’s shares. Bamburi’s further suspension was implemented on 21st May 2025 to facilitate the legal procedures required to execute the squeeze-out of the remaining shareholders, and a delisting from the Nairobi Securities Exchange is expected thereafter. As of 27th June 2025, a total of 63 companies were listed on the NSE, of which 57 were actively trading and 6 were suspended. The following table shows the companies currently suspended from trading on the NSE and the reason for suspension:
|
# |
Suspension Date |
Company |
Reason for Suspension |
|
1 |
Jun-25 |
East African Cables Plc |
Insolvency |
|
2 |
Jun-25 |
TransCentury Plc |
Insolvency |
|
3 |
Feb-25, May-25 |
Bamburi |
Acquisition by Amsons Group |
|
4 |
Sep-19 |
Mumias Sugar |
Insolvency |
|
5 |
Nov-18 |
Deacons (East Africa) Plc |
Insolvency |
|
6 |
Aug-18, Dec-20 |
Athi River Mining (ARM) Cement |
Insolvency |
Source: NSE, CMA
The suspension highlights the lingering risks faced by over-leveraged firms, many of which were strained by the prolonged period of high interest rates. While borrowing conditions are beginning to ease, access to refinancing remains limited for companies already under financial pressure. The situation also reflects the growing assertiveness of creditors in enforcing claims and the regulatory role of the CMA in maintaining market integrity during times of corporate stress.
Revitalizing the Nairobi Securities Exchange (NSE), which has suffered a ten-year IPO drought, requires bold and targeted reforms. A more dynamic, inclusive, and investor-friendly capital market will not only attract new listings but also support sustainable economic growth. The following are key areas of reform that the Capital Markets Authority (CMA) and policymakers should prioritize;
- Making changes to regulations that do not meet objectives: The current regulations governing the capital markets securities, public offers, listing and disclosure is the Capital Markets Act 2023. The CMA should continuously review, identify and amend restrictive provisions in the capital markets and related Laws that are unattractive to capital raising and listing to ensure the rules in place facilitate rather than deter active participation in the markets.
- Promote investment in Small and Medium Sized companies with growth potential: Following the increasing number of Small and Medium Sized companies, financing them through the securities exchange is key towards the growth of an economy. However, the challenge usually arises on onboarding investors who are willing to take the risk in these types of companies given some of them have low profit history while others are less liquid. However, some of the ways that can be used to promote and expand the small and medium sized enterprises, include; Introduction of tax incentives for investors willing to invest in small and medium sized companies to facilitate financing and boost liquidity and growth,
- Market Transparency: The degree at which markets are transparent affects investors decision making. Transparency of trading allows efficient price setting and thus increases confidence in the market. Therefore, it is key for the regulator to enforce measures that raises the level of transparency in the market in order to make it more attractive to investors. This will help to boost its liquidity and consequently attract potential companies who are reluctant from going public due to the inefficiency in the market,
- Creating a culture of participation in the stock market: It is essential to disseminate knowledge of having a candid stock market through listing of more companies in order to broaden the financial markets. This can be implemented through having a specific day in a calendar for financial education where the general public are educated on importance of investment and financial culture,
- Improving tax incentives for new listings: The authority needs to develop measures that are favorable to go public that will enable to attract more companies and have a powerful and more developed securities market. In order attract more listings the authority needs to improve its tax treatments for dividends as well as capital gains,
- Training and offer independent and free assessment to companies: In order to attract more listings, the authority need to offer trainings on matters of financial transparency, sustainability and corporate governance to potential companies as well as offering free assessment in order to help them position themselves for transitioning to the public markets, and,
- Simplify regulations and make it easier to access listing at the securities exchange market: The simplification of obtaining listing can encourage companies to go for listing at the stock market and take the advantage of public finance in the market to gain size and boost growth than private financing through risk or venture capital. The general cost of listing should also be reduced in order to make it more favorable and appealing for IPO’s
The following graph shows the total number of companies listed on the NSE over the years.
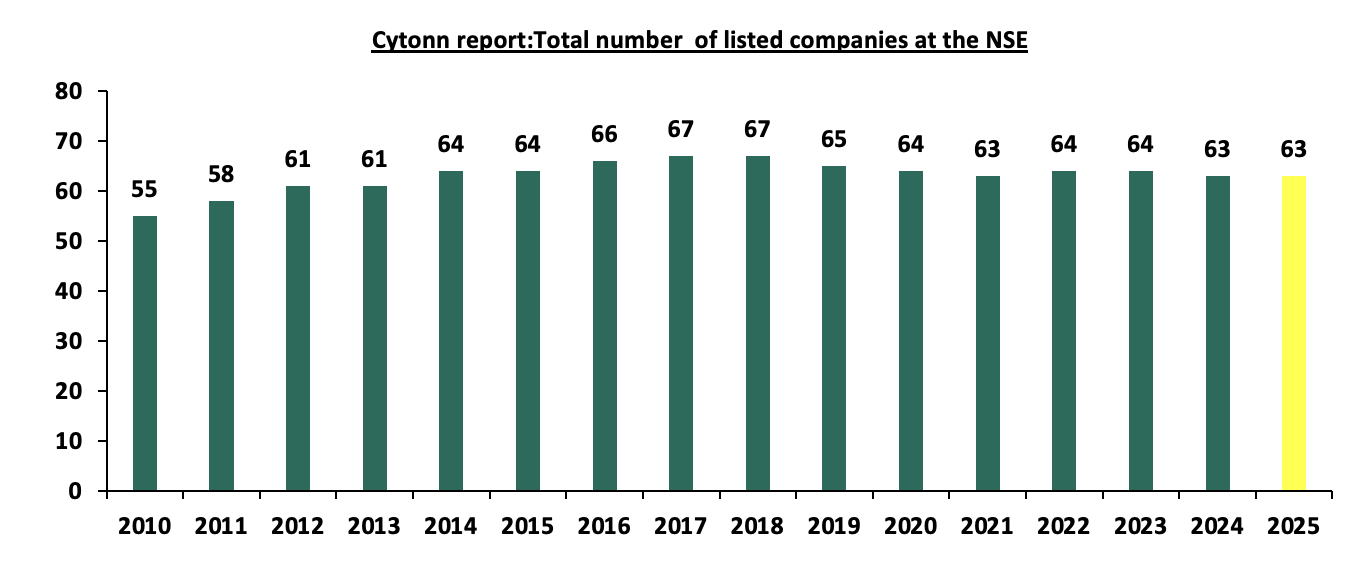
Source: NSE
A notable development is Family Bank’s announcement of plans to list its shares on the NSE in 2026. This move aims to improve liquidity for shareholders and raise capital to support expansion into underserved counties. Family Bank’s decision signals growing confidence in the market and could serve as a catalyst to break the prolonged IPO drought. A vibrant, inclusive, and well-regulated capital market not only diversifies investment opportunities but also strengthens Kenya’s economic resilience by encouraging both mature firms and SMEs to tap into public financing for sustainable growth.
- Industry Report
- April Leading Economic Indicators (LEI)
During the week, the Kenya National Bureau of Statistics (KNBS) released the Leading Economic Indicators (LEI) April 2025 Report, which highlighted the performance of major economic indicators. Key highlights related to the Real Estate sector include:
- In April 2025, the number of international visitor arrivals through Jomo Kenyatta International Airport (JKIA) and Moi International Airport (MIA) was 169,230, reflecting an 0.4% increase from the 168,563 arrivals recorded in March 2025. This marginal growth can be attributed to several factors: i) the occurrence of Easter holidays in early April, which spurred international leisure travel from key markets such as Europe and North America, ii) the conclusion of Q1’2025 travel promotions by airlines and tour operators, which incentivized last-minute bookings for April (iii) the hosting of regional conferences and international business forums in Nairobi in April like the World Chambers Federation (WCF) Africa Summit, which ran from April 9th to 11th at the Kenyatta International Convention Centre (KICC), attracting short-term corporate visitors, iv) increased regional airline connectivity during the period, with carriers like Kenya Airways and RwandAir enhancing routes into Nairobi and Mombasa v) relatively favorable weather conditions at the Coast in early April before the long rains peaked, maintaining its appeal to international beach tourists and vi) continued political stability and a safe security environment, which encouraged visitor confidence and supported uninterrupted travel plans.
- On a year-on-year basis, April 2025 arrivals represent a 63.7% increase compared to 103,362 in April 2024, indicating a continued rebound in tourism activity. The growth is driven by; (i) Global tourism recovery and easing of travel restrictions with global travel industry on a recovery trajectory following the full reopening of economies and easing of pandemic related travel restrictions. International confidence in travel has grown, with more travellers resuming trips, (ii) Increased air connectivity as Kenya’s international air links have significantly improved with the addition of new direct flights from Mumbai to Nairobi, Dubai and Mombasa; and Johannesburg to Nairobi which has expanded Kenya’s access from key destination, (iii) Tourism diversification with Kenya making efforts to diversify its tourism offerings beyond traditional wildlife safaris. The country is increasingly marketing niche experiences such as cruise, cultural tourism showcasing rich local heritage, adventure tourism including hiking and sports tourism with events like the World Rally Championship and international marathons drawing global attention, (iv) Aggressive marketing campaigns as The Ministry of Tourism and the Kenya Tourism Board (KTB) have ramped up global promotional efforts under the “Magical Kenya” brand. These campaigns utilize digital platforms, international travel expos, and influencer collaborations to reach wider audiences increasing visitor arrivals, (v) Policy reforms and improved visa access, Kenya adopted a visa free entry regime which has simplified the entry process and enhanced the travel experience.
The chart below shows the number of international arrivals in Kenya between Q1 2022 and April 2025.
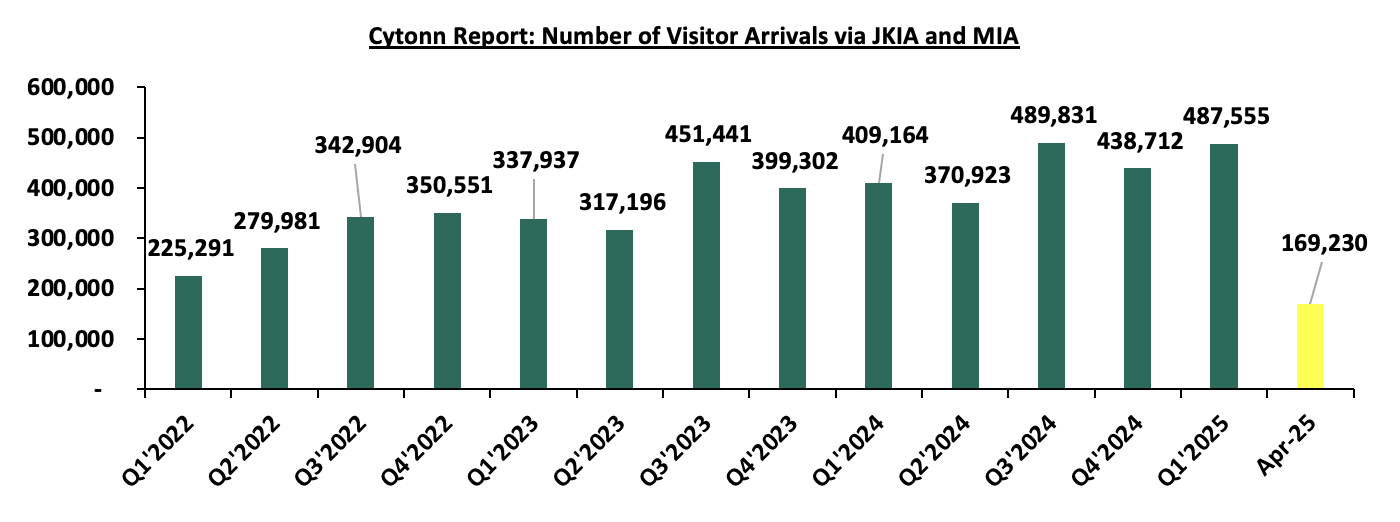
Source: Kenya National Bureau of Statistics (KNBS)
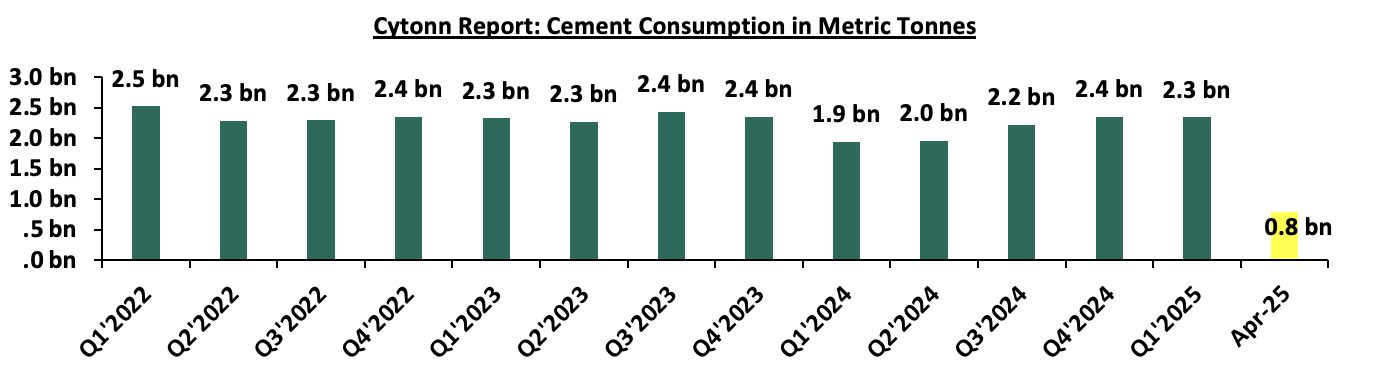
- The consumption of cement decreased by 2.6% to 790,462 metric tonnes in April 2025, from 811,187 metric tonnes in March 2025. The decline can be attributed to several factors, (i) the onset of the long rains in April, particularly in construction-heavy regions such as Nairobi, Central Kenya, and parts of Western Kenya, disrupted outdoor construction works due to wet and muddy conditions, making it difficult to transport materials, lay foundations, or continue with structural works; (ii) a temporary slowdown in government-funded infrastructure projects, as many public construction activities tend to ease in April while awaiting the release of second-quarter budgetary allocations, leading to a pause or reduced pace in road, housing, and water projects; (iii) reduced momentum in the private real estate sector, where developers often delay ground-breaking or structural phases of projects in anticipation of clearer weather in May or June, to avoid damage or inefficiencies caused by rain.
- On a year-on-year basis, cement consumption in April 2025 increased by 21.0% to 790,462 metric tonnes in April 2025, from 653,522 metric tonnes recorded in April 2024. This significant growth reflects a broader resurgence in the construction sector, driven by, (i)A surge in domestic construction and infrastructure development as increased private sector investments in residential, commercial, and mixed-use developments have spurred higher cement usage, particularly in urban growth zones like Nairobi, Mombasa, and Kisumu,(ii) Expanded government-led infrastructure programs that saw the government's continued investment in flagship infrastructure projects such as roads, affordable housing, water and sanitation systems, and public buildings under the Bottom-Up Economic Transformation Agenda (BETA) has sustained cement demand, (iii) Strategic public sector focus on stimulating local economic activity as Cement consumption growth is also fueled by employment-intensive public works projects aimed at improving livelihoods, especially in rural and semi-urban areas. These initiatives are designed to provide jobs while upgrading critical infrastructure.
The chart below shows cement consumption in metric tonnes in Kenya between Q1 2022 and April 2025.
Source: Kenya National Bureau of Statistics (KNBS)
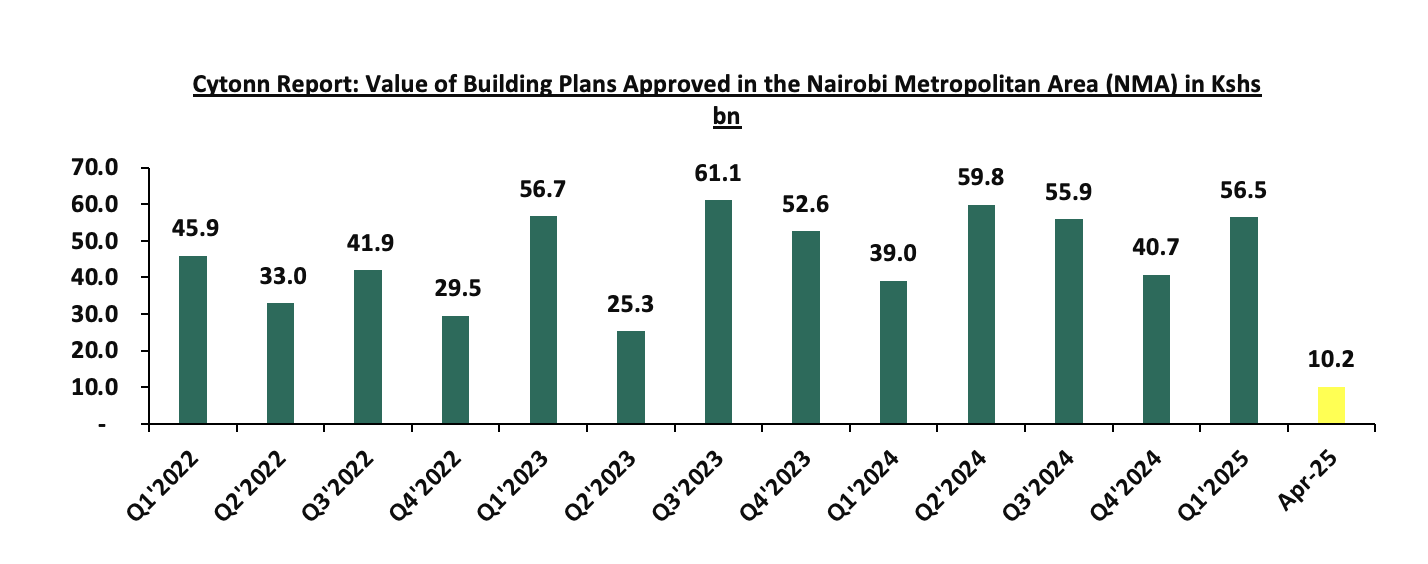
- Building plans approved in April 2025 declined sharply both month-on-month and year-on-year, falling by 70.5% to Ksh 10.2 bn from Ksh 34.6 bn in March 2025, and by 30.1% from Ksh 14.6 bn in April 2024. This significant drop reflects a slowdown in development activity, driven by several factors: (i) the onset of the long rains, which typically leads developers to delay plan submissions due to anticipated disruptions in project commencement; (ii) a high base effect from March, when many developers rushed approvals ahead of Q1’2025 deadlines; (iii) rising construction costs particularly for imported materials leading to budget uncertainties and postponed projects; (iv) tighter credit conditions and higher interest rates in 2025, which have made it harder to secure funding for new developments; (v) slower processing of approvals by county planning offices in April, potentially due to internal reviews or staffing constraints; and (vi) a shift in focus toward completing ongoing projects amid subdued demand and oversupply in segments like commercial real estate.
The chart below shows the building plans approved in Billions in Kenya between Q1’2022 and April 2025.
- Residential Sector
During the week, the Cabinet approved the revision of the Affordable Housing Regulations, 2024, reducing the minimum housing deposit under the Affordable Housing Programme from 10.0% to 5.0% in a bid to enhance accessibility for low and middle-income earners. The new regulations also introduce supportive frameworks such as structured home loans, deposit support and tenant purchase schemes to boost uptake. This comes as the government seeks to accelerate housing delivery and bridge the homeownership gap under the Bottom-Up Economic Transformation Agenda (BETA).
The revised deposit requirement is expected to significantly improve affordability across the programme. For instance, the upfront cost for a unit priced at Kshs 1.5 mn drops from Kshs 150,000 to Kshs 75,000, while for a Kshs 840,000 social housing unit, the deposit falls from Kshs 84,000 to Kshs 42,000.
In addition to the deposit revision, the new regulations introduce a comprehensive set of supportive mechanisms aimed at enhancing access to affordable housing. These include the introduction of structured low-interest home loans through partnerships with financial institutions, allowing buyers to access flexible financing with lower monthly repayments. The regulations also establish deposit support schemes to assist low-income earners particularly those earning below Ksh 20,000.0 per month by providing financial assistance or deferred payment options to meet the 5.0% deposit requirement.
To ensure fairness, the regulations outline equitable allocation procedures through a transparent points-based system that considers factors such as income level, household size and special needs. Furthermore, tenant purchase arrangements (rent-to-own models) are formalized, enabling occupants to gradually acquire ownership by paying monthly rent that contributes toward the property’s purchase price. Mandatory registration and vetting of beneficiaries is also required to prevent duplicate allocations and ensure that only eligible applicants benefit. Developers participating in the programme must adhere to affordability benchmarks and construction quality standards, ensuring sustainability and uniformity across all affordable housing projects.
The move comes amid growing concerns over slow uptake across various AHP projects. An Auditor General’s report released on June 2024 for the financial year that ended June 2023 flagged unsold units valued at over Kshs 1.2 bn at the National Housing Corporation, highlighting the disconnect between pricing and affordability for target buyers. Despite over 11,000 units reportedly completed and more than 150,000 under construction, significant inventory remains unsold.
We expect that the revised regulations will significantly boost the uptake of affordable housing units by lowering the entry barrier for low- and middle-income earners through the reduced deposit requirement and structured support mechanisms. The formalization of rent-to-own models and introduction of transparent allocation frameworks will enhance trust in the programme and attract broader participation. For developers, the improved clarity and standardization in regulations provide a more predictable environment, which could encourage increased private sector involvement in affordable housing. Overall, these changes are likely to stimulate demand, accelerate project completion rates, and support the government's long-term goal of reducing the national housing deficit thereby reinforcing growth in Kenya’s residential real estate market.
- Real Estate Investments Trusts (REITs)
On the Unquoted Securities Platform, Acorn D-REIT and I-REIT traded at Kshs 26.7 and Kshs 22.9 per unit, respectively, as per the last updated data on 20th June 2025. The performance represented a 33.4% and 14.5% gain for the D-REIT and I-REIT, respectively, from the Kshs 20.0 inception price. The volumes traded for the D-REIT and I-REIT came in at Kshs 12.8 mn and Kshs 36.1 mn shares, respectively, with a turnover of Kshs 323.5 mn and Kshs 791.5 mn, respectively, since inception in February 2021. Additionally, ILAM Fahari I-REIT traded at Kshs 11.0 per share as of 20th June 2025, representing a 45.0% loss from the Kshs 20.0 inception price. The volume traded to date came in at 1.2 mn shares for the I-REIT, with a turnover of Kshs 1.5 mn since inception in November 2015.
REITs offer various benefits, such as tax exemptions, diversified portfolios, and stable long-term profits. However, the ongoing decline in the performance of Kenyan REITs and the restructuring of their business portfolios are hindering significant previous investments. Additional general challenges include:
- Insufficient understanding of the investment instrument among investors leading to a slower uptake of REIT products,
- Lengthy approval processes for REIT creation,
- High minimum capital requirements of Kshs 100.0 mn for REIT trustees compared to Kshs 10.0 mn for pension funds Trustees, essentially limiting the licensed REIT Trustee to banks only
- The rigidity of choice between either a D-REIT or and I-REIT forces managers to form two REITs, rather than having one Hybrid REIT that can allocate between development and income earning properties
- Limiting the type of legal entity that can form a REIT to only a trust company, as opposed to allowing other entities such as partnerships, and companies,
- We need to give time before REITS are required to list – they would be allowed to stay private for a few years before the requirement to list given that not all companies maybe comfortable with listing on day one, and,
- Minimum subscription amounts or offer parcels set at Kshs 0.1 mn for D-REITs and Kshs 5.0 mn for restricted I-REITs. The significant capital requirements still make REITs relatively inaccessible to smaller retail investors compared to other investment vehicles like unit trusts or government bonds, all of which continue to limit the performance of Kenyan REITs.
We expect the performance of Kenya’s Real Estate sector to remain resilient supported by several factors: i) heightened activities from both private and government sectors, ii) an expanding population driving the need for housing, iii) government efforts under the Affordable Housing Program and the incentives advanced to developers aligned with the program, iv) an increase in deals in the commercial office sector likely to boost occupancy, v) increased investment by international and local investors in the retail sector, and vi) increased international arrivals in the country boosting the hospitality and tourism sector. However, challenges such as rising construction costs, an oversupply in select Real Estate classes, strain on infrastructure development, and high capital demands in REITs sector will continue to impede the real estate sector’s optimal performance by restricting developments and investments.
On 12 June 2025, the National Treasury presented Kenya’s FY’2025/2026 National Budget to the National Assembly highlighting that the total budget estimates for FY’2024/25 increased by 7.1% to Kshs 4.3 tn from the Kshs 4.0 tn in FY’2024/2025 while the total revenue inclusive of grants increased by 8.0% to Kshs 3.4 tn from the Kshs 3.1 tn in FY’2024/2025. The increase is mainly due to an 6.7% increase in ordinary revenue to Kshs 2.8 tn for FY’2025/2026, from the Kshs 2.6 tn in FY’2024/25.
The FY’2024/2025 budget focuses mainly on providing solutions to the heightened concerns on the high cost of living, the measures put in place to stimulate sustainable economic recovery as well as undertaking a growth-friendly fiscal consolidation to preserve the country’s debt sustainability. Notably, the government projects to narrow the fiscal deficit to 4.8% of GDP in FY’2025/26, from the estimate of 5.1% of GDP in FY’2024/25. As such, this week, we shall discuss the recently released budget and the Finance Bill 2025 with a key focus on Kenya’s fiscal components. We shall do this in four sections, namely:
- FY’2024/2025 Budget Outturn as at May 2025,
- Comparison between FY'2024/2025 and FY'2025/2026 Budget estimates,
- Analysis and House-view on Key Aspects of the 2025 Budget,
- Finance Bill 2025, and,
- Conclusion and Our View.
Section I: FY’2024/2025 Budget Outturn as at May 2025
The National Treasury gazetted the revenue and net expenditures for the eleventh month of FY’2024/2025, ending 30th May 2025. Below is a summary of the performance:
|
FY'2024/2025 Budget Outturn - As at 30th May 2025 |
|||||||
|
Amounts in Kshs Billions unless stated otherwise |
|||||||
|
Item |
12-months Original Estimates |
Revised Estimates I |
Revised Estimates II |
Actual Receipts/Release |
Percentage Achieved of the Revised Estimates II |
Prorated |
% achieved of the Prorated |
|
Opening Balance |
|
|
|
1.2 |
|
|
|
|
Tax Revenue |
2,745.2 |
2,475.1 |
2,400.7 |
2,011.4 |
83.8% |
2,200.7 |
91.4% |
|
Non-Tax Revenue |
172.0 |
156.4 |
180.2 |
145.2 |
80.6% |
165.2 |
87.9% |
|
Total Revenue |
2,917.2 |
2,631.4 |
2,580.9 |
2,157.8 |
83.6% |
2,365.8 |
91.2% |
|
External Loans & Grants |
571.2 |
593.5 |
718.4 |
426.1 |
59.3% |
658.5 |
64.7% |
|
Domestic Borrowings |
828.4 |
978.3 |
1,167.0 |
932.9 |
79.9% |
1,069.8 |
87.2% |
|
Other Domestic Financing |
4.7 |
4.7 |
8.5 |
4.4 |
52.1% |
7.8 |
56.9% |
|
Total Financing |
1,404.3 |
1,576.5 |
1,894.0 |
1,363.4 |
72.0% |
1,736.1 |
78.5% |
|
Recurrent Exchequer issues |
1,348.4 |
1,307.9 |
1,412.7 |
1,263.1 |
89.4% |
1,294.9 |
97.5% |
|
CFS Exchequer Issues |
2,114.1 |
2,137.8 |
2,289.0 |
1,637.0 |
71.5% |
2,098.3 |
78.0% |
|
Development Expenditure & Net Lending |
458.9 |
351.3 |
354.9 |
264.8 |
74.6% |
325.4 |
81.4% |
|
County Governments + Contingencies |
400.1 |
410.8 |
418.3 |
354.3 |
84.7% |
383.4 |
92.4% |
|
Total Expenditure |
4,321.5 |
4,207.9 |
4,474.9 |
3,519.2 |
78.6% |
4,102.0 |
85.8% |
|
Fiscal Deficit excluding Grants |
1,404.3 |
1,576.5 |
1,894.0 |
1,361.4 |
71.9% |
1,736.1 |
78.4% |
|
Total Borrowing |
1,399.6 |
1,571.8 |
1,885.4 |
1,359.0 |
72.1% |
1,728.3 |
78.6% |
|
Public Debt |
1,910.5 |
1,910.5 |
2,042.1 |
1,448.1 |
70.9% |
1,871.9 |
77.4% |
Source: National Treasury
The Key take-outs from the release include;
- Total revenue collected as at the end of May 2025 amounted to Kshs 2,157.8 bn, equivalent to 83.6% of the revised estimates II of Kshs 2,580.9 bn for FY’2024/2025 and is 91.2% of the prorated estimates of Kshs 2,365.8bn. Cumulatively, tax revenues amounted to Kshs 2,011.4 bn, equivalent to 83.8% of the revised estimates II of Kshs 2,400.7 bn and 91.4% of the prorated estimates of Kshs 2,200.7 bn,
- Total financing amounted to Kshs 1,363.4 bn, equivalent to 72.0% of the revised estimates II of Kshs 1,894.0 bn and is equivalent to 78.5% of the prorated estimates of Kshs 1,736.1 bn. Additionally, domestic borrowing amounted to Kshs 932.9 bn, equivalent to 79.9% of the revised estimates II of Kshs 1,167.0 bn and is 87.2% of the prorated estimates of Kshs 1,069.8 bn,
- The total expenditure amounted to Kshs 3,519.2 bn, equivalent to 78.6% of the revised estimates II of Kshs 4,474.9 bn, and is 85.8% of the prorated target expenditure estimates of Kshs 4,102.0 bn. Additionally, the net disbursements to recurrent expenditures came in at Kshs 1,263.1 bn, equivalent to 89.4% of the revised estimates II of Kshs 1,412.7 and are equivalent to 97.5% of the prorated estimates of Kshs 1,294.9 bn,
- Consolidated Fund Services (CFS) Exchequer issues came in at Kshs 1,637.0 bn, equivalent to 71.5% of the revised estimates II of Kshs 2,289.0 bn, and are 78.0% of the prorated amount of Kshs 2,098.3 bn. The cumulative public debt servicing cost amounted to Kshs 1,448.1 bn which is 70.9% of the revised estimates II of Kshs 2,042.1 bn, and is 77.4% of the prorated estimates of Kshs 1,871.9 bn. Additionally, the Kshs 1,448.1 bn debt servicing cost is equivalent to 67.1% of the actual cumulative revenues collected as at the end of May 2025, and,
- Total Borrowings as at the end of May 2025 amounted to Kshs 1,359.0 bn, equivalent to 72.1% of the revised estimates II of Kshs 1,885.4 bn for FY’2024/2025 and are 78.6% of the prorated estimates of Kshs 1,728.3 bn. The cumulative domestic borrowing of Kshs 1,167.0 bn comprises of Net Domestic Borrowing Kshs 597.2 bn and Internal Debt Redemptions (Rollovers) Kshs 569.9 bn.
The government missed its prorated revenue targets for the eleventh consecutive month in FY’2024/2025, however registering a significant performance improvement, achieving 91.2% of the prorated revenue targets in May 2025. The shortfall is largely due to the challenging business environment experienced in previous months with the Purchasing Managers’ Index (PMI), averaging 49.2, below the 50.0 neutral mark, in the first half of the FY’2024/2025, exacerbated by high taxes and an elevated cost of living. However, the cost of credit has seemingly declined, providing some relief to businesses and households. The improved business environment is reflected in the Purchasing Managers’ Index (PMI), which has averaged at 50.9 in the second half of FY’2024/25 so far. The PMI however dipped to 49.6 in May 2025 from 52.0 in April 2025, signaling a contraction in private‑sector output after seven months of expansion. While efforts to enhance revenue collection, such as broadening the tax base, curbing tax evasion, and suspending tax relief payments, are yet to yield full benefits, future revenue performance will depend on how quickly private sector activity gains momentum. This is expected to be supported by a stable Shilling, lower borrowing costs, and continued efforts to enhance economic growth. The reduction in the Central Bank Rate (CBR) by 25 basis points to 9.75% from 10.00%, following the Monetary Policy Committee’s (MPC) meeting on June 10th, 2025, is expected to further ease credit conditions and support private sector expansion.
Section II: Comparison between FY’2024/2025 and FY’2025/2026 Budgets estimates
The Kenyan Government budget has been growing over the years on the back of increasing recurrent and development expenditures. The chart below shows the evolution of the government budget over a fifteen-year period:
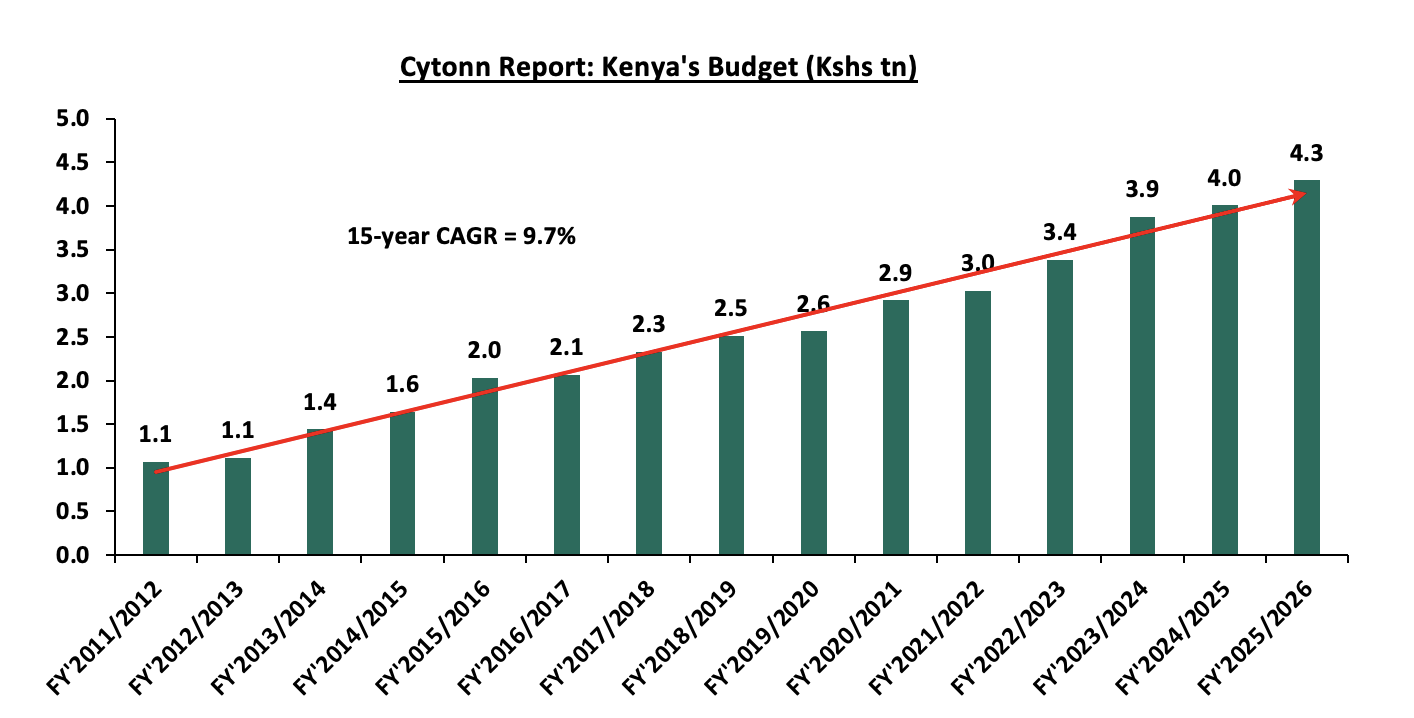
Source: National Treasury of Kenya
For the FY’2025/2026, the budget is projected to increase by 7.1% to Kshs 4.3 tn, from Kshs 4.0 tn in FY’2024/2025. The expenditure will be funded by revenue collections of Kshs 3.4 tn and borrowings amounting to Kshs 923.2 bn.
The table below summarizes the key buckets and the projected changes:
|
Cytonn Report: Comparison between FY’2024/2025 and FY’2025/2026 Budgets Estimates |
|||
|
Item |
FY'2024/25 Supplementary Budget II |
FY'2025/26 Estimates |
Change y/y (%) |
|
Amounts in Kshs billions unless stated otherwise |
|||
|
Ordinary Revenue |
2,580.9 |
2,754.7 |
6.7% |
|
Ministerial Appropriation-in-Aid |
486.8 |
567.0 |
16.5% |
|
Total grants |
52.6 |
46.9 |
(10.8%) |
|
Total Revenue & Grants |
3,120.3 |
3,368.6 |
8.0% |
|
Recurrent expenditure |
1,705.7 |
1,805.0 |
5.8% |
|
Recurrent Consolidated Funds Services (CFS) |
1,242.7 |
1,337.3 |
7.6% |
|
Development expenditure |
624.7 |
693.2 |
13.0% |
|
County Transfer & Contingencies |
445.6 |
474.9 |
6.6% |
|
Total expenditure |
4,007.5 |
4,291.9 |
7.1% |
|
Fiscal deficit inclusive of grants |
(887.2) |
(923.3) |
4.1% |
|
Projected Deficit as % of GDP |
(5.1%) |
(4.8%) |
(0.3%) pts |
|
Net foreign borrowing |
281.5 |
287.7 |
2.2% |
|
Net domestic borrowing |
605.7 |
635.5 |
4.9% |
|
Total borrowing |
887.2 |
923.2 |
4.1% |
Source: National Treasury of Kenya, www.parliament.go.ke
Some of the key take-outs include;
- The government projects total revenue inclusive of grants for FY’2025/26 to increase by 8.0% to Kshs 3.4 tn (equivalent to 17.5% of GDP), from the Kshs 3.1 tn in FY’2024/2025 (equivalent to 17.9% of GDP). The increase is mainly due to a 6.7% increase in ordinary revenue to Kshs 2.8 tn (equivalent to 14.3% of GDP) for FY’2024/2025, from the Kshs 2.6 tn in FY’2023/24 (equivalent to 14.8% of GDP),
- Total expenditure is set to increase by 7.1% to Kshs 4.3 tn (equivalent to 22.3% of GDP), from Kshs 4.0 tn (equivalent to 23.0% of GDP) in the FY’2024/25 Budget estimates,
- Recurrent expenditure is set to increase by 5.8% to Kshs 1.8 tn (equivalent to 9.4% of GDP), in FY’2025/2026, from Kshs 1.7 tn in the FY’2024/2025 budget estimates. Consolidated Funds Services expenditure is set to increase by 7.6% to Kshs 1.3 tn in FY’2025/2026, from Kshs 1.2 tn in the FY’2024/2025 budget estimates.
- Development expenditure is set to increase by 11.0% to Kshs 693.2 bn, from Kshs 624.7 bn in the FY’2024/2025 budget estimates,
- Public debt is expected to continue growing in FY’2024/25, as the approximate Kshs 923.2 bn fiscal deficit will be financed through domestic debt totaling Kshs 635.5 bn and foreign debts totaling Kshs 287.7 bn. Similarly, the total borrowing is expected to increase by 4.1% to Kshs 923.2 bn in the FY’2025/26, from Kshs 887.2 bn as per the FY’2024/2025 supplementary budget II. Notably, Kenya’s public debt burden which stood at 66.6% of GDP as of September 2024, surpassing the 50.0% recommended threshold by 16.6% points, continues to exert pressure on fiscal sustainability and increase the risk of debt distress in the country, and,
- The budget deficit is projected to decline by 0.3% points to 4.8% of GDP, from the 5.1% of GDP in the FY’2024/2025 budget, mainly as growth in revenues outpace growth in expenditure.
Section III: Analysis and House-view on Key Aspects of the FY’2025/2026 Budget
- Revenue
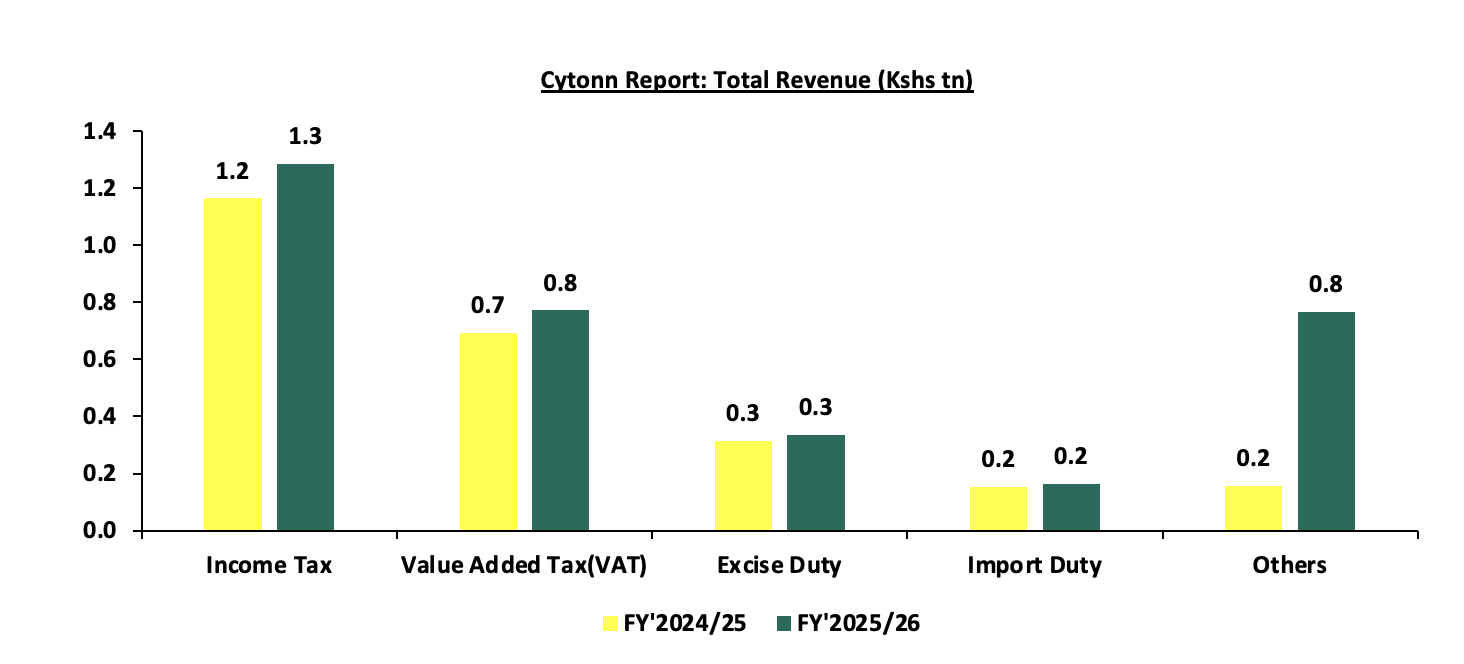
Revenue is projected to increase by 8.0% to Kshs 3.4 tn in FY’2024/25, from Kshs 3.1 tn in the FY’2024/25 supplementary budget II. The increased revenue projections in the FY’2025/26 are mainly attributable to the projected 6.7% growth in ordinary revenue to Kshs 2.8 tn in FY’2025/26, from Kshs 2.6 tn in the FY’2024/25 budget. The main sources of revenue will be:
- Income Tax, which remains the highest contributor to government revenue, contributing 38.7% of the total revenue projections of Kshs 3.3 tn, is expected to increase by 10.3% to Kshs 1.3 tn in FY’2025/26, from Kshs 1.2 tn in FY’2024/2025,
- Value Added Tax (VAT) contributing 23.2% of the projected total revenue is projected to increase by 11.1% to Kshs 771.7 bn in FY’2025/26 budget, from Kshs 694.3 bn in the FY’2024/25 budget,
- Excise Duty contributing 10.1% to the projected revenues for the FY’2025/26 is expected to increase by 6.5% to Kshs 335.5 bn, from Kshs 315.0 bn in FY’2024/25 budget estimates, and,
- Import Duty contributing 4.9% to the projected revenues for the FY’2025/26 is expected to increase by 6.5% to Kshs 162.9 bn, from Kshs 157.1 bn in FY’2024/25 budget estimates.
The chart below compares ordinary revenue projections for FY’2025/26 and FY’2024/25:
The government relies on the effectiveness of the Kenya Revenue Authority in collecting taxes as well as increase in some of the existing taxes to meet its revenue target, which has seemingly resulted in improved revenue collection as evidenced by 93.2% of the revenue targets in FY’2023/24, and having attained 91.2% of the prorated revenue numbers for FY’2024/25 as of end May 2025. To enhance domestic revenue mobilization and support key government programs in FY’2025/2026, the Kenyan government is implementing a blend of tax policy and administrative measures focused on expanding the tax base, improving compliance, and leveraging technology. Priority sectors such as the digital economy, agribusiness, and SMEs are being targeted through tax education and outreach, while the Kenya Revenue Authority (KRA) has introduced digital tools like auto-populated VAT and simplified PAYE returns, the Electronic Rental Income Tax System, and integration of fuel dispensers with the Tax Invoice Management System to streamline compliance and increase transparency. These innovations aim to promote a fair and inclusive tax culture while reducing administrative burdens. However, despite the efforts in place, historically, the government has struggled to meet its target revenue collections resulting to an ever-present fiscal deficit. As such, there are still concerns about the government's ability to meet its revenue collection targets in FY’2025/2026 mainly on the back of the current operating environment, where the cost of living remains elevated despite an ease in inflationary pressures. The chart below shows the ordinary revenue performance in the previous fiscal years:
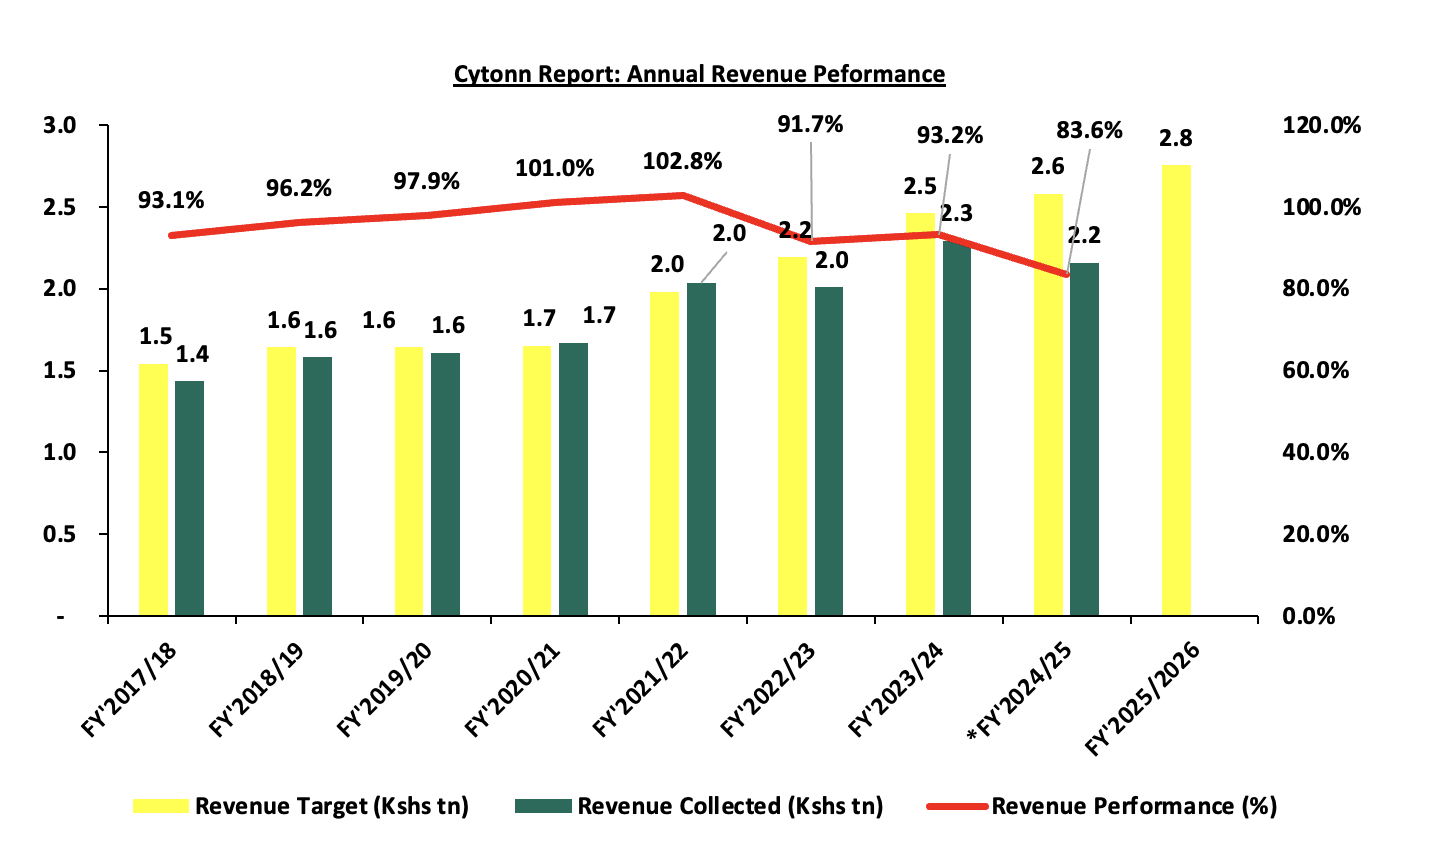
Source: National Treasury of Kenya and Kenya Revenue Authority
*Total Revenue collection as of 31 May 2025
- Expenditure
Expenditure is expected to increase by 7.1% to Kshs 4.3 tn, from Kshs 4.0 tn in the FY’2024/25 budget with recurrent expenditure taking up 73.0% of the total expenditure for FY’2025/2026, in comparison to the 73.6% in FY’2024/2025. The chart below shows the comparison between the recurrent expenditure allocations and development expenditure allocations over the past five fiscal years:
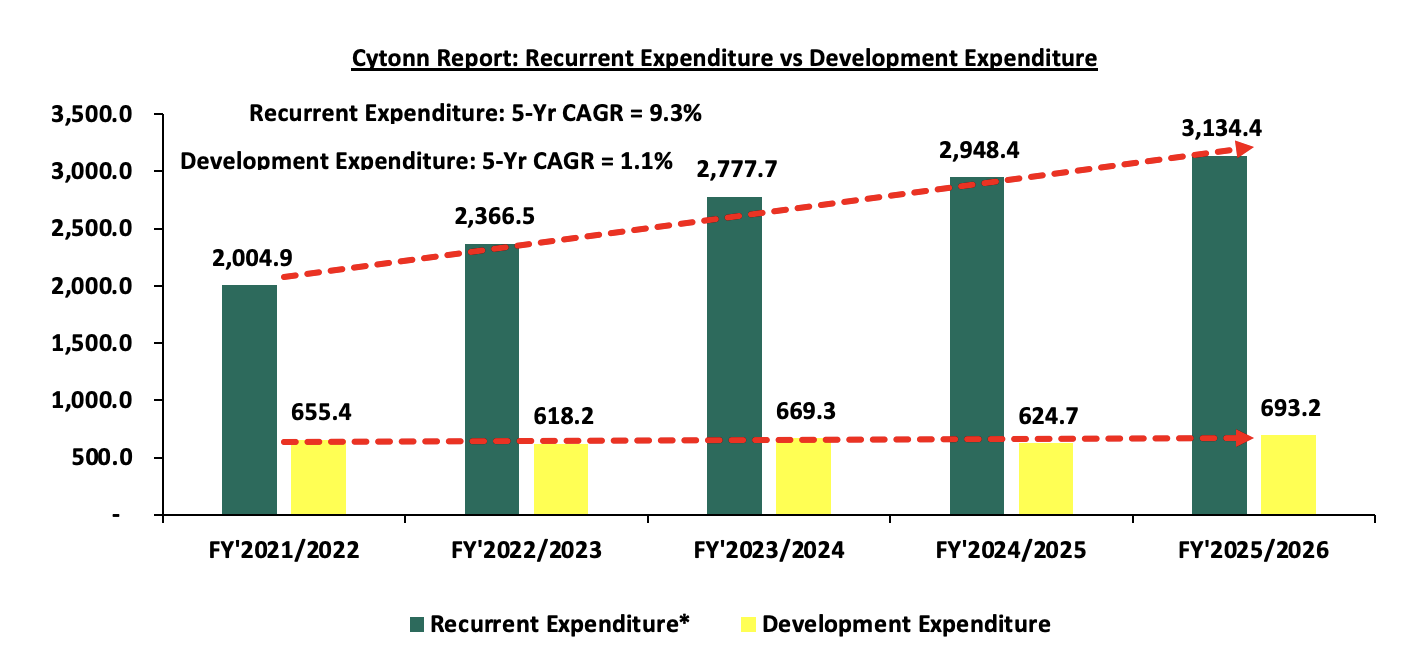
Source: National Treasury of Kenya
*Recurrent Expenditure includes the Consolidated Fund Services (CFS) Expenditure
Some of the key take-outs include;
- Recurrent expenditure takes the largest proportion of government expenditure over the last five fiscal years growing at a 5-year CAGR of 9.3% to Kshs 3,134.4 bn in FY’2025/26, from Kshs 2,004.9 bn in FY’2021/2022. For the FY’2024/2025, the recurrent expenditure is estimated to increase by 6.3% to Kshs 3,134.4 bn, from Kshs 2,948.4 bn in FY’2024/2025 mainly due to a 7.6% increase in Consolidated Fund Services (CFS) expenditure to Kshs 1,337.3 bn from Kshs 1,242.7 bn in FY’2024/2025. The increase can be mainly attributed to the increased debt servicing cost which represented 88.5% of the CFS expenditure in FY’2024/2025 as of 30th May 2025. We expect the debt servicing cost to continue increasing as the government is expected to borrow more to close the revenue gap, and,
- Development expenditure on the other hand continues to lag behind contributing only 16.2% of the FY’2025/26 expenditure estimates. Allocation to infrastructure remains the highest taking 77.3% of the development expenditure. In the FY’2025/2026, infrastructure expenditure is set to increase by 12.2% to Kshs 535.6 bn, from Kshs 477.2 bn estimate in FY’2024/2025 in line with the government’s agenda of increasing the development of critical infrastructure in the road, rail, sea, and airport sectors in order to open many areas to economic activities and spur growth in cross border trade and regional integration. The table below shows the sectors with the highest expenditure allocation over the last five fiscal years:
|
Amounts in Kshs billions unless stated otherwise |
|||||||
|
Cytonn Report: Kenya Budget Highest Expenditure Allocations |
|||||||
|
Item |
FY'2021/2022 |
FY'2022/2023 |
FY'2023/2024 |
FY'2024/2025 |
FY'2025/2026 |
Change |
CAGR |
|
Interest Payments, Pensions & Net Lending |
718.3 |
867.8 |
1057.7 |
1242.7 |
1337.0 |
7.6% |
13.2% |
|
Education |
503.9 |
544.4 |
628.6 |
656.6 |
702.7 |
7.0% |
6.9% |
|
Infrastructure |
383.3 |
416.4 |
468.2 |
477.2 |
535.6 |
12.2% |
6.9% |
|
County Shareable Revenue |
370.0 |
399.6 |
423.9 |
445.6 |
474.9 |
6.6% |
5.1% |
|
Public Admin & Int. Relations |
299.7 |
342.2 |
327.0 |
322.4 |
335.4 |
4.0% |
2.3% |
|
Total |
2275.2 |
2570.4 |
2905.4 |
3069.7 |
3271.8 |
6.6% |
7.5% |
Source: The Mwananchi Guide for the FY’2025/26, National Treasury of Kenya
Notably, the allocation to interest payment, pension and net lending increased by 7.6% to Kshs 1,337.0 bn in FY’2025/26 from Kshs 1,242.7 bn in FY’2024/25, partly attributable to high cost of servicing debt.
- Borrowing
The total borrowing for the FY’2024/25 is set to increase by 4.1% to Kshs 923,2 bn, from Kshs 887.2 bn, in FY’2024/25 budget estimates II. The public debt mix is projected to comprise of 31.2% foreign debt and 68.8% domestic debt, from 31.7% foreign financing and 68.3% domestic financing as per the FY’2024/25 Supplementary Budget II. The rise in debt servicing expenses can be partly attributed to the government’s high affinity for debt to finance the wide budget deficits, partly fueled by the ballooning recurrent expenditure and debt costs. As the government works towards maintaining sustainable debt levels, it will be crucial to implement debt management reforms, prioritize concessional borrowing, and develop the domestic debt market to lower borrowing costs further. Additionally, the government will explore innovative financing options such as debt swaps, diaspora bonds, and sustainability-linked instruments to diversify funding sources, and support fiscal consolidation. The chart below shows the evolution of public borrowing to fill the fiscal deficit gap over the last five years:
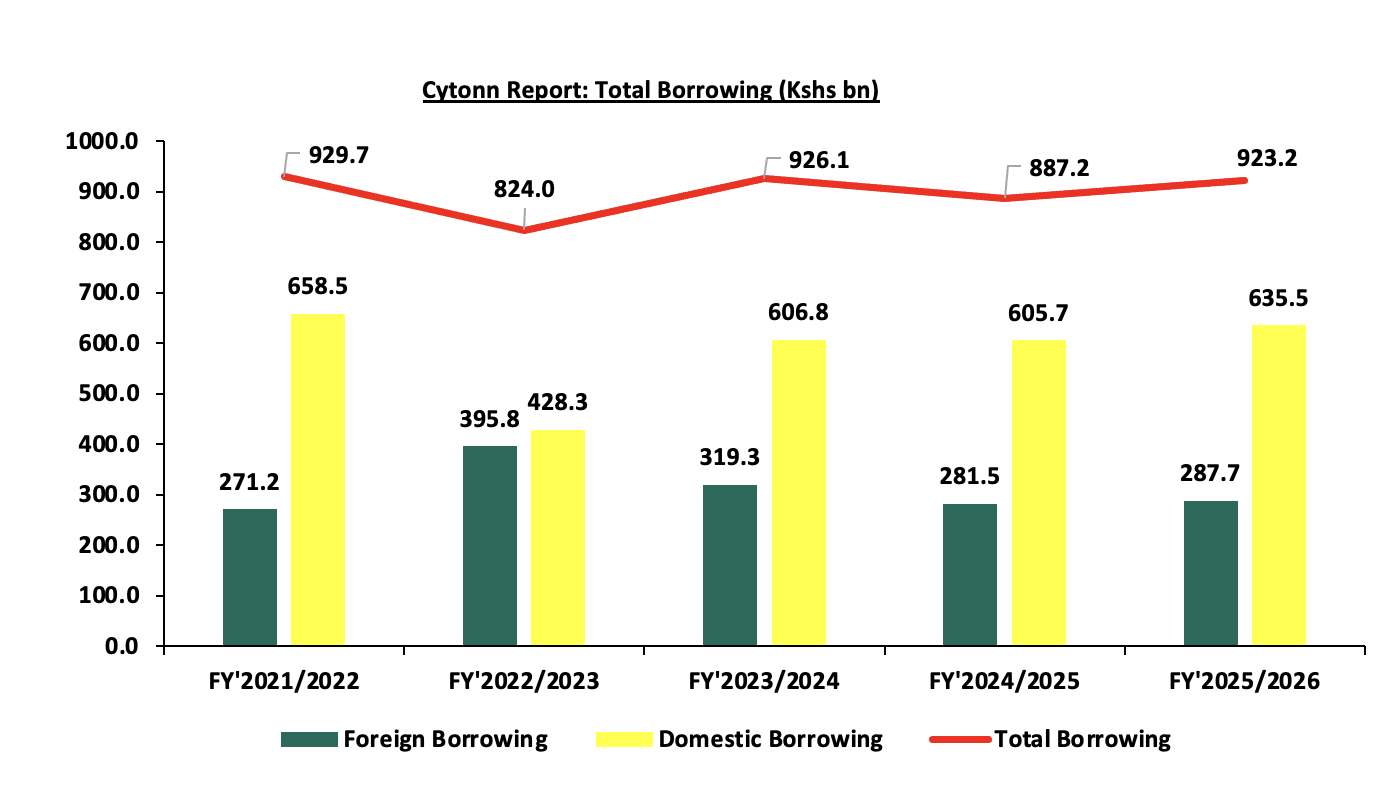
The key take-outs from the chart include:
- The proportion of domestic financing is estimated to rise slightly to 68.8% in FY’2025/26 from 68.3% in FY’2024/25. While this may heighten the risk of crowding out the private sector given banks' preference for lending to the government due to lower perceived risk, it is worth noting that interest rates have been on a downward trajectory since last year, with the 91-day T-bill averaging at 8.2% for June 2025, compared to an average rate of 16.0% in June 2024, which could ease some pressure on private sector credit access. This coupled with ongoing decline in borrowing rates is expected to encourage more lending to the private sector, and,
- The total borrowing is expected to increase by 4.1% to Kshs 923.2 bn, from Kshs 887.2 bn in FY’2024/25, reflecting the dependence on debt to finance the fiscal deficit. This underscores the need for sustained fiscal consolidation efforts, including enhanced revenue mobilization and prudent expenditure management, to reduce long-term debt dependence and ensure fiscal sustainability.
We therefore note the persistent fiscal deficit is mainly on the back of low revenue collection and high expenditure. As such, the government needs to minimize spending through the implementation of structural reforms and the reduction of amounts extended to recurrent expenditure. This would allow the government to refinance other critical sectors, such as agriculture, resulting in increased revenue.
Section IV: Finance Bill 2025
On 19th June 2025, the Kenyan Parliament approved the Finance Bill 2025. Rather than introducing aggressive tax hikes, the Bill focused on plugging revenue leakages, a more reserved approach following the widespread anti-finance bill protests that occurred in June and July 2024, following the Finance Bill 2024.The raft of tax changes in the Finance Bill 2025 are geared towards expanding the tax base and increasing revenues through sealing revenue leakages to meet the government’s budget for the fiscal year 2025/2026 of Kshs 4.3 tn, as well as reduce the budget deficit and borrowing.
Against this backdrop of fiscal consolidation and cautious borrowing, the Finance Bill 2025 introduces a series of targeted measures that aim to broaden the tax base, seal revenue leakages, and support the government’s drive toward a more sustainable fiscal framework. Below we highlight some of the key tax changes, effective from 1st July 2025 contained in the Finance Bill 2025 and the implications:
- Under the Income Tax Act, the Bill provides to:
- Restrict carryover of tax losses to a maximum of 5 years, which could hurt long-term, capital-intensive projects that take over 5 years to become profitable hence possibility of discouraging both foreign and local investment.
- Eliminate the ability to deduct past capital losses from future capital gains meaning taxpayers may be taxed on gains even when they’ve recently suffered related losses, increasing tax burden unfairly.
- Scrap the exemption that prevents income already taxed under another law from being taxed again as a capital gain, increasing the effective tax rate for investors.
- Exempt gains from transferring securities traded on any Capital Markets Authority-licensed exchange from tax, encouraging foreign investment in securities by removing tax on transfers, boosting market activity.
- Exempt dividends from tax for companies certified by the Nairobi International Financial Centre Authority (NIFCA) with a minimum reinvestment of Kshs 250.0 mn annually. This will therefore incentivize companies to reinvest significant amounts, balancing tax incentives with economic growth.
- Lower corporate income tax to 15.0% for the first 10 years for NIFCA-certified companies, then 20.0% thereafter, if they invest Kshs 3.0 bn in the first three years, are holding companies, employ 70.0% Kenyan senior management, and have 60.0% Kenyan employees in senior roles with headquarters in Kenya. For start-ups, 15.0% for the first three years, then 20.0% for the next four years. This promotes investment and job creation in Kenya by offering tax relief, encouraging foreign direct investment and supporting start-ups while ensuring local employment.
- Decrease the digital asset tax rate to 1.5% from 3.0% on transfer or exchange value, lowering the tax burden on digital asset transactions, therefore fostering higher trading volumes and stimulating Kenya’s digital market.
- Require only one designated entity in Kenya to file Country-by-Country Reporting (CbCR) when multiple entities of a multinational group are resident in Kenya, bringing clarity to the filing obligations of multinational entities, reducing uncertainty.
- Remove exemption from Country-by-Country Reporting (CbCR) filing for resident surrogate parent entities, aligning Kenya’s tax laws with international standards, BEPS Action 13, promoting global tax transparency.
- Allow taxpayers to agree in advance, Advance Pricing Agreements (APA) with the KRA on transfer pricing for up to 5 years, easing tax compliance for related-party transactions by reducing disputes and audit risks through pre-agreed pricing, effective from 1st January 2026.
- Introduce a withholding tax on profits or gains from non-resident ship owners or charterers, excluding transhipment activities, expanding the tax base to include income from non-residents, potentially increasing government revenue but raising shipping business costs and possibly redirecting shipping routes.
- Extend the definition of royalty to include recurring software-related payments made through distributors. This change could expand tax liability for software distributors, increasing compliance obligations and possibly reducing economic returns.
- Set the payment deadline for minimum top-up tax to the end of the fourth month after the financial year, to enhance clarity and consistency in payment timelines, aligning with amendments from the Tax Laws Amendment Act 2024.
- Raise the per diem cash benefit ceiling to Kshs 10,000.0 from Kshs 2,000.0 for employees as reimbursement for work-related duties. This increase offers financial relief to employees, to reflect the current economic conditions and the prevailing cost of living
- Grant tax exemptions, reliefs, and deductions under the Income Tax Act on employee income before applying PAYE, increasing the disposable income
- Apply the corporate income tax rate to fringe benefits, simplifying the tax calculation process for fringe benefits, reducing the administrative burden on businesses.
- Mandate that companies report dividends distributed from untaxed gains in their annual tax returns.
- Include payments for the sale of scrap and supply of goods to a public entity under the ambit of withholding tax.
- Broaden the Significant Economic Presence Tax to cover businesses operating over the internet or through digital marketplaces.
- Remove the Kshs 5.0 mn annual turnover threshold for non-residents to be liable for the Significant Economic Presence Tax.
- Under the Excise Duty Act, the Bill provides to:
- Remove excise duty on imported eggs, onions, potatoes, potato crisps, and chips self-adhesive plates, sheets, films, foils, tapes, and flat shapes and printed paper or paperboard, except for items from East African Community (EAC) Partner States meeting EAC Rules of Origin, potentially lowering consumer pricesfor goods from the EAC region through increased competition and boosting regional economic activity.
- Introduce a 14-day deadline within which the Kenya Revenue Authority (KRA) must either approve or reject applications for licenses concerning the manufacture or importation of excisable goods and services. This time-bound framework aims to increase certainty and speed in the licensing process.
- Redefine a digital lender as someone who provides credit via electronic means, excluding banks under the Banking Act, Sacco societies under the Co-operative Societies Act, or microfinance institutions under the Microfinance Act offering relief to financial institutions already subject to excise duties, reducing double taxation and enhancing clarity in the regulatory framework.
- Describe a digital marketplace as any electronic or online platform that enables users to buy or access goods, services, or property. This updated definition ensures harmonization with existing tax laws, including the Income Tax Act, VAT Act, and Excise Duty Act, thereby promoting consistent tax treatment.
- Broaden the reach of excise duty to include digital services provided by non-residents over the internet, electronic networks, or digital marketplaces, defining a non-resident as a person outside Kenya.
- Under the Value Added Tax (VAT) Act, the Bill provides to:
- Add Section 66A, which imposes VAT liability if exempt or zero-rated goods/services are used or disposed of in a way that contradicts their original exempted purpose implying that taxpayers must now ensure strict adherence to the intended use of exempt or zero-rated items.
- Reduce the allowed period for businesses to apply for VAT refunds to 12 months from 24 months after the tax becomes due, meaning businesses will face tighter deadlines to claim VAT refunds, potentially increasing compliance pressure.
- Cut the refund claim period for VAT on unpaid debts to 2 years from 3 years after supply and permits KRA, upon approval, to apply any refunded VAT to offset other VAT debts.
- Introduces a formal definition of Tax Invoice including mandatory electronic issuance under Section 23A of the Tax Procedure Act and expand VAT-registered businesses' obligation to issue tax invoices to cover exempt supplies, removing the term "taxable" from existing provisions.
- Subject fuels, lubricants, and tires used in vehicles for official aid projects to a 16.0% VAT. Even though other goods for aid-funded projects will remain VAT-exempt, these specific vehicle-related items will now attract VAT.
- Apply 16.0% VAT to goods used exclusively in building tourism infrastructure like hotels, parks (minimum 50 acres), and conference venues, if approved by the Cabinet Secretary, locally assembled vehicles purchased before customs clearance by tour operators for tourist transportation, subject to certain conditions. Key to note, previous VAT exemptions for such developments remain until 30th June 2026. This proposal had been included in the 2024 Finance Bill but was not enacted at that time.
- Apply 16.0% VAT to construction goods under the Affordable Housing Programme, if approved by the Cabinet Secretary. Key to note, previous VAT exemptions for such developments remain until 30th June 2026.
- Change the VAT status of locally assembled mobile phones from zero-rated to exempt.
The Finance Bill 2025 reflects a cautious approach, with the government opting for tax administration reforms over new tax burdens. This move is clearly informed by the lessons of 2024, where unpopular tax hikes triggered widespread protests and public discontent. By focusing on broadening the tax base, improving compliance, and sealing revenue leakages, the government seeks to achieve its fiscal objectives while maintaining economic and social stability. The updated budget estimates for FY’2025/26 underscore this approach, with a reduced projected fiscal deficit target of 4.8% of GDP, down from the 5.1% in FY’2024/25. Notably, inflation has remained relatively stable, remaining within the CBK’s target range of 2.5%-7.5%, although the risk of inflationary pressures still remains majorly as a result of the easing monetary policy. Additionally, and the Kenyan shilling has stabilized against major currencies, supporting the overall economic performance. Lending rates have started to ease following the continued easing of the monetary policy stance, with the weighted average lending rate for commercial banks standing at 15.7% as of April 2025, 0.1% points down from 15.8% in March 2025, as such this will create a more favorable environment for credit growth to the private sector, which had previously been constrained by high borrowing costs. With GDP growth expected to rebound from 4.7% in 2024 to an estimated 5.3% in 2025, the stage is set for renewed economic momentum, provided the right mix of fiscal discipline and policy support is maintained and stimulation of the business environment to encourage investment. As Kenya navigates the challenges of high public debt, constrained fiscal space, and growing public expectations, the success of this budget cycle will depend on transparency, accountability, and effective implementation. The Finance Bill 2025 marks a step in the right direction, but sustained commitment will be essential to realize its promise.
Section V: Conclusion and Our View
The Kenyan economy has continued to remain resilient despite recording a slowdown in growth to 4.7% in FY’2024 compared to a growth of 5.7% recorded in FY’2023. We expect the economy to gain momentum and grow at a faster pace given the improved business environment as result of the declining cost of credit providing some relief to businesses and households. Additionally, the Central Bank of Kenya’s Monetary Policy Committee’s (MPC) decision on 10th June 2025 to lower the Central Bank Rate (CBR) to 9.75% from 10.00% in April 2025 in a bid to lower the cost of credit and promote economic growth. The lower CBR is set to reduce the cost of credit issued by lenders, hence encouraging borrowing, which will in turn lead to increased investment spending in the economy by both individuals and businesses. Moreover, the economy is expected to record a growth rate of 5.3% in 2025, mainly supported by private sector growth, continued strong growth of the financial services sector, and recoveries in the agricultural sector. Furthermore, in the FY’2025/2026 budget, the government has allocated Kshs 8.0 bn for the fertilizer subsidy program aimed at lowering the cost of farm input and enhancing food supply in the country.
The government has increased its appetite for debt, projecting to borrow Kshs 923.2 bn in total debt in the FY’2025/26, a 4.1% increase from 887.2 billion in the FY’2024/25. The move is expected to increase the cost of debt servicing, given that both foreign and domestic debt has been ballooning as a result of wide budget deficits. Additionally, with the government's continued inclination towards domestic borrowing, by projecting to increase its domestic borrowing by 4.9% to Kshs 635.5 bn in FY’2025/26, from Kshs 605.7 bn in FY’2024/25, remains a risk to lending to the private sector, with increased credit demand by the government in the absence of alternative borrowing. Notably, the government has also turned to private placements as seen in the recent issue of USD 500.0 mn amortizing note maturing in 2032 on April 2025, which is part of the USD 1.5 billion private bond placements signed in February 2025, showing its efforts to raise funds amid constrained access to external financing.
Overall, we are of the view that the main driver of the growing public debt is the fiscal deficit occasioned by lower revenues as compared to expenditures. As a result, implementing robust fiscal consolidation would help the government bridge the deficit gap. This can be achieved by minimizing spending through the implementation of structural reforms and the reduction of amounts extended to recurrent expenditure. Fiscal consolidation would also allow the government to refinance other critical sectors, such as agriculture, resulting in increased revenue. However, the overall risk to the economy remains high, owing to the high debt servicing costs in the next fiscal year.
Disclaimer: The views expressed in this publication are those of the writers where particulars are not warranted. This publication, which is in compliance with Section 2 of the Capital Markets Authority Act Cap 485A, is meant for general information only and is not a warranty, representation, advice or solicitation of any nature. Readers are advised in all circumstances to seek the advice of a registered investment advisor.

- Talk to us
- Kenya
- P.O Box 20695 - 00200, Nairobi, Kenya
- Cell +254709101200
- Tel +254709101200
- WhatsApp +254741676635
- United States
- +254709101200
- DOWNLOAD OUR APP
-


- Kenya
- 8th Floor, Pinetree Plaza, Kaburu Drive, Ngong Road, Nairobi, Kenya
- USA
- Suite 1150, 1775 Eye Street NW, USA, Washington DC 20006, USA
- Investments
- High Yield
- Private Equity
- Real Estate
- Real Estate
- RiverRun Estates
- Cytonn Towers
- The Ridge
- Taraji Heights
- The Alma