
Kenya’s Public Debt Review 2026 & Cytonn Weekly #31.2026
By research team, Aug 9, 2026
Executive Summary
Fixed Income
During the week, T-bills were oversubscribed for the first time in two weeks, with the overall subscription rate coming in at 107.0% lower than the subscription rate of 97.7%, recorded the previous week. Investors’ preference for the shorter 91-day paper persisted, with the paper receiving bids worth Kshs 13.6 bn against the offered Kshs 8.0 bn, translating to a subscription rate of 169.9%, albeit lower than the subscription rate of 180.0%, recorded the previous week. The subscription rate for the 182-day paper increased to 101.7% from 81.7% recorded the previous week, while that of the 364-day paper increased to 62.1% from 47.9% recorded the previous week. The government accepted a total of Kshs 28.5 bn worth of bids out of Kshs 30.0 bn bids received, translating to an acceptance rate of 95.2%. The yields on the government papers were on a downward trajectory with the yields on the 364-day paper and 91-day paper decreasing by 1.3 bps and 0.6 bps respectively to 9.00% and 8.78% from 9.02% and 8.79% respectively recorded the previous week. The 182-day paper decreased by 0.5 bps to remain relatively unchanged at 8.95% recorded the previous week;
During the week, Stanbic Bank released its monthly Purchasing Managers' Index (PMI), indicating that Kenya's Purchasing Managers' Index (PMI) improved by 1.3 points to 51.3 in July 2026, from 50.0 in June 2026, marking the second consecutive month of improving business conditions after private sector activity contracted between March and May 2026;
Equities
During the week, the equities market showed a mixed performance, with NSE 20 gaining by 0.4%, while NASI, NSE 10 and NSE 25 lost by 1.2%, 0.8% and 0.5% respectively taking the YTD performance to gains of 30.9%, 28.0%, 27.8% and 25.5% respectively for NSE 20, NSE 10, NSE 25 and NASI respectively. The week-on-week equities market performance was mainly driven by gains recorded by large cap stocks such as Co-op Bank, NCBA Bank and EABL of 2.7%, 2.2% and 1.9% respectively. However, the performance was weighed down by losses recorded by large cap stocks such as Safaricom, BAT and Stanbic Bank of 3.8%,3.2% and 2.6% respectively;
During the week, the banking sector index decreased by 0.1% to 269.0 from the 269.4 recorded the previous week. This is attributable to losses recorded by large cap stocks such as Stanbic, Equity Bank and KCB of 2.6%, 1.7% and 1.5% respectively. However, the performance was supported by gains recorded by large cap stocks such as Co-op Bank, NCBA and DTB of 2.7%, 2.2% and 1.1% respectively;
During the week, NCBA Bank released their H1’2026 financial results recording a 12.2% increase in profit after tax to Kshs 12.4 bn in H1’2026, from Kshs 11.0 bn in H1’2025;
During the week, Stanbic Bank released their H1’2026 financial results recording a 1.3% increase in profit after tax to Kshs 6.5 bn in H1’2026, from Kshs 6.4 bn in H1’2025;
During the week, East African Breweries Plc (EABL) released their FY’2026 financial results for the year ending 30th June 2026 recording a 49.4% increase in the Profits After Tax (PAT) to Kshs 18.2 bn in FY’2026, from Kshs 12.2 bn in FY’2025;
Real Estate
During the week, Hass Consult, a Kenyan consulting and Real Estate development firm, released its Land and property Price Indices Q2'2026 Report, highlighting the performance of the Real Estate land sector in the Nairobi Metropolitan Area (NMA);
During the week, Reportage Kenya, a Real Estate developer, launched Enzo Residence, a 346-unit apartment development in Riverside, Nairobi, comprising studio, one-bedroom and two-bedroom apartments;
On the Unquoted Securities Platform Acorn D-REIT and I-REIT traded at Kshs 29.7 and Kshs 24.4 per unit, respectively, as per the last updated data on 7th August 2026. The performance represented a 48.5% and 22.0% gain for the D-REIT and I-REIT, respectively, from the Kshs 20.0 inception price. The volumes traded for the D-REIT and I-REIT came in at 13.6 mn and 44.9 mn shares, respectively. Additionally, ILAM Fahari I-REIT traded at Kshs 13.8 per share as of 7th August 2026, representing a 31.0% loss from the Kshs 20.0 inception price. The volume traded to date came in at 1.2 mn shares for the I-REIT;
Digital Payments
During the week, Visa Inc. announced that it had signed a definitive agreement to acquire BioCatch for USD 2.4 bn, strengthening its AI-powered fraud prevention, cybersecurity and risk management capabilities. The acquisition is expected to enhance Visa's ability to detect account takeovers, scams and other forms of digital fraud before payment initiation, further reinforcing its value-added services strategy;
During the week, Mastercard Incorporated launched Asia Pacific's first Taste by Priceless dining club at Hong Kong International Airport, expanding its premium travel and lifestyle benefits for eligible cardholders worldwide. The initiative forms part of Mastercard's broader strategy of differentiating its premium payment products through exclusive travel, dining and entertainment experiences while helping financial institutions enhance customer engagement and loyalty;
During the week, Circle Internet Group announced the founding validator cohort for its Arc blockchain network ahead of its scheduled 16 September 2026 public main net launch, with founding participants including Visa, Mastercard, Global Payments, BlackRock, DTCC and Standard Chartered. The company also highlighted growing institutional adoption of Arc, with more than 100 ecosystem and institutional builders developing on the network and major financial institutions exploring integrations across tokenized assets, digital custody and stablecoin infrastructure;
During the week, Global Payments Inc. was announced as one of the founding institutional validators supporting Circle's Arc blockchain network, marking another step in the company's expansion into blockchain-enabled payment infrastructure and regulated digital asset settlement;
The digital payment companies we track (AXP, Visa, Mastercard, Circle, Block, PayPal, Coinbase, Global Payments, Wise and JPMorgan Chase) are currently trading at an average P/E of 21.4x, implying that investors are pricing in strong future earnings growth expectations and are willing to pay a significant premium for current earnings, which may also suggest that valuations may be stretched relative to near-term fundamentals;Bottom of Form
Focus of the Week
Kenya is one of the fastest growing economies in Sub-Saharan Africa, having registered a growth rate of 5.3% in the first quarter of 2026. Despite being one of the fastest growing economies in Sub-Saharan Africa with a projected economic growth rate of 4.5%, above the region’s expected average of 4.2% in 2026, Kenya is grappling with a high debt burden, which has increased rapidly in recent years. As per the latest data from the National Treasury Monthly Bulletin, the total public debt stood at Kshs 13.0 tn as of June 2026, compared to Kshs 11.8 tn recorded in June 2025. Notably, external debt increased by 3.6% during the period to Kshs 5.7 tn in June 2026 from the Kshs 5.5 tn in June 2025 driven by additional external borrowing, including the February 2026 USD 2.3 bn dual-tranche Eurobond issuance and continued disbursements from multilateral and bilateral creditors. Similarly, domestic debt increased by 15.9% to Kshs 7.3 tn in June 2026, from Kshs 6.3 tn in June 2025, reflecting the government’s increased reliance on domestic financing through Treasury bills and bonds amid elevated global interest rates, tighter access to international capital markets, and IMF fiscal-discipline requirements that have constrained external borrowing. Persistent budget financing needs, coupled with strong local demand for government securities, have further supported the shift towards domestic borrowing. The debt to GDP ratio stood at 68.5% as of June 2026, 18.5% points higher than the International Monetary Fund (IMF) threshold of 50.0% for developing countries, and up from the 67.8% recorded in June 2025 and 67.5% recorded in December 2025. The rising public debt has raised concerns about its sustainability and implications for fiscal and macroeconomic stability. Kenya’s debt levels remain high with high debt servicing costs as evidenced by the B, B3 and B- credit ratings by S&P Global, Moody’s and Fitch credit agencies respectively, signaling high credit risk but with ability to still meet its financial commitments. However, recent policy actions, including successful liability management operations such as Eurobond buybacks and switch auctions, alongside fiscal consolidation efforts aimed at narrowing the budget deficit, have begun to improve Kenya’s credit trajectory. Notably, on 27 January 2026, Moody’s upgraded Kenya’s credit rating from Caa1 to B3 and revised the outlook from positive to stable, signaling the potential for further improvement in the country’s credit profile as investor confidence strengthens and debt management remains prudent. Additionally, On July 17th 2026, Fitch Rating’s affirmed Kenya’s credit score of B- while maintaining a stable outlook. The stable credit outlook from Moody’s, along with stable ratings from Fitch reflects an improvement in Kenya’s credit. The successful Eurobond issuances and liability management operations, including the February 2026 dual-tranche Eurobond issuance and associated buyback offer, have also helped smooth the external debt maturity profile and reduce near-term refinancing pressures.
Investment Updates:
-
Weekly Rates: Cytonn Money Market Fund closed the week at a yield of 11.11% p.a. To invest, dial *809# or download the Cytonn App from Google Play store here or from the Appstore here;
-
We continue to offer Wealth Management Training every Tuesday, from 7:00 pm to 8:00 pm. The training aims to grow financial literacy among the general public. To register for any of our Wealth Management Trainings, click here. If interested in our Private Wealth Management Training for your employees or investment group, please get in touch with us through wmt@cytonn.com;
-
Cytonn Asset Managers Limited (CAML) continues to offer pension products to meet the needs of both individual clients who want to save for their retirement during their working years and Institutional clients that want to contribute on behalf of their employees to help them build their retirement pot. To more about our pension schemes, kindly get in touch with us through pensions@cytonn.com;
Hospitality Updates:
-
We currently have promotions for Staycations. Visit cysuites.com/offers for details or email us at sales@cysuites.com;
Money Markets, T-Bills Primary Auction:
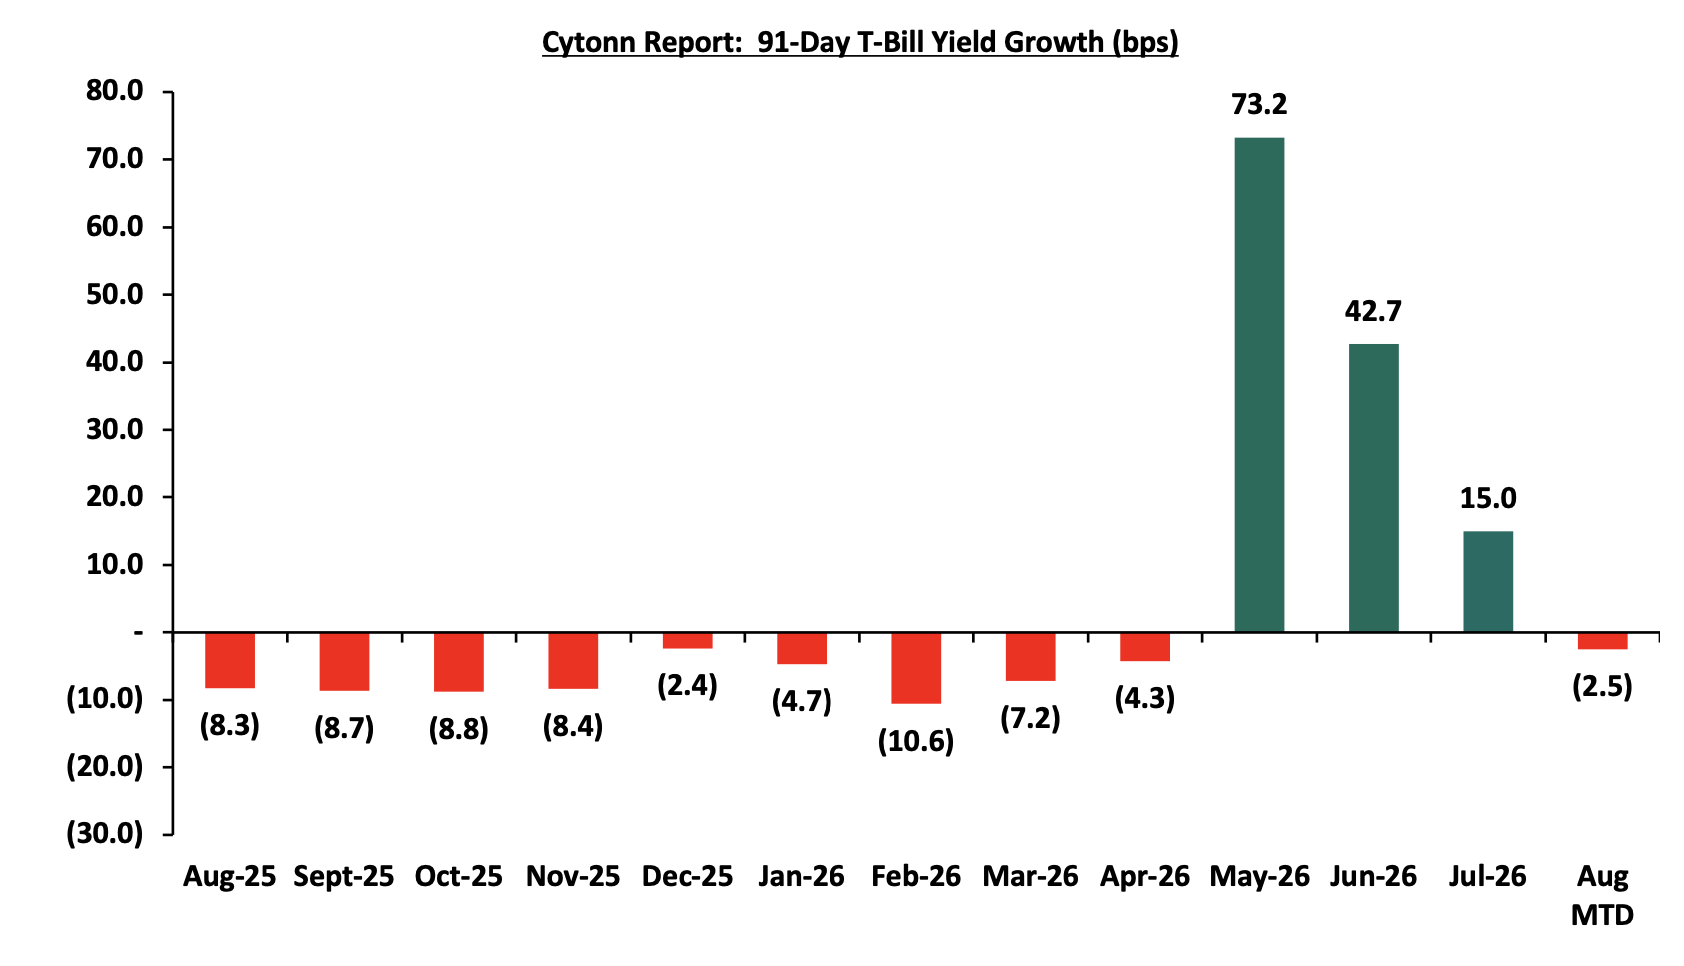
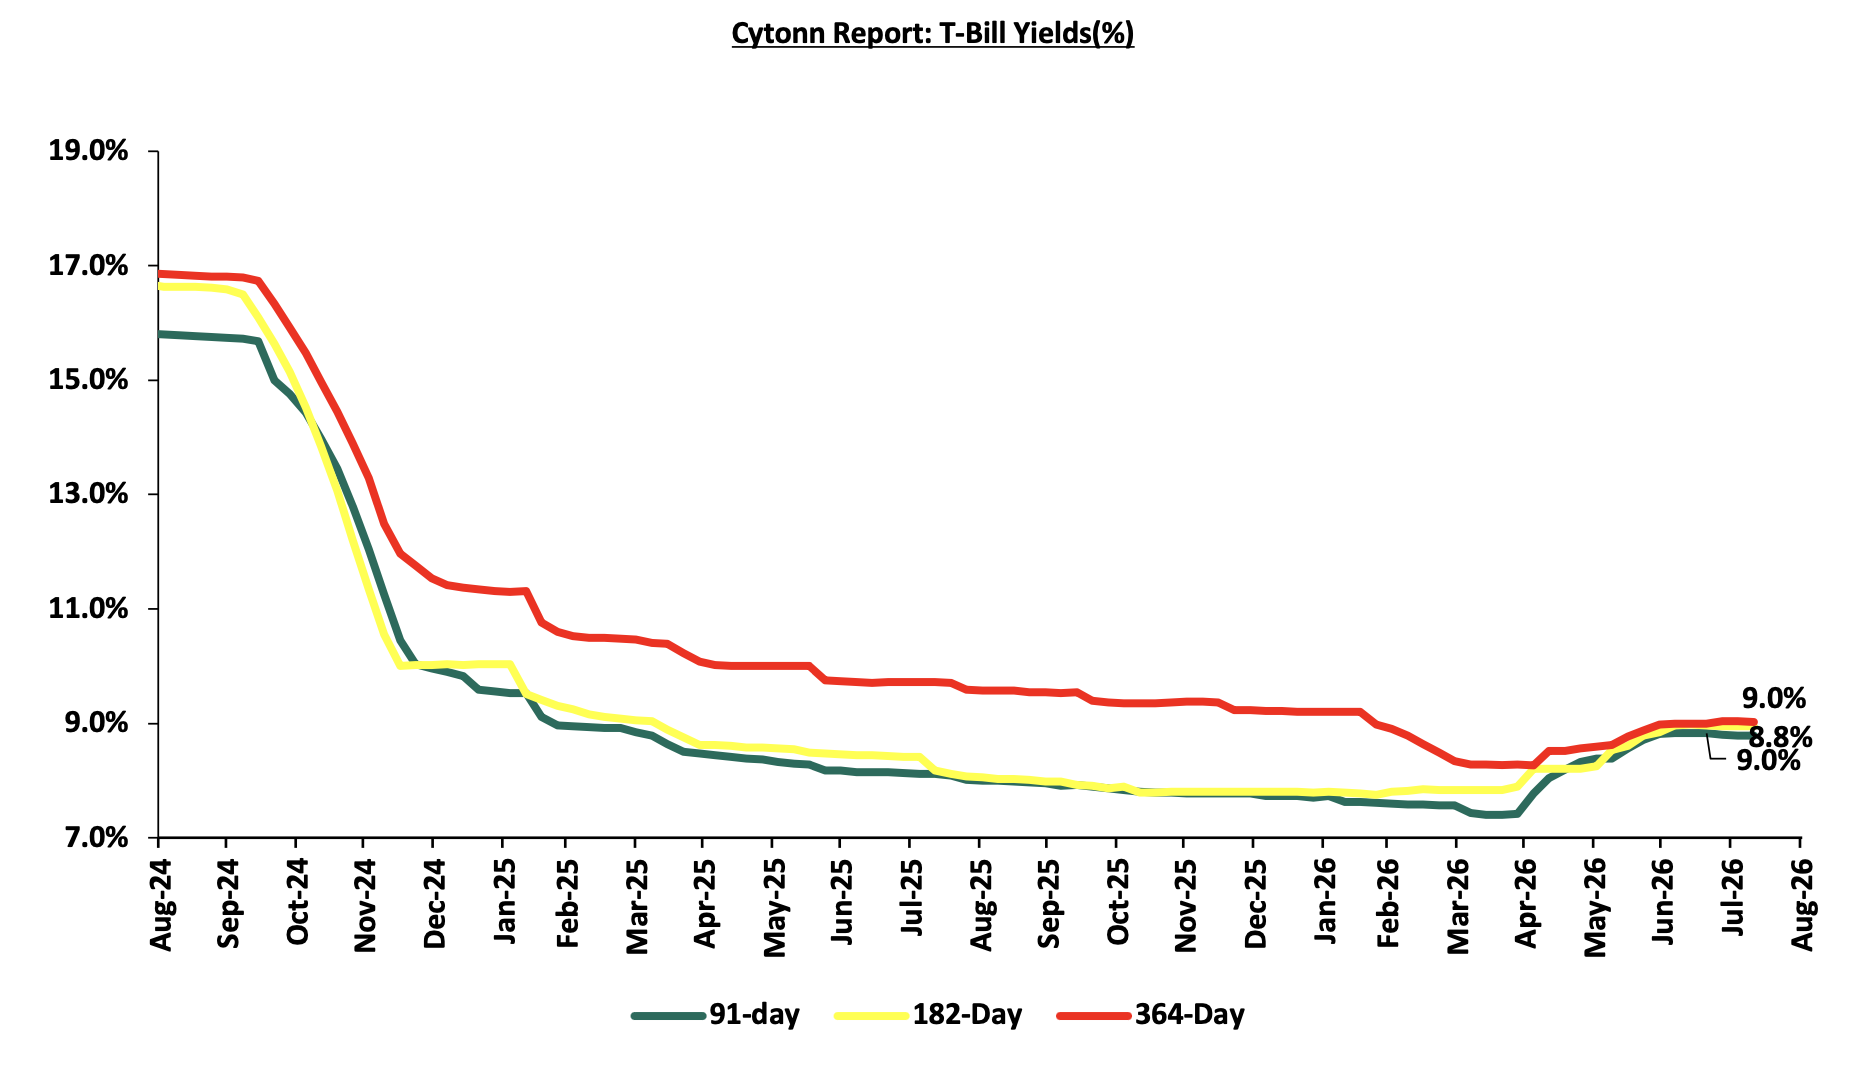
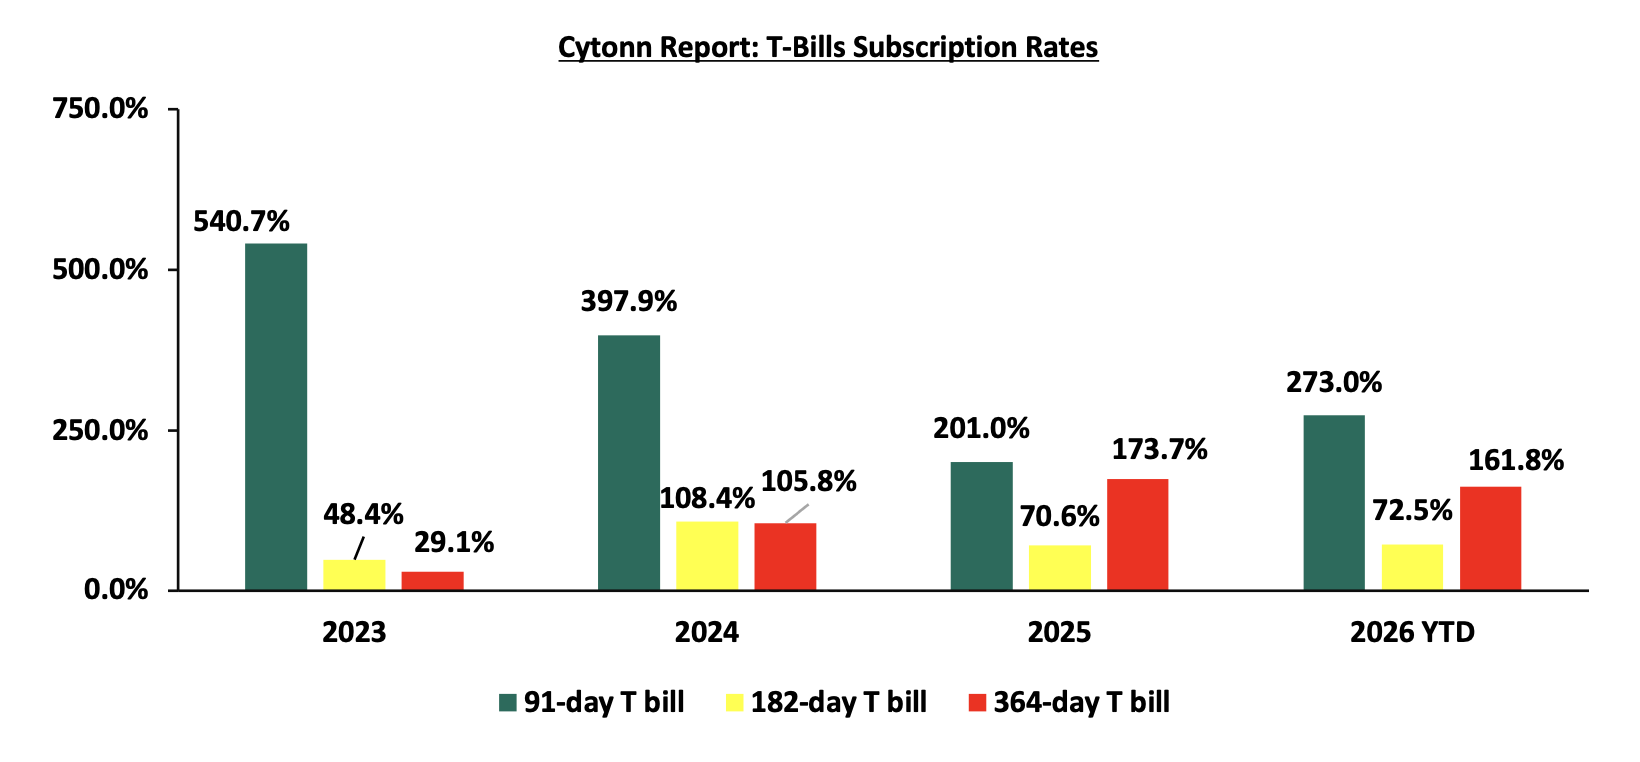
This week, T-bills were oversubscribed for the first time in two weeks, with the overall subscription rate coming in at 107.0% lower than the subscription rate of 97.7%, recorded the previous week. Investors’ preference for the shorter 91-day paper persisted, with the paper receiving bids worth Kshs 13.6 bn against the offered Kshs 8.0 bn, translating to a subscription rate of 169.9%, albeit lower than the subscription rate of 180.0%, recorded the previous week. The subscription rate for the 182-day paper increased to 101.7% from 81.7% recorded the previous week, while that of the 364-day paper increased to 62.1% from 47.9% recorded the previous week. The government accepted a total of Kshs 28.5 bn worth of bids out of Kshs 30.0 bn bids received, translating to an acceptance rate of 95.2%. The yields on the government papers were on a downward trajectory with the yields on the 364-day paper and 91-day paper decreasing by 1.3 bps and 0.6 bps respectively to 9.00% and 8.78% from 9.02% and 8.79% respectively recorded the previous week. The 182-day paper decreased by 0.5 bps to remain relatively unchanged at 8.95% recorded the previous week. The chart below shows the yield growth rate for the 91-day paper from August 2025 to date:
The chart below shows the performance of the 91-day, 182-day and 364-day papers from August 2024 to August 2026:
The chart below compares the overall average T-bill subscription rates obtained in 2023, 2024, 2025 and 2026 Year-to-date (YTD):
Money Market Performance:
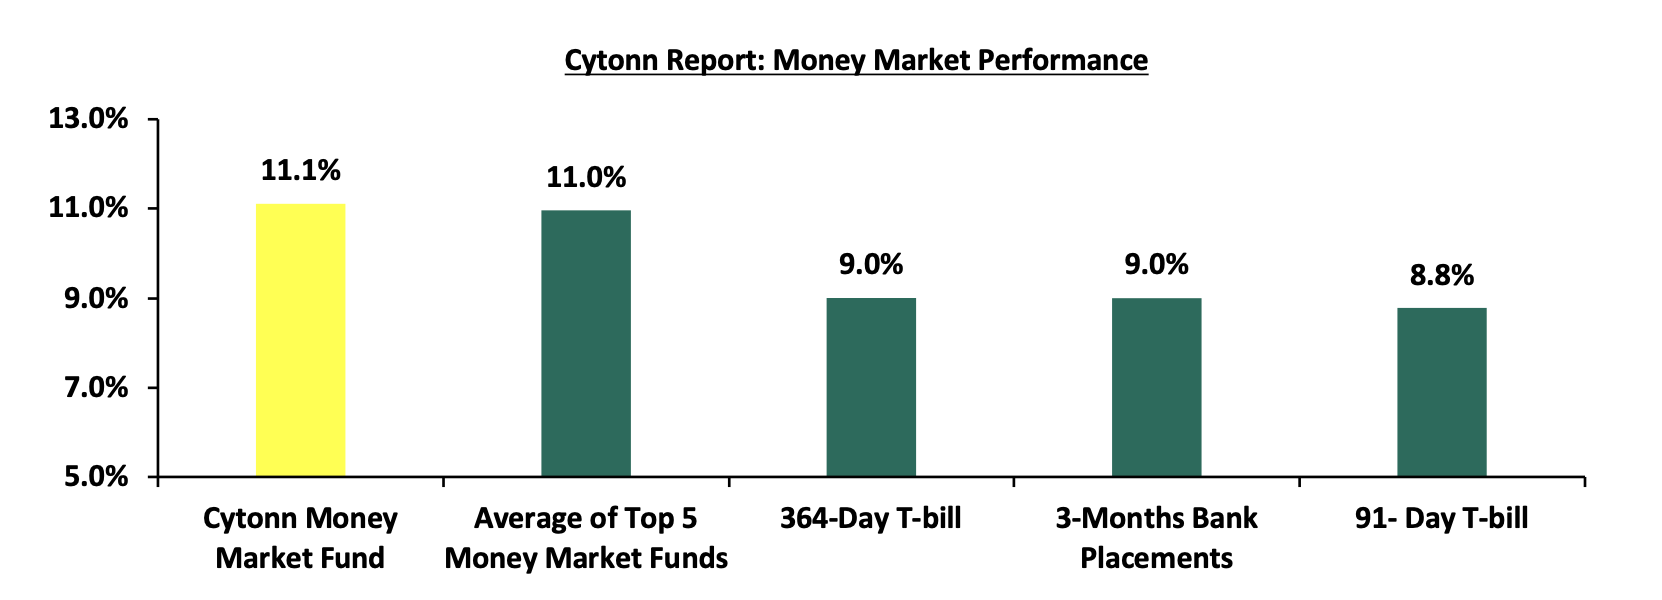
In the money markets, 3-month bank placements ended the week at 9.0% (based on rates offered by various banks). The yields on the 364-day paper and 91-day paper decreased by 1.3 bps and 0.6 bps respectively to 9.00% and 8.78% from 9.02% and 8.79% respectively recorded the previous week. The yield on the Cytonn Money Market Fund decreased by 7.0 bps to 11.1% from 11.2% recorded the previous week, while the average yields on the Top 5 Money Market Funds increased by 1.4 bps to remain relatively unchanged from 11.0% recorded the previous week.
The table below shows the Money Market Fund Yields for Kenyan Fund Managers as published on 7th August 2026:
|
Money Market Fund Yield for Fund Managers as published on 7th August 2026 |
||
|
Rank |
Fund Manager |
Effective Annual Rate |
|
1 |
Nabo Africa Money Market Fund |
12.0% |
|
2 |
Cytonn Money Market Fund ( Dial *809# or download Cytonn App) |
11.1% |
|
3 |
Enwealth Money Market Fund |
10.6% |
|
4 |
Etica Money Market Fund |
10.6% |
|
5 |
Lofty-Corban Money Market Fund |
10.6% |
|
6 |
Faulu Money Market Fund |
10.6% |
|
7 |
Madison Money Market Fund |
10.5% |
|
8 |
Ndovu Money Market Fund |
10.5% |
|
9 |
Kuza Money Market fund |
10.4% |
|
10 |
Globetec Money Market Fund |
10.4% |
|
11 |
British-American Money Market Fund |
10.4% |
|
12 |
Arvocap Money Market Fund |
10.4% |
|
13 |
Old Mutual Money Market Fund |
10.3% |
|
14 |
Orient Kasha Money Market Fund |
10.2% |
|
15 |
GenAfrica Money Market Fund |
10.2% |
|
16 |
Gulfcap Money Market Fund |
10.1% |
|
17 |
Jubilee Money Market Fund |
10.0% |
|
18 |
SanlamAllianz Money Market Fund |
9.7% |
|
19 |
Apollo Money Market Fund |
9.3% |
|
20 |
KCB Money Market Fund |
9.2% |
|
21 |
Dry Associates Money Market Fund |
9.1% |
|
22 |
CPF Money Market Fund |
8.8% |
|
23 |
Genghis Money Market Fund |
8.5% |
|
24 |
CIC Money Market Fund |
8.4% |
|
25 |
ICEA Lion Money Market Fund |
8.1% |
|
26 |
Co-op Money Market Fund |
8.0% |
|
27 |
Mayfair Money Market Fund |
8.0% |
|
28 |
Mali Money Market Fund |
8.0% |
|
29 |
AA Kenya Shillings Fund |
7.9% |
|
30 |
Absa Shilling Money Market Fund |
7.4% |
|
31 |
Ziidi Money Market Fund |
6.0% |
|
32 |
Equity Money Market Fund |
5.2% |
|
33 |
Stanbic Money Market Fund |
|
Source: Daily Nation
Liquidity:
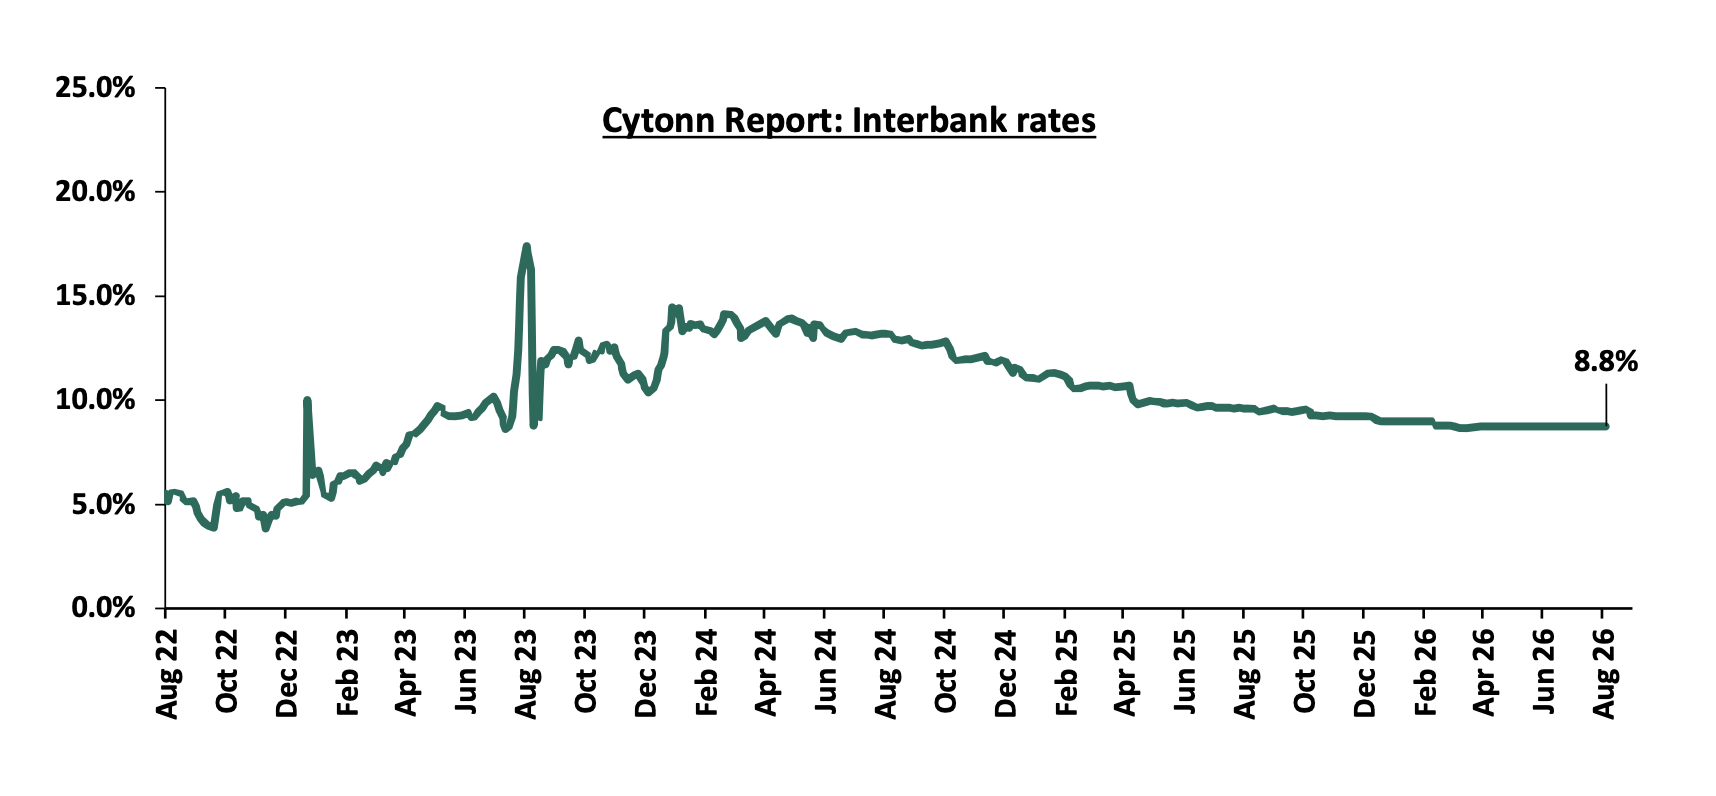
During the week, liquidity in the money markets remained stable with the average interbank rate remaining relatively unchanged at 8.8% recorded last week. The average interbank volumes traded increased by 11.4% to Kshs 13.4 bn from Kshs 12.0 bn recorded the previous week. The chart below shows the interbank rates in the market over the years:
Kenya Eurobonds:
During the week, the yields on the Eurobonds were on a downward trajectory with the yield on the 13-year Eurobond issued in 2021, decreasing the most by 63.9 bps to 7.9% from 8.6% recorded the previous week. The table below shows the summary performance of the Kenyan Eurobonds as of 6th August 2026:
|
Cytonn Report: Kenya Eurobonds Performance |
||||||
|
|
2018 |
2019 |
2021 |
2024 |
||
|
Tenor |
10-year issue |
30-year issue |
12-year issue |
13-year issue |
7-year issue |
|
|
Amount Issued (USD) |
1.0 bn |
1.0 bn |
1.0 bn |
1.5 bn |
1.5 bn |
|
|
Years to Maturity |
2.5 |
22.5 |
8.8 |
5.5 |
10.5 |
|
|
Yields at Issue |
7.3% |
8.3% |
6.2% |
10.4% |
9.9% |
|
|
02-Jan-26 |
6.1% |
8.8% |
7.2% |
7.8% |
7.1% |
|
|
30-Jul-26 |
7.0% |
9.1% |
8.0% |
8.6% |
7.8% |
|
|
31-Jul-26 |
7.0% |
9.0% |
8.0% |
8.5% |
7.7% |
|
|
03-Aug-26 |
6.8% |
8.8% |
7.7% |
8.2% |
7.4% |
|
|
04-Aug-26 |
6.7% |
8.7% |
7.5% |
7.9% |
7.3% |
|
|
05-Aug-26 |
6.8% |
8.7% |
7.5% |
7.9% |
7.3% |
|
|
06-Aug-26 |
6.7% |
8.8% |
7.5% |
7.9% |
7.3% |
|
|
Weekly Change |
(0.3%) |
(0.3%) |
(0.5%) |
(0.6%) |
(0.4%) |
|
|
MTD Change |
(0.2%) |
(0.3%) |
(0.5%) |
(0.6%) |
(0.4%) |
|
|
YTD Change |
0.7% |
(0.1%) |
0.4% |
0.1% |
0.2% |
|
Source: Central Bank of Kenya (CBK) and National Treasury
Kenya Shilling:
During the week, the Kenya Shilling appreciated marginally against the US Dollar by 0.8 bps to Kshs 129.39 from Kshs 129.4 recorded the previous week. On a year-to-date basis, the shilling has depreciated by 26.3 bps against the dollar, as compared to the 22.9 bps appreciation recorded in 2025.
We expect the shilling to be supported by:
-
Diaspora remittances standing at a cumulative USD 4,960.4 mn in the twelve months to June 2026, slightly lower than the USD 5,084.1 mn recorded over the same period in 2025. These have continued to cushion the shilling against further depreciation. In the June 2026 diaspora remittances figures, North America remained the largest source of remittances to Kenya accounting for 50.8% in the period,
-
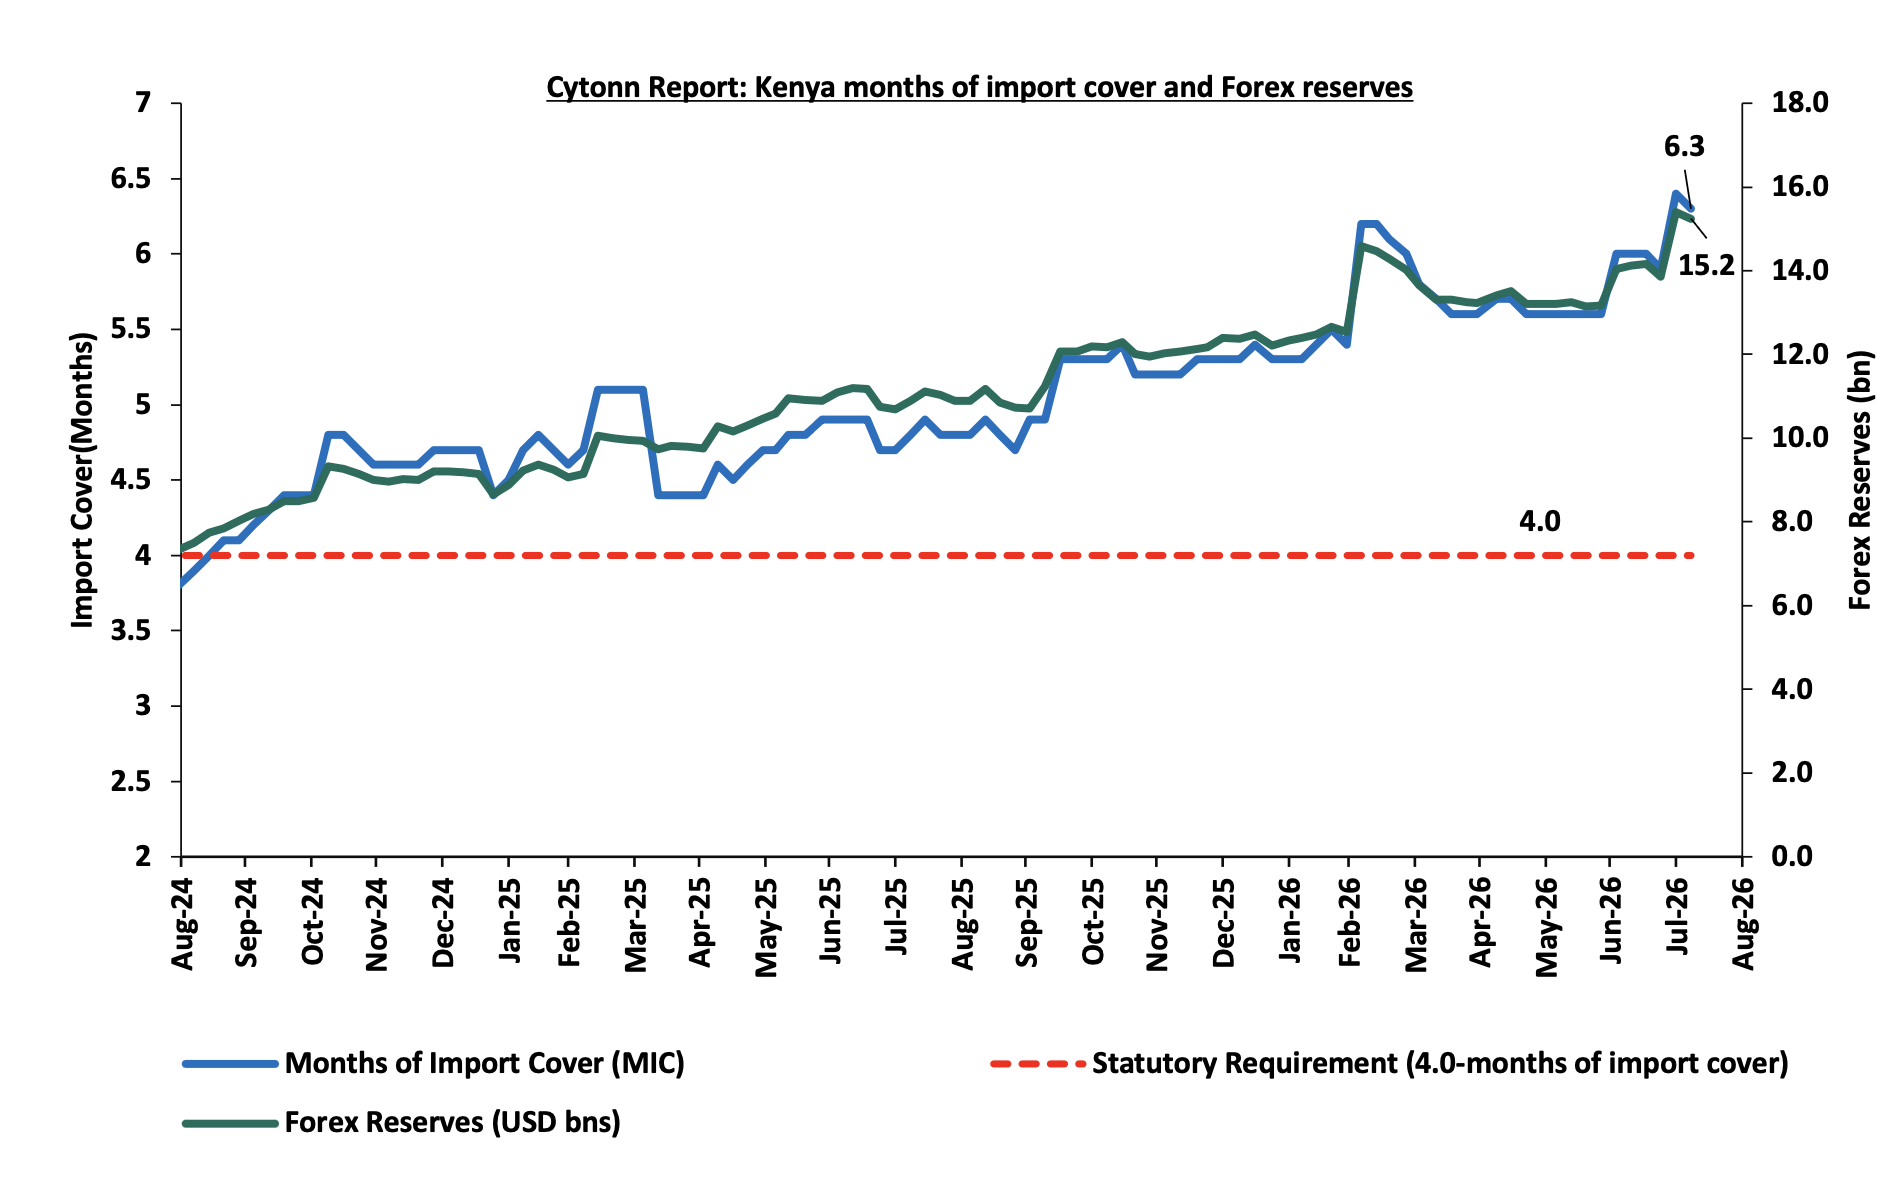
Improved forex reserves currently at USD 15.2 bn (equivalent to 6.3-months of import cover), which is above the statutory requirement of maintaining at least 4.0-months of import cover and above the EAC region’s convergence criteria of 4.5-months of import cover.
The shilling is however expected to remain under pressure in 2026 as a result of:
-
An ever-present current account deficit which is estimated at 2.6% of GDP in the 12 months to April 2026 compared to 1.7 percent of GDP in a similar period in 2025 and,
-
The need for government debt servicing, continues to put pressure on forex reserves given that 54.8% of Kenya’s external debt is US Dollar-denominated as of June 2026.
-
Rising geopolitical tensions in the Middle East, which could exert pressure on the shilling through higher global oil prices and increased uncertainty in international markets. Given that Kenya is a net importer of petroleum products, any sustained increase in oil prices would widen the import bill, increase demand for US Dollars, and consequently put depreciation pressure on the shilling
Kenya’s forex reserves decreased by 1.0% during the week to USD 15.2bn from USD 15.4 bn recorded the previous week, equivalent to 6.3 months of import cover, and above the statutory requirement of maintaining at least 4.0-months of import cover.
The chart below summarizes the evolution of Kenya's months of import cover over the years:
Weekly Highlights
-
Stanbic Bank’s July 2026 Purchasing Manager’s Index (PMI)
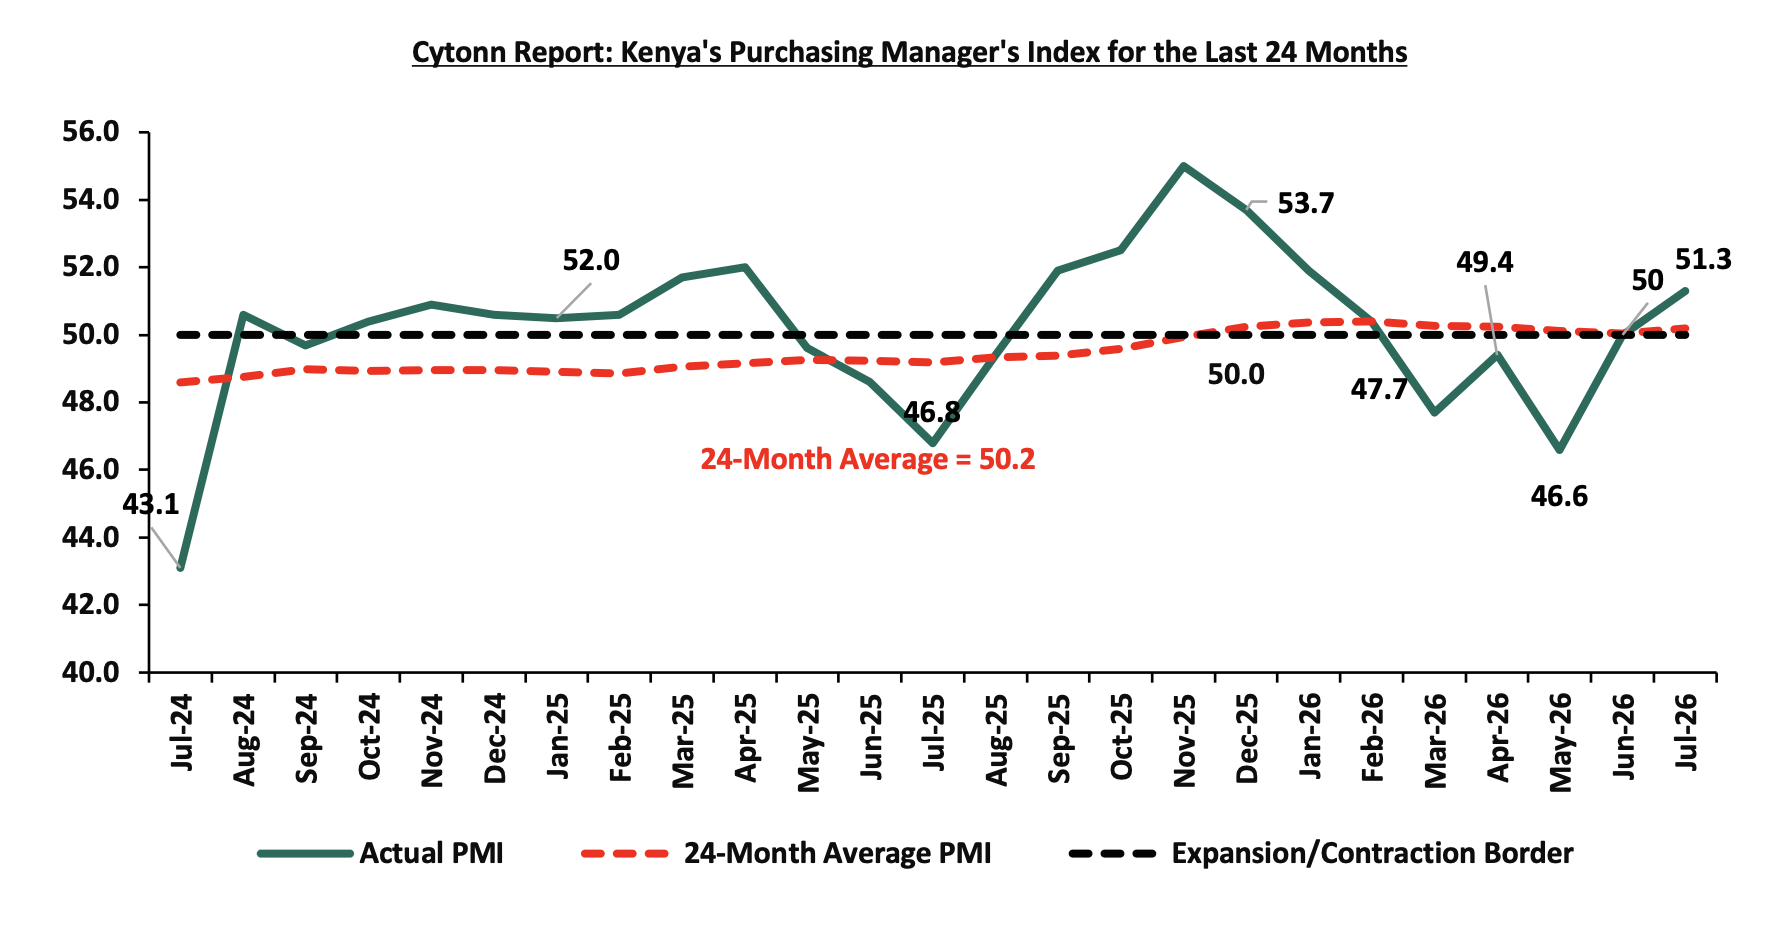
Stanbic Bank released its monthly Purchasing Managers' Index (PMI), indicating that Kenya's Purchasing Managers' Index (PMI) improved by 1.3 points to 51.3 in July 2026, from 50.0 in June 2026, marking the second consecutive month of improving business conditions after private sector activity contracted between March and May 2026. The latest reading was also higher than the 46.8 recorded in July 2025, reflecting a gradual recovery in private sector activity. The improvement was primarily supported by stronger new work inflows, which expanded for the second consecutive month and at the fastest pace since January, as businesses attracted customers through referrals, marketing efforts, and new products and services. However, this improvement in demand did not fully translate into higher output, which contracted for the fifth consecutive month, albeit at the slowest pace in the sequence, reflecting continued liquidity constraints, supply chain disruptions, and elevated cost pressures. Although inflationary pressures continued to weigh on business margins, the sustained expansion in demand and production signals a gradual strengthening of private sector activity at the start of the third quarter. Key to note, a PMI reading of above 50.0 indicates an improvement in business conditions, while readings below 50.0 indicate a deterioration. The chart below shows Kenya's Purchasing Managers' Index for the last 24 months:
Going forward, the July PMI suggests that Kenya's private sector is positioned to sustain its gradual recovery, supported by improving customer demand and growing business confidence. However, the pace of expansion is likely to remain modest as elevated input costs, particularly those associated with fuel, taxation, and raw materials, continue to weigh on business margins and pricing decisions. While the continued increase in new orders and business activity provides a stronger foundation for growth than in previous months, sustained expansion will depend on further easing in cost pressures and the ability of firms to convert the recent improvement in demand into longer term investment and permanent job creation. Should these conditions improve, private sector activity is likely to strengthen further over the coming months.
Rates in the fixed income market have been on an upward trend, reversing the sharp declines seen through the CBK's easing cycle. The shift has been driven by the CBK's decision to pause its rate-cutting cycle, alongside a resurgence in inflation. The government is 144.8% ahead of its prorated net domestic borrowing target of Kshs 113.2 bn, having a net borrowing position of Kshs 163.9 bn (inclusive of T-bills). We expect investors to maintain a preference for short to medium-term papers as they monitor the pace of government issuance and the path of inflation before committing further out on the curve, with the yield curve likely to remain under upward pressure rather than stabilize, at least until the inflation trajectory becomes clearer.
Market Performance:
During the week, the equities market showed a mixed performance, with NSE 20 gaining by 0.4%, while NASI, NSE 10 and NSE 25 lost by 1.2%, 0.8% and 0.5% respectively taking the YTD performance to gains of 30.9%, 28.0%, 27.8% and 25.5% respectively for NSE 20, NSE 10, NSE 25 and NASI respectively. The week-on-week equities market performance was mainly driven by gains recorded by large cap stocks such as Co-op Bank, NCBA Bank and EABL of 2.7%, 2.2% and 1.9% respectively. However, the performance was weighed down by losses recorded by large cap stocks such as Safaricom, BAT and Stanbic Bank of 3.8%,3.2% and 2.6% respectively;
During the week, the banking sector index decreased by 0.1% to 269.0 from the 269.4 recorded the previous week. This is attributable to losses recorded by large cap stocks such as Stanbic, Equity Bank and KCB of 2.6%, 1.7% and 1.5% respectively. However, the performance was supported by gains recorded by large cap stocks such as Co-op Bank, NCBA and DTB of 2.7%, 2.2% and 1.1% respectively;
During the week, equities turnover increased by 15.6% to USD 32.1 mn from USD 27.7 mn recorded the previous week, taking the YTD total turnover to USD 2,640.8 mn. Foreign investors remained net sellers for the fourth consecutive week with a net selling position of USD 3.5 mn, from a net selling position of USD 18.5 mn recorded the previous week, taking the YTD foreign net selling position to USD 107.7 mn, compared to a net selling position of USD 92.9 mn recorded in 2025.
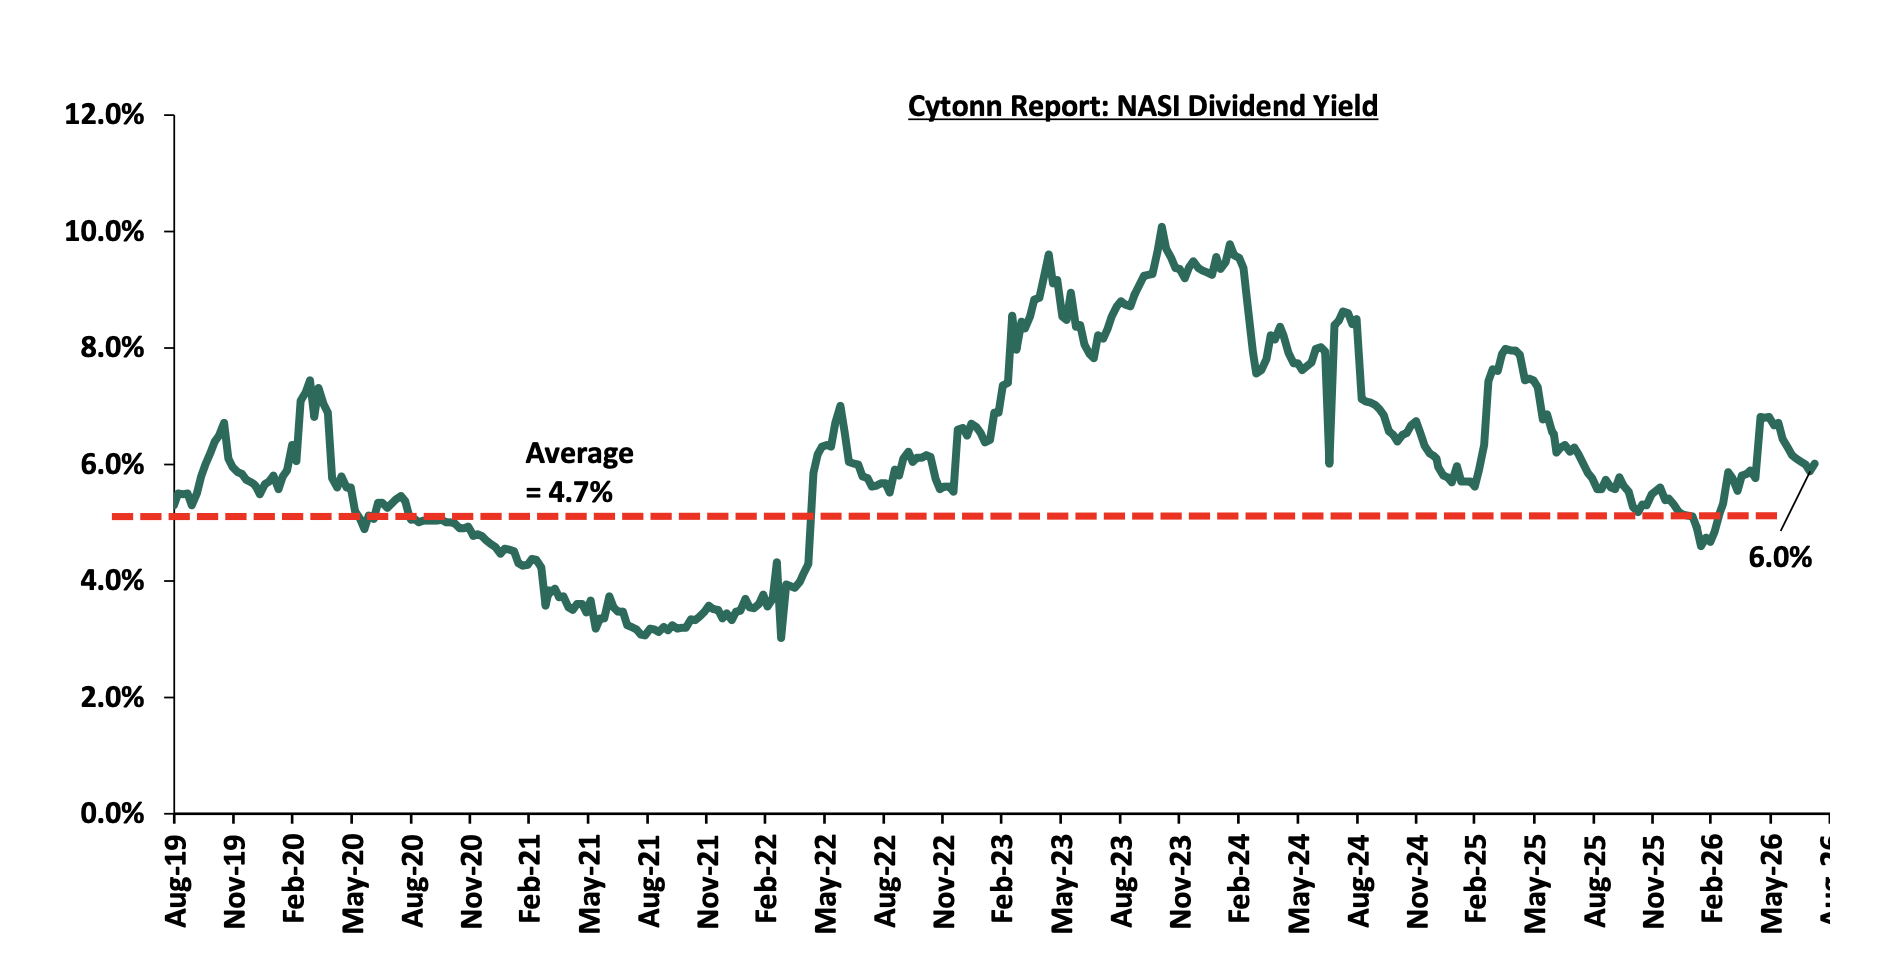
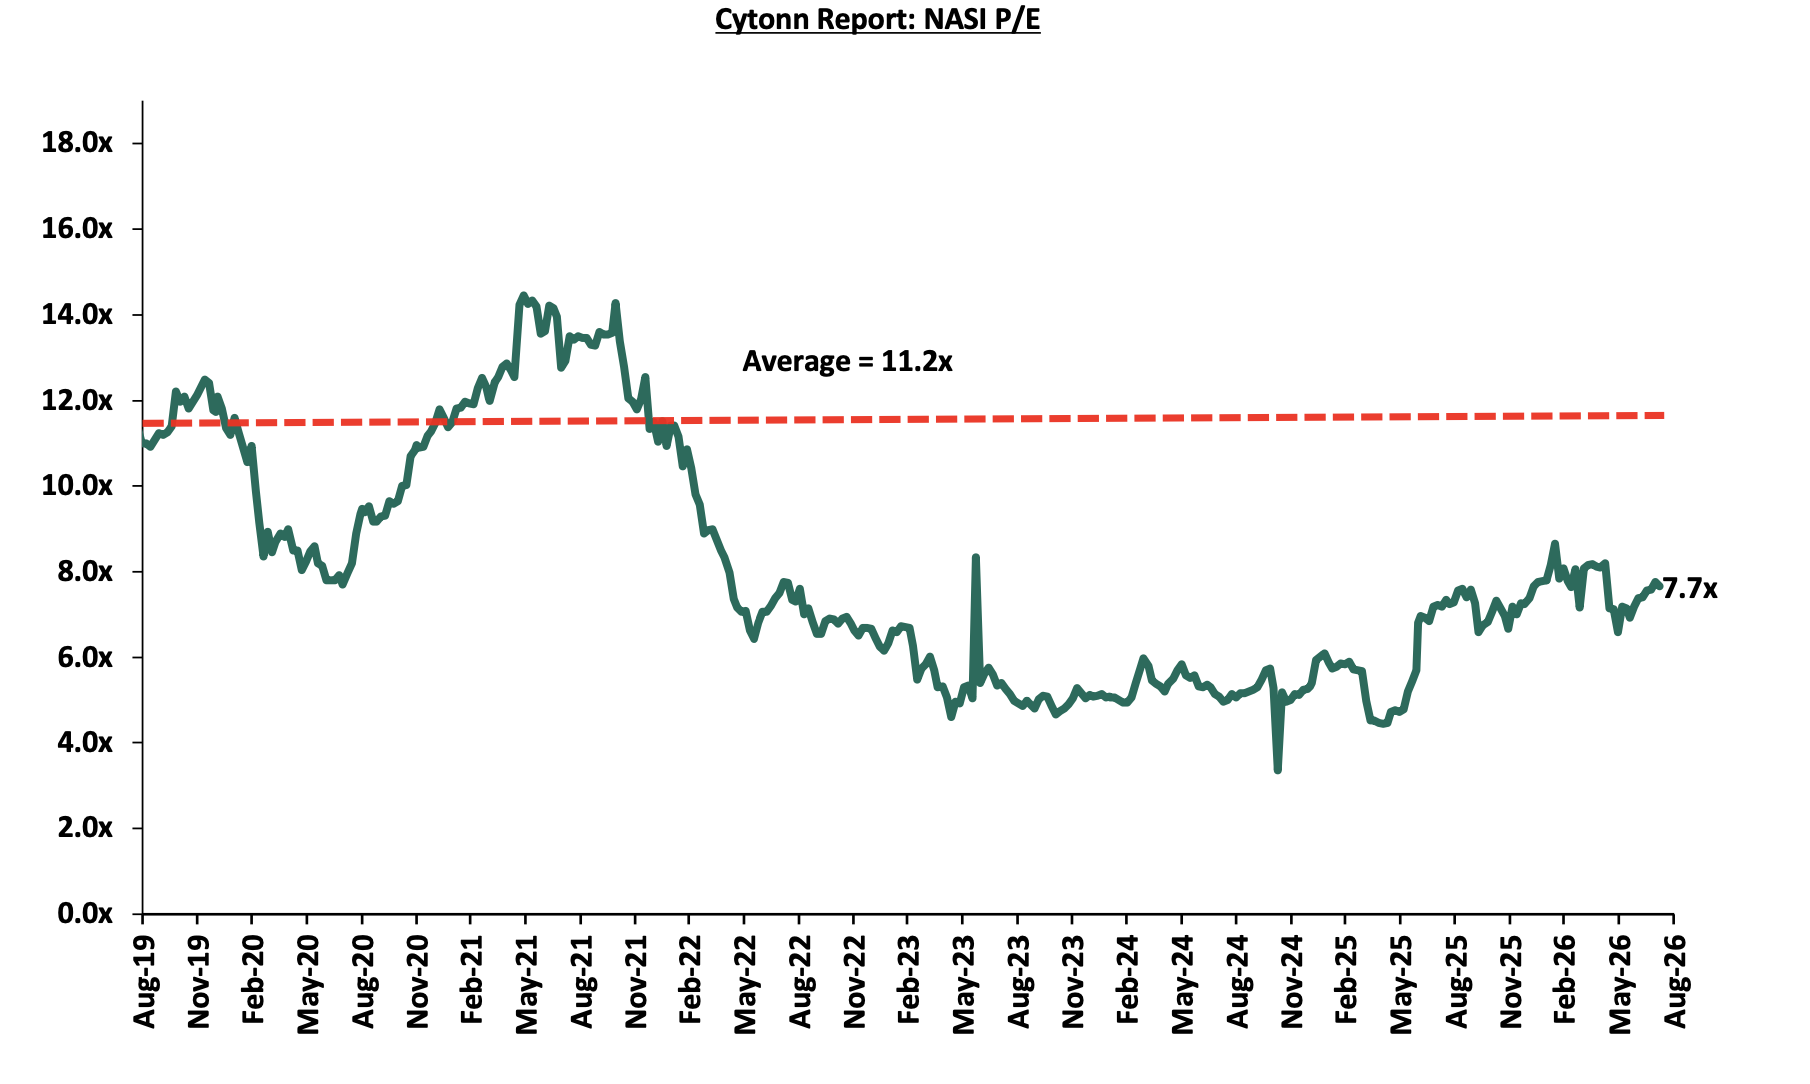
The market is currently trading at a price to earnings ratio (P/E) of 7.7x, 31.6% below the historical average of 11.2x, and a dividend yield of 6.0%, 1.3% points above the historical average of 4.7%. Key to note, NASI’s PEG ratio currently stands at 1.0x, an indication that the market is fairly valued relative to its future growth. A PEG ratio greater than 1.0x indicates the market may be overvalued while a PEG ratio less than 1.0x indicates that the market is undervalued.
The charts below indicate the historical P/E and dividend yields of the market:
Universe of Coverage:
|
Cytonn Report: Equities Universe of Coverage |
|||||||||||
|
Company |
Price as at 31/07/2026 |
Price as at 7/08/2026 |
w/w change |
m/m change |
YTD Change |
Year Open 2026 |
Target Price* |
Dividend Yield |
Upside/ Downside** |
P/TBv Multiple |
Recommendation |
|
NCBA |
90.0 |
92.0 |
2.2% |
2.8% |
8.2% |
85.0 |
108.9 |
7.7% |
26.1% |
1.3x |
Buy |
|
ABSA Bank |
33.3 |
33.4 |
0.3% |
4.2% |
34.4% |
24.9 |
36.8 |
6.1% |
16.4% |
1.8x |
Accumulate |
|
Stanbic Holdings |
291.5 |
284.0 |
(2.6%) |
1.3% |
43.6% |
197.8 |
300.3 |
7.9% |
13.6% |
1.6x |
Accumulate |
|
Standard Chartered Bank |
337.8 |
339.0 |
0.4% |
3.4% |
13.1% |
299.8 |
345.8 |
9.1% |
11.2% |
2.1x |
Accumulate |
|
Diamond Trust Bank |
152.5 |
154.25 |
1.1% |
6.4% |
34.4% |
114.8 |
161.4 |
5.8% |
10.5% |
0.4x |
Accumulate |
|
Co-op Bank |
34.9 |
35.8 |
2.7% |
4.4% |
49.8% |
23.9 |
36.9 |
7.0% |
10.1% |
1.3x |
Accumulate |
|
Equity Group |
86.8 |
85.3 |
(1.7%) |
6.6% |
27.2% |
67.0 |
87.5 |
6.7% |
9.4% |
1.1x |
Hold |
|
CIC Group |
4.7 |
4.7 |
0.0% |
4.4% |
4.4% |
4.5 |
5.0 |
2.7% |
7.4% |
1.2x |
Hold |
|
KCB Group |
86.0 |
84.8 |
(1.5%) |
7.6% |
28.9% |
65.8 |
83.9 |
8.3% |
7.3% |
0.9x |
Hold |
|
I&M Group |
67.8 |
68.3 |
0.7% |
(1.8%) |
59.5% |
42.8 |
67.9 |
5.5% |
5.0% |
1.1x |
Lighten |
|
Jubilee Holdings |
376.8 |
405.5 |
7.6% |
12.4% |
25.7% |
322.5 |
407.5 |
3.7% |
4.2% |
0.6x |
Lighten |
|
Family Bank |
31.5 |
31.3 |
(0.6%) |
29.1% |
73.6% |
18.0 |
31.3 |
3.8% |
3.8% |
1.6x |
Lighten |
|
Britam |
17.4 |
18.5 |
6.0% |
47.0% |
103.6% |
9.1 |
18.5 |
0.0% |
0.0% |
1.4x |
Sell |
|
*Target Price as per Cytonn Analyst estimates **Upside/ (Downside) is adjusted for Dividend Yield ***Dividend Yield is calculated using FY’2025 Dividends |
|||||||||||
Weekly Highlights
-
NCBA Bank H1’2026 Financial Performance
During the week, NCBA Bank released their H1’2026 financial results, recording a 12.2% increase in profit after tax to Kshs 12.4 bn in H1’2026, from Kshs 11.0 bn in H1’2025;
|
Balance Sheet Items |
H1'2025 |
H1'2026 |
y/y change |
|
Net Loans and Advances |
288.1 |
345.9 |
20.1% |
|
Government Securities |
180.1 |
220.6 |
22.5% |
|
Total Assets |
663.0 |
739.4 |
11.5% |
|
Customer Deposits |
497.0 |
551.4 |
11.0% |
|
Deposits per Branch |
4.3 |
4.5 |
4.6% |
|
Total Liabilities |
544.5 |
607.9 |
11.6% |
|
Shareholders’ Funds |
118.5 |
131.5 |
11.0% |
|
Key Ratios |
H1'2025 |
H1'2026 |
% points change |
|
Loan to Deposit Ratio |
58.0% |
62.7% |
4.8% |
|
Government Securities to Deposit ratio |
36.2% |
40.0% |
3.8% |
|
Return on average equity |
21.0% |
19.8% |
(1.2%) |
|
Return on average assets |
3.4% |
3.5% |
0.1% |
|
Dividend Payout Ratio |
37.3% |
49.9% |
12.6% |
|
Dividend Yield |
5.4% |
6.5% |
1.0% |
|
Income Statement |
H1'2025 |
H1'2026 |
y/y change |
|
Net Interest Income |
20.8 |
25.1 |
20.4% |
|
Net non-Interest Income |
14.5 |
15.6 |
7.6% |
|
Total Operating income |
35.3 |
40.7 |
15.1% |
|
Loan Loss provision |
3.2 |
5.2 |
60.3% |
|
Total Operating expenses |
21.8 |
24.7 |
13.3% |
|
Profit before tax |
13.6 |
15.5 |
14.3% |
|
Profit after tax |
11.0 |
12.4 |
12.2% |
|
Core EPS |
6.7 |
7.5 |
12.2% |
|
Dividend Per Share |
2.50 |
3.75 |
50.0% |
|
Dividend payout ratio |
37.3% |
49.9% |
12.6% |
|
Dividend Yield (Annualized) |
5.4% |
6.5% |
1.04% |
|
Income Statement Ratios |
H1'2025 |
H1'2026 |
% points change |
|
Yield from interest-earning assets |
12.4% |
11.6% |
(0.8%) |
|
Cost of funding |
6.1% |
4.2% |
(2.0%) |
|
Net Interest Spread |
6.3% |
7.4% |
1.2% |
|
Net Interest Margin |
6.7% |
7.9% |
1.2% |
|
Cost of Risk |
9.1% |
12.7% |
3.6% |
|
Net Interest Income as % of operating income |
59.0% |
61.7% |
2.7% |
|
Non-Funded Income as a % of operating income |
41.0% |
38.3% |
(2.7%) |
|
Cost to Income Ratio |
61.6% |
60.7% |
(1.0%) |
|
Cost to Income Ratio without LLP |
52.5% |
47.9% |
(4.6%) |
|
Capital Adequacy Ratios |
H1'2025 |
H1'2026 |
% points change |
|
Core Capital/Total Liabilities |
21.7% |
20.7% |
(1.0%) |
|
Minimum Statutory ratio |
8.0% |
8.0% |
|
|
Excess |
13.7% |
12.7% |
(1.0%) |
|
Core Capital/Total Risk Weighted Assets |
22.3% |
21.6% |
(0.7%) |
|
Minimum Statutory ratio |
10.5% |
10.5% |
|
|
Excess |
11.8% |
11.1% |
(0.7%) |
|
Total Capital/Total Risk Weighted Assets |
22.4% |
21.7% |
(0.7%) |
|
Minimum Statutory ratio |
14.5% |
14.5% |
|
|
Excess |
7.9% |
7.2% |
(0.7%) |
|
Liquidity Ratio |
57.1% |
59.3% |
2.2% |
|
Minimum Statutory ratio |
20.0% |
20.0% |
|
|
Excess |
37.1% |
39.3% |
2.2% |
Key Take-Outs:
-
Increased earnings – Core earnings per share increased by 12.2% to Kshs 7.5, from Kshs 6.7 in H1’2025, mainly driven by the 15.1% increase in total operating income to Kshs 40.7 bn, from Kshs 35.3 bn in H1’2025, which outpaced the 13.3% increase in total operating expenses to Kshs 24.7 bn, from Kshs 21.8 bn in H1’2025
-
Improved asset quality – The bank’s Asset Quality improved, with Gross NPL ratio reducing by 1.4% points to 10.8% in H1’2026 from 12.2% in H1’2025, attributable to the the 5.7% increase in gross non-performing loans to Kshs 40.3 bn, from Kshs 38.1 bn in H1’2025, which was outpaced by the 19.1% increase in gross loans to Kshs 373.0 bn, from Kshs 313.1 bn recorded in H1’2025
-
Expanded Balance sheet- The balance sheet recorded an expansion as total assets increased by 11.5% to Kshs 739.4 bn, from Kshs 663.0 bn in H1’2025, mainly driven by a 20.1% loan book expansion to Kshs 345.9 bn from Kshs 288.1 bn in H1’2025, supported by 22.5% increase in investment in government securities to Kshs 220.6 bn, from Kshs 180.1 bn in H1’2025.
-
Dividend declaration - The Board of Directors recommended an interim dividend of Kshs 3.75 per share translating to an annualized dividend yield of 6.5% and dividend payout ratio of 49.9% in H1’2026 from an annualized dividend yield of 5.4% and a dividend payout ratio of 37.3% in H1’2025
For a more detailed analysis, please see our NCBA Bank H1’2026 Earnings Note.
-
Stanbic Bank H1’2026 Financial Performance
During the week, Stanbic Bank released their H1’2026 financial results, recording a 1.3% increase in profit after tax to Kshs 6.5 bn in H1’2026, from Kshs 6.4 bn in H1’2025;
|
Balance Sheet |
H1'2025 (Kshs bn) |
H1'2026 (Kshs bn) |
y/y change |
|
Net Loans and Advances to Customers |
233.0 |
290.6 |
24.7% |
|
Kenya Government Securities |
53.3 |
83.6 |
57.0% |
|
Total Assets |
464.8 |
592.4 |
27.5% |
|
Customer Deposits |
346.9 |
426.7 |
23.0% |
|
Deposits Per Branch |
11.6 |
14.2 |
23.0% |
|
Total Liabilities |
400.5 |
523.3 |
30.7% |
|
Shareholders' Funds |
64.3 |
69.1 |
7.4% |
|
Balance sheet Ratios |
H1'2025 |
H1'2026 |
% point change |
|
Loan to Deposit ratio |
67.2% |
68.1% |
0.9% |
|
Government securities to deposits ratio |
15.4% |
19.6% |
4.2% |
|
Return on average equity |
19.3% |
20.7% |
1.4% |
|
Return on average assets |
2.7% |
2.6% |
(0.1%) |
|
Income Statement |
H1'2025 (Kshs bn) |
H1'2026 (Kshs bn) |
y/y change |
|
Net interest Income |
14.0 |
14.8 |
5.5% |
|
Non-interest income |
5.1 |
4.6 |
(9.0%) |
|
Total Operating income |
19.1 |
19.4 |
1.6% |
|
Loan loss provision |
(1.6) |
(0.9) |
(45.6%) |
|
Total Operating expenses |
(10.7) |
(10.3) |
(3.5%) |
|
Profit before tax |
8.4 |
9.1 |
8.2% |
|
Profit after tax |
6.4 |
6.5 |
1.3% |
|
Core EPS |
16.2 |
16.4 |
1.3% |
|
Dividend Per Share |
3.8 |
3.8 |
0.5% |
|
Dividend Yield (Annualized) |
12.4% |
7.9% |
(4.5%) |
|
Payout Ratio |
59.4% |
58.9% |
(0.5%) |
|
Income Statement Ratios |
H1'2025 |
H1'2026 |
y/y change |
|
Yield from interest-earning assets |
12.2% |
11.1% |
(1.1%) |
|
Cost of funding |
5.5% |
2.0% |
(3.5%) |
|
Net Interest Margin |
6.3% |
6.2% |
(0.2%) |
|
Net Interest Income as % of operating income |
73.4% |
76.2% |
2.8% |
|
Non-Funded Income as a % of operating income |
26.6% |
23.8% |
(2.8%) |
|
Cost to Income Ratio |
55.9% |
53.1% |
(2.8%) |
|
CIR without LLP |
47.5% |
48.5% |
1.1% |
|
Cost to Assets |
1.9% |
1.6% |
(0.4%) |
|
Capital Adequacy Ratios |
H1'2025 |
H1'2026 |
% points change |
|
Core Capital/Total Liabilities |
17.0% |
15.0% |
(2.0%) |
|
Minimum Statutory ratio |
8.0% |
8.0% |
0.0% |
|
Excess |
9.0% |
7.0% |
(2.0%) |
|
Core Capital/Total Risk Weighted Assets |
15.2% |
13.6% |
(1.6%) |
|
Minimum Statutory ratio |
10.5% |
10.5% |
0.0% |
|
Excess |
4.7% |
3.1% |
(1.6%) |
|
Total Capital/Total Risk Weighted Assets |
18.9% |
16.8% |
(2.1%) |
|
Minimum Statutory ratio |
14.5% |
14.5% |
0.0% |
|
Excess |
4.4% |
2.3% |
(2.1%) |
|
Liquidity Ratio |
54.4% |
57.0% |
2.6% |
|
Minimum Statutory ratio |
20.0% |
20.0% |
0.0% |
|
Excess |
34.4% |
37.0% |
2.6% |
Key Take-Outs:
-
Increased earnings - Core earnings per share increased by 1.3% to Kshs 16.4 from Kshs 16.2 recorded in in H1’2025, mainly driven by 1.6% decrease in total operating expense to Kshs 10.3 bn, from Kshs 10.7 bn in H1’2025, and the 1.6% increase in total operating income to Kshs 19.4 bn, from Kshs 19.1 bn in H1’2025.
-
Improved asset quality – The bank’s Asset Quality improved, with Gross NPL ratio decreasing by 2.1% points to 7.3% in H1’2026, from 9.5% in H1’2025, attributable to an 5.1% decrease in Gross non-performing loans to Kshs 22.7 bn, from Kshs 23.9 bn in H1’2025, relative to the 22.7% increase in gross loans to Kshs 310.3 bn, from Kshs 252.8 bn recorded in H1’2025,
-
Expanded Balanced sheet - The balance sheet recorded an expansion as total assets increased by 27.5% to Kshs 592.4 bn, from Kshs 464.8 bn in H1’2025, mainly driven by a 24.7% increase in net loans and advances to customers to Kshs 290.6 bn, from 233.0 bn in H1’2025. Government securities increased by 57.0% to Kshs 83.6 bn, from Kshs 53.3 bn in H1’2025.
-
Dividend declaration - The Board of Directors recommended an interim dividend of Kshs 3.82 per share translating to an annualized dividend yield of 7.9% and dividend payout ratio of 58.9% in H1’2026 from an annualized dividend yield of 12.4% and a dividend payout ratio of 59.4% in H1’2025
For a more detailed analysis, please see our Stanbic Bank H1’2026 Earnings Note.
Summary Performance
The table below shows the performance of listed banks that have released their H1’2026 results using several metrics:
|
Cytonn Report: Listed Banks Performance in H1’2026 |
||||||||||||||
|
Bank |
Core EPS Growth |
Interest Income Growth |
Interest Expense Growth |
Net Interest Income Growth |
Net Interest Margin |
Non-Funded Income Growth |
NFI to Total Operating Income |
Growth in Total Fees & Commissions |
Deposit Growth |
Growth in Government Securities |
Loan to Deposit Ratio |
Loan Growth |
Return on Average Equity |
|
|
NCBA Group |
12.2% |
7.6% |
(12.8%) |
20.4% |
7.9% |
7.6% |
38.3% |
9.1% |
(11.3%) |
12.3% |
62.7% |
2.0% |
19.8% |
|
|
Stanbic Group |
1.3% |
5.9% |
6.6% |
5.5% |
6.2% |
(9.0%) |
23.8% |
1.9% |
9.4% |
14.5% |
68.1% |
24.7% |
20.7% |
|
|
H1'2026 Mkt Weighted Average* |
1.3% |
1.2% |
(0.8%) |
2.4% |
1.2% |
0.1% |
5.4% |
1.0% |
(0.4%) |
2.2% |
11.0% |
2.0% |
3.4% |
|
|
H1'2025 Mkt Weighted Average* |
8.4% |
(2.0%) |
(20.7%) |
10.4% |
8.0% |
(5.8%) |
33.9% |
4.2% |
1.7% |
28.3% |
67.2% |
1.5% |
22.3% |
|
|
*Market cap weighted as at 7/08/2026 |
||||||||||||||
|
**Market cap weighted as at 16/09/2025 |
||||||||||||||
Key take-outs from the table include:
-
The listed banks that have released results recorded a 1.3% weighted average growth in core Earnings per Share (EPS) in H1’2026, compared to the weighted average growth of 8.4% in H1’2025.
-
Interest income recorded a weighted average increase of 1.2% in H1’2026, compared to the 2.0% decline recorded in H1’2025. Interest expenses recorded a market-weighted average decline of 0.8% in H1’2026, compared to the 20.7% decline in H1’2025.
-
The Banks’ net interest income recorded a weighted average growth of 2.4% in H1’2026, from the 10.4% growth recorded over a similar period in 2025, while non-funded income increased by 0.1% in H1’2026 compared to the 5.8% decline recorded in H1’2025, and,
-
The Banks recorded a weighted average deposit growth of 0.4% in H1’2026, compared to the market-weighted average deposit growth of 1.7% in H1’2025.
Asset Quality
The table below shows the asset quality of listed banks that have released their Q1’2026 results using NPL ratio and NPL coverage:
|
Bank |
H1'2026 NPL Ratio* |
H1'2025 NPL Ratio** |
% point change in NPL Ratio |
H1'2026 NPL Coverage* |
H1'2025 NPL Coverage** |
% point change in NPL Coverage |
|
NCBA Group |
10.8% |
12.2% |
(1.4%) |
67.4% |
65.5% |
1.8% |
|
Stanbic Holdings |
7.3% |
9.5% |
(2.1%) |
86.6% |
82.7% |
3.9% |
|
Mkt Weighted Average* |
1.6% |
13.80% |
(12.2%) |
12.8% |
67.8% |
(55.0%) |
|
*Market Cap weighted as at 7/08/2026 |
||||||
Key take-outs from the table include;
-
Asset quality for the listed banks that have released results improved during H1’2026, with the market-weighted average NPL ratio decreasing by 12.2% points to 1.6%, from 13.8% in H1’2025. The improvement was supported by reduced NPL ratios from NCBA and Stanbic Bank.
-
Market-weighted average NPL coverage decreased by 55.0% points to 12.8% in H1’2026 from 67.8% recorded in H1’2025. The decrease was however supported by increases in coverage by individual banks such as Stanbic Bank by 3.9% points and NCBA by 1.8% points.
-
East African Breweries Plc (EABL) FY’2026 Financial Performance
During the week, East African Breweries Plc (EABL) released their FY’ 2026 financial results for the year ending 30th June 2026, , recording a 49.4% increase in the Profits After Tax (PAT) to Kshs 18.2 bn in FY’2026, from Kshs 12.2 bn in FY’2025. The increase was mainly attributable to the 13.3% increase in net revenue to Kshs 146.0 bn from Kshs 128.8 bn in FY’2025, coupled with 24.7% decrease in finance costs to Kshs 4.4 bn from Kshs 5.9 bn in FY’2025 and a 1.2% marginal decline in operating costs to Kshs 28.9 bn from Kshs 29.2 bn in FY’2025. The growth in PAT was, however, weighed down by a 12.2% increase in cost of sales to Kshs 83.8 bn from Kshs 74.7 bn in FY’2025 and a 32.6% increase in the income tax expenses to Kshs 9.4 bn in FY’ 2026, from Kshs 7.1 bn in FY’ 2025. The tables below show the breakdown of the company’s financial performance:
|
Cytonn Report: East Africa Breweries Plc (EABL) Summarized Income Statement |
|||
|
Income Statement |
FY'2025 |
FY'2026 |
Y/Y Change |
|
Kshs (bn) |
Kshs (bn) |
||
|
Net revenue |
128.8 |
146.0 |
13.3% |
|
Cost of Sales |
(74.7) |
(83.8) |
12.2% |
|
Gross Profit |
54.1 |
62.2 |
14.9% |
|
Operating Costs |
(29.2) |
(28.9) |
(1.2%) |
|
Operating Profit |
24.9 |
33.3 |
33.9% |
|
Forex losses/Gains |
0.3 |
(1.2) |
(488.8%) |
|
Net Finance Costs |
(5.9) |
(4.4) |
(24.7%) |
|
Profit Before Income Tax |
19.3 |
27.7 |
43.2% |
|
Income Tax Expenses |
(7.1) |
(9.4) |
32.6% |
|
Profit After Tax |
12.2 |
18.2 |
49.4% |
|
Earnings Per Share |
12.0 |
19.0 |
58.6% |
|
Dividend Per Share |
8.0 |
12.7 |
58.8% |
|
Dividend Yield |
3.8% |
4.5% |
0.6% pts |
|
Dividend Payout Ratio |
51.9% |
55.1% |
3.2% pts |
Source: East African Breweries Plc (EABL) FY’2026 financial statements
|
Cytonn Report: East Africa Breweries Plc (EABL) Summarized Balanced Sheet |
|||
|
Balance Sheet |
FY'2025 |
FY'2026 |
Y/Y Change |
|
Kshs (bn) |
Kshs (bn) |
||
|
Current Assets |
48.7 |
54.8 |
12.6% |
|
Non-Current Assets |
82.4 |
79.9 |
(3.1%) |
|
Total Assets |
131.1 |
134.7 |
2.7% |
|
Short term borrowings |
5.4 |
6.5 |
19.9% |
|
Other Current Liabilities |
38.4 |
39.5 |
2.9% |
|
Total Current Liabilities |
43.8 |
46.0 |
5.0% |
|
Long term Borrowings |
36.9 |
29.5 |
(20.0%) |
|
Other Non-Current Liabilities |
8.1 |
8.6 |
5.5% |
|
Total Non-Current Liabilities |
45.0 |
38.1 |
(15.4%) |
|
Total Liabilities |
88.8 |
84.0 |
(5.4%) |
|
Total Equity |
42.3 |
50.6 |
19.7% |
Source: East African Breweries Plc (EABL) FY’2026 financial report
Key take outs from the financial performance include;
-
Net revenue increased by 13.3% to Kshs 146.0 bn in FY’ 2026, from Kshs 128.8 bn recorded in FY’ 2025, mainly attributable to the increase in volume sold, improved digital transformation such as business to consumer framework which has helped in boosting revenue levels by expanding their consumer base.
-
Operating costs decreased by 1.2% to Kshs 28.9 bn, from Kshs 29.2 bn attributable to continued cost-management initiatives and operational efficiencies, which helped offset inflationary pressures and other operating expenses during the period.
-
Cost of sales increased by 12.2% to Kshs 83.8 bn, from Kshs 74.7 bn in FY’ 2025, mainly attributable to increased cost of inputs occasioned by attributable factors such as rising raw material costs.
-
The Group’s balance sheet recorded an expansion, with the total assets increasing by 2.7% to Kshs 134.7 bn in FY’2026 from Kshs 131.1 bn recorded in FY’2025 mainly attributable to a 7.1% increase in current assets to Kshs 54.8 bn in FY’2026 from Kshs 48.7 bn in FY’ 2025. However, this was weighed down by a 3.1% decrease in Non-current assets to 79.9 bn from 82.4 bn in FY’2025.
-
However, total liabilities recorded a 5.4% decrease to Kshs 84.0 bn in FY’2026 from Kshs 88.8 bn in FY’2025, mainly driven by a 15.4% decrease in total non-current liabilities to Kshs 38.1 bn in FY’2026 from Kshs 45.0 bn in FY’2025.
-
The Group’s short-term borrowing increased by 19.9% to Kshs 6.5 bn in FY’2026 from Kshs 5.4 bn in FY’2025, while the long-term borrowings decreased by 20.0% to Kshs 29.5 bn, from the Kshs 36.9 bn in FY’ 2025 an indication of the group’s strategic shift in its debt financing.
-
Earnings per share increased by 58.6% to Kshs 19.0, from Kshs 12.0 in FY’ 2025, largely driven by a 49.4% increase in profit after tax to Kshs 18.2 bn, from Kshs 12.2 bn in FY’ 2025.
-
Additionally, the Board of Directors recommended a final dividend of Kshs 8.70 per share with a book closure of 19th October 2026 and a payment date on or about 31st October 2026, in addition to an interim dividend of Kshs 4.00 per share bringing the total dividend for FY’2026 to 12.7 per share. This translates to a dividend yield of 4.5%, compared to a dividend yield of 3.8% in FY’2025 and a dividend payout ratio of 55.1% in FY’2026 compared to 51.9% in FY’2025.
EABL’s outlook remains positive, supported by expected recovery in consumer demand, continued volume growth, portfolio innovation and productivity initiatives. The Group’s strong brands and regional footprint should support revenue growth, while ongoing cost discipline, improved working-capital management and lower debt are expected to sustain margins, cash generation and earnings growth. The proposed acquisition of Diageo’s stake by Asahi Group Holdings could further strengthen EABL’s strategic positioning and provide access to global expertise, although regulatory approvals remain a key milestone. However, consumer affordability pressures, inflation, excise tax changes, foreign-exchange movements and geopolitical disruptions remain key risks to performance. Overall, EABL’s strengthened balance sheet, resilient brand portfolio and focus on productivity provide a solid foundation for sustained growth and improved profitability
We maintain a “cautiously optimistic” short-term outlook supported primarily earnings-led attractive valuations, despite rising yields on short-term government papers, which increase competition for capital by drawing investors towards risk-free government securities, as well as heightened geopolitical risks such as Iran war that may weigh on investor sentiment, and, “neutral” in the long term as persistent foreign investor outflows continue to constrain market liquidity and limit broad-based market re-rating. With the market currently trading at a discount to its future growth (PEG Ratio at 1.0x), where performance will be driven by company-specific fundamentals rather than general market direction, we believe that investors should reposition towards value stocks exhibiting strong earnings growth, attractive dividend yields, solid balance sheets, sustainable competitive advantages and trading at compelling discounts to their intrinsic value. While foreign investor sell-offs are expected to continue exerting pressure in the near term, we believe this will create selective entry opportunities for long-term investors
-
Industry Report
-
Hass Consult Q2’2026 Land Index
During the week, Hass Consult, a Kenyan consulting and Real Estate development firm, released its Land Price Index Q2'2026 Report, highlighting the performance of the Real Estate land sector in the Nairobi Metropolitan Area (NMA). The following are the key take-outs from the report:
-
Land prices in Nairobi's suburbs rebounded, growing by 1.4% q/q in Q2'2026, 0.6% points higher than the 0.8% recorded in Q1'2026, while land prices in the satellite towns similarly grew by 1.4% q/q, up from 0.5% in the previous quarter. On an annual basis, the Nairobi Suburbs-18 Composite Index posted a 4.8% gain, while the Nairobi Satellite-14 Composite Index recorded a slightly softer 4.5% growth, with the two indices having grown 1.3-fold and 1.9-fold, respectively, since 2016. The rebound was largely driven by the recently published Nairobi City County Development Control Policy 2026, which addressed uncertainties around planning approvals that had previously kept developers on a wait-and-see approach, alongside sustained demand for detached and semi-detached housing in comparatively lower-priced suburbs.
-
In the Nairobi suburbs, Langata recorded the highest quarterly price gain at 4.1% to Kshs 94.7 mn per acre, followed by Karen at 3.2% to Kshs 79.5 mn, Runda at 2.9% to Kshs 105.6 mn and Nyari at 2.5% to Kshs 128.2 mn per acre, with demand increasingly tilting towards suburbs offering relatively lower land acquisition costs compared to higher-value suburbs such as Kilimani, Westlands and Upperhill, where average land values range between Kshs 445.9 mn and Kshs 568.7 mn per acre. On an annual basis, Karen posted the strongest gain at 10.0%, while Muthangari recorded the weakest performance both on a quarterly and annual basis, declining by (2.1%) and (4.9%), respectively.
-
In the satellite towns, Ruiru led with a quarterly appreciation of 4.1% to Kshs 42.2 mn per acre, followed by Thika at 3.8% to Kshs 32.4 mn, and Ruaka at 2.8% to Kshs 115.7 mn per acre, supported by Ruiru's position at the centre of large mixed-use developments such as Tatu City and Northlands, Thika's imminent elevation to city status, and Ruaka's proximity to the newly completed Nairobi Western Bypass and the UN Blue Zone. However, seven of the 14 satellite towns still recorded negative growth in the quarter, led by Ngong at (2.5%) and Limuru at (0.8%), pointing to an increasingly selective recovery concentrated in nodes with strong economic and infrastructure drivers rather than a broad-based rebound.
These findings are in line with our Cytonn H1'2026 Markets Review, which reported that the overall land sector in the Nairobi Metropolitan Area (NMA) recorded a price appreciation of 1.3% to Kshs 134.4 mn in H1'2026, from Kshs 132.1 mn in H1'2025, supported by, among other factors, government efforts to streamline land transactions through Ardhi Sasa, growing demand for land driven by positive demographics, and the continued rollout of infrastructure projects opening up satellite towns for investment.
-
Hass Consult Q2’2026 Property Index
During the week, Hass Consult, a Kenyan consulting and Real Estate development firm, published its House Price Index Q2'2026 Report, highlighting the performance of the Real Estate property sector in the Nairobi Metropolitan Area (NMA). The following are the key take-outs from the report;
-
Property prices in Nairobi's suburbs grew by 0.9% q/q in Q2'2026 to Kshs 33.1 mn, a moderation from the 1.1% q/q growth recorded in Q1'2026, with all 14 surveyed suburbs recording positive price growth. Growth was led by Ridgeways at 3.4% q/q to Kshs 85.2 mn, Karen at 3.2% q/q to Kshs 113.4 mn and Lavington at 3.1% q/q to Kshs 82.5 mn. On an annual basis, the Nairobi Suburbs-18 Composite Sales Index recorded a 2.9% appreciation, having grown 2.09-fold since July 2016;
-
In contrast, satellite town property prices declined by 0.6% q/q to Kshs 14.52 mn, albeit an improvement from the 0.9% q/q contraction recorded in Q1'2026, with eight of the 10 surveyed towns recording falling house prices and six of the nine satellite apartment markets also posting price declines. The decline was led by Ongata Rongai at (2.7%) q/q to Kshs 15.6 mn and Ngong at (2.5%) q/q to Kshs 19.4 mn. On an annual basis, the Nairobi Satellite-14 Composite Sales Index recorded a marginal 0.1% decline, having still grown 3.10-fold since July 2016, reflecting the segment's greater sensitivity to tighter household budgets amid inflation, which rose from 4.4% in March to a high of 6.7% in May before easing to 6.4% in June;
-
On the rental front, rents in Nairobi's suburbs grew by 1.4% q/q, led by Runda at 3.4% q/q and Ridgeways at 3.2% q/q, while satellite town rents grew by a comparatively slower 1.1% q/q, with apartments in Ongata Rongai, Athi River and Mlolongo posting the strongest gains at 3.5%, 3.2% and 3.0% q/q, respectively. On an annual basis, suburb and satellite rents grew by 6.2% and 6.6%, respectively, having grown 2.23-fold and 3.16-fold since July 2016; and,
-
Overall property yields in the suburbs held steady at 7.4%, while satellite town yields edged up to 5.4% from 5.3% in Q1'2026, with double-digit annual returns in select markets continuing to outperform government securities. According to Sakina Hassanali, HassConsult's Co-CEO and Creative Director, satellite towns continue to face greater price pressure than the suburbs, reflecting the sensitivity of their buyer base to rising household costs and tighter economic conditions, even as rental demand across both markets remains resilient.
These findings mirror the trends captured in our Cytonn H1'2026 Markets Review, where average total returns to apartment investors came in at 7.8% in H1'2026, a 0.4%-points decline from the 8.2% recorded in H1'2025, driven by a marginal 0.02%-points dip in average rental yields to 6.05%, with upper mid-end nodes such as Westlands, Upperhill and Kilimani continuing to record the strongest total returns, underscoring the resilience of well-located, higher-yielding nodes even as overall market growth moderates.
-
Residential Sector
-
Reportage Kenya Launches 346-Unit Enzo Residence in Riverside
During the week, Reportage Kenya, a Real Estate developer, launched Enzo Residence, a 346-unit apartment development in Riverside, Nairobi, with the mix skewed towards smaller units studios account for which account for 63.6% (220 units), followed by one-bedroom units at 22.8% (79 units) and two-bedroom units at 13.6% (47 units), marking the developer's third project in Kenya following DG West and DG JKIA, both of which remain under construction. The development is positioned within Nairobi's premium residential segment, with studio units priced from Kshs 264,488.4 per SQM, one-bedroom units from Kshs 242,840.7 per SQM and two-bedroom units from Kshs 219,316.1 per SQM, alongside amenities including a swimming pool, gym, spa, sauna, jacuzzi, business lounge and children's play area.
The development adds to activity in Nairobi's premium apartment market, where Riverside continues to attract residential investment due to its proximity to Westlands and other commercial centres. On a price per SQM basis, Enzo's studios command a 20.6% premium over the two-bedroom units, consistent with the broader market trend where smaller units typically carry higher per-unit-area pricing, reflecting the developer's tilt towards lower-ticket entry points for investors and first-time buyers. The combination of location, modern amenities and unit mix is aimed at buyers seeking both residential convenience and investment value, with comparable Riverside apartments providing a useful benchmark for assessing Enzo's pricing on a like-for-like per SQM basis.
We expect the launch of Enzo Residence to support continued expansion of Nairobi's premium residential market as developers respond to demand for well-located, amenity-rich apartments. However, pricing and absorption will remain key considerations, with Enzo's ability to attract buyers across its studio-heavy unit mix likely to determine the pace at which the 346 units are taken up.
-
Real Estate Investments Trusts
-
REITs Weekly Performance
On the Unquoted Securities Platform Acorn D-REIT and I-REIT traded at Kshs 29.7 and Kshs 24.4 per unit, respectively, as per the last updated data on 7th August 2026. The performance represented a 48.5% and 22.0% gain for the D-REIT and I-REIT, respectively, from the Kshs 20.0 inception price. The volumes traded for the D-REIT and I-REIT came in at 13.6 mn and 44.9 mn shares, respectively. Additionally, ILAM Fahari I-REIT traded at Kshs 13.8 per share as of 7th August 2026, representing a 31.0% loss from the Kshs 20.0 inception price. The volume traded to date came in at 1.2 mn shares for the I-REIT, REITs offer various benefits, such as tax exemptions, diversified portfolios, and stable long-term profits. However, the ongoing decline in the performance of Kenyan REITs and the restructuring of their business portfolios are hindering significant previous investments. Additional general challenges include:
-
Insufficient understanding of the investment instrument among investors leading to a slower uptake of REIT products,
-
Lengthy approval processes for REIT creation,
-
High minimum capital requirements of Kshs 100.0 mn for REIT trustees compared to Kshs 10.0 mn for pension funds Trustees, essentially limiting the licensed REIT Trustee to banks only
-
The rigidity of choice between either a D-REIT or and I-REIT forces managers to form two REITs, rather than having one Hybrid REIT that can allocate between development and income earning properties
-
Limiting the type of legal entity that can form a REIT to only a trust company, as opposed to allowing other entities such as partnerships, and companies,
-
We need to give time before REITS are required to list – they would be allowed to stay private for a few years before the requirement to list given that not all companies maybe comfortable with listing on day one, and,
-
Minimum subscription amounts or offer parcels set at Kshs 0.1 mn for D-REITs and Kshs 5.0 mn for restricted I-REITs. The significant capital requirements still make REITs relatively inaccessible to smaller retail investors compared to other investment vehicles like unit trusts or government bonds, all of which continue to limit the performance of Kenyan REITs.
We expect the performance of Kenya's Real Estate sector to remain resilient, supported by several factors, including: i) the rebound in land prices within Nairobi's suburbs, growing by 1.4% q/q in Q2'2026 per the Hass Consult Land Price Index Q2'2026 Report, ii) the 1.4% q/q rebound in land prices within Nairobi's satellite towns, per the same report, iii) the continued price growth in Nairobi's suburbs property market, up 0.9% q/q to Kshs 33.1 mn per the Hass Consult Property Index Q2'2026 Report, and iv) the launch of Enzo Residence, a 346-unit apartment development in Riverside, Nairobi, by Reportage Kenya. However, challenges such as weak investor appetite in listed REITs like ILAM Fahari I-REIT and high capital requirements will continue to constrain the sector's optimal performance.
-
Visa Acquires BioCatch to Strengthen AI-Powered Fraud Prevention
During the week, Visa Inc. announced that it had signed a definitive agreement to acquire BioCatch, a leading provider of behavioral intelligence and AI-driven fraud detection solutions, for USD 2.4 bn in cash. The acquisition is expected to strengthen Visa's cyber, fraud, risk and security capabilities by enabling financial institutions to detect and prevent account takeovers, scams, money mule activity and application fraud before payment initiation. BioCatch currently protects more than 760.0 mn users across 1.8 bn devices and serves over 350 financial institutions globally through its AI and machine learning-powered behavioral analytics platform. The acquisition reinforces Visa's strategy of expanding beyond payment processing into value-added fraud prevention and cybersecurity services. By integrating BioCatch's behavioral intelligence capabilities into its existing fraud management ecosystem, Visa is expected to enhance real-time risk detection, improve trust across digital payment channels and further strengthen its competitive position as financial institutions increasingly invest in AI-driven fraud prevention amid the rapid growth of digital payments
-
Mastercard Launches Asia Pacific's First Taste by Priceless Airport Dining Club
During the week, Mastercard Incorporated officially opened Asia Pacific's first Taste by Priceless dining club at Hong Kong International Airport (HKG), expanding its portfolio of premium travel and lifestyle benefits for eligible World Legend, World Elite and World Mastercard cardholders globally. Located in Terminal 1, the venue offers chef-curated dining experiences, signature beverages and exclusive culinary programming as part of The Mastercard Collection, allowing eligible cardholders to access premium airport dining regardless of where their cards were issued. The launch reinforces Mastercard's strategy of enhancing customer value beyond traditional payment services by investing in premium, experience-led benefits that strengthen cardholder engagement and issuer competitiveness. By expanding its global lifestyle ecosystem through exclusive travel and dining privileges, Mastercard continues to differentiate its premium card offerings while supporting financial institutions in attracting and retaining high-value customers in an increasingly competitive payments market.
-
Circle Announces Founding Validator Cohort and Major Institutional Integrations for Arc
During the week, Circle Internet Group announced the founding validator cohort for its Arc blockchain network ahead of its scheduled 16 September 2026 public main net launch. The founding validators include leading global financial institutions such as BlackRock, DTCC, Global Payments, ICE, Mastercard, MoneyGram, Standard Chartered and Visa, establishing a trusted institutional governance framework designed to support secure, compliant and scalable blockchain-based financial infrastructure. Circle also announced that more than 100 ecosystem and institutional builders are already developing on Arc's private main net, with major institutions including BlackRock, DTCC and Standard Chartered exploring integrations spanning tokenized asset settlement, digital asset custody, stablecoin access, foreign exchange and repo infrastructure. The announcement underscores Circle's strategy of positioning Arc as an enterprise-grade blockchain purpose-built for institutional finance. By bringing together globally recognized financial institutions as founding validators while expanding integrations across tokenized assets, stablecoin payments and digital custody, Circle is strengthening the infrastructure required to accelerate institutional adoption of blockchain technology and programmable finance.
-
Global Payments Joins Circle's Arc Founding Validator Cohort
During the week, Global Payments Inc. was announced as one of the founding institutional validators for Circle's Arc blockchain network ahead of its scheduled 16 September 2026 public main net launch. As a founding validator, Global Payments will help secure and validate the enterprise-grade blockchain while supporting the development of trusted infrastructure for real-time money movement, tokenized assets and institutional stablecoin settlement. The announcement positions Global Payments alongside leading global financial institutions including BlackRock, DTCC, Mastercard, Standard Chartered and Visa in building the next generation of regulated blockchain infrastructure. The development highlights Global Payments' continued expansion beyond traditional merchant acquiring into blockchain-enabled financial infrastructure. By participating in Arc's governance and validation framework, the company strengthens its strategic positioning within the rapidly growing digital asset ecosystem while supporting institutional adoption of stablecoins and programmable financial services.
-
Digital Payments Stock Performance
The table below presents a snapshot of NYSE-listed digital payments stocks, covering Visa, Mastercard, American Express (AXP), Circle, Block and PayPal.X
| Cytonn Report: Digital Payments NYSE Stock Performance | ||||||
| Company | Year Open 2026 | Price 7/31/2026 | Price 8/07/2026 | w/w change | YTD change | P/E |
| American Express | 372.7 | 336.3 | 340.9 | 1.4% | (8.5%) | 26.5 x |
| Visa | 346.5 | 366.1 | 362.5 | (1.0%) | 4.6% | 17.2 x |
| Mastercard | 563.1 | 573.1 | 563.0 | (1.8%) | (0.0%) | 32.6 x |
| Block | 65.2 | 81.2 | 79.0 | (2.8%) | 21.3% | 33.4 x |
| Paypal Holdings | 58.1 | 57.2 | 59.1 | 3.3% | 1.6% | 11.8 x |
| JPMorgan Chase & Co. | 322.2 | 351.8 | 357.5 | 1.6% | 11.0% | 6.9 x |
| Average |
|
|
|
|
| 21.4x |
Source: (AXP, Visa, Mastercard, Circle, Block, PayPal, Coinbase, Global Payments, Wise and JPMorgan Chase. NYSE
The stocks are currently trading at an average P/E multiple of 21.4x, indicating that investors are pricing in strong future earnings growth and are prepared to pay a substantial premium for current earnings. This also suggests that valuations may be stretched relative to near-term fundamentals.
We expect the global digital payments sector to continue evolving toward greater payment sovereignty, digital infrastructure modernization, and reduced reliance on traditional card-based payment networks as governments and financial institutions increasingly prioritize control over domestic payment ecosystems. Recent developments, particularly the European Central Bank’s progress toward launching the Digital Euro, signal a growing global shift toward central bank-backed digital payment infrastructure aimed at enhancing financial resilience, improving transaction efficiency, and strengthening monetary independence in an increasingly digital economy. This trend is likely to accelerate competition between public-sector digital currencies and established private payment networks such as Visa Inc. and Mastercard Incorporated, while driving broader innovation across digital finance infrastructure. However, despite these favorable long-term structural tailwinds, valuations within the sector remain relatively elevated, with the companies under coverage currently trading at an average P/E of 21.4x, suggesting that a significant portion of future growth expectations may already be priced in. As such, we expect near-term performance to remain sensitive to regulatory developments, execution risk, and the pace at which both incumbents and emerging digital payment infrastructure providers adapt to the rapidly changing payments landscape.
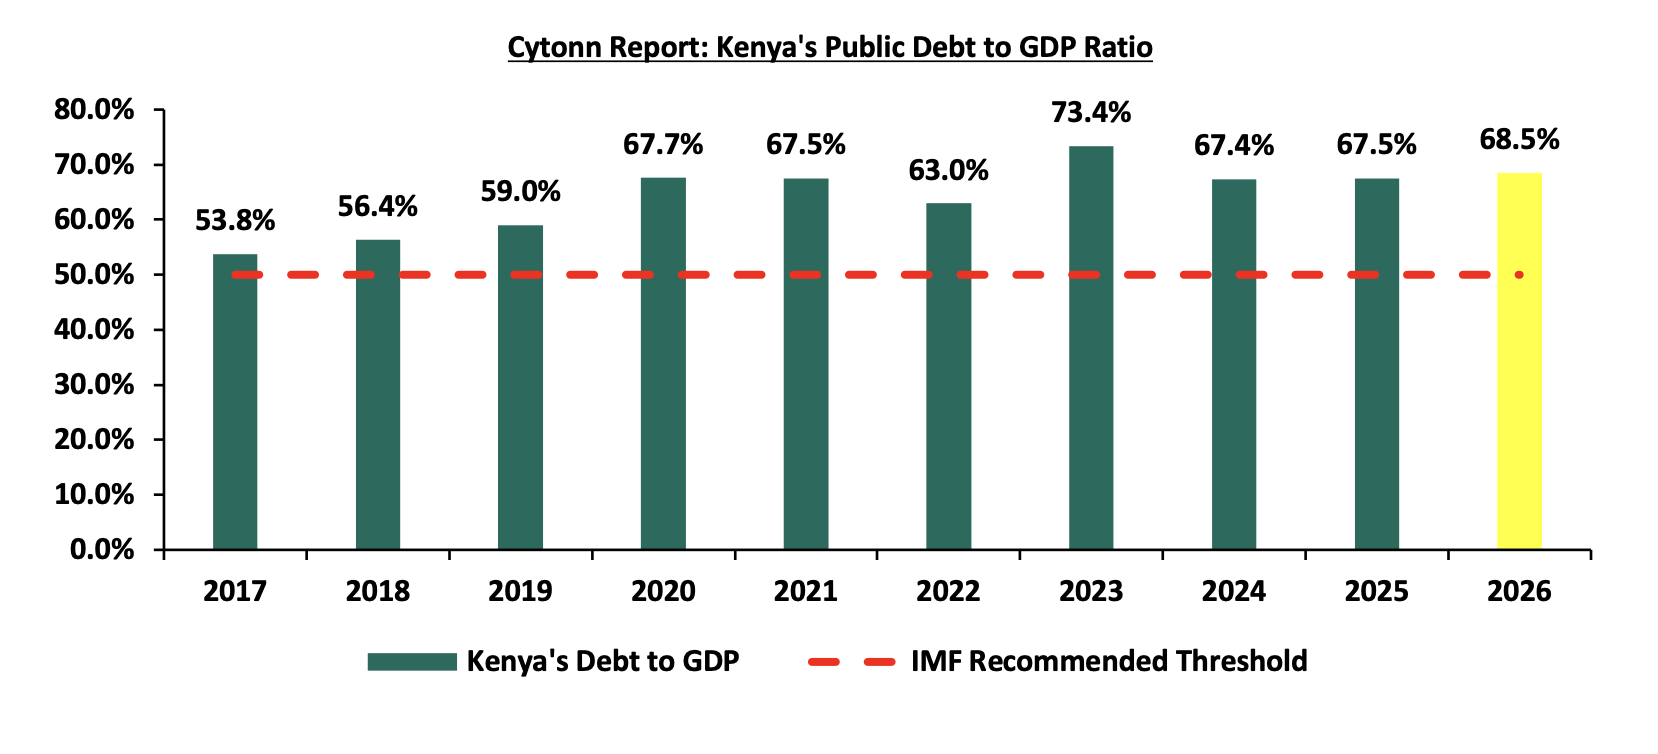
Kenya is one of the fastest growing economies in Sub-Saharan Africa, having registered a growth rate of 5.3% in the first quarter of 2026. Despite being one of the fastest growing economies in Sub-Saharan Africa with a projected economic growth rate of 4.5%, above the region’s expected average of 4.2% in 2026, Kenya is grappling with a high debt burden, which has increased rapidly in recent years. As per the latest data from the National Treasury Monthly Bulletin, the total public debt stood at Kshs 13.0 tn as of June 2026, compared to Kshs 11.8 tn recorded in June 2025. Notably, external debt increased by 3.6% during the period to Kshs 5.7 tn in June 2026 from the Kshs 5.5 tn in June 2025 driven by additional external borrowing, including the February 2026 USD 2.3 bn dual-tranche Eurobond issuance and continued disbursements from multilateral and bilateral creditors. Similarly, domestic debt increased by 15.9% to Kshs 7.3 tn in June 2026, from Kshs 6.3 tn in June 2025, reflecting the government’s increased reliance on domestic financing through Treasury bills and bonds amid elevated global interest rates, tighter access to international capital markets, and IMF fiscal-discipline requirements that have constrained external borrowing. Persistent budget financing needs, coupled with strong local demand for government securities, have further supported the shift towards domestic borrowing. The debt to GDP ratio stood at 68.5% as of June 2026, 18.5% points higher than the International Monetary Fund (IMF) threshold of 50.0% for developing countries, and up from the 67.8% recorded in June 2025 and 67.5% recorded in December 2025. The rising public debt has raised concerns about its sustainability and implications for fiscal and macroeconomic stability. Kenya’s debt levels remain high with high debt servicing costs as evidenced by the B, B3 and B- credit ratings by S&P Global, Moody’s and Fitch credit agencies respectively, signaling high credit risk but with ability to still meet its financial commitments. However, recent policy actions, including successful liability management operations such as Eurobond buybacks and switch auctions, alongside fiscal consolidation efforts aimed at narrowing the budget deficit, have begun to improve Kenya’s credit trajectory. Notably, on 27 January 2026, Moody’s upgraded Kenya’s credit rating from Caa1 to B3 and revised the outlook from positive to stable, signaling the potential for further improvement in the country’s credit profile as investor confidence strengthens and debt management remains prudent. Additionally, On July 17th 2026, Fitch Rating’s affirmed Kenya’s credit score of B- while maintaining a stable outlook. The stable credit outlook from Moody’s, along with stable ratings from Fitch reflects an improvement in Kenya’s credit. The successful Eurobond issuances and liability management operations, including the February 2026 dual-tranche Eurobond issuance and associated buyback offer, have also helped smooth the external debt maturity profile and reduce near-term refinancing pressures.
We have been tracking the evolution of the public debt and below are the most recent topicals we have done on Kenya’s debt:
-
Review of Kenya’s Public Debt 2025 - In July 2025, we highlighted the status of Kenya’s public debt at the end of FY’2024/2025, the economic consequences of high debt levels and an outlook on the country’s debt sustainability,
-
Review of Kenya’s Public Debt 2024 - In July 2024, we highlighted the status of Kenya’s public debt in the light of the withdrawal of the Finance Bill 2024 and an outlook on the country’s debt sustainability,
-
Kenya’s Public Debt Review 2023 – In October 2023, we highlighted Kenya’s public debt situation and the need for prudent fiscal management and strategic planning to ensure that the debt remains sustainable and does not compromise the country’s economic prospects,
In this week's topical, we will focus on the current status of Kenya's public debt at the end of FY’2025/2026. We will examine the economic consequences of high debt levels and provide our outlook on the country's debt sustainability. Additionally, the report will compare Kenya's public debt situation with that of other Sub-Saharan countries using various indicators such as the debt-to-GDP ratio and the debt service-to-revenue ratio.
This we shall cover as follows;
-
The Current State of Kenya’s Public Debt,
-
Kenya’s Debt Servicing Cost,
-
Economic Impact of Kenya’s High Debt Levels,
-
Kenya’s Debt Sustainability Analysis and Projection,
-
Comparative Analysis with Regional Peers, and,
-
Policy Recommendations and Conclusion.
Section I: The Current State of Kenya’s Public Debt
According to the National Treasury Monthly Bulletin Report, Kenya’s public debt reached Kshs 13.0 tn as of June 2026, marking a 10.8% increase from the Kshs 11.8 tn recorded in June 2025. Amidst the government’s fiscal consolidation efforts, the FY’2026/27 Budget Estimates reflect a faster 8.8% increase in revenue projections to Kshs 3.7 tn (equivalent to 17.4% of GDP), up from Kshs 3.4 tn in FY’2025/26 (equivalent to 18.4% of GDP), compared to a slower 4.3% increase in total expenditure projections to Kshs 4.8 tn (equivalent to 23.2% of GDP), from Kshs 4.6 tn (equivalent to 24.9% of GDP) in the FY’2025/26 Budget. These measures are aimed at stemming the escalation of debt accumulation and maintaining sustainable debt levels. Consequently, the estimated overall fiscal deficit level inclusive of grants reduced by 0.9% points to 5.5% of GDP, from the FY’2025/26 projection of 6.4% of GDP. However, we expect the government efforts to be impeded by the challenging economic environment, characterized by renewed inflationary pressures that could constrain consumer spending, persistent geopolitical tensions and their potential impact on global trade and commodity prices, as well as continued challenges in domestic tax revenue collection, is expected to weigh on economic activity. Additionally, the high proportion of government revenues allocated towards debt servicing continues to constrain fiscal space and limit resources available for development expenditure, further dampening the outlook for economic growth. Notably the July 2026 PMI came in at 51.0, above the 50.0 neutral mark, up from 50.0 in June 2026, signaling a cautious recovery in the operating conditions across Kenya, resulting from the recent geopolitical unrest, in addition to the overall high cost of living. Additionally, the high fuel prices and slower economic growth is expected to stifle revenue collection. Below is a graph highlighting the trend in the Kenya’s debt to GDP ratio over the last 10 years:
Source: National Treasury, CBK
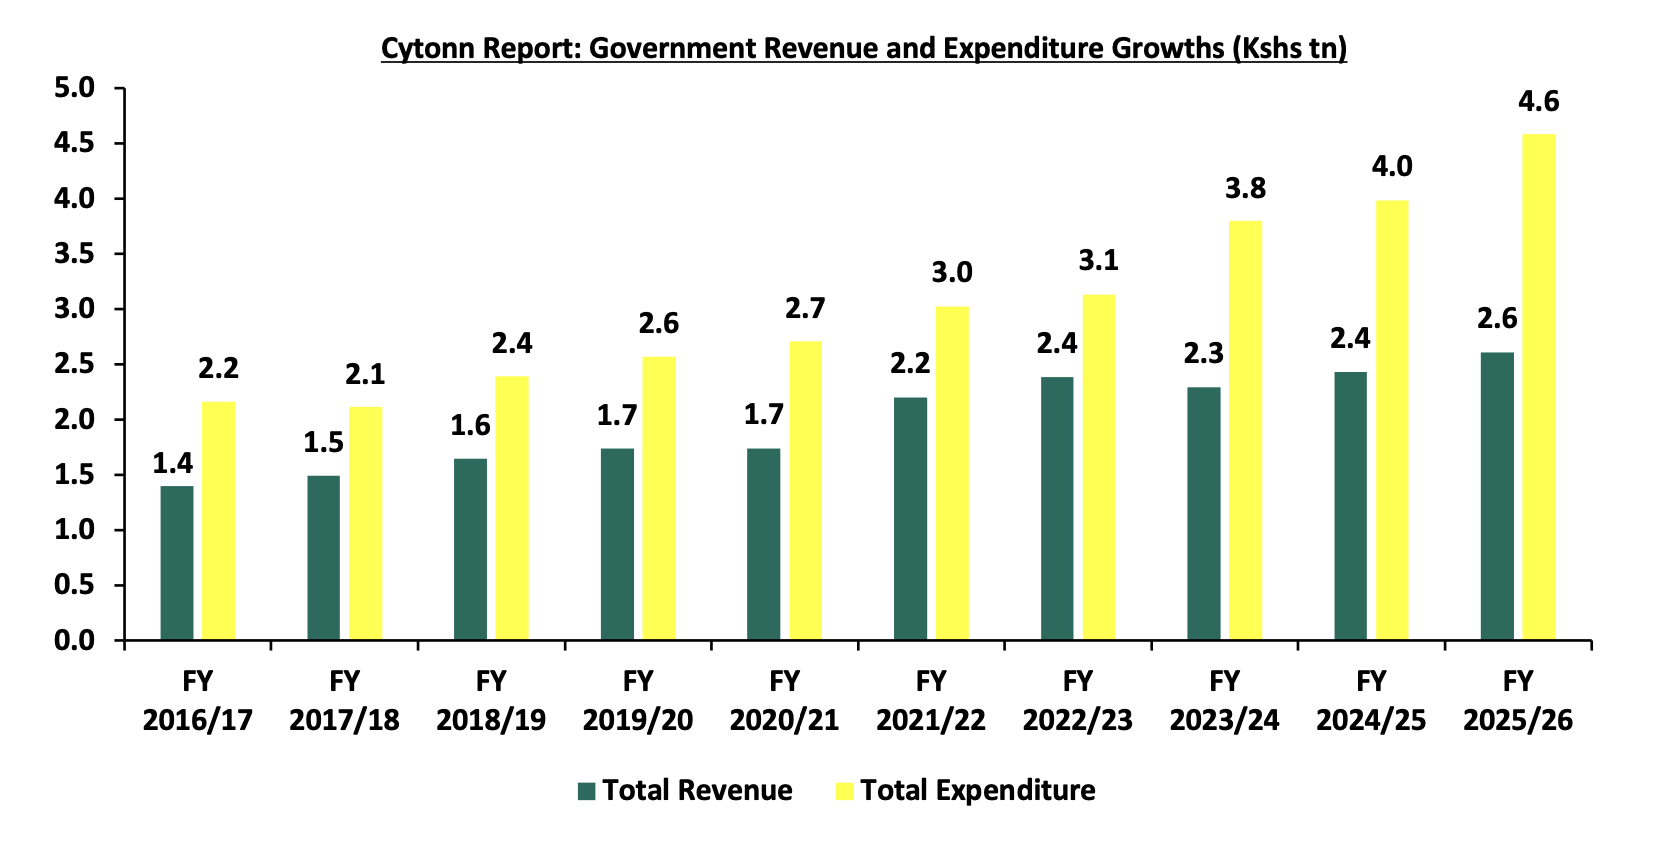
Kenya's debt levels have been rising due to persistent fiscal deficits, which have averaged 6.8% of GDP over the last 10 financial years. This increase is attributed to sustained recurrent expenditures and debt servicing costs. Over this ten-year period, government revenue grew at a compound annual growth rate (CAGR) of 6.4%, reaching Kshs 2.6 tn by the end of FY’2025/26, up from Kshs 1.4 tn by the end of FY‘2016/17. However, this revenue growth was outpaced by growth in government expenditure, which grew at a CAGR of 7.8%, reaching Kshs 4.6 tn by the end of FY’2025/26, up from Kshs 2.2 tn in FY’2016/17. The chart below shows the growth in Kenya’s total revenue and expenditure in the last 10 fiscal years:
Source: Central Bank of Kenya, data as of June 2026
-
The Nature of Kenya’s Debt Composition (Domestic vs External)
Over the years, Kenya’s debt composition has been evenly distributed between domestic and external borrowing. However, from the beginning of 2023, there was a shift towards external borrowing, with the proportion of external debt against domestic debt standing at 54.7% to 45.3% in December 2023, compared to 51.1% to 48.9% over a similar period in 2022. This increase was partly attributed to the depreciation of the Kenya Shilling during that period, which increased the valuation of foreign currency-denominated debt. In 2024, the preference shifted towards domestic borrowing, with the proportion of external debt against domestic debt adjusting to 46.3% to 53.7% in December 2024, from 54.7% to 45.3% in December 2023. In 2025, the preference towards domestic borrowing continued, with the proportion of external debt against domestic debt adjusting to 44.4% to 55.6% in December 2025, from 46.3% to 53.7% in December 2024. The shift was supported by currency appreciation in 2025, as evidenced by the 0.2% appreciation in the Shilling against the dollar which reduced the valuation of external debt, and the gradual easing of interest rates, which made domestic borrowing more attractive to the government. As of June 2026, the proportion of external debt against domestic debt stood at 43.7% to 56.3%. Notably, external debt increased at a 10-year CAGR of 12.2% to Kshs 5.7 tn as at June 2026, from Kshs 1.8 tn in June 2016, albeit lower than the 15.0% CAGR recorded by domestic debt to Kshs 7.3 tn as at June 2026 from Kshs 1.8 tn in June 2016. Consequently, the total public debt has increased at a 10-year CAGR of 13.7% to Kshs 13.0 tn as at June 2026, from the Kshs 3.6 tn recorded as at June 2016. Below is a graph highlighting the trend in the external and domestic debt composition over the last 10 years;
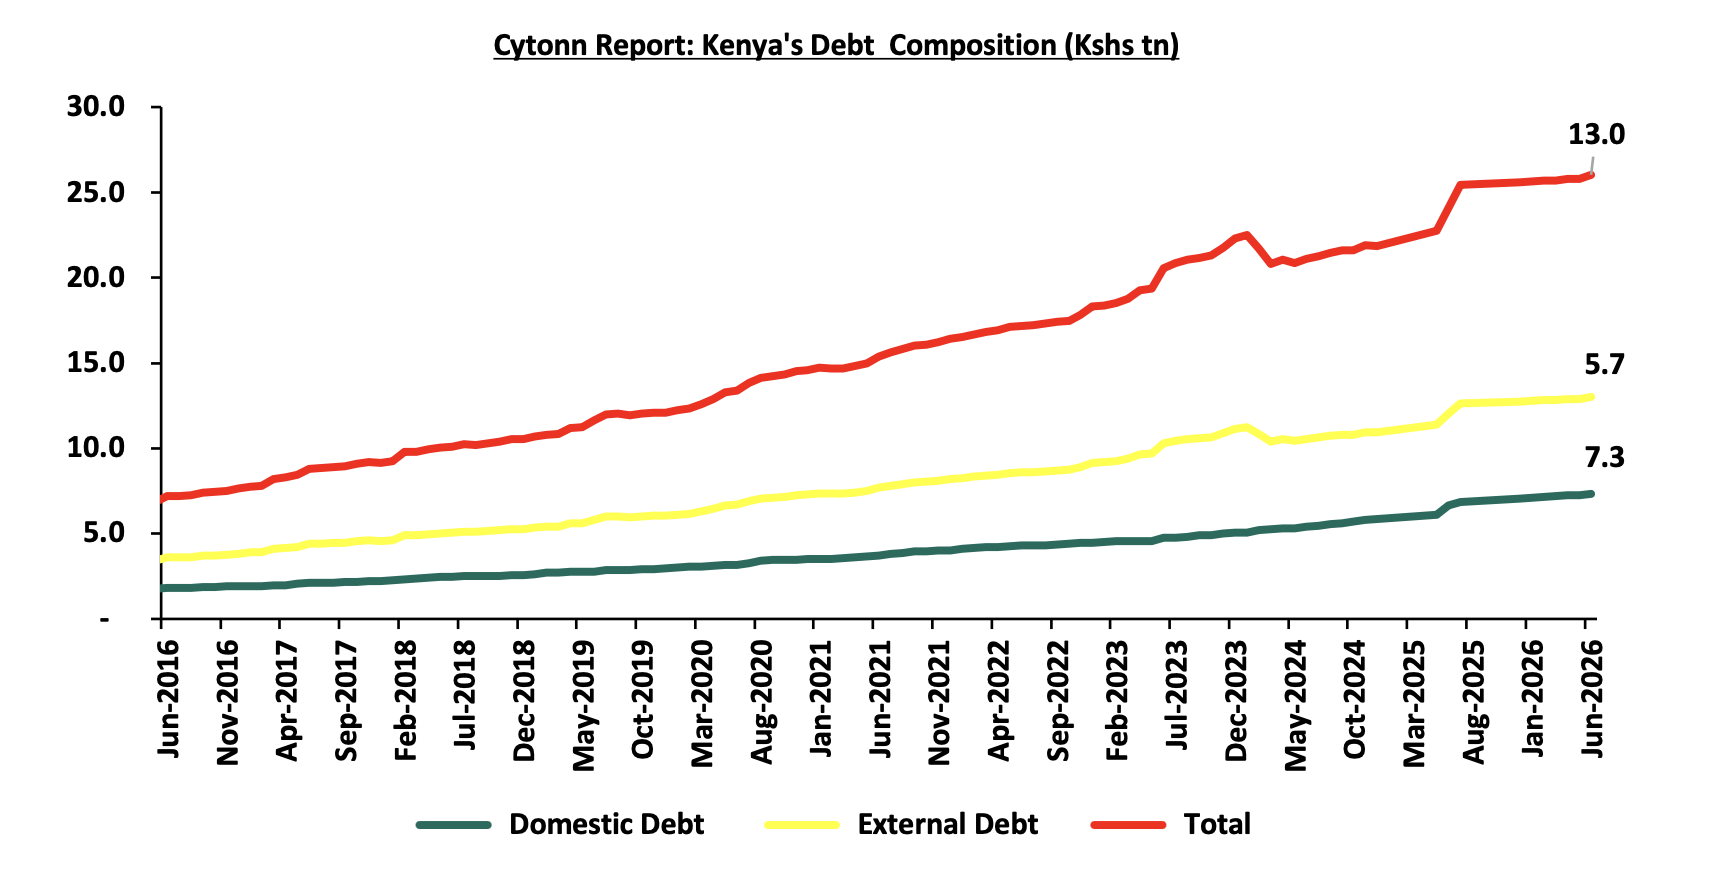
Source: National Treasury and Central Bank of Kenya
Below is a graph highlighting the composition of domestic and external debt as a percentage of total public debt over the last 10 years:
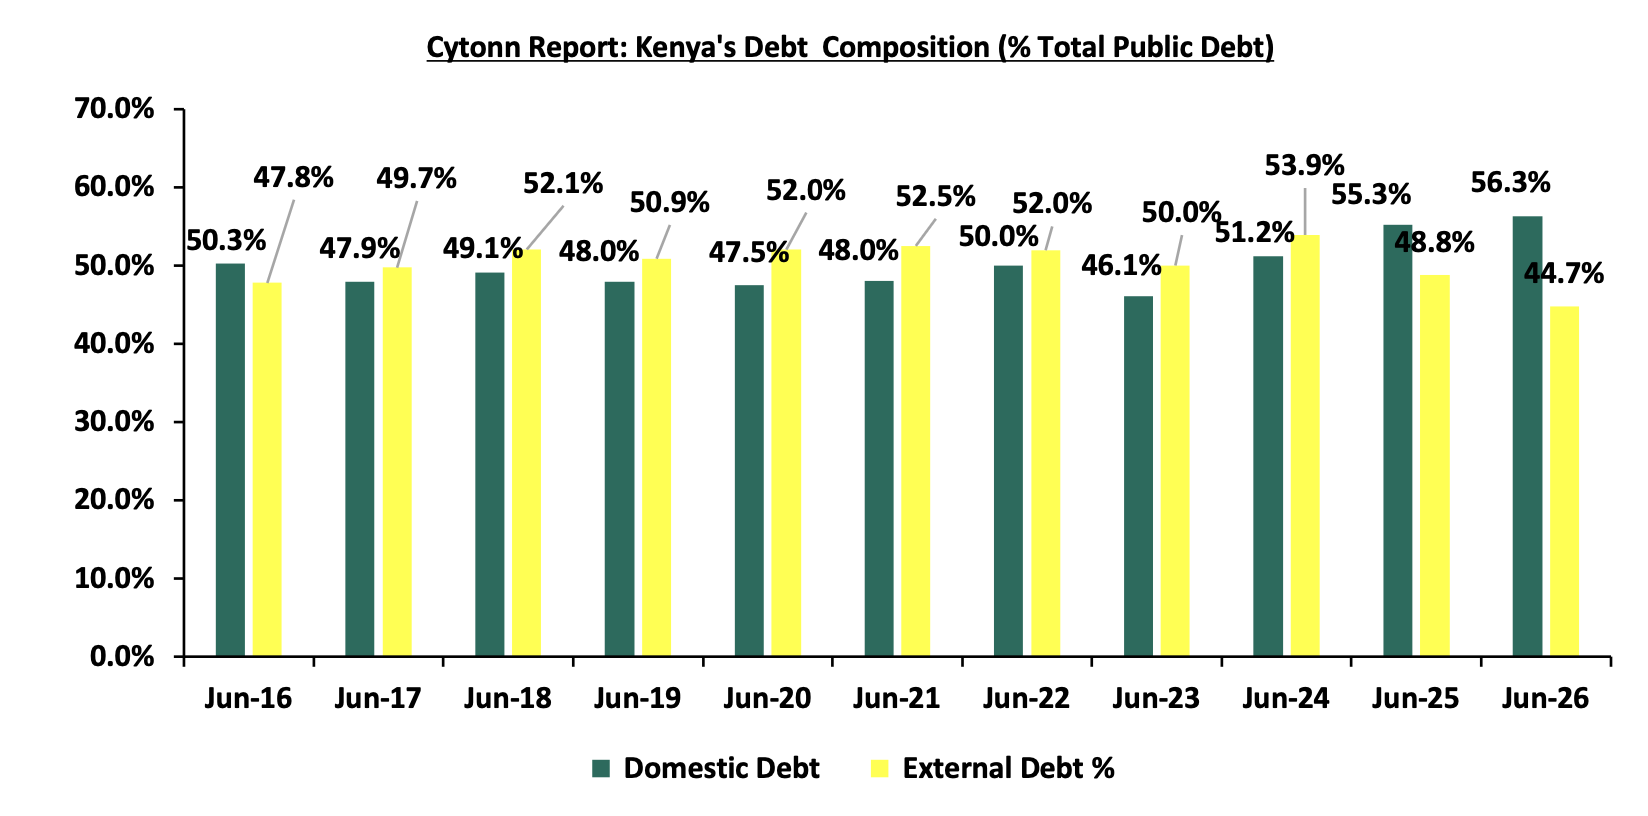
Source: National Treasury and Central Bank of Kenya
-
Public Debt Mix by Holders
-
External Debt Composition by Holders (Bilateral, Multilateral, and Commercial Banks)
Kenya’s external debt stock is mainly composed of multilateral loans, bilateral loans and commercial loans. According to the National Treasury Monthly Bulletin, as of June 2026, Kenya’s exposure to multilateral loans recorded a 0.9% points decrease to 54.6%, from 55.5% as at the end of June 2025. This was attributable to a reduction in multilateral borrowing during the period, as the government scaled back reliance on concessional financing from multilateral institutions amid efforts to manage the accumulation of external debt and diversify its sources of financing. Notably, during FY'2025/26, Kenya continued to access the international capital markets through the issuance of a USD 750.0 mn Eurobond in October 2025. The issuance formed part of the government's liability management strategy aimed at refinancing existing debt obligations, smoothing the external debt maturity profile, and enhancing debt sustainability. The successful transaction reaffirmed investor confidence in Kenya's sovereign credit despite a challenging global financing environment and elevated borrowing costs. Nevertheless, Kenya's Eurobond yields remained relatively volatile throughout the financial year, reflecting investors' continued assessment of the country's fiscal position, high public debt levels, debt servicing obligations, and the pace of fiscal consolidation. While improving macroeconomic fundamentals, including a more stable exchange rate and stronger foreign exchange reserves, supported market sentiment, concerns over debt sustainability and external financing requirements continued to influence the pricing of Kenya's sovereign debt in the secondary market:
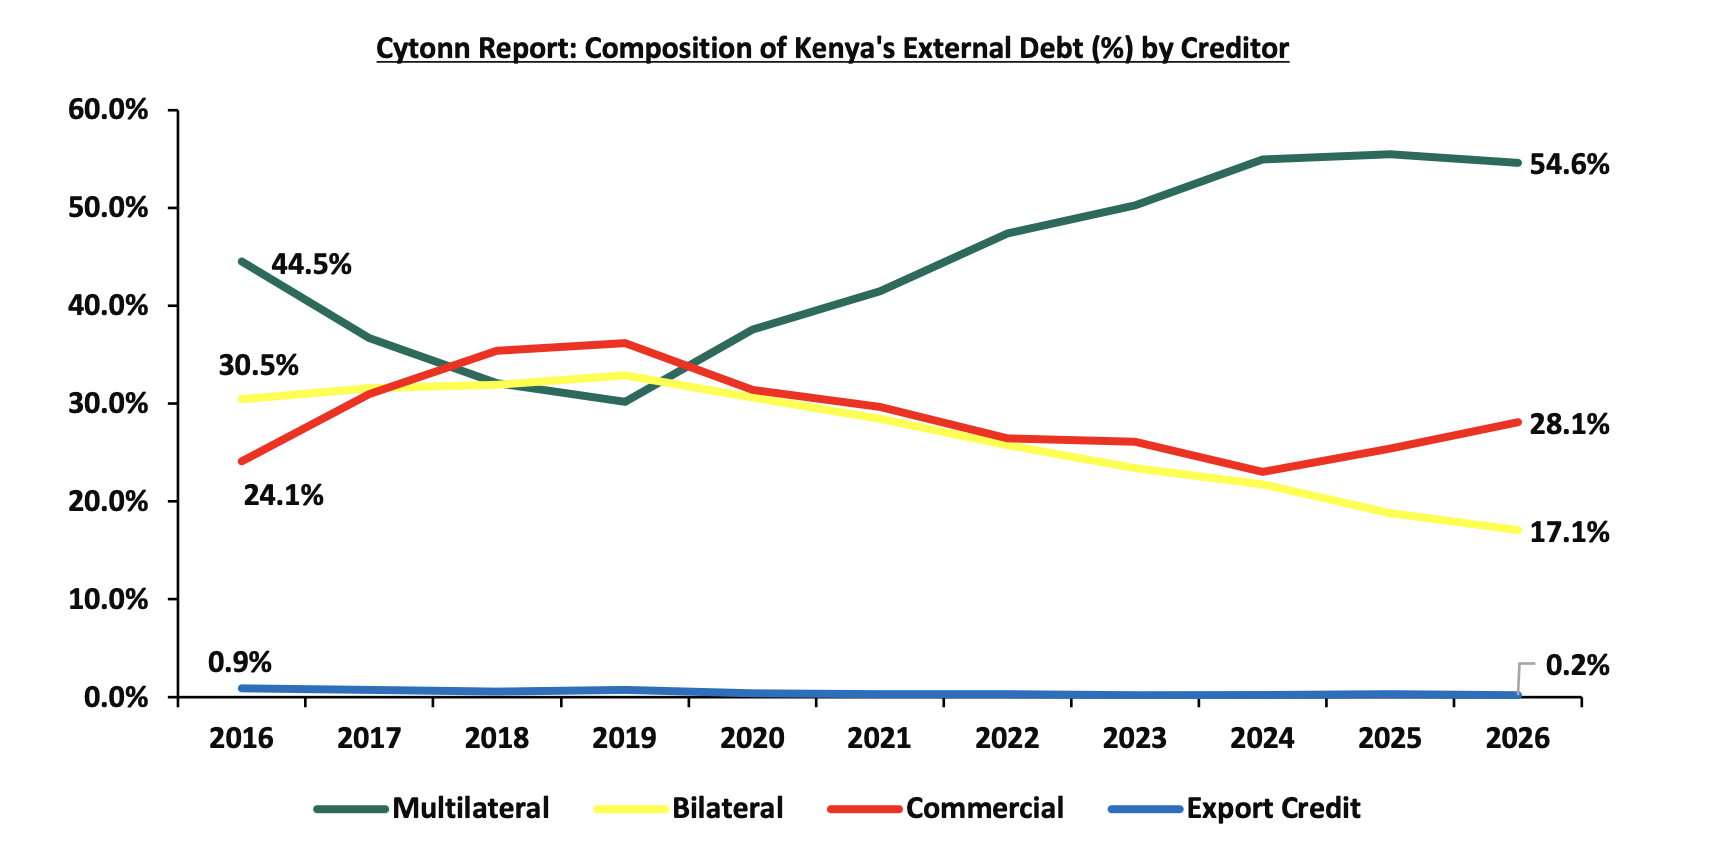
Source: National Treasury, CBK
It is key to note that:
-
The portion of multilateral debt decreased by 0.9% points to 54.6% in June 2026, from 55.5% recorded in June 2025, due to reduced disbursements from International Development Association. Notably, Bilateral debt decreased by 1.7% points to 17.1% in June 2026, from 18.8% in June 2025,
-
Commercial debt as a percentage of external debt increased by 2.7% points to 28.1% of total external debt in June 2026 from 25.4% in June 2025, mainly attributable to Kenya’s government reliance on concessional loans.
-
According to the National Treasury Monthly Bulletin as June 2026, 54.8% of the external debt was US Dollar denominated contributing to the increasing debt servicing cost despite the stable and strengthened Kenyan Shilling, largely due to elevated global interest rates. The table below shows the currency composition of the external debt stock:
-
Cytonn Report: Currency composition of the External Debt Stock (%)
Currency
June-2025
June-2026
USD
59.8%
54.8%
EUR
27.3%
26.6%
Yuan
5.0%
11.7%
Yen
5.2%
4.5%
GBP
2.5%
2.3%
Other Currencies
0.2%
0.1%
Source: National Treasury
-
Domestic Debt Composition by Holders
Banking institutions make up for the highest percentage of domestic debt, accounting for 35.6% of government securities holdings as at June 2026, 9.7% points lower than the 45.3% share recorded as at June 2025, with the decrease mainly attributed to the lower real returns. Similarly, government securities holding by other domestic investors registered 15.8% points decrease to 28.7% as at June 2026, from the 12.9% recorded at June 2025. Notably, pension funds accounted for 14.0% of holdings in government securities as at June 2026, 14.7% points lower than the 28.7% registered in June 2025. Below is a table of the composition of government domestic debt by holders:
|
Domestic debt |
Dec-2021 |
Dec-2022 |
Dec-2023 |
Dec-2024 |
June-2025 |
Dec-2025 |
Jun-2026 |
|
Banking institutions |
50.2% |
46.8% |
46.1% |
45.1% |
45.3% |
34.9% |
35.6% |
|
Insurance Companies |
6.8% |
7.4% |
7.2% |
7.3% |
7.2% |
13.5% |
13.8% |
|
Parastatals |
5.6% |
6.1% |
5.5% |
5.6% |
6.0% |
7.4% |
7.9% |
|
Pension Funds |
31.3% |
33.3% |
29.9% |
28.9% |
28.7% |
14.7% |
14.0% |
|
Other domestic investors |
6.1% |
6.4% |
11.3% |
13.2% |
12.9% |
29.5% |
28.7% |
|
TOTAL |
100.0% |
100.0% |
100.0% |
100.0% |
100.0% |
100.0% |
100.0% |
Source: Central Bank of Kenya
-
GDP per Capita vs Debt per Capita
According to Central Bank data, Kenya’s Public Debt per Capita has increased at a 10-year CAGR of 10.3% to Kshs 213,783.2 in 2025, from Kshs 79,910.7 in 2016. Conversely, GDP per Capita has grown at a slower 10-year CAGR of 6.8% to Kshs 305,524.0 in 2025, from Kshs 158,557.6 in 2016. This discrepancy suggests that the rapid increase in public debt is not being matched by corresponding economic growth. The chart below compares Kenya’s GDP per capita to the debt per capita over the last 10 years:
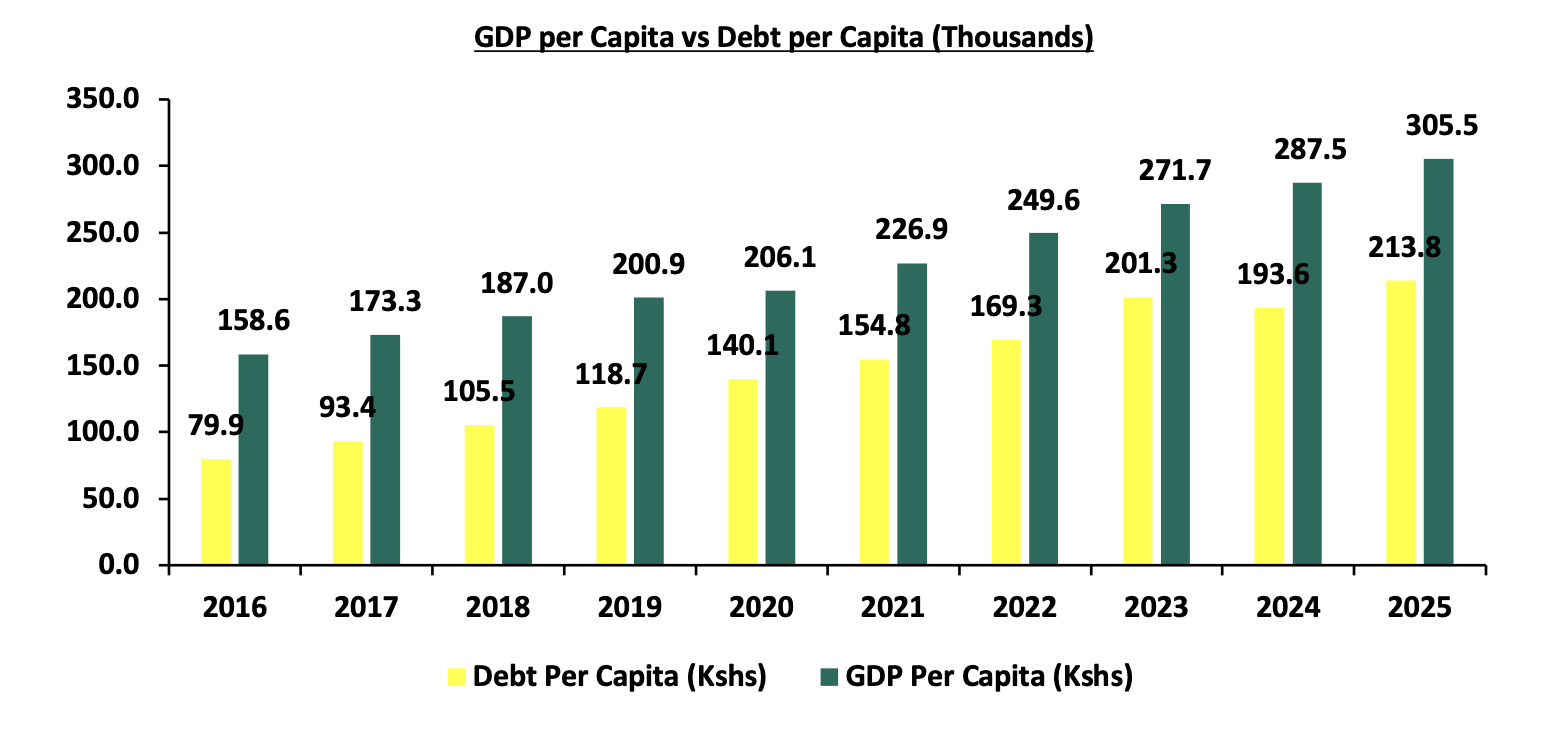
Source: World Bank, CBK
Factors that have accelerated the growth in Kenya’s Public debt;
-
Fiscal Deficit – Kenya has witnessed a persistent fiscal deficit averaging at 6.8% of the GDP for the last 10 financial years and is projected to ease to 5.5% of the GDP for FY’2026/27, from the 4.7% estimated for FY’2025/26. According to the Budget Estimates for FY'2026/27 the approved budget for the FY’2026/27 is estimated to be Kshs 4.7 tn against a targeted revenue collection of Kshs 3.5 tn, hence the need to borrow an additional Kshs 0.9 tn domestically and Kshs 0.2 tn externally,
-
Debt Servicing Costs – Debt servicing cost has been on the rise, with the debt service to revenue ratio averaging 53.6% over the last 10 financial years and standing at 70.1% as of June 2026. The rising debt servicing cost is attributed to the continuous accumulation of total public debt, resulting from the increased flow of international development assistance in the form of concessional loans, and,
-
Guaranteed loans by the Government of Kenya – The guaranteed loans on state corporations such as the government servicing Kenya Airways guaranteed debt in FY2024/25 after the airline was unable to meet its obligation, put pressure on the need for excessive spending, despite poor performances by the said state corporations.
Section II: Kenya’s Debt Servicing Cost
According to the June 2026 Revenue and Net Expenditures Report for the FY’2025/26 by the National Treasury, the cumulative public debt servicing cost amounted to Kshs 1,826.5 bn which was 87.1% of the revised estimates II of Kshs 2,096.1 bn, and 87.1% of the prorated estimates of Kshs 2,0961.1 bn. Notably, the Kshs 1,826.5 bn debt servicing cost was equivalent to 70.1% of the actual revenues of Kshs 2,607.3 bn collected as at the end of June 2026 and was 40.1% points above IMF’s recommended threshold of 30.0%. The sustained high debt service to revenue ratio above the recommended threshold is a worrying sign, with a large proportion of the government’s revenue being allocated to servicing debt rather than being available for other essential expenditures. A ratio of above 50.0% means that more than half of the government's revenue is being allocated to servicing debt which may leave limited fiscal space for public investments, social programs, and other critical government functions, which are essential for the long-term well-being of the country, as a significant part of the budget is pre-committed to debt repayment. Below is a chart showing the debt service to revenue ratio for the last ten fiscal years:
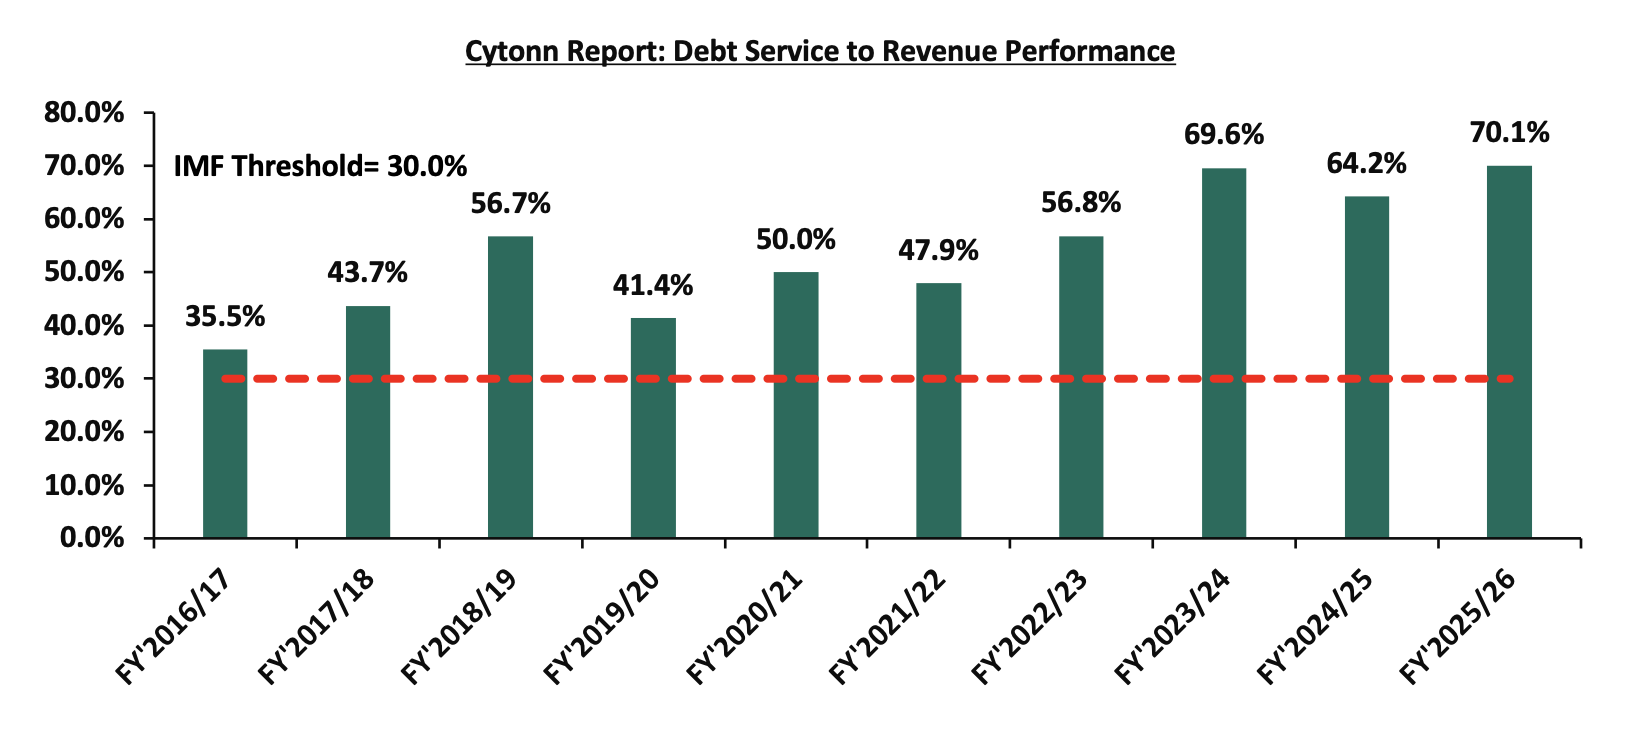
Source: National Treasury, FY’2025/26
Kenya’s debt servicing costs have continued to increase over time growing at a 10-year CAGR of 15.1% to Kshs 1,883.9 bn in FY’2025/26, from Kshs 461.8 bn in FY’2016/17. The graph below compares the domestic debt servicing cost to the external debt servicing cost over the last ten fiscal years:
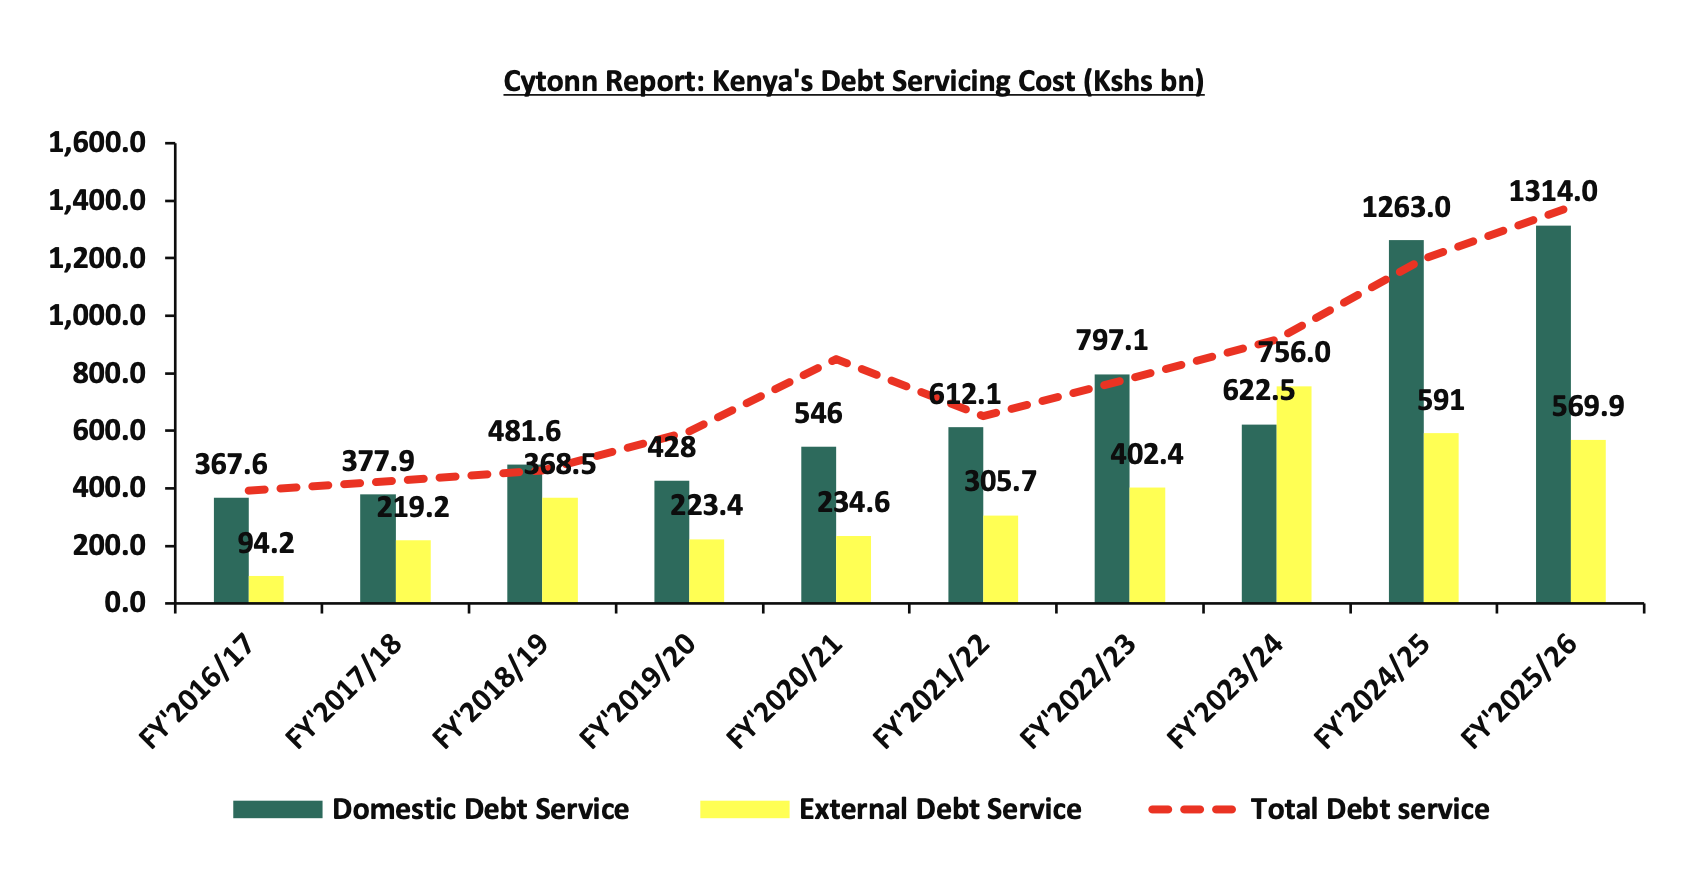
Source: National Treasury
Section III: Economic Consequences of High Debt Levels
The COVID-19 pandemic left numerous sub-Saharan African countries grappling with a fragile global economy, escalating prices, costly loans, and a high cost of living. Many of these nations continue to face challenges like high inflation, elevated interest rates, currency fluctuations, and political instability. Consequently, many developing countries, including Kenya, have had to increase borrowing to shield their economies from additional economic shocks caused by internal geopolitical tensions and supply chain disruptions amid emerging global conflicts. However, this ongoing borrowing has led to significant debt accumulation, posing several implications for the Kenyan economy.
-
Impact on currency value-High debt levels can lead to a depreciation of the national currency. Investors may lose confidence in the country's ability to manage its debt, leading to capital flight and a weaker currency. A depreciated currency can increase the cost of imports, contributing to inflationary pressures,
-
Increased Debt Servicing Costs – High debt levels have led to increased costs of debt servicing given that a significant portion of the debt is in foreign currencies despite the fact that the Kenyan Shilling has been stronger and stable. The government has had to increase taxes and cut spending in other areas to meet its debt obligations and the conditions set by multilateral lenders such as the IMF,
-
Higher Borrowing Costs on New Loans – Given the country’s high levels of debt, lenders perceive Kenya’s credit environment to be riskier, therefore demanding higher interest rates for new borrowing. This makes it more expensive for the government to finance its operations and investments,
-
Reduced Fiscal Space – High debt levels tend to limit a government’s fiscal space, or its ability to respond to economic shocks with fiscal policy. This is because a large portion of the government’s budget gets tied up in debt servicing, leaving less money for other expenditures and development,
-
Crowding Out of the Private Sector – Because of the increased domestic borrowing, the government crowds out the private sector by driving up interest rates in the economy thus making it difficult for both businesses and individuals to borrow, and,
Section IV: Kenya’s Debt sustainability Analysis and Outlook
The country’s risk of debt distress remains elevated as evidenced by the high debt service to revenue ratio of 70.1% as of June 2026. Additionally, Kenya’s debt to GDP ratio currently stood at 68.5% as of June 2026, 18.5% points above IMF’s recommended threshold of 50.0% for developing countries. Notably, Kenya’s public debt recorded a 5-year CAGR of 8.7% to Kshs 13.0 tn as of June 2026, outpacing the economic growth’s 5-year average of 5.3% as of April 2026, with the International Monetary Fund (IMF) projecting Kenya’s 2026 GDP growth to come in at 4.5% as of July 2026, a downward revision from its projection of 4.8% made in April 2025 as a result of heightened geopolitical tensions and the ongoing conflict in the Middle East, which have disrupted global trade, increased energy and commodity prices, and tightened financial conditions, posing downside risks to Kenya’s economic growth The persistent fiscal deficits resulting from the revenue-expenditure mismatch continue to hamper fiscal consolidation efforts as revenue continues to lag behind expenditure.
Kenya’s debt levels remain high with high debt servicing costs as evidenced by the B, B3 and B- credit ratings by S&P Global, Moody’s and Fitch credit agencies respectively, signaling high credit risk but with ability to still meet its financial commitments. Notably, on 27th January 2026, Moody’s upgraded its credit rating on Kenya from Caa1 to B3 and revised the outlook from positive to stable, indicating that there is potential for Kenya’s credit rating to improve in the future due to eased default risk. On July 17th 2026, Fitch Rating’s affirmed Kenya’s credit score of B- while maintaining a stable outlook. The stable credit outlook from Moody’s, along with stable ratings from Fitch reflects an improvement in Kenya’s credit. However, maintaining this trajectory will depend on continued fiscal discipline, prudent debt management, and a careful balance between external and domestic borrowing to avoid overexposure to foreign exchange risk. Below is a summary of the credit rating on Kenya by various rating agencies;
|
Cytonn Report: Kenya Credit Rating Agencies Ratings |
||||||
|
Rating Agency |
Previous Rating |
Previous Outlook |
Date Released |
Current Rating |
Current Outlook |
Date Released |
|
Moody's Rating |
Caa1 |
Positive |
29th January, 2025 |
B3 |
Stable |
27th January, 2026 |
|
Fitch Ratings |
B- |
Stable |
31st January 2025 |
B- |
Stable |
17th July 2026 |
|
S&P Global |
B- |
Stable |
24th February 2025 |
B |
Stable |
22nd August 2025 |
Source: Fitch Ratings, S&P Global, Moody’s
Kenya’s fiscal outlook over the medium-term points to continued fiscal consolidation, with the Government targeting a gradual narrowing of the fiscal deficit through stronger domestic revenue mobilization, expenditure rationalization and reduced reliance on domestic borrowing. The 2026 Budget Policy Statement projects the overall fiscal deficit, including grants, to decline from 5.3% of GDP in FY2026/27 to 3.6% in FY2027/28, 3.3% in FY2028/29 and 2.9% in FY2029/30. Over the same period, total expenditure and net lending is projected to remain elevated but moderate relative to the size of the economy, while revenue mobilization is expected to improve as a share of GDP. The fiscal consolidation path is also expected to reduce the Government's borrowing requirements. Government’s total revenue is projected to increase from 17.4% of GDP in FY’2026/27 to 17.5% in FY’2027/28 and moderate to 16.8% of the GDP in FY’2028/29. In nominal terms, the Budget Policy Statements projects expenditure and net lending to rise from about Kshs 4.7 tn in FY2026/27 to Kshs 5.6 tn by FY’2029/30, reflecting continued growth in the size of the economy and government programs, although the expenditure-to-GDP ratio is expected to moderate.
Section V: Comparison with other African countries
Kenya's elevated debt situation is part of a broader trend seen across the sub-Saharan region, where debt levels remain high. Notably, 66.0% of the continent's debt is concentrated in just ten countries. South Africa leads with 13.1% of Africa's total debt, followed closely by Egypt at 12.0%. Kenya accounts for 4.1% of the continent's debt, while Angola, Cote d’Ivoire, and Senegal each hold between 3.0% and 4.0%. This concentration of debt among a few countries highlights the significant financial pressures faced by these economies within the region. The graph below highlights the composition of the debt by the top 10 countries as a percentage of total region debt:
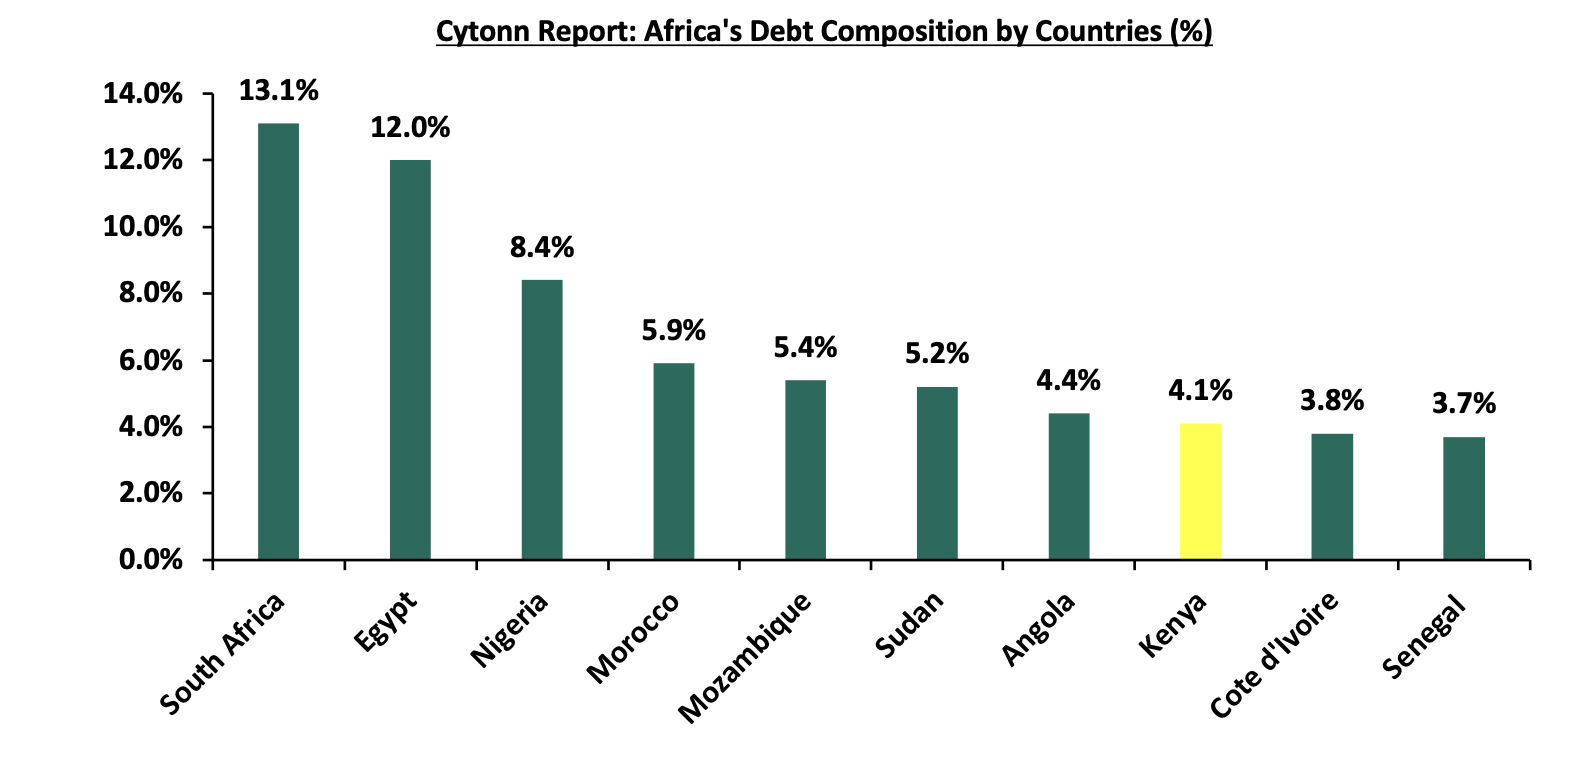
Source: Afrexim Bank Research
Kenya’s public debt burden remains elevated relative to a number of Sub-Saharan African economies, although it is not the highest in the region. At 68.5% of GDP as of June 2026, Kenya’s public debt-to-GDP ratio is above the IMF’s 50.0% threshold and is broadly comparable with the elevated debt levels observed across several African economies. It is important to note that Kenya’s recent liability-management operations, improved market access and planned reduction in the fiscal deficit provide a basis for gradual improvement; however, sustained revenue mobilisation, expenditure rationalisation and prudent management of domestic and external borrowing will be necessary to bring the country’s debt burden and debt-servicing costs onto a more sustainable trajectory. The World Bank similarly assesses Kenya as being at high risk of debt distress and estimates that comprehensive fiscal and structural reforms could reduce the debt-to-GDP ratio to about 44.0% by 2035.
Section VI: Conclusions and Recommendations
Kenya's public debt situation underscores the need for prudent fiscal management and strategic planning to ensure that the debt remains sustainable and does not compromise the country's economic prospects. It is essential to strike a balance between funding the government's development projects and maintaining debt at manageable levels. To address the challenges posed by the high public debt in Kenya, here are some actionable steps that the Kenyan government can consider:
-
Enhanced Debt Management – Implement a comprehensive debt management strategy that encompasses short, medium, and long-term objectives which regularly assess the cost and risk profile of the debt portfolio as well as Prioritizing refinancing high-cost debt with lower-cost alternatives to reduce debt service obligations,
-
Capital Markets Reform – The government should strengthen the regulatory and supervisory framework for capital markets and improve the efficiency, stability, and inclusiveness of the financial sector, especially the markets for stocks, bonds, and other securities to improve capital formation and foreign direct investments (FDIs) flowing into the country,
-
Improve Ease of Doing Business – The government should improve the competitiveness and attractiveness of the country for investors and entrepreneurs. This can be achieved by simplifying and streamlining the procedures and requirements for starting, operating, and closing a business. Also Promoting a conducive and competitive business environment that fosters innovation, productivity, and growth. These measures will spur business growth and improve the country’s production thus allowing the government to collect more revenue,
-
Focus on Areas of Strength Such as Tourism and Diaspora - Kenya's tourism sector is a significant contributor to the economy, providing jobs, generating foreign exchange, and boosting infrastructure development. Additionally, the Kenyan diaspora plays a crucial role in remittances, which are a vital source of foreign currency. By investing in the tourism sector and fostering stronger ties with the diaspora, government can enhance its appeal as a premier travel destination and create favourable conditions for diaspora remittance flow to help diversify income sources and reduce reliance on debt.
-
Fiscal Consolidation – High fiscal deficit is attributable to higher growth in expenditure volumes relative to revenue collections, creating the need for excessive borrowing levels. The government needs to implement robust fiscal consolidation through expenditure reduction by introducing austerity measures and limit capital expenditure to projects with either high social impact or have a high Economic Rate of Return (ERR), and high economic benefits outweighing costs,
-
Investment in Productive Sectors – Direct investments toward sectors that have the potential for high economic growth and job creation, such as infrastructure, agriculture, and manufacturing as well as developing targeted incentive programs to attract both domestic and foreign investments in these sectors,
-
Public-Private Partnerships (PPPs) – The government should identify infrastructure projects suitable for PPP arrangements and incentivize the private sector to participate in such projects, thus sharing the financial burden and transferring project risk to the private sector,
-
Improving the Country’s Exports – The government should formulate export and manufacturing favourable policies to improve the current account. This would stabilize the exchange rate and stop our foreign-denominated debt from increasing as the shilling depreciates,
-
Efficient Tax Collection – The government should strengthen tax collection and administration to improve revenue collection without increasing tax rates significantly. This can be done through broadening the tax base while ensuring tax policies are equitable and do not disproportionately burden the lower-income segments of the population,
-
Transparency and Accountability: Maintain transparency in the utilization of borrowed funds and ensure that loans are allocated to projects with measurable returns. Better governance will help to reduce wastage and corruption levels that had impeded proper allocation of funds towards designated projects, resulting in misappropriation of funds,
-
Cut Corruption and Wastage: Corruption and wastage of resources have long been significant impediments to Kenya's economic development. Addressing these issues is crucial for improving public trust and ensuring that borrowed funds and public revenues are used effectively, leading to better outcomes in public service delivery and infrastructure development, ultimately contributing to a more sustainable debt position, and,
-
Monitoring and Reporting: Establish mechanisms for continuous monitoring of debt levels and fiscal health, with regular reporting to stakeholders and the public.
Addressing the public debt issue is a collective effort that requires cooperation among policymakers, stakeholders, and the general public, all working together to secure the country’s financial future and prosperity.
Disclaimer: The views expressed in this publication are those of the writers where particulars are not warranted. This publication, which is in compliance with Section 2 of the Capital Markets Authority Act Cap 485A, is meant for general information only and is not a warranty, representation, advice or solicitation of any nature. Readers are advised in all circumstances to seek the advice of a registered investment advisor.

- Talk to us
- Kenya
- P.O Box 20695 - 00200, Nairobi, Kenya
- Cell +254709101200
- Tel +254709101200
- WhatsApp +254741676635
- United States
- +254709101200
- DOWNLOAD OUR APP
-


- Kenya
- 8th Floor, Pinetree Plaza, Kaburu Drive, Ngong Road, Nairobi, Kenya
- USA
- Suite 1150, 1775 Eye Street NW, USA, Washington DC 20006, USA
- Investments
- High Yield
- Private Equity
- Real Estate
- Real Estate
- RiverRun Estates
- Cytonn Towers
- The Ridge
- Taraji Heights
- The Alma