Lessons for the Kenyan Retail Sector, & Cytonn Weekly #6/2018
By Cytonn Research Team, Feb 11, 2018
Executive Summary
Fixed Income
Treasury bills were oversubscribed during the week, with the overall subscription rate coming in at 132.3%, compared to 138.3% recorded the previous week. Yields on the 91, 182 and 364-day papers remained unchanged at 8.0%, 10.4% and 11.2%, respectively. According to Stanbic Bank’s Monthly Purchasing Manager’s Index (PMI), the business environment in the country remains stable as political tension witnessed in the last half of 2017 continues to dissipate, despite the index declining marginally to 52.9 in January from 53.0 in December 2017; this is the 2nd highest PMI score since December 2016;
Equities
During the week, the equities market was on a downward trend with NASI, NSE 25 and NSE 20 losing 1.0%, 0.8% and 0.5%, respectively, taking their YTD performance to 5.1%, 5.3% and 0.8% for NASI, NSE 25 and NSE 20, respectively. For the last twelve months (LTM) from Feb 2017, NASI, NSE 25 and NSE 20 have gained 43.9%, 38.3% and 28.6%, respectively. The Insurance Regulatory Authority (IRA) released Q3’2017 insurance industry data, which showed growth in total gross insurance premiums of 10.2% y/y to Kshs 173.3 bn in Q3’2017 from Kshs 157.3 bn in Q3’2016, compared to a 7.2% y/y growth registered the previous year;
Private Equity
UK headquartered construction and management consultant, Turner and Townsend, has acquired a 79.5% majority stake in Kenyan based Mentor Management Limited (MML), a project management company, from private Equity firm Actis, for an undisclosed amount. Namibian Stock Exchange listed Capital Pool Company (a capital raising structure, which allows for capital raising and co-investment by various institutional and individual investors in order to seek and develop potential investments), Nimbus, has acquired a 26.5% stake in Paratus Africa, a telecommunication services provider based in Namibia. The deal is valued at 95.0 mn Namibian Dollars (USD 7.8 mn);
Real Estate
During the week, the Kenya Tourism Board released the 2017 Tourism Sector Performance report, which highlighted that despite the extended election period, the tourism sector grew by 20.3% y/y to record earnings of Kshs 120.0 bn in 2017 up from Kshs 99.7 bn in 2016. Deloitte also released their 2017 issue of the African Construction Trends (ACT) report, which revealed that central governments remain the largest project owners in Africa, accounting for between 57.0% to 90.0% of projects tracked per region;
Focus of the Week
The rapid growth of Kenya’s two standout retailers, Uchumi and Nakumatt, not only led to their financial distress, but magnified the corporate governance lapses in their organizations. Where they struggled and failed, international retailers rushed to occupy their positions. Will the current competitive environment and their corporate governance challenges kill them? Is there hope for Kenyan retail?
- At Cytonn we believe in equal opportunities for all, and through Cytonn Foundation, our Corporate Social Responsibility arm, we aim to enhance financial literacy and provide a great environment for people to learn and grow their careers. On 6th February, 2018, Cytonn Foundation handed over the newly built classrooms, ablution block and 120 desks to Friends Secondary School in Dandora, in a handover ceremony that was officiated by Prof. Daniel Mugendi Njiru, Ph.D, Board Chairman, Cytonn Investments. See Event Note
- Cytonn Real Estate, the development affiliate of Cytonn Investments, on Friday 9th February hosted its Distribution Award Ceremony to celebrate milestones achieved by the team in Q4’2017. See Event Note. Cytonn has a great distribution team comprising of both Cytonn-tied Financial Advisors and Independent Advisors. We continuously seek to partner with those who can distribute our products and those looking for a reliable distribution network. If interested, kindly contact us on ifa@cytonn.com
- Our Investment Analyst, Dennis Kariuki, discussed the impact of USA tax cuts on diaspora remittances to Kenya. Watch Dennis on CNBC here
- We continue to hold weekly workshops and site visits on how to build wealth through real estate investments. The weekly workshops and site visits target both investors looking to invest in real estate directly and those interested in high yield investment products to familiarize themselves with how we support our high yields. Watch progress videos and pictures of The Alma, Amara Ridge, The Ridge, and Taraji Heights. Key to note is that our cost of capital is priced off the loan markets, where all-in pricing ranges from 16.0% to 20.0% and our yield on real estate developments ranges from 23.0% to 25.0%, hence our top-line gross spread is about 6.0%. If interested in attending the site visits, kindly register here
- We continue to see very strong interest in our weekly Private Wealth Management Training (largely covering financial planning and structured products). The training is at no cost and is open only to pre-screened participants. We also continue to see institutions and investment groups interested in the trainings for their teams. The Wealth Management Trainings are run by the Cytonn Foundation under its financial literacy pillar. If interested in our Private Wealth Management Training for your employees or investment group please get in touch with us through wmt@cytonn.comor book through this link Wealth Management Training. To view the Wealth Management Training topics, click here
- For recent news about the company, see our news section here
- We have 10 investment-ready projects, offering attractive development and buyer targeted returns of around 23.0% to 25.0% p.a. See further details here: Summary of Investment-Ready Projects
- To invest in any of our current or upcoming real estate projects, please visit Cytonn Real Estate
- Cytonn Towers, where we are only selling residential units in the first phase of residential apartments, is currently about 20.0% sold. See Cytonn Towers
- The Alma phase one which is 55.0% sold. See The Alma
- Amara Ridge has currently 100.0% uptake. See Amara Ridge
- Situ Village is currently 22.0% sold. See Situ Village
- The Ridge (Phase 1) is currently 31.0% sold. See The Ridge
- Taraji Heights is currently 14.0% sold. See Taraji Heights
- RiverRun Estates (Phase 1) is currently 11.0% sold. See RiverRun Estates
- With over 10 investment ready projects worth over Kshs 82.0 billon of project value, we shall be very selective on new real estate projects going forward, only focusing on Joint Ventures and real estate opportunities with deep value. We are increasingly focused on private equity deals. Should you have any deals in banking, insurance, education, hospitality and technology sectors, kindly email a teaser to PE@cytonn.com.
- We continue to beef up the team with ongoing hires for: Operations Business Manager – Cytonn Institute of Building Technology, Software Architect, Business Administration Associate – Procurement, Merchandise Manager and Assistant Editor – Sharpcents Newsletter, among others. Visit the Careers section at Cytonn’s Website to apply.
Treasury bills were oversubscribed during the week, with the overall subscription rate coming in at 132.3%, compared to 138.3% recorded the previous week. The subscription rates for the 91, 182 and 364-day papers came in at 52.4%, 125.1%, and 171.5% compared to 143.0%, 129.6%, and 145.1%, respectively, the previous week. Yields on the 91, 182 and 364-day papers remained unchanged at 8.0% 10.4% and 11.2%, respectively. The overall acceptance rate rose to 99.7% compared to 84.5% the previous week, with the government accepting a total of Kshs 31.7 bn of the Kshs 31.8 bn worth of bids received, against the Kshs 24.0 bn on offer. The government is still behind its domestic borrowing target for the current fiscal year, having borrowed Kshs 194.4 bn, against a target of Kshs 252.4 bn (assuming a pro-rated borrowing target throughout the financial year of Kshs 410.2 bn). If the domestic borrowing target is revised downwards to Kshs 293.8 bn as per the Draft 2018 Budget Policy Statement (BPS) that is yet to receive Cabinet approval, the pro-rated target comes in at Kshs 180.8 bn, meaning the government will be ahead of its borrowing target. The usage of the Central Bank overdraft facility declined by 35.7% to Kshs 29.9 bn from Kshs 46.5 bn the previous week, compared to a nil overdraft at the beginning of this fiscal year.
In January, the Kenyan Government issued a 15-year amortized Infrastructure Bond (IFB 1/2018/15), with an effective tenor of 13.0 years, and a coupon of 12.5%, to raise Kshs 40.0 bn for infrastructural projects in the current fiscal year. The overall subscription rate for the bond issue came in at 139.4%, with the market average bid rate coming in at 13.0%, way above the average accepted rate of 12.5%, resulting in acceptance of just Kshs 5.0 bn worth of bids received, an acceptance rate of 9.0%. The government consequently issued a tap sale on the bond at the accepted weighted average yield of 12.5% to raise Kshs 35.0 bn, and received Kshs 36.2 bn, a 103.5% subscription rate. It appears that rates have been kept artificially low by the government through their rejection of bids they deem expensive, despite pressure from investors who are demanding higher rates.
The average interbank rate declined to 5.5% from 6.3% recorded the previous week, indicating an improvement in liquidity in the money markets with the average volumes traded in the interbank market increasing by 38.7% to Kshs 18.8 bn from Kshs 13.6 bn the previous week. Liquidity improved as a result of government security payments, with T-bill redemptions of Kshs 22.3 bn being paid out.
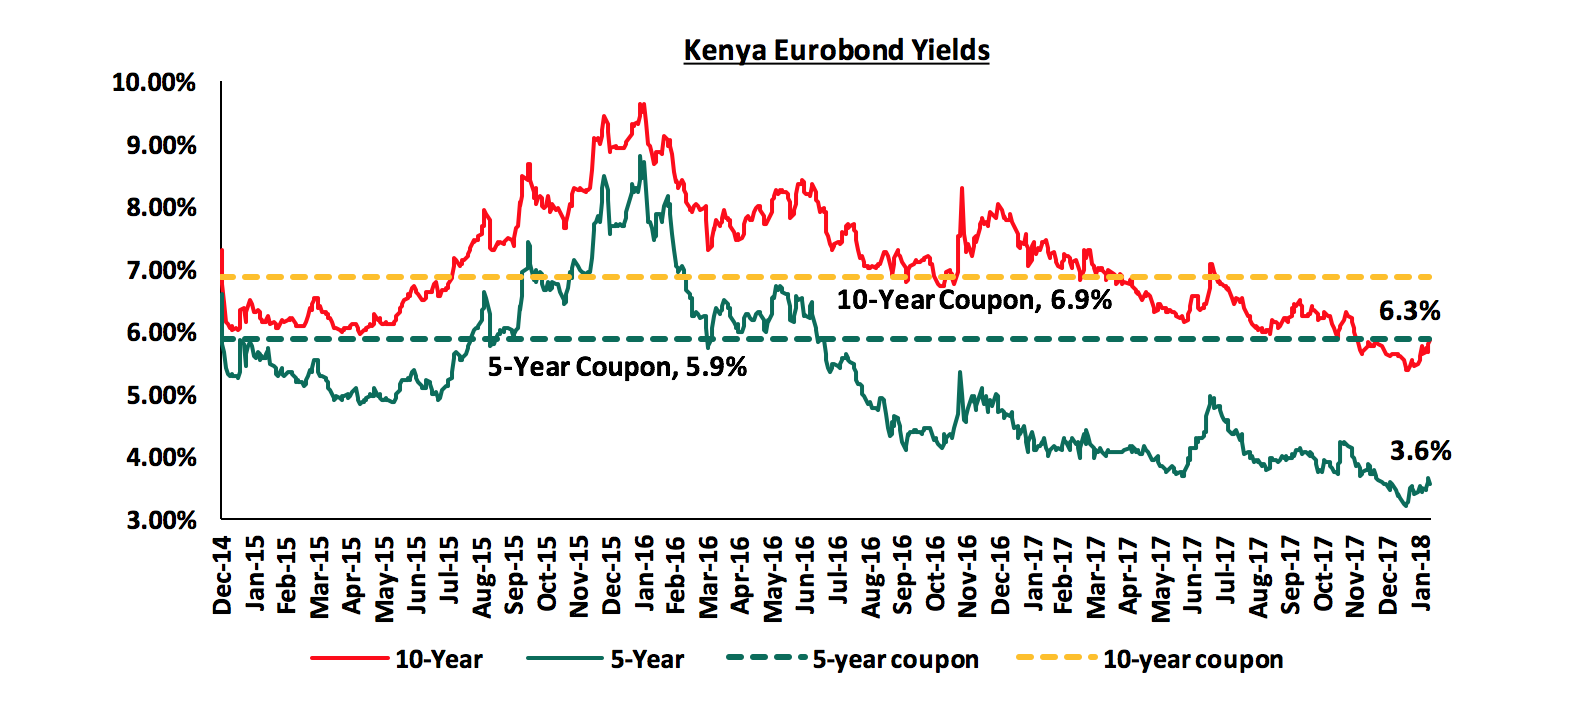
According to Bloomberg, the yield on the 5-year Eurobond declined by 10 bps to 3.6% from 3.7% while the yield on the 10-year Eurobond rose by 40 bps to close at 6.3% from 5.9%, respectively, the previous week. Since the mid-January 2016 peak, yields on the Kenya Eurobonds have declined by 5.2% points and 3.4% points for the 5-year and 10-year Eurobonds, respectively, due to the relatively stable macroeconomic conditions in the country.
The declining Eurobond yields and stable rating by Standard & Poor (S&P) and Fitch Ratings are indications that Kenya’s macro-economic environment remains stable and hence an attractive investment destination. During the week, Fitch Ratings affirmed Kenya’s long-term foreign and local currency Issuer Default Rating (IDR) at ‘B+’, revising its outlook to “stable” from “negative” previously, and affirmed the short-term foreign and local currency IDR at ‘B’. This is good because with the issue of Kenya’s 3rd Eurobond planned for March 2018, a stable outlook can serve to ensure the government obtains the funds at a cheaper rate. However, concerns from Moody’s, the International Monetary Fund (IMF), World Bank and most recently, the African Development Bank (AfDB), around Kenya’s rising debt to GDP levels may see Kenya receive a downgraded sovereign credit rating if high debt levels persist.
The Kenya Shilling appreciated by 0.9% against the US Dollar during the week to a new 1-year high of Kshs 100.8, from Kshs 101.7 the previous week due to increased agricultural exports, largely horticultural products which are mostly grown in greenhouses, that exceeded dollar demand from manufacturers and oil importers. On a YTD basis, the shilling has gained 2.3% against the USD. In our view, the shilling should remain relatively stable against the dollar in the short term, supported by:
- Weakening of the USD in the global markets as indicated by the US Dollar Index, which shed 9.9% in 2017, and has shed 1.9% YTD, and,
- CBK’s intervention activities, as they have sufficient forex reserves, currently at USD 7.2 bn (equivalent to 4.8 months of import cover). Key to note is that the forex reserves have been gradually declining since April 2017, despite the marginal w/w improvement.
According to the Stanbic Bank’s Monthly Purchasing Manager’s Index (PMI), the business environment in the country remains stable as political tension witnessed in the last half of 2017 continues to dissipate, despite the index declining marginally to 52.9 in January from 53.0 in December 2017, the 2nd highest PMI score since December 2016. A PMI reading of above the 50-point mark indicates improvements in the business environment, while a reading below 50 indicates a worsening outlook. Firms reported growth in the value of output, new orders and new export business, despite rising labour and raw material costs that resulted in slightly higher input costs. Output is expected to continue rising, driven by recovery in agricultural produce, mainly horticulture, as the recovery by the Eurozone, which is Kenya’s main horticultural export destination, continues to boost demand. Stanbic maintained their GDP growth projections for 2017 and 2018 at 4.8% and 5.6%, respectively. Fitch Ratings, a global credit rating and research firm, also released their 2018 GDP growth projection this week, expecting 5.5% growth. With output and new export business improving, we maintain our view that the GDP is expected to grow at 5.4% in 2018 supported by the manufacturing, agriculture, real estate, construction and tourism sectors. Below is a table showing that the Kenyan economy is expected to grow by an average of 5.5% as projected by various research houses, global agencies and government organizations. We shall continue to update this table anytime growth outlook is adjusted by these organizations.
|
Kenya 2018 GDP Growth Outlook |
||
|
No. |
Organization |
Jan-18 |
|
1 |
Central Bank of Kenya |
6.2% |
|
2 |
Kenya National Treasury |
6.0%* |
|
3 |
African Development Bank (AfDB) |
5.6% |
|
4 |
Stanbic Bank |
5.6% |
|
5 |
International Monetary Fund (IMF) |
5.5% |
|
6 |
World Bank |
5.5% |
|
7 |
Fitch Ratings |
5.5% |
|
8 |
Barclays Africa Group Limited |
5.5% |
|
9 |
Cytonn Investments Management Plc |
5.4% |
|
10 |
Focus Economics |
5.3% |
|
11 |
Standard Chartered |
4.6% |
|
Average |
5.5% |
|
*expectation by the National Treasury was “above 6.0%”, not exactly 6.0%
In a bid to attract investment in sustainable development initiatives, and promote the green economy development agenda, the government plans to issue Kenya’s first green bond in the fiscal year 2018/19. This comes nearly 2-years after a proposal was tabled by the Nairobi Securities Exchange (NSE) to introduce green bonds to the market in July 2016. A green bond is a long tenor security issued for the funding of projects relating to renewable energy, reduction in emissions and pollution, in a bid to encourage environmentally friendly developments and promote sustainability. Green bond issuance begun to pick up when the International Finance Corporation (IFC) issued a USD 1.0 bn green bond in 2013 n an effort to reduce global greenhouse gas emissions. African Development Bank (AfDB) issued a USD 500.0 mn green bond in 2013 to fund programmes under the Climate Change Action Plan (CCAP) 2011-2015 that worked to mitigate climate change. In 2015, Johannesburg auctioned its first 10-year green bond worth USD 143.0 mn enabling harvesting of organic waste for energy and fuel, installation of electricity and water saving meters, and improvement of the public transport system to encourage less use of personal cars. In our view, the issuance of a green bond will serve to attract more investors into the renewable energy space, diversifying energy sources and increasing foreign direct investment volumes into the country from foreign social investment entities that support green living. However, while we commend innovation, the M-Akiba Bond introduced in Q1’2017 as a way of providing an avenue for smaller retail investors to invest in government securities and encouraging a savings & investment culture in Kenyans, might not have met its purpose. The pilot issue managed to raise Kshs 150.0 mn, 100.0% of its target but the 2nd round that had a target of Kshs 1.0 bn only managed 12.8% of this. As such, prior to issuing the green bond, the government should identify viable projects that fit into the green bond objectives, and educate investors, in order to appeal to the target market, for the bond to be successful in achieving its purpose.
Rates in the fixed income market have remained stable as the government rejects expensive bids despite being behind their borrowing target. However, a budget deficit that is likely to result from depressed revenue collection creates uncertainty in the interest rate environment as any additional borrowing in the domestic market to plug the deficit could lead to upward pressure on interest rates. Our view is that investors should be biased towards short term fixed income instruments to reduce duration risk.
During the week, the equities market was on a downward trend with NASI, NSE 25 and NSE 20 losing 1.0%, 0.8% and 0.5%, respectively, taking their YTD performance to 5.1%, 5.3% and 0.8% for NASI, NSE 25 and NSE 20, respectively. For the last twelve months (LTM), NASI, NSE 25 and NSE 20 have gained 43.9%, 38.3% and 28.6%, respectively. This week’s performance was attributed to losses by select large-cap stocks such as Safaricom, KCB Group, and Equity Group, which lost 2.5%, 1.1% and 1.1%, respectively. Since the February 2015 peak, NASI has gained 1.4% while NSE 20 has lost 32.0%.
Equities turnover increased significantly by 114.9% to USD 65.5 mn from USD 30.5 mn the previous week. Foreign investors remained net sellers with a net outflow of USD 1.2 mn compared to a net outflow of USD 7.6 mn recorded the previous week. We expect the market to remain supported by improved investor sentiment this year, as investors take advantage of the attractive stock valuations.
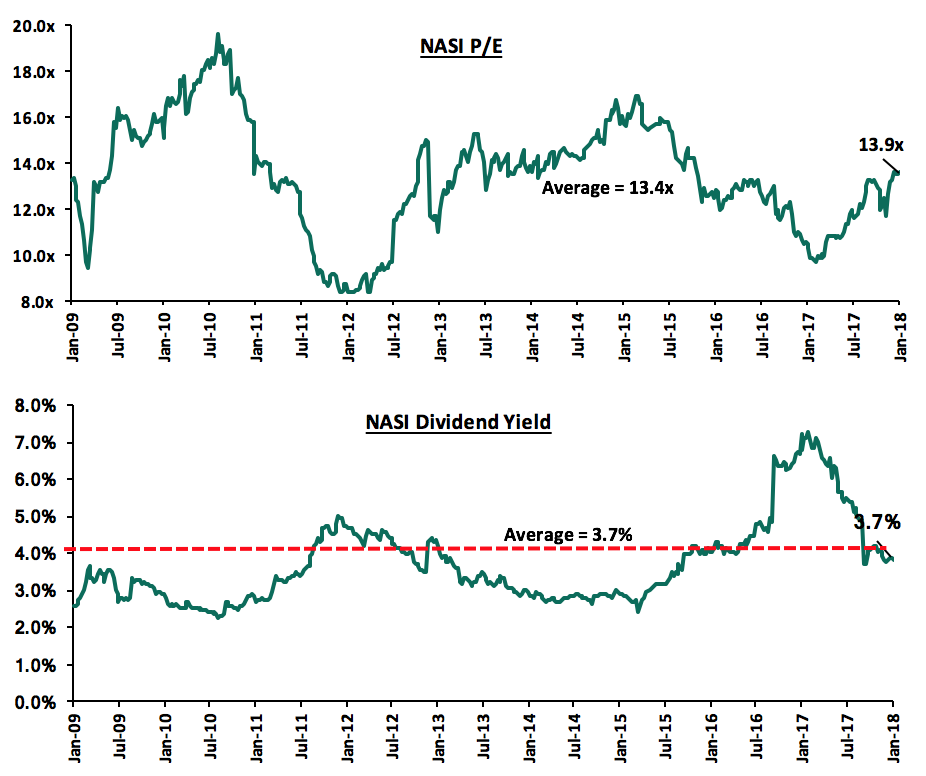
The market is currently trading at a price to earnings ratio (P/E) of 13.9x, which is 3.6% above the historical average of 13.4x, and a dividend yield of 3.7%, similar to the historical average of 3.7%. The current P/E valuation of 13.9x is 43.3% above the most recent trough valuation of 9.7x experienced in the first week of February 2017, and 67.3% above the previous trough valuation of 8.3x experienced in December 2011. In our view, there still exist pockets of value in the market, with the current P/E valuation being 17.9% below the most recent peak of 16.9x in February 2015. The charts below indicate the historical P/E and dividend yields of the market.
Insurance Regulatory Authority (IRA) Q3’2017 Report
IRA released Q3’2017 numbers for the insurance industry with the market recording growth in total gross insurance premiums of 10.2% y/y to Kshs 173.3 bn from Kshs 157.3 bn in Q3’2016, compared to a 7.2% y/y growth registered the previous year. Below is a summary of the key metrics:
|
Income Statement (Kshs bn) |
Q3'2017 |
Q2'2017 |
Q3'2016 |
Y/Y Change (%) |
Q/Q Change (%) |
|
Gross Premium Income |
173.3 |
119.2 |
157.3 |
10.2% |
45.4% |
|
Net Premium Income |
137.2 |
96.0 |
124.5 |
10.1% |
42.9% |
|
Other income |
2.2 |
(2.3) |
9.5 |
(77.3%) |
N/A |
|
Operating Revenue |
139.3 |
93.7 |
134.1 |
3.9% |
48.7% |
|
Claims Incurred and Benefits Paid |
84.3 |
54.6 |
78.7 |
7.2% |
54.5% |
|
Commissions and Management Expenses |
43.8 |
29.7 |
42.2 |
3.8% |
47.6% |
|
Operating Expenses |
128.2 |
84.3 |
120.9 |
6.0% |
52.1% |
|
Profit Before Tax (PBT) |
11.1 |
9.4 |
13.2 |
(15.6%) |
18.4% |
|
Profit After Tax (PAT) |
7.9 |
7.1 |
9.3 |
(15.1%) |
11.3% |
|
Balance Sheet (Kshs bn) |
Q3'2017 |
Q2'2017 |
Q3'2016 |
Y/Y Change (%) |
Q/Q Change (%) |
|
Assets |
574.7 |
564.4 |
509.4 |
12.8% |
1.8% |
|
Shareholders' Funds |
145.7 |
141.3 |
134.6 |
8.2% |
3.1% |
|
Liabilities |
429.0 |
423.1 |
374.8 |
14.5% |
1.4% |
|
Investments |
463.9 |
450.7 |
406.6 |
14.1% |
2.9% |
|
Ratios |
Q3'2017 |
Q2'2017 |
Q3'2016 |
Y/Y Change (%) |
Q/Q Change (%) |
|
Expense Ratio |
32.0% |
30.9% |
33.9% |
(1.9%) |
1.0% |
|
Loss ratio |
61.5% |
56.9% |
63.2% |
(1.7%) |
4.6% |
|
Combined Ratio |
93.5% |
87.8% |
97.1% |
(3.6%) |
5.6% |
Key highlights of the performance in Q3’2017 compared to Q3’2016 include:
- Operating revenue grew by 3.9% to Kshs 139.3 bn from Kshs 134.1 bn, driven by net premium income growth of 10.1% to Kshs 137.2 bn from Kshs 124.5 bn. The growth was driven by a 16.9% increase in the life insurance segment and a 7.2% growth in the general insurance segment. Just as is the case with most African countries with low insurance penetration rates, the non-life segment remained dominant, contributing 64.0% (Kshs 110.9 bn), while long-term business contributed 36.0% (Kshs 62.5 bn) of the total premiums during the period,
- Operating expenses grew by 6.0% y/y to Kshs 128.2 bn in Q3’2017 from Kshs 120.9 bn, attributed to (i) a 7.2% increase in claims incurred and benefits paid to Kshs 84.3 bn from Kshs 78.7 bn, and (ii) a 3.8% increase in commissions and management expenses to Kshs 43.8 bn from Kshs 42.2 bn,
- The sector recorded a marginal improvement in operational efficiency with the loss ratio declining to 61.5% from 63.2%. The expense ratio also declined slightly to 32.0% from 33.9% attributed to a faster growth in premiums compared to expenses. This led to the combined ratio declining to 93.5% from 97.1%,
- Total assets held by the insurance sector grew by 12.8% to Kshs 574.7 bn from Kshs 509.4 bn in Q3’16 driven by a 14.1% growth in investments to Kshs 463.9 bn from Kshs 406.6 bn following increased investments in government securities that made up 52.9% of total investments, and,
- Shareholders’ funds grew by 8.2% to Kshs 145.7 bn from Kshs 134.6 bn in Q3’2016.
The current insurance business model is recording minimal profits as depicted by the high expense and loss ratios. The general business segment is loss making, with the segment’s expense ratio for Q3’2017 coming in at 38.3% and the loss ratio at 62.5%, effectively resulting in a combined ratio of 100.8%. The minimal profits in the industry are therefore, supported by the life segment, which recorded expense and loss ratio of 23.3% and 60.1%, respectively, translating to a combined ratio of 83.4%. We expect increased product innovation and operational efficiency to drive profitability and thus growth of the sector amidst the heightened regulation. The Insurance Regulatory Authority (IRA) is at the forefront of this initiative, pushing for (i) the observance of prudential guidelines, (ii) better corporate governance of insurance companies, (iii) increased transparency in financial reporting, and (iv) use of a risk-based approach to capitalization, with varying risk charges on respective investment options.
Global equities market recorded steady declines during the week following release of the United States January employment data at the end of last week, which showed that the US economy added 200,000 jobs and the unemployment rate remained steady at 4.1%. In addition to the strong increase in employment, monthly wages also rose 0.3% m/m, translating to an annualized increase of 2.9%, which is expected to eventually lead to an increase in inflation. Investors and market participants viewed the rising inflation expectations as a signal that the Federal Reserve may actually move to raise interest rates 4 times this year, up from the consensus view of 3 rate hikes, ending the era of low borrowing costs. The higher inflation expectations also caused the US 10-Year bond yield to rise to 2.85%, closer to the psychological level of 3.0%, on the prospects of more interest rate hikes. These higher yields from risk free papers caused investors to sell their risky assets, causing a decline in equities. The magnitude and pace of the selling of US equities caused a spiral reaction in global markets, with stocks in the Eurozone, Asia, and Japan also experiencing heavy selling over the week, with indices such as Shanghai Composite, MSCI Emerging Markets, and EURO 300 losing 9.6%, 8.5% and 7.4%, respectively. We expect the equities market to experience exits by investors especially due to tightening of monetary policies in most economies.
The Capital Markets Authority (CMA) has approved licensing of Execution Point Limited, a subsidiary of British-based Divisa UK Limited, to operate as a non-dealing online foreign exchange broker, making it the first licensee after implementation of the Capital Markets (Online Foreign Exchange Trading) Regulations, 2017, which came into effect last year. A non-dealing online foreign exchange broker acts as a link between the foreign exchange market and the client by providing a trading platform over which clients can trade electronically, in return for a commission, but is not allowed to engage in buying and/or selling of foreign currencies. As per the CMA regulations, non-dealing foreign exchange brokers have capital requirements of Kshs 30.0 mn, while the dealing online brokers face stricter regulations with minimum paid-up capital of Kshs 50.0 mn. We view the licensing as a positive move as it will open up our foreign exchange market to global markets and enlighten more local investors on the global financial markets.
Trading of Unga Group on the Nairobi Securities Exchange (NSE) has been suspended, pending Capital Market Authority’s (CMA) approval of its buyout by two of the firm’s major shareholders. Seaboard Corporation, a Delaware-based multinational, which owns 2.9% of Unga Group, is acting in concert with Victus Limited, which owns 50.9%, to buy out the minority shareholders at Kshs 40.0 per share. Unga Group was trading at Kshs 29.3 per share before its suspension, implying that the buyout is being carried out at a premium of 36.8%, and with issued shares at 75.7 mn, the offer values Unga Group at Kshs 3.0 bn. If approved by CMA, Seaboard’s stake in the company will increase to 49.1% from the current 2.9%, while Victus’ shareholding will remain at 50.9% as they do not wish to increase current shareholding. Unga Group’s performance has been deteriorating mainly affected by adverse weather conditions, which affected supply and cost of raw materials. The group issued a profit warning for FY’2017 results as a result of expected decline in earnings. We view the proposed buy-out as part of the turn-around strategy adopted by the two top shareholders to improve profitability of the group.
In an effort to keep our rankings of companies on the Cytonn Corporate Governance Ranking (Cytonn CGR) Report up-to-date, we continually update the rankings whenever there are changes on any of the 24 metrics that we track, and how this affects the company ranking. This week, NIC Bank appointed three non-executive directors to the board; Ms Wakini Ndegwa, Mr Jonathan Somen and Mr Philip Lopokoiyit. NIC Bank’s score based on our 24 metrics has declined to 66.7% from 68.8%, following an increase in the board size to an even number 14 from an odd number 11. Diversity in the board in terms of gender however improved to 21.4% from 18.2% previously. NIC now ranks at position 23 from position 22.
Below is our Equities Universe of Coverage:
|
all prices in Kshs unless stated otherwise |
||||||||
|
No. |
Company |
Price as at 02/02/18 |
Price as at 09/02/18 |
w/w Change |
YTD Change |
Target Price* |
Dividend Yield |
Upside/ (Downside)** |
|
1. |
NIC*** |
36.8 |
35.8 |
(2.7%) |
5.9% |
61.4 |
3.5% |
75.2% |
|
2. |
KCB Group |
45.8 |
45.3 |
(1.1%) |
5.8% |
59.7 |
6.6% |
38.6% |
|
3. |
DTBK |
205.0 |
210.0 |
2.4% |
9.4% |
281.7 |
1.3% |
35.4% |
|
4. |
Barclays |
10.7 |
10.6 |
(0.9%) |
10.4% |
12.8 |
9.4% |
30.2% |
|
5. |
Liberty Holdings |
13.1 |
12.7 |
(3.1%) |
4.1% |
16.4 |
0.0% |
29.1% |
|
6. |
I&M Holdings |
116.0 |
119.0 |
2.6% |
(6.3%) |
150.4 |
2.5% |
28.9% |
|
7. |
Kenya Re |
19.8 |
19.6 |
(1.0%) |
8.3% |
24.4 |
3.8% |
28.4% |
|
8. |
Britam |
13.2 |
13.0 |
(1.5%) |
(3.0%) |
15.2 |
1.8% |
19.2% |
|
9. |
Jubilee Insurance |
500.0 |
500.0 |
0.0% |
0.2% |
575.4 |
1.7% |
16.8% |
|
10. |
Co-op Bank |
16.7 |
17.0 |
1.8% |
6.3% |
18.6 |
5.4% |
14.8% |
|
11. |
CIC Group |
5.6 |
5.5 |
(1.8%) |
(1.8%) |
6.2 |
1.8% |
14.5% |
|
12. |
Sanlam Kenya |
28.0 |
28.3 |
0.9% |
1.8% |
31.4 |
1.1% |
12.1% |
|
13. |
HF Group*** |
10.7 |
10.6 |
(0.9%) |
1.9% |
11.7 |
0.8% |
11.4% |
|
14. |
Stanbic Holdings |
82.0 |
81.0 |
(1.2%) |
0.0% |
79.0 |
5.1% |
2.7% |
|
15. |
Equity Group |
43.8 |
43.3 |
(1.1%) |
8.8% |
42.3 |
4.2% |
2.0% |
|
16. |
Standard Chartered |
205.0 |
207.0 |
1.0% |
(0.5%) |
201.1 |
4.3% |
1.4% |
|
17. |
NBK |
9.0 |
9.0 |
0.0% |
(4.3%) |
5.6 |
0.0% |
(37.8%) |
|
*Target Price as per Cytonn Analyst estimates |
||||||||
|
**Upside / (Downside) is adjusted for Dividend Yield |
||||||||
|
***Banks in which Cytonn and/or its affiliates holds a stake |
||||||||
|
For full disclosure, Cytonn and/or its affiliates holds a significant stake in NIC Group Plc., ranking as the 8th largest shareholder |
||||||||
We maintain a “NEUTRAL” recommendation on equities for investors with short-term investment horizon since the market has rallied and brought the market P/E slightly above its’ historical average. However, pockets of value exist, with a number of undervalued sectors like Financial Services, and with expectations of higher corporate earnings this year, the market will be cheaper for long-term investors hence we are “POSITIVE” for investors with long-term horizon.
In the real estate sector, UK headquartered construction and management consultant, Turner and Townsend, has acquired a 79.5% majority stake in Kenyan based Mentor Management Limited (MML), a project management company from private Equity firm Actis for an undisclosed amount. The management team of MML will retain the minority stake. Actis acquired MML in 2011 for an undisclosed amount. The transaction will see Turner and Townsend’s Kenyan business merge with MML to form MML Turner & Townsend, which will be operating in the real estate, infrastructure and natural resource industries in Kenya. MML has been involved in projects such as the 11,000 square meter cargo handling facility for Swissport, the construction management of Garden City and a new chancery for the Australian High Commission in Kenya. The acquisition follows another acquisition of a significant stake in Kenya’s quantity surveying firm YMR by Mace, a UK-based global construction and consultancy firm, in October 2017, highlighting the growing interest in the real estate sector in Sub Saharan Africa by global firms. The acquisitions are strategic as they come at a time when Kenya’s real estate and construction industry is on the rise, driven by (i) a high urbanization rate of 4.4% against the global average of 2.1%, leading to a rise in demand for housing, (ii) expanding middle class with increased disposable income, with the country’s disposable income having increased to Kshs 7.4 tn in 2016 from Kshs 6.5 tn in 2015 as per Kenya National Bureau of Statistic’s Economic Survey 2017, (iii) Kenya’s housing deficit of approximately 2.0 mn units with an increasing annual shortfall of 200,000 units, and (iv) better operating environment for developers, characterised by tax relief of 15.0% for developers developing more than 100 affordable housing units per annum, scrapping of the land title search fees, NEMA application fees and NCA levy, digitization of lands ministry and the relaxation of zoning regulations that will facilitate optimal land use in areas such as Spring Valley, Kileleshwa and Riverside Drive and political calmness.
In the telecommunication, media and technology (TMT) sector, Namibian Stock Exchange listed Capital Pool Company (a capital raising structure which allows for capital raising and co-investment by various institutional and individual investors in order to seek and develop potential investments), Nimbus, has acquired a 26.5% stake in Paratus Africa, a telecommunication services provider in Namibia, which offers fourth generation (4G) wireless broadband network solutions, wireless data communications, and voice communication solutions. The transaction was carried out in two parts with the whole transaction valued at 95.0 mn Namibian Dollars (USD 7.8 mn), effectively valuing the company at NAD 358.5 mn (USD 29.4 mn) post transaction. The deal was structured in the following 2 transactions:
- Nimbus acquired an 8.0% stake of Paratus, pre-dilution from an existing shareholder, Cuvelai which owned 33.9% in Paratus, for a cash payment of 20.0 mn Namibian Dollars. This reduced Cuvelai’s shareholding to 25.9%, and,
- Paratus allotted and issued new shares to Nimbus, for 75.0 mn Namibian Dollars, resulting in a dilution of 20.1% for existing shareholders.
The table below shows the effective percentage shareholding before and after the 2 transactions:
|
|
Shareholder |
Percentage Shareholding Before Transaction |
Percentage Shareholding After First Transaction |
Percentage Shareholding After Second Transaction |
|
1. |
Nimbus |
0.0% |
8.0% |
26.5% |
|
2. |
Cuvelai |
33.9% |
25.9% |
20.7% |
|
3. |
Others |
66.1% |
66.1% |
52.8% |
|
Total Percentage Shareholding |
100.0% |
100.0% |
100.0% |
Nimbus financed the acquisition through funds raised during their October 2017 private placement in which they raised 100.0 mn Namibian Dollars. The transaction is strategic to Nimbus as it (i) allows for diversification of Nimbus’ revenue and expansion of its investments to other countries such as Angola in which Paratus operates, and (ii) will see the majority of the capital raised by Nimbus invested into a viable asset, which shall result in Nimbus making a transition from a Capital Pool Company (CPC) to a fully-fledged listed company on the Namibian Stock Exchange mainboard. The Telecommunication Sector in sub-Saharan Africa (SSA) continues to attract investments, both from foreign and local investors, driven by (i) increased capital looking for investments in the sector, driven by both the sector’s higher potential exit valuation compared to other sectors, such as the banking stocks, informed by their current higher trading multiples, with select listed Telcos in SSA trading at a higher P/E of 17.9x compared to the SSA Banking Sector, which is trading at a P/E of 8.1x, and long term fundamental growth potential, with increased growth in mobile penetration in Africa, which is currently at 43.0%, and is expected to hit 51.2% by 2020, and (ii) increased technological advancement in the financial services sector, which is highly dependent on the telco industry.
Private equity investments in Africa remains robust as evidenced by the growing number of successful exits. The increasing investor interest is attributed to (i) rapid urbanization, a resilient and adapting middle class and increased consumerism, (ii) the attractive valuations in Sub Saharan Africa’s private markets compared to its public markets, (iii) the attractive valuations in Sub Saharan Africa’s markets compared to global markets, and (iv) better economic projections in Sub Sahara Africa compared to global markets. We remain bullish on PE as an asset class in Sub-Sahara Africa. Going forward, the increasing investor interest and stable macro-economic environment will continue to boost deal flow into African markets.
During the week, Deloitte released their 2017 issue of the African Construction Trends (ACT) report, which highlights the general trends in the construction industry in Africa. The report included 303 projects valued at USD 50.0 mn and above, that had broken ground by 1st June 2017, spread between 38 out of 54 African countries. Key take-outs from the report were:
- Central governments remain the largest project owners in Africa accounting for between 57.0% to 90.0% of projects tracked per region, which is an indicator that the strength of the private sector varies in magnitude in the various regions in Africa,
- Real estate accounts for the second highest number of projects at 68 projects, accounting for 22.4%, of all the projects in Africa after the transport sector at 36.0%,
- China is the most prolific builder of projects constructing 28.1% of projects while private domestic firms had 22.1% showing the increasing penetration of Chinese contractors,
- East Africa, a region that includes Comoros, Djibouti, Burundi, Kenya, Ethiopia, Rwanda, Somalia, Seychelles, and Tanzania, has 71 active projects all valued at USD 32.6 bn accounting for 23.4% of Africa’s projects. Notably in East Africa:
- The region recorded the highest growth in Africa with the number of projects and their values increasing by 65.1% and 19.0% y/y, respectively, between 2016 and 2017, from 43 to 71 projects while their values rose from USD 27.4 bn. to USD 32.6 bn,
- Real estate projects account for 10 of the projects, which is 14.1% of cumulative projects in East Africa between 2016 and 2017, while other sectors, for instance, energy and power, transport and water accounting for 22.5%, 52.1% and 5.6%, respectively,
- Governments are the largest owners of projects at 90.1% while the private sector has only 9.9%, highlighting a huge disparity in the involvement of the private sector, compared to other regions. In the private sector in East Africa, domestic firms own the least share at 4.2% compared to 5.6% attributed to international firms from China, the US and Singapore. The graph below tracks regional project share for governments and the private sector:
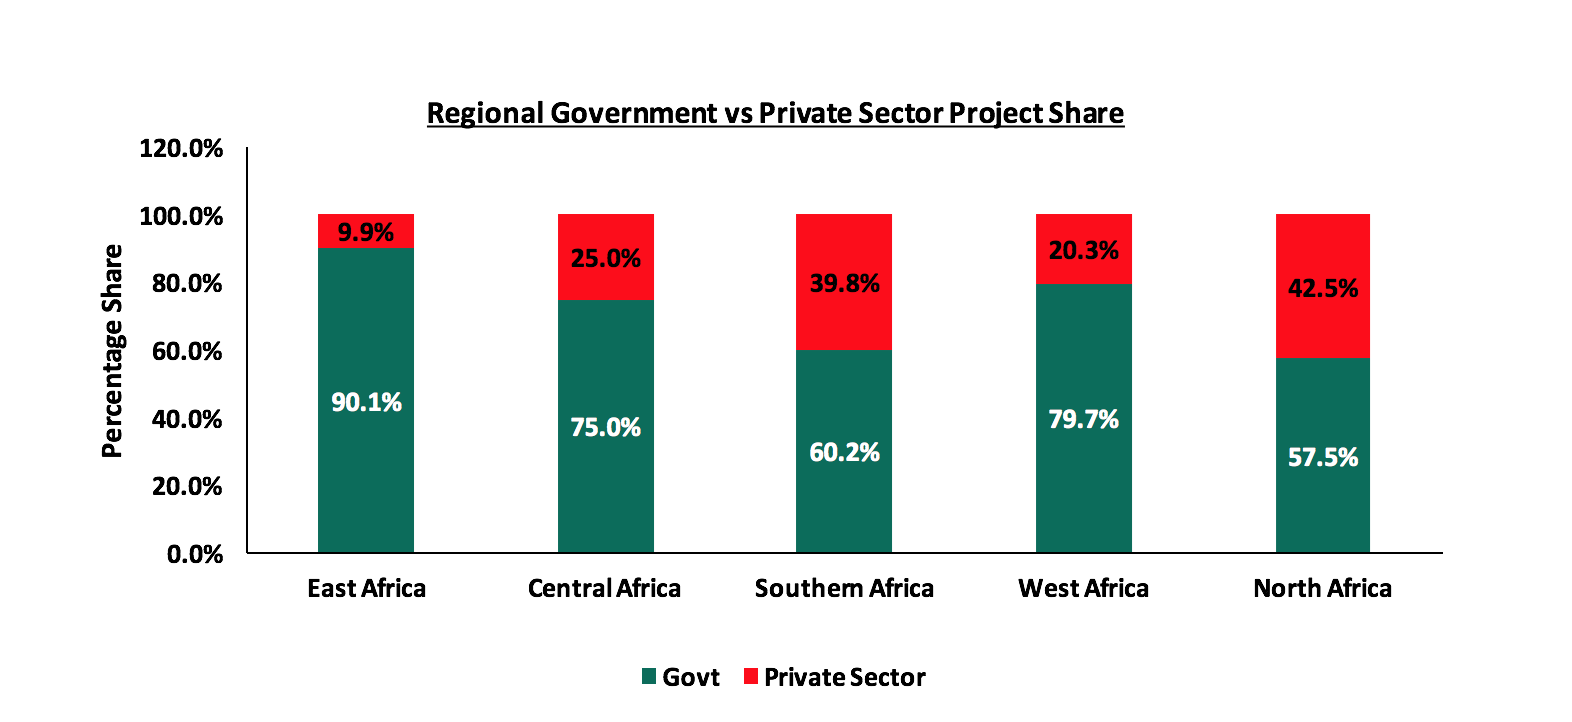
Source: Deloitte
From the above, it is evident that the involvement of the private sector in East Africa is still nascent, compared to other regions. In our view, the main factors impeding growth include inadequate infrastructure and lack of access to financing. For instance, it is noted that with the capping of interest especially in the Kenyan economy, private sector credit growth has slowed down, coming to an average of 2.4% 2017, compared to a 5-year average of 14.0%. In our view, investment in infrastructure and capital projects is an important aspect for enabling GDP growth and more diversified economic and private sector activity. By providing access to basic services such as water, education and healthcare, infrastructure ensures that economic growth is sustainable and inclusive.
In the residential sector, this week, real estate firm Lordship Africa, a subsidiary of European Lordship group, unveiled a Kshs 5.0 bn (exclusive of land costs) - 44-floor condominium, in Upperhill, Nairobi The development dubbed the 88 Nairobi Condominium is set to be the tallest residential development in the African region and features studios, 1, 2, 3 and 4-bed units targeting corporate and executive employees looking for residential units in the Upper Hill area. The serviced luxury development will cost Kshs 11.5 mn and Kshs 35.0 mn, for 1 and 2 bed units, respectively, which translates to Kshs 239,583 and Kshs 353,535 price per square meter (SQM) for the units compared to the luxury market at Kshs 180,252 and Kshs 206,511 per SQM, respectively; with projected monthly rental rates of Kshs 185,400 and Kshs 288,400 for the two units, respectively. Assuming current market occupancy rates of 54.8% for 1 beds and 34.7% for 2 beds for luxury serviced apartments, the units will generate yields of 10.6% and 3.4%, respectively. The low yields for the 2 bed units can be attributed to high sales prices that lengthens the period taken to recoup funds. Key to note, is that the prices per SQM for the 1 and 2 bed units respectively are 32.9% and 72.1% higher than the market averages, the current market averages are Kshs 180,252 and Kshs 206,511 for the 1 and 2 bed units, respectively. Prices for the 3 and 4-bed units are yet to be disclosed.
The developers, Lordship Africa, will rely on debt, equity and presales to fund the development that is expected to break ground in April 2018 and be complete by mid-2020, a project duration which in our opinion seems quite ambitious. The development highlights the trend in development of luxury properties in Nairobi driven by (i) the 93.0% growth of high net worth individuals between 2006 and 2016 who allocate at least 25.0% of their wealth to real estate according to Cytonn Nairobi Luxury Apartment Market Update 2017, (ii) the changing tastes and increasingly sophisticated lifestyles of consumers, (iii) Kenya’s positioning as a regional hub, and (iv) presence of multinational firms who create demand for up-market housing. Further, according to our research, as highlighted in our Cytonn Nairobi Luxury Apartment Market Update 2017, the luxury market has relatively high rental yields of 8.1% compared to standard apartments with yields of 5.2%, thus ideal for investors seeking attractive rental yields and to preserve capital.
In the hospitality sector, the Kenya Tourism Board released the 2017 Tourism Sector Performance Report. Despite the extended electioneering period, the tourism sector grew by 20.3% y/y to record earnings of Kshs 120.0 bn from Kshs 99.7 bn in 2016. The report noted that the number of international arrivals rose by 4.5% y/y from 1.3 mn visitors in 2016 to 1.4 mn visitors in 2017 as a result of marketing efforts by the government especially in H1’2017, and improved security. It is noted that the number of international visitors from the United States, UK and Uganda improved by 17.0%, 11.1% and 6.4%, respectively. The graph below shows the trend in international arrivals from 2011 - 2017. This is in tandem with our Nairobi Hospitality Sector Report, where we had projected an increase in arrivals of 6.2% from 1.3 mn to 1.4 mn arrivals as well as earnings by 4.2% from 99.7 mn to 103.9 mn arrivals supported by increased government marketing efforts and improved security. We expect the performance to continue in the same trend increasing by 15.0% from 1.4 mn arrivals to 1.6 mn arrivals between 2017 and 2018.
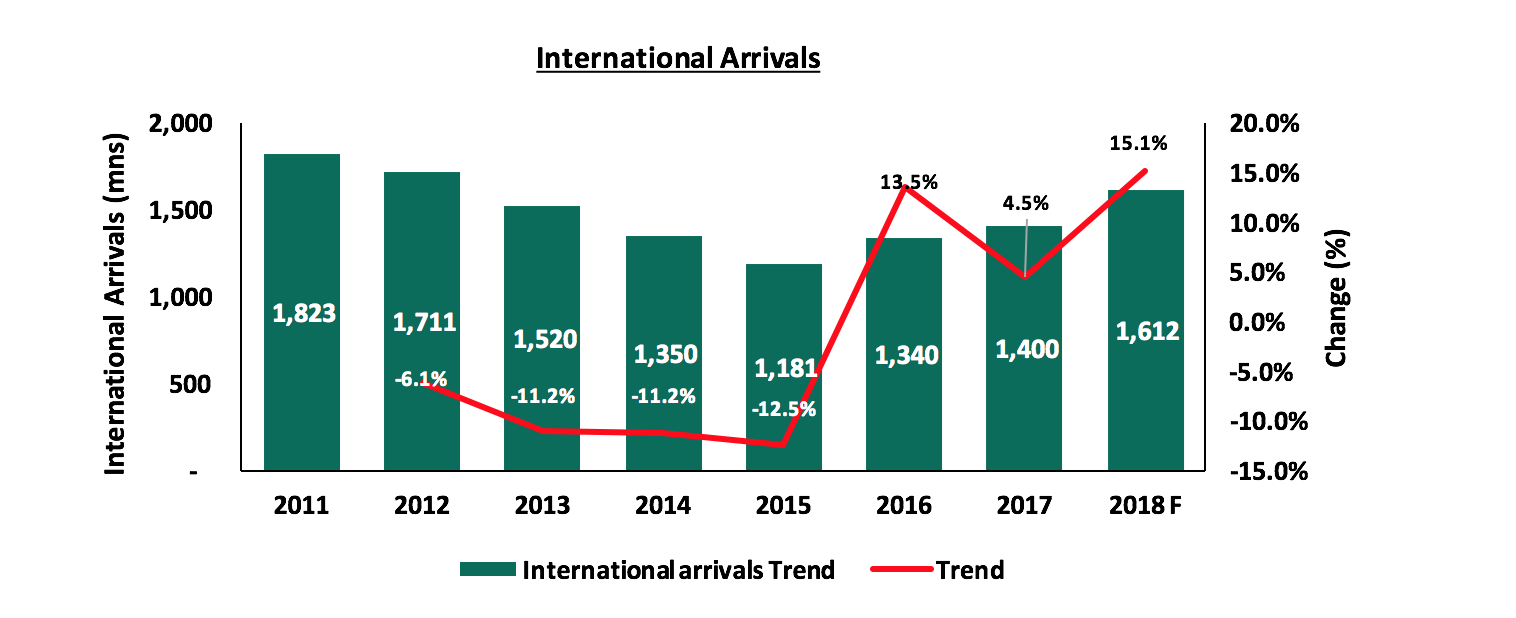
Source: KTB
We expect the sector to record even better performance in 2018 due to the return of calm after the end of the 2017 elections. The number of international arrivals is expected to increase for both travel and business tourists.
The other highlight in the real estate sector during the week was that in a bid to provide connectivity for American tourists travelling to Mauritius, Kenya Airways will in June, launch 4 weekly flights to Mauritius. The route is expected to complement Air Mauritius’ exiting operations.
Our outlook for the real estate sector is positive following the return of political calm after the end of the protracted electioneering period, increased investor traction in the sector evidenced by increased activity and direct government interest with state announcing a 5-year strategy to construct 1.0mn units to ease the housing deficit.
According to the Kenya National Bureau of Statistics (KNBS), wholesale and retail trade is the 5th largest contributor to Kenya’s GDP and the 3rd largest contributor to private sector employment. In 2016, wholesale and retail trade employed 238,500 Kenyans and accounted for 8.4% of Kenya’s GDP. Moreover, according to Nielsen, a leading global information and measurement company, shifting consumer trends has driven growth in formal retail, with 30.0% of the Kenyan population now shopping in formal retail establishments compared to 4.0% in Ghana and 2.0% in Cameroon and Nigeria. This is the second highest in Sub-Saharan Africa after South Africa, which has a formal retail penetration of 60.0%.
Given the recent challenges faced by two local players, this week’s Focus Note examines what led to their current distress and then draws lessons learnt, by looking at the following areas:
- Overview of Kenya’s Retail Industry,
- Analyzing the Drivers of Kenya’s Retail Industry,
- The Current State of Kenyan Retail,
- The Trouble with Rapid Growth / Growth by Default, and
- Providing a Path to Success for Kenyan Retailers.
- Overview of Kenya’s Retail Industry
Years of robust GDP growth, increased purchasing power, and shifting consumer habits have accelerated transformation of the Kenyan retail market. Kenya’s largest chains, Nakumatt and Uchumi, were positioned to be the main beneficiaries of the economic trends that drove more Kenyans into formal retail. Both chains owned flagship stores in Nairobi, Mombasa and Kisumu’s major catchment areas and served as the largest distributors for local consumer goods manufacturers. However, the opportunity in Kenya’s retail market attracted continental and international brands, spurring competition in the sector. As competition intensified, both chains drove aggressive expansion plans; often at the expense of their suppliers and shareholders. Beyond the main larger chains, outfits like Tusky’s, Naivas and Ukwala appealed to the average customer with outlets close to matatu and bus terminals. While these chains were financially successful, they all aspired to the traffic, footprint and prime locations to match Uchumi and Nakumatt.
The industry is currently well represented by both local and international franchises, some of which are highlighted in the table below. Key industry players include Carrefour Kenya (a franchise owned by Majid al Futtaim Group of the UAE), Tuskys, Nakumatt, Uchumi, Massmart (trading in Kenya as Game), Choppies (which acquired Ukwala Supermarkets), Naivas, and many local brands such as Mulley’s, Eastmart, Quickmart and Cleanshelf. The entry of Carrefour, Game, and Choppies has in part been aided by the recent woes facing Nakumatt and Uchumi.
|
Retailers Operating In Kenya |
||
|
Name of Retailer |
Store Count (Jan 2017) |
Percentage of Total |
|
Tusky's |
58 |
29.1% |
|
Nakumatt* |
45 |
22.6% |
|
Naivas |
39 |
19.6% |
|
Uchumi |
25 |
12.6% |
|
Choppies / Ukwala |
10 |
5.0% |
|
Eastmart |
9 |
4.5% |
|
Chandarana Stores |
8 |
4.0% |
|
Carrefour |
4 |
2.0% |
|
Game Stores (Massmart) |
1 |
0.5% |
|
Total |
199 |
100.0% |
|
Source: Cytonn Investments Research *Nakumatt has been updated for branches closed |
||
B. Analyzing the Drivers of Kenya’s Retail Industry
Having got an overview of Kenya’s retail sector, we now analyze the key drivers of the retail sector in Kenya. The growth of the retail industry in the decade to 2017 has been driven by;
- GDP Growth boosting disposable income & consumer spending - Kenya’s economy grew by 5.8% on average between 2012 and 2016, lifting household incomes and increasing consumption expenditures. The average value of a shopper’s basket increased by 67.0% to USD 20 (Kshs 2,016) between 2011 and 2017, making Kenya the fastest growing retail market in Sub-Saharan Africa. Additionally, according to KNBS, private consumption expenditure accounted for 79.0% of Kenya’s GDP in 2016. It increased from Kshs 3.3 tn (USD 38.5 bn) to Kshs 5.7 tn (USD 55.4 bn) during the same period, an average annual growth rate of 11.3%.
- Real Estate Investment - Real estate investments, notably residential malls and mixed-use developments, have driven the expansion of the Kenyan retail sector. In 2017 alone, Nairobi’s available retail space grew by 41.6%, from 3.9 mn square feet in of space in 2016 to 5.6 mn square feet. Moreover, mall operators preferred larger chains such as Nakumatt and Uchumi as anchor tenants, reasoning that they would attract more foot traffic.
- Changing consumer tastes & preferences, and globalization- The increase in disposable income that has come with GDP growth has also made Kenyan shoppers more aware of global retail trends and more demanding of the local shopping experience, goods and services.
Key Profitability Margins in the Industry:
In order to drive the retail business, supermarket chains rely on selling large volumes of goods at small margins. Consequently, gross and operating margins across the industry are low. Chains create value for owners primarily by adding new stores (growth) and improving their operations, distribution and supply networks to improve margins. Successful retailers are able to maintain reasonable operating and net margins while executing their growth strategy. Below are some of the operating margins of some industry players:
|
FY 2016 Operating Results |
||||||
|
|
Continental Retailers |
International Retailers |
||||
|
Margin |
Uchumi |
Choppies |
Shoprite Stores |
Massmart |
Costco Wholesale |
Target Corp |
|
Gross Margin |
15.2% |
21.2% |
24.0% |
19.0% |
13.3% |
29.7% |
|
Operating (EBIT) Margin |
(30.8%) |
1.6% |
5.5% |
2.9% |
3.2% |
7.2% |
|
Net Margin |
(44.1%) |
0.8% |
3.9% |
1.4% |
2.1% |
3.9% |
|
Choppies entered the Kenyan market with the acquisition of Ukwala Supermarkets Ltd Game Stores represent Massmart in Kenya with an outlet in Garden City |
||||||
From the above table, it is key to note that:
- Gross, Operating and Net Margins are low across the retail industry,
- Thin margins leave little room for any inefficiencies if a chain is to maintain profitability, and,
- Value is created by minimizing operating costs (increasing the EBIT margin) and growing volumes by adding stores.
C: The Current State of Kenyan Retail
For decades, it was business as usual for Kenya’s largest retailers - Uchumi and Nakumatt. There was little competition and plenty of room for expansion as long as competitors had little geographical overlap. Suppliers had little choice but to extend favorable terms as they had few alternatives in their distribution networks. Forgoing one large chain in favor of another meant ceding precious revenue to the competition. High end and middle-class consumers also had few options; either make several trips to the neighborhood kiosk or visit one of two large chains at which everything could be found. Beyond the large chains, then smaller outfits like Tusky’s, Naivas and Ukwala competed for the average customer with outlets close to matatu and bus terminals. While smaller chains were financially successful, they all aspired to achieve the traffic, footprint and prime locations to match Uchumi and Nakumatt.
Ambition, ample opportunity and tolerant investors provided the fuel for growth in the retailers’ expansion strategy. Between 1997 and 2004, Uchumi borrowed Kshs 3.6 bn to double its store footprint, growing from 10 outlets to 25 across Nairobi, Mombasa and Kampala. Nakumatt Supermarkets also grew from 10 outlets in 2002 to 42 in 2013 and 64 in 2016. In the same period, Tusky’s and Naivas also grew to 60 and 40 outlets, respectively. In 1997, Uchumi pioneered the hypermarket concept with Ngong Hyper, showing that larger footprint stores with embedded retailers could be successful. Uchumi subsequently replicated the concept in Lang’ata Hyper.
Rapid expansion without realizing their return on investment led to Uchumi’s insolvency in 2006 and the subsequent suspension from the Nairobi Stock Exchange. Uchumi’s 2006 insolvency should have warned the industry that such a growth model was unsustainable. However, banks continued to lend to Uchumi while investors offered more capital in subsequent rights issues. In 2005 and 2014, Uchumi shareholders oversubscribed to rights issues that added a total of Kshs 2.0 bn (Kshs 1.2 bn in 2005 and Kshs 0.9 bn in 2014) to company accounts while cumulatively diluting their holdings by 33.0% in 2005 and 28.0% in 2014. The funds were subsequently used to plug losses in Uchumi’s Tanzania and Kampala operations as well as to repay suppliers in Kenya; this was despite investment memoranda that stated they would be used in expanding the store footprint.
Rapid growth has posed the following challenges for Kenyan retailers:
- Thin margins and poor capital management make it difficult to expand without borrowing,
- Saturation makes selecting catchment areas to launch new stores a challenge,
- Competition limits traffic growth for new stores as areas become more saturated,
- High borrowing costs make it difficult for new stores to achieve profitability,
- Thin working capital cushions often mean that retailers have to choose between paying off debt and making payments to suppliers,
- Investments in fixed real estate strain returns to shareholders (Returns on Equity), and,
- Poor governance and oversight ensures that the same mistakes are repeated.
D: The Trouble with Rapid Growth/ Growth by Default
Uchumi and Nakumatt were not prepared for the new phase of growth initiated by real estate expansion. Years of mismanagement had left them with no internally sourced funds (retained earnings). As such, the only alternatives for funding new stores were internal cash flows (generated by delaying supplier payments), and bank debt.
Delaying supplier payments was the preferable source of funding because late payments accrued no interest. However, because short-term funds were used to fund long-term capital expenditures (a duration mismatch), chains required adequate liquidity (either from new loans from banks or commercial paper) or from stores that quickly ramped up sales to remain liquid. The other solution to the liquidity problem was to reduce initial expenditure for new stores with operating leases.
In addition to the initial capital expenditure, new stores had the following operating costs, coming to approximately 32.0% of all revenue:
- VAT (13.0% - 14.0% of revenues)
- Electricity costs- lighting, refrigerators and chiller units (1.0% of revenues)
- Rent and service charges (1.0% of revenues)
- Depreciation (1.0% of revenues)
- Labour, finance, distribution and administrative costs (15.0% of revenues)
Both new and existing stores had the same average cost outlays. However, costs for existing stores would rise by 7.0% annually. To remain profitable, they had to grow revenues by at least 7.0% p.a. Revenue growth for these stores (Same Store Sales Growth) would come from:
- Traffic Growth - Increases in the number of regular visitors to each store, and
- Ticket Growth – Increases in the average basket size per regular visitor.
As a result, management had the following responsibilities:
- Stewarding existing stores to ensure they met growth targets,
- Containing cost escalation for existing stores, and,
- Grow traffic to new stores to ensure they grew revenues.
Uchumi and Nakumatt are emblematic of the challenges above. Even as new stores added to revenues, management struggled to contain costs and grow traffic. Furthermore, financing pressures from increased debt depressed profitability and returns on equity.
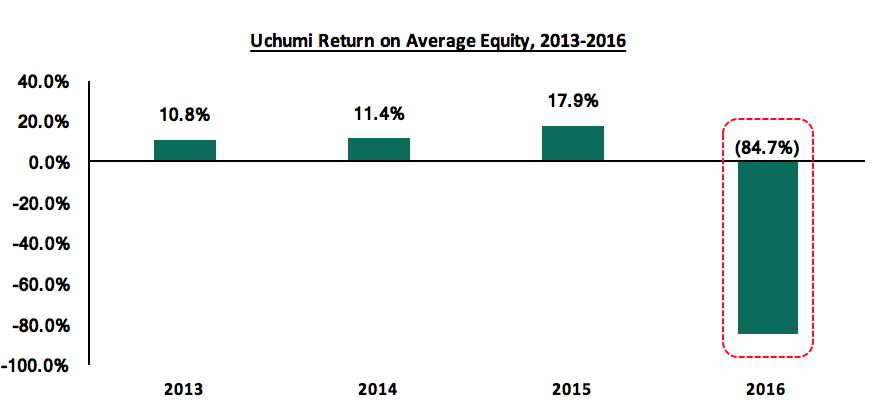
Mounting losses pushed Uchumi’s Return on Equity to a negative 84.7% in 2016
In comparison to continental and international retailer, Uchumi’s Cash Conversion Cycle (CCC) worsened from 1.2 days in 2012 to (282.2) days during the latest financial year:
|
Cash Conversion Cycle: Latest Financial Year |
||||||
|
|
Uchumi |
Choppies |
Shoprite Stores |
Massmart |
Costco Wholesale |
Target Corp |
|
DSI (Days to Sell Inventories) |
18.9 |
52.6 |
60.6 |
58.3 |
32.1 |
62.1 |
|
DSO (Days to Collect Receivables) |
12.7 |
9.8 |
13.2 |
18.7 |
4.1 |
5.8 |
|
DPO (Days to Pay Suppliers) |
(313.7) |
(52.0) |
(59.3) |
(96.9) |
(31.3) |
(54.2) |
|
CCC: (Total Days to convert sales to cash) |
(282.2) |
10.5 |
14.5 |
(19.9) |
4.9 |
13.7 |
During the same period (2012-2015), shareholder returns also suffered with Uchumi’s book value contracting by 259.5% to Kshs 0.7 bn in 2015 from Kshs 2.7 bn in 2012.
An Uchumi shareholder lost 88.0% of the amount they invested between 2004 and 2017 and was better off investing in the broader NSE 20 Index, which gained 37.0% during the period.
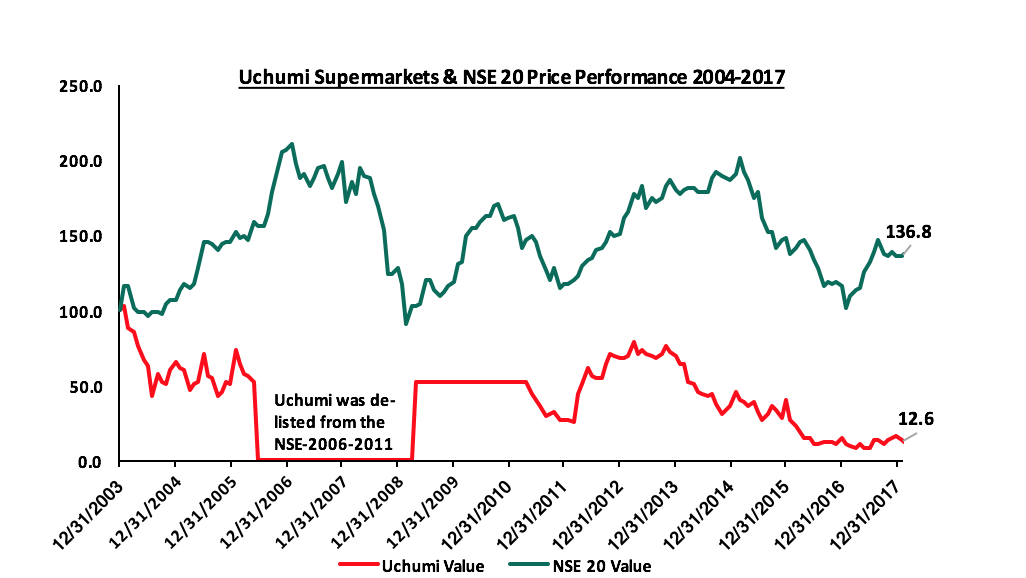
Table 3: Uchumi/NSE 20- Price Performance, 2004-2017. KSh 100 invested in Uchumi in 2004 would only be worth Kshs 0.12 in 2014; a 1- year compounded loss rate of 19.1% p.a.
Capital Structure
For any business, striking the right balance between the debt and equity into the business is key especially during the growth phase. The financing mix for continental retailers was on average 20.0% debt and 80.0% retained earnings. Successful retailers worldwide were also better able to pay off the interest on their debt, the average retailer generated 22.3x their annual interest payments in operating income. Below is a list of some of the ratios used to track the above:
|
Capital & Financing Mix |
|||||||
|
|
CONTINENTAL RETAILERS |
INTERNATIONAL RETAILERS |
|
||||
|
Ratio |
Uchumi, FY 2016 |
Choppies |
Shoprite Stores |
Massmart |
Costco Wholesale |
Target Corp |
Average |
|
Debt to Equity Ratio |
- 0.13x |
0.31x |
0.17x |
0.57x |
0.44x |
1.12x |
0.52x |
|
Interest coverage ratio |
1.21x |
51.78x |
16.13x |
8.14x |
29.00x |
6.50x |
22.31x |
|
Selected solvency ratios for Uchumi and international retailers
|
|||||||
By and large, successful chains deploy little to no leverage when expanding their operations. Expansion is financed by retained earnings. Choppies Supermarkets, for example, acquired Ukwala Supermarkets with internally generated funds from its listing on the Johannesburg Stock Exchange.
E: Providing a Path to Success for Kenyan Retailers
Our analysis finds that Kenyan retailers can succeed by:
- Implementing good corporate governance: The strategic missteps that led to Uchumi and Nakumatt’s current situation were exacerbated by poor governance. The Capital Markets Authority (CMA), twice investigated Uchumi management and auditors for errors contained in the offering memoranda for the two rights issues in 2005 and 2014. Furthermore, leadership teams ignored the lessons learned from previous business failures. Kenya’s public and privately-owned retail chains would benefit from having experienced finance and investment professionals in senior management roles and opening their boards to participation from independent investment management professionals.
- Forging partnerships with private equity firms: We find that family owned and managed firms would benefit from the capital and expertise offered by private equity firms seeking to invest in the country. The long-term capital gained by selling equity stakes to PE firms would alleviate the need to borrow for expansion. Furthermore, external owners would also enforce good corporate governance by insisting on proper processes and procedures.
- Properly planning for growth/ new stores - Nairobi is currently saturated with retail outlets. The Thika Road area featured two anchor Nakumatt outlets in TRM and Garden City Malls. These are now closed. Furthermore, Chandarana Supermarkets features two outlets, one at Rosslyn Riviera and a second at Two Rivers Mall, only 5 minutes away. Chandarana Supermarkets also has an outlet at Yaya Centre and another at Ad-Life Plaza, only 5 minutes away. Both outlets compete for the same pool of consumer in Ngong Road and Kilimani areas.
- Maintain the right capital structure: Nakumatt’s experience has shown that debt and forgoing supplier payments are poor sources of funding for long term growth. Kenya’s retailers should continuously ensure that they are not significantly past the right leverage ratios and this could even mean selling some stake in the company to get equity.
- Operational efficiency - Chains should not continue to support stores that don’t generate their own income. In the past, Uchumi used funds from rights issues to support the ailing operations of stores in Uganda and Tanzania. Had the company exited these markets earlier, shareholders would have avoided millions of shillings in losses. Additionally, introducing store level financial reporting to better quantify individual store performance for investors is another way to enhance operational efficiency. It is common practice for global retailers to report average metrics for individual stores i.e. average store opening costs, time to profitability, working capital needs per store, average store size, average store cash flows and expenses in their annual reports. This information empowers investors, lenders and suppliers in their assessment of the chain’s profitability, and we are of the view that this should be adapted locally.
There are still opportunities for success in Kenyan owned retail. However, the entry of international competition has made the industry less tolerant of poor governance and a poorly executed strategy. Kenyan retail is not dead; it is now maturing in the face of competition.
Disclaimer: The views expressed in this publication, are those of the writers where particulars are not warranted. This publication, which is in compliance with Section 2 of the Capital Markets Authority Act Cap 485A, is meant for general information only, and is not a warranty, representation, advice or solicitation of any nature. Readers are advised in all circumstances to seek the advice of a registered investment advisor.

- Talk to us
- Kenya
- P.O Box 20695 - 00200, Nairobi, Kenya
- Cell +254709101200
- Tel +254709101200
- WhatsApp +254741676635
- United States
- +254709101200
- DOWNLOAD OUR APP
-


- Kenya
- 8th Floor, Pinetree Plaza, Kaburu Drive, Ngong Road, Nairobi, Kenya
- USA
- Suite 1150, 1775 Eye Street NW, USA, Washington DC 20006, USA
- Investments
- High Yield
- Private Equity
- Real Estate
- Real Estate
- RiverRun Estates
- Cytonn Towers
- The Ridge
- Taraji Heights
- The Alma