Nairobi Metropolitan Area Commercial Office Report 2025, & Cytonn Weekly #10/2025
By Research team, Mar 9, 2025
Executive Summary
Fixed Income
During the week, T-bills were oversubscribed for the fifth consecutive week, with the overall subscription rate coming in at 210.7%, higher than the subscription rate of 152.3% recorded the previous week. Investors’ preference for the shorter 91-day paper persisted, with the paper receiving bids worth Kshs 24.0 bn against the offered Kshs 4.0 bn, translating to an oversubscription rate of 598.8%, from the oversubscription rate of 448.9% recorded the previous week. The subscription rates for the 182-day and 364-day papers increased to 124.4% and 141.7% respectively from the to 69.0% and 117.0% recorded the previous week. The government accepted a total of Kshs 42.5 bn worth of bids out of Kshs 50.6 bn bids received, translating to an acceptance rate of 84.1%. The yields on the government papers were on a downward trajectory with the yields on the182-day paper decreasing the most by 8.9 bps to 9.15% from 9.24% recorded the previous week. The yields on the 91-day and 364-day papers decreased by 1.4 bps and 0.3 bps respectively to 8.92% and 10.50% from 8.94% and 10.50% respectively recorded the previous week;
During the week, the Central Bank of Kenya released the auction results for the re-opened treasury bond FXD1/2018/025, with a tenor to maturity of 18.3 years and a fixed coupon rate of 13.4%. The bond was oversubscribed, with the overall subscription rate coming in at 188.0%, receiving bids worth Kshs 47.0 bn against the offered Kshs 25.0 bn. The government accepted bids worth Kshs 35.2 bn, translating to an acceptance rate of 75.0%. The weighted average yield for the accepted bids for theFXD1/2018/025 came in at 13.8%, slightly below our expectation of a range of 13.85%-14.55%. Notably, the 13.8% is higher than the 13.5% rate recorded in the last auction in November 2020. With the Inflation rate at 3.5% as of February 2025, the real return of the FXD1/2018/025 is 10.3%. 14.6%;
During the week the Government of Kenya released the results of the USD 900.0 mn Eurobond buyback. Kenya had invited bondholders to sell their bonds for cash, at USD 1,002.5 per USD 1,000.0, plus the accrued interest payments on the notes, with the offer closing on 3rd March 2024. The offer was undersubscribed, receiving a total amount of USD 579.7 mn tendered by investors, translating to a subscription rate of 64.4%, falling short of the maximum possible buyback amount of USD 900.0 mn. As a result, Kenya was unable to fully retire the bond as planned, leaving USD 320.3 mn of the bond still outstanding,which will need to be repaid at maturity;
Also, during the week, Stanbic Bank released its monthly Purchasing Manager's Index (PMI) highlighting that the index for the month of February 2025 increased slightly, coming in at 50.6, up from 50.5 in January 2025, signaling another marginal improvement in business conditions. This marked the fifth month that index is above the 50.0 neutral mark. Increased output, new orders and employment growth supported the marginal improvement;
Equities
During the week, the equities market was on an upward trajectory, with NSE 20 gaining the most by 1.6%, while NSE 25, NASI and NSE 10 gained by 1.4%, 1.2% and 0.9% respectively, taking the YTD performance to gains of 13.6%, 6.7%, 5.4% and 3.9% for NSE 20, NASI, NSE 25 and NSE 10, respectively. The equities market performance was driven by gains recorded by large-cap stocks such as Stanbic, DTB Kenya and NCBA-Kenya of 9.4%, 3.2%, and 3.0% respectively. The gains were however, weighed down by losses recorded by large-cap stocks such as BAT, Equity and KCB Bank of 1.2%, 0.4%, and 0.4% respectively.
During the week Stanbic released their FY’2024 financial results, highlighting that Stanbic Holding’s Profit After Tax (PAT) increased by 12.8% to Kshs 13.7 bn, from Kshs 12.2 bn in FY’2023. The performance was mainly driven by a 14.2% decrease in Total Operating Expense to Kshs 20.8 bn, from Kshs 24.2 bn in FY’2023, which outpaced the 3.8% decline in total operating income to Kshs 39.7 bn, from Kshs 41.3bn in FY’2023;
Real Estate
During the week, there were discussions surrounding President William Ruto’s affordable housing initiative that have sparked concerns about the project’s transparency, financial viability, and long-term sustainability. Critics argue that the ambitious program, which aims to address Kenya’s housing deficit by constructing low-cost units across the country, may suffer from inadequate oversight mechanisms and unclear funding structures. One major red flag involves the proposed financing model, which relies on a mandatory levy collected from workers and employers. Although the government contends that this levy will help pool resources for the construction of affordable homes, skeptics question the wisdom of imposing additional financial burdens on citizens already grappling with high living costs. They also point to a lack of clarity on how the funds will be managed, raising fears of potential misallocation or misuse.
On the Unquoted Securities Platform, Acorn D-REIT and I-REIT traded at Kshs 25.4 and Kshs 22.2 per unit, respectively, as per the last updated data on 7th March 2025. The performance represented a 27.0% and 11.0% gain for the D-REIT and I-REIT, respectively, from the Kshs 20.0 inception price. Additionally, ILAM Fahari I-REIT traded at Kshs 11.0 per share as of 7thMarch 2025, representing a 45.0% loss from the Kshs 20.0 inception price;
Focus of the Week
In 2024, we published the Nairobi Metropolitan Area Commercial Office Report 2023 themed ‘Persisting Tenant’s Market’. The report provided an in-depth analysis of the sector's performance in 2023, along with insights into future prospects and investment opportunities. According to the report, the sector experienced notable improvements, with average rental yield improving by 0.1% points to 7.7% in FY’2023 from 7.6% recorded in FY’2022, due to improved occupancy and rental rates. Average asking rents per SQFT in the NMA increased by 7.0% to Kshs 103 per SQFT from Kshs 96, owing to increased availability of high-quality Grade A office spaces, exemplified by Regus, Ikigai, and Spaces, which command premium rents. The overall occupancy rates increased by 0.1% points to 79.5% from 79.4% as a result of a slow but rising demand for physical space. Also, the report noted that, Westlands emerged as the top-performing node, boasting an average rental yield of 8.5%, surpassing the market average of 7.7% by 0.8% points. Gigiri followed closely as the second-best performing node, achieving an average rental yield of 8.2%. Karen secured the third position with an average rental yield of 8.0%. The Nairobi Metropolitan Area (NMA) commercial office sector experienced a consistent oversupply of office space, amounting to 5.8 million square feet (SQFT), a figure comparable to that of 2022. This surplus was primarily due to the increase of the new development adding more space into the market and a slow absorption of the existing spaces, thus limiting the influx of additional office space into the market. In 2025, we update our previous research with the Commercial Office Report 2025 themed ‘Supply-Heavy Market, in order to determine the market’s performance and analyze the ongoing trends;
Investment Updates:
- Weekly Rates: Cytonn Money Market Fund closed the week at a yield of 16.0% p.a. To invest, dial *809# or download the Cytonn App from Google Play store here or from the Appstore here;
- We continue to offer Wealth Management Training every Tuesday, from 7:00pm to 8:00 pm. The training aims to grow financial literacy among the general public. To register for any of our Wealth Management Trainings, click here;
- If interested in our Private Wealth Management Training for your employees or investment group, please get in touch with us through wmt@cytonn.com;
- Cytonn Insurance Agency acts as an intermediary for those looking to secure their assets and loved ones’ future through insurance namely; Motor, Medical, Life, Property, WIBA, Credit and Fire and Burglary insurance covers. For assistance, get in touch with us through insuranceagency@cytonn.com;
- Cytonn Asset Managers Limited (CAML) continues to offer pension products to meet the needs of both individual clients who want to save for their retirement during their working years and Institutional clients that want to contribute on behalf of their employees to help them build their retirement pot. To more about our pension schemes, kindly get in touch with us through pensions@cytonn.com;
Hospitality Updates:
- We currently have promotions for Staycations. Visit cysuites.com/offers for details or email us at sales@cysuites.com;
Money Markets, T-Bills Primary Auction:
During the week, T-bills were oversubscribed for the fifth consecutive week, with the overall subscription rate coming in at 210.7%, higher than the subscription rate of 152.3% recorded the previous week. Investors’ preference for the shorter 91-day paper persisted, with the paper receiving bids worth Kshs 24.0 bn against the offered Kshs 4.0 bn, translating to an oversubscription rate of 598.8%, from the oversubscription rate of 448.9% recorded the previous week. The subscription rates for the 182-day and 364-day papers increased to 124.4% and 141.7% respectively from the to 69.0% and 117.0% recorded the previous week. The government accepted a total of Kshs 42.5 bn worth of bids out of Kshs 50.6 bn bids received, translating to an acceptance rate of 84.1%. The yields on the government papers were on a downward trajectory with the yields on the182-day paper decreasing the most by 8.9 bps to 9.15% from 9.24% recorded the previous week. The yields on the 91-day and 364-day papers decreased by 1.4 bps and 0.3 bps respectively to 8.92% and 10.50% from 8.94% and 10.50% respectively recorded the previous week
The charts below show the yield performance of the 91-day, 182-day and 364-day papers from January 2024 to March 2025: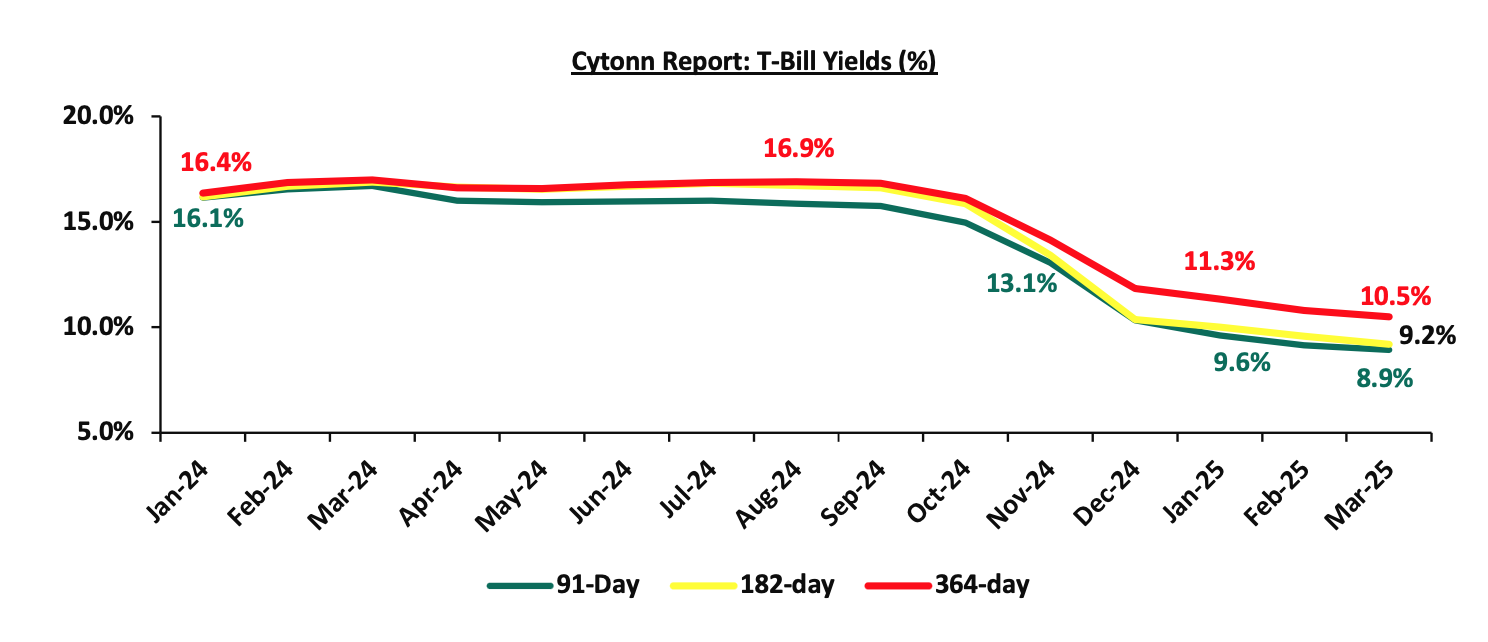
The chart below shows the yield growth for the 91-day T-bill: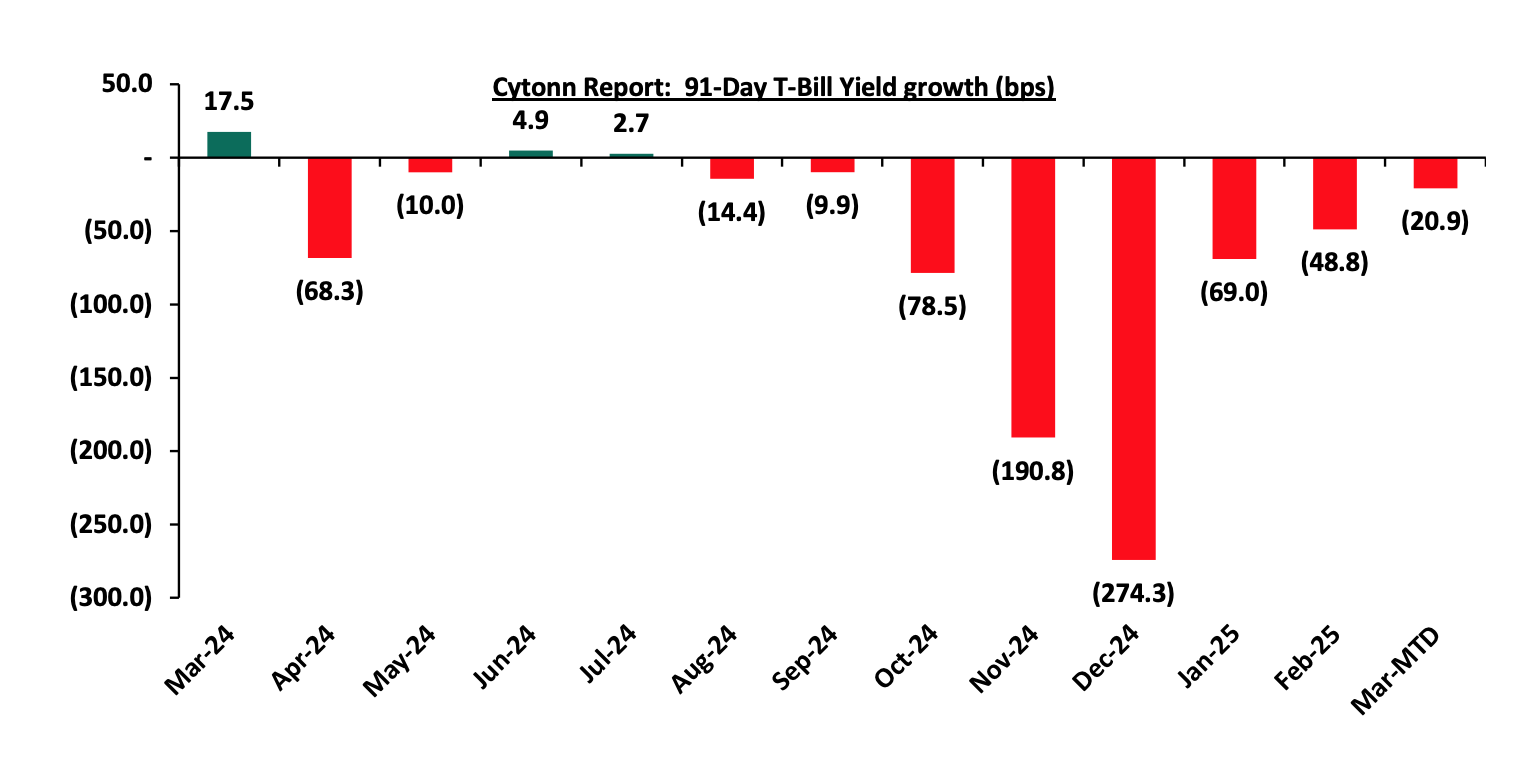
The chart below compares the overall average T-bill subscription rates obtained in 2022,2023, 2024 and 2025 Year-to-date (YTD):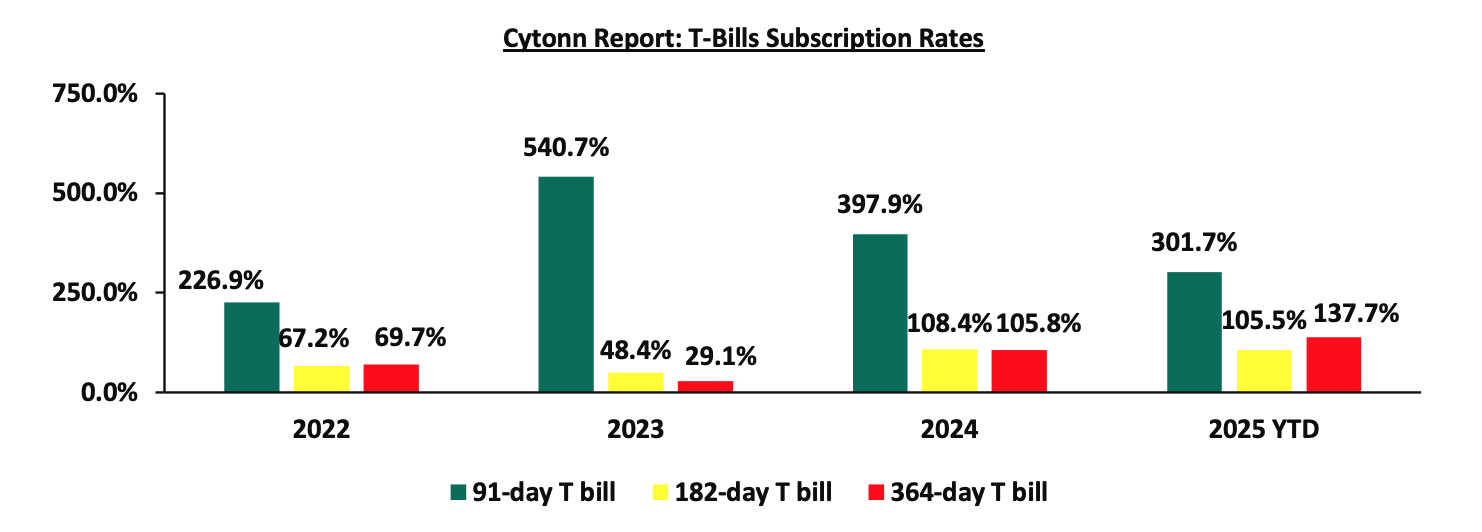
During the week, the Central Bank of Kenya released the auction results for the re-opened treasury bond FXD1/2018/025, with a tenor to maturity of 18.3 years and a fixed coupon rate of 13.4%. The bond was oversubscribed, with the overall subscription rate coming in at 188.0%, receiving bids worth Kshs 47.0 bn against the offered Kshs 25.0 bn. The government accepted bids worth Kshs 35.2 bn, translating to an acceptance rate of 75.0%. The weighted average yield for the accepted bids for theFXD1/2018/025 came in at 13.8%, slightly below our expectation of a range of 13.85%-14.55%. Notably, the 13.8% is higher than the 13.5% rate recorded in the last auction in November 2020. With the Inflation rate at 3.5% as of February 2025, the real return of the FXD1/2018/025 is 10.3%;
Money Market Performance:
In the money markets, 3-month bank placements ended the week at 10.9% (based on what we have been offered by various banks), and the yields on the government papers were on a downward trajectory with the yields on the 91-day and 364-day papers decreasing marginally by 1.4 bps and 0.3 bps to remain relatively unchanged from the 8.9% and 10.5% recorded the previous week. The yield on the Cytonn Money Market Fund decreased by 6.0 bps to 16.0% from the 16.1% recorded the previous week, while the average yields on the Top 5 Money Market Funds decreased by 5.8 bps to close the week at 15.5%, from the 15.6% recorded the previous week.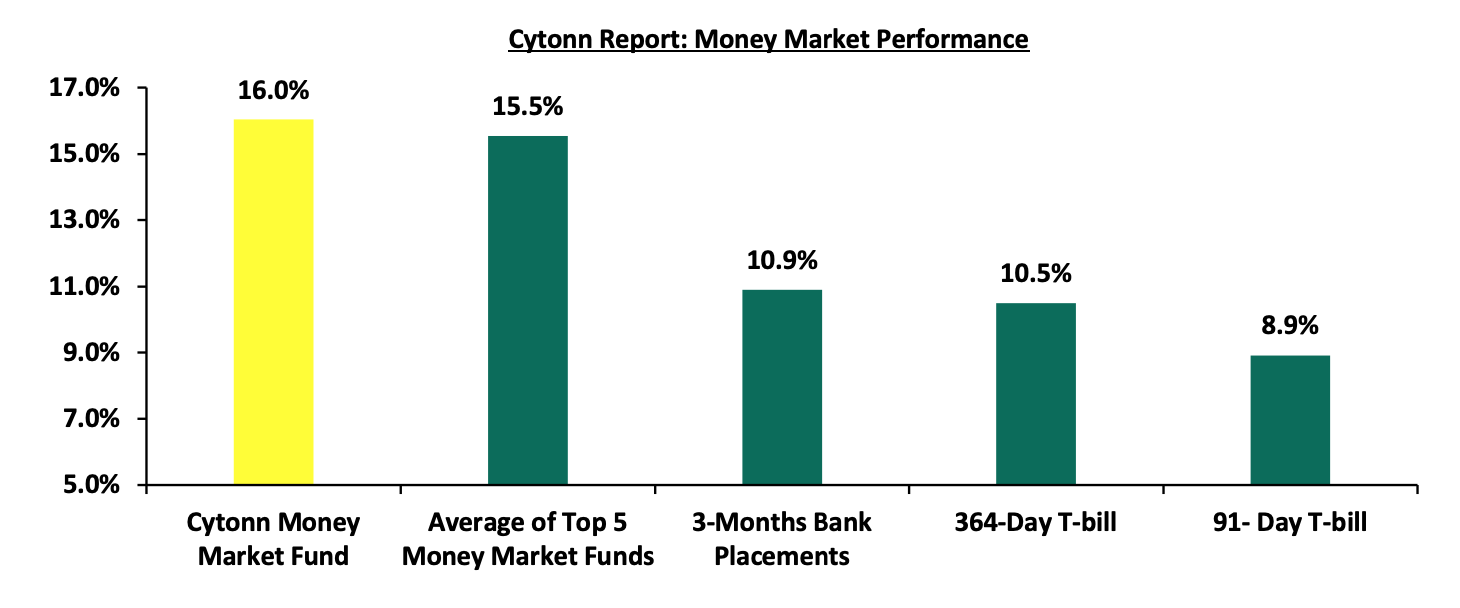
The table below shows the Money Market Fund Yields for Kenyan Fund Managers as published on 7th March 2025:
|
Cytonn Report: Money Market Fund Yield for Fund Managers as published on 7th March 2025 |
||
|
Rank |
Fund Manager |
Effective Annual Rate |
|
1 |
Gulfcap Money Market Fund |
16.25% |
|
2 |
Cytonn Money Market Fund (Dial *809# or download the Cytonn app) |
16.04% |
|
3 |
Ndovu Money Market Fund |
15.51% |
|
4 |
Mali Money Market Fund |
15.24% |
|
5 |
Lofty-Corban Money Market Fund |
14.66% |
|
6 |
Etica Money Market Fund |
14.61% |
|
7 |
Kuza Money Market fund |
14.33% |
|
8 |
Arvocap Money Market Fund |
14.09% |
|
9 |
Orient Kasha Money Market Fund |
13.50% |
|
10 |
Enwealth Money Market Fund |
12.81% |
|
11 |
Genghis Money Market Fund |
12.80% |
|
12 |
British-American Money Market Fund |
12.75% |
|
13 |
GenAfrica Money Market Fund |
12.61% |
|
14 |
Old Mutual Money Market Fund |
12.50% |
|
15 |
Madison Money Market Fund |
12.49% |
|
16 |
Dry Associates Money Market Fund |
12.38% |
|
17 |
Sanlam Money Market Fund |
12.32% |
|
18 |
Apollo Money Market Fund |
12.26% |
|
19 |
Faulu Money Market Fund |
12.17% |
|
20 |
Jubilee Money Market Fund |
11.99% |
|
21 |
Nabo Africa Money Market Fund |
11.95% |
|
22 |
Co-op Money Market Fund |
11.86% |
|
23 |
ICEA Lion Money Market Fund |
11.43% |
|
24 |
CIC Money Market Fund |
11.20% |
|
25 |
KCB Money Market Fund |
11.20% |
|
26 |
Absa Shilling Money Market Fund |
11.11% |
|
27 |
AA Kenya Shillings Fund |
10.68% |
|
28 |
Mayfair Money Market Fund |
9.68% |
|
29 |
Stanbic Money Market Fund |
8.89% |
|
30 |
Ziidi Money Market Fund |
7.31% |
|
31 |
Equity Money Market Fund |
6.83% |
Source: Business Daily
Liquidity:
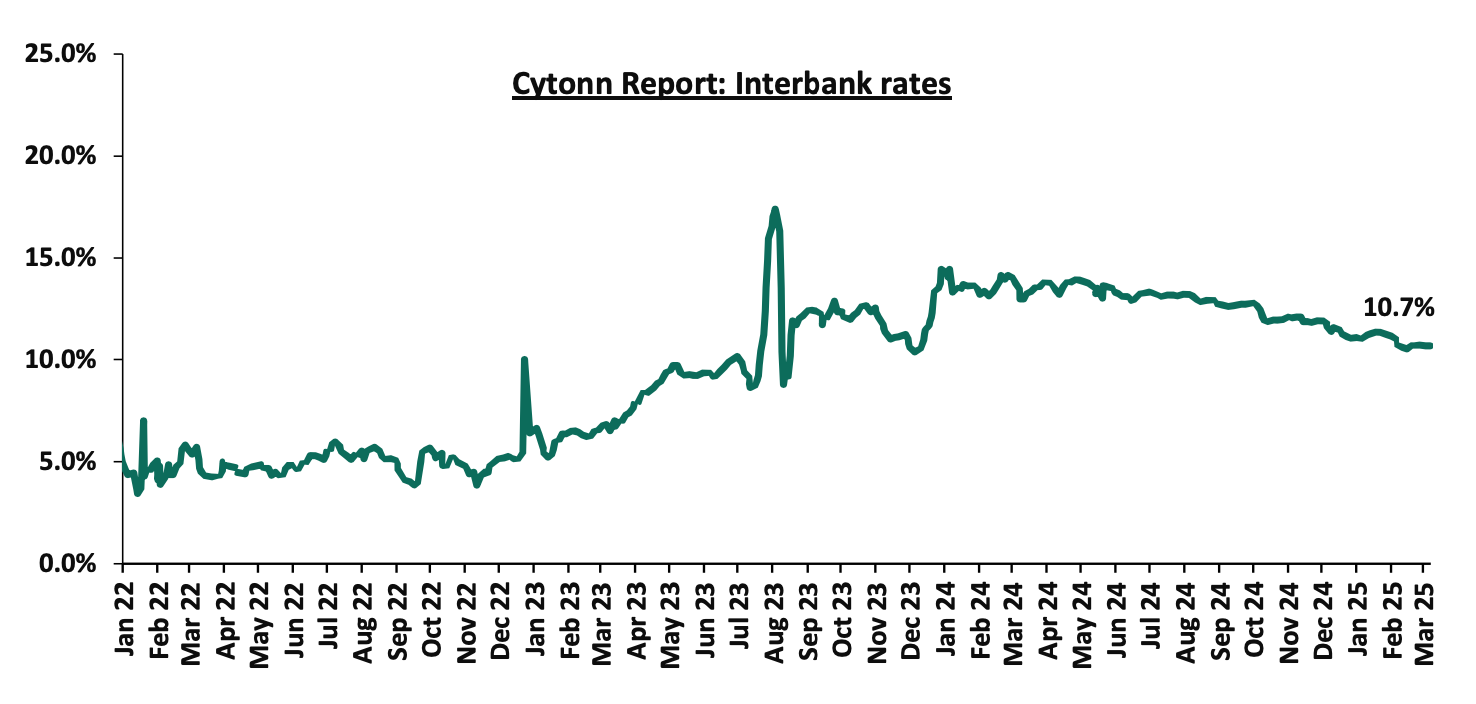
During the week, liquidity in the money markets marginally tightened, with the average interbank rate increasing by 0.6 bps, to remain unchanged from the 10.7% recorded the previous week, partly attributable to tax remittances that offset government payments. The average interbank volumes traded decreased by 18.5% to Kshs 11.8 bn from Kshs 14.5 bn recorded the previous week. The chart below shows the interbank rates in the market over the years:
Kenya Eurobonds:
During the week, the yields on Kenya’s Eurobonds were on an upwards trajectory, with the yield on the 10-year Eurobond issued in 2018 increasing the most by 39.6 bps to 8.4% from the 8.0% recorded the previous week. The table below shows the summary performance of the Kenyan Eurobonds as of 6th March 2025;
|
Cytonn Report: Kenya Eurobonds Performance |
|
||||||
|
|
2018 |
2019 |
2021 |
2024 |
2025 |
||
|
Tenor |
10-year issue |
30-year issue |
7-year issue |
12-year issue |
13-year issue |
7-year issue |
11-year issue |
|
Amount Issued (USD) |
1.0 bn |
1.0 bn |
0.3 bn |
1.2 bn |
1.0 bn |
1.5 bn |
1.5 bn |
|
Years to Maturity |
3.0 |
23.0 |
2.2 |
7.2 |
9.3 |
5.9 |
11.0 |
|
Yields at Issue |
7.3% |
8.3% |
7.0% |
7.9% |
6.2% |
10.4% |
9.9% |
|
02-Jan-25 |
9.1% |
10.3% |
8.5% |
10.1% |
10.1% |
10.1% |
|
|
27-Feb-25 |
8.0% |
10.0% |
7.2% |
9.5% |
9.6% |
9.5% |
|
|
28-Feb-25 |
8.1% |
10.1% |
7.3% |
9.5% |
9.7% |
9.5% |
|
|
03-Mar-25 |
8.0% |
10.0% |
7.3% |
9.5% |
9.6% |
9.4% |
|
|
04-Mar-25 |
8.2% |
10.1% |
7.3% |
9.6% |
9.7% |
9.6% |
|
|
05-Mar-25 |
8.2% |
10.2% |
7.3% |
9.7% |
9.8% |
9.6% |
|
|
06-Mar-25 |
8.4% |
10.3% |
7.3% |
9.8% |
9.9% |
9.8% |
9.9% |
|
Weekly Change |
0.4% |
0.2% |
0.1% |
0.3% |
0.3% |
0.3% |
- |
|
MTD Change |
0.3% |
0.2% |
0.0% |
0.3% |
0.2% |
0.3% |
- |
|
YTD Change |
(0.6%) |
0.0% |
(1.2%) |
(0.2%) |
(0.2%) |
(0.3%) |
- |
Source: Central Bank of Kenya (CBK) and National Treasury
Kenya Shilling:
During the week, the Kenyan Shilling depreciated marginally against the US Dollar by 0.8 bps, to remain relatively unchanged from the Kshs 129.2 recorded the previous week. On a year-to-date basis, the shilling has appreciated by 5.3 bps against the dollar, compared to the 17.4% appreciation recorded in 2024.
We expect the shilling to be supported by:
- Diaspora remittances standing at a cumulative USD 4,960.2 mn in the twelve months to January 2025, 16.6% higher than the USD 4,252.9 mn recorded over the same period in 2024. These has continued to cushion the shilling against further depreciation. In the January 2025 diaspora remittances figures, North America remained the largest source of remittances to Kenya accounting for 56.9% in the period,
- The tourism inflow receipts which came in at Kshs 452.2 bn in 2024, a 19.8% increase from Kshs 377.5 bn inflow receipts recorded in 2023, and owing to tourist arrivals that improved by 14.6% to 2,394,376 in 2024 from 2,089,259 in 2023, and,
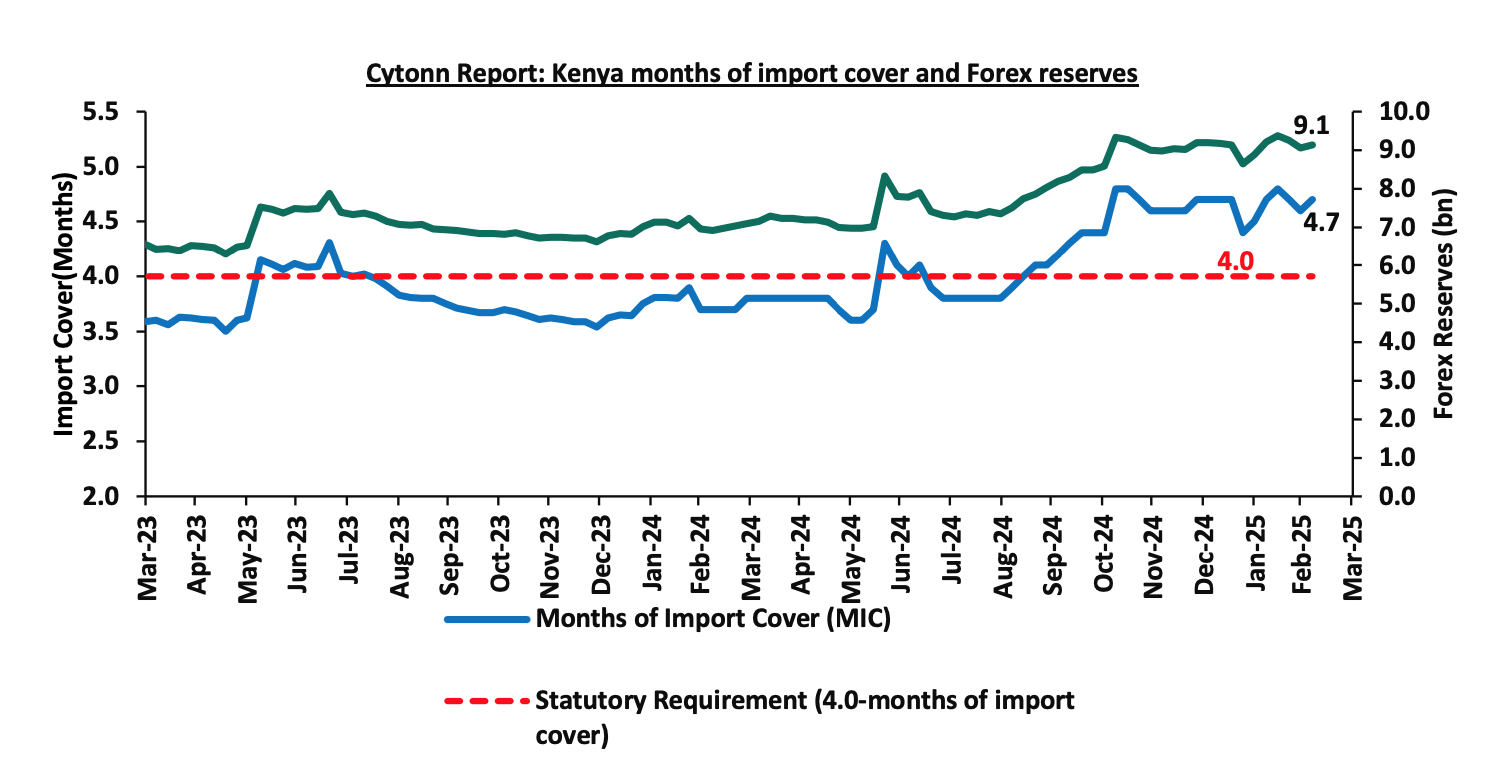
- Improved forex reserves currently at USD 9.1bn (equivalent to 4.7-months of import cover), which is above the statutory requirement of maintaining at least 4.0-months of import cover and above the EAC region’s convergence criteria of 4.5-months of import cover.
The shilling is however expected to remain under pressure in 2025 as a result of:
- An ever-present current account deficit which came at 4.0% of GDP in Q3’2024, and,
- The need for government debt servicing, continues to put pressure on forex reserves given that 62.1% of Kenya’s external debt is US Dollar-denominated as of September 2024.
Key to note, Kenya’s forex reserves increased by 0.9% during the week, to remain relatively unchanged from the USD 9.1 bn recorded in the previous week, equivalent to 4.7 months of import cover compared to 4.6 months of import cover recorded last week, and above the statutory requirement of maintaining at least 4.0-months of import cover. The chart below summarizes the evolution of Kenya's months of import cover over the years:
Weekly Highlights
- Kenya’s Eurobond Buyback Results
Kenya announced the plan of buying back the 7-year tenor USD 900.0 mn Eurobond tenders issued in 2019 with a maturity of May 2027. In the announcement, Kenya stated that the buyback plan would be financed by the issuance of a new Eurobond. The Kenyan 7-year tenor bond that was issued in 2019 at a coupon rate of 7.0% is due for maturity in May 2027, and was to be repaid in installments of USD 300.0 mn starting from May 2025, into May 2026 and May 2027.
During the week the Government of Kenya released the results of the USD 900.0 mn Eurobond buyback. Kenya had invited bondholders to sell their bonds for cash, at USD 1,002.5 per USD 1,000.0, plus the accrued interest payments on the notes, with the offer closing on 3rd March 2024. The offer was undersubscribed, receiving a total amount of USD 579.7 mn by investors, translating to a subscription rate of 64.4%, falling short of the maximum possible buyback amount of USD 900.0 mn. While more than half of the bondholders chose to sell their bonds back to the government, some opted to retain them, likely anticipating better returns in the future. As a result, Kenya was unable to fully retire the bond as planned, leaving USD 320.3 mn of the bond still outstanding, which will need to be repaid at maturity. The purchase price of accepted tenders was USD 1,002.5 per USD 1,000.0, plus the accrued interest payments on the notes, with a settlement date of 10th March 2025. Once settled, the repurchased bonds will be permanently cancelled, while any remaining bonds will continue to trade as usual.
To fund this buyback, Kenya issued a new USD 1.5 bn 11-year Eurobond. The Government, on 27th February 2025, announced the results of the tender offer, highlighting that the new issue attracted a yield of 9.95% and a coupon rate of 9.5%. The new Eurobond offer received high traction, receiving tenders worth USD 4.9 bn, translating to a subscription rate of 326.7%, with Kenya accepting bids worth USD 1.5 bn, translating to an acceptance rate of 30.6%. The surplus of 0.6 bn will be used to refinance other existing external debt falling due later in the year.
The successful buyback and issuance of the new Eurobond has resulted in a 13.9% increase in Kenya’s outstanding Eurobond debt to USD 7.5 bn after the buyback and new issue from USD 6.6 bn before the buyback and new issue, implying that while the government managed to ease short-term repayment pressure, it did so at the cost of higher debt and increased interest expenses. The overall increase in external debt obligations, raises concerns about long-term debt sustainability challenges and weakens fiscal position. The table below shows a summary of Kenya’s outstanding Eurobond Debts before and after the buyback and new issue:
|
Cytonn Report: Kenya's Outstanding Eurobond Debt |
|||||
|
Eurobond Issuance |
Issue Date |
Maturity Date |
Coupon Rate |
Amount Before Buyback (USD mn) |
Amount After Buyback & New Issue (USD mn) |
|
10-year 2018 |
28/02/2018 |
2/28/2028 |
7.25% |
1000.0 |
1000.0 |
|
30-year 2018 |
28/02/2018 |
2/28/2048 |
8.25% |
1000.0 |
1000.0 |
|
7-year 2019 |
22/05/2019 |
5/22/2027 |
7.00% |
900.0 |
320.3 |
|
12-year 2019 |
22/05/2019 |
5/22/2032 |
8.00% |
1200.0 |
1200.0 |
|
13-year 2021 |
23/06/2021 |
6/23/2034 |
6.30% |
1000.0 |
1000.0 |
|
7-year 2024 |
13/02/2024 |
2/13/2031 |
9.75% |
1500.0 |
1500.0 |
|
11-year 2025 |
03/03/2025 |
03/03/2036 |
9.50% |
- |
1500.0 |
|
Total Outstanding Eurobond Debt |
6,600.0 |
7520.3 |
|||
Source: National Treasury
The graph below shows the yields for the bond since it was issued in 2019:
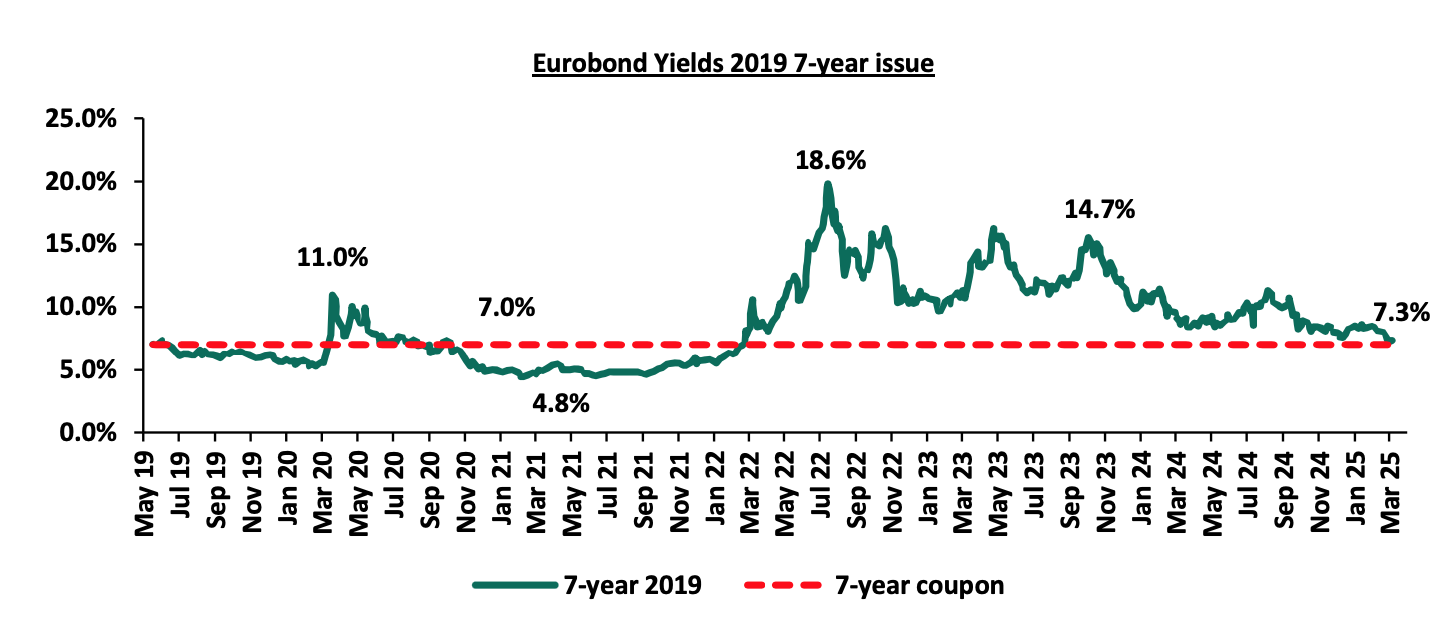
Kenya’s Eurobond buyback was a strategic effort to manage its external debt and reduce debt repayment pressure. However, concerns about the country’s overall debt sustainability remain. As of September 2024, Kenya’s public debt-to-GDP ratio stood at 66.6%, exceeding the IMF-recommended limit of 50.0%. Replacing a 7.0% coupon Eurobond with a new 9.5% coupon bond significantly raises future interest costs, further straining Kenya’s debt position. The 64.4% subscription rate indicates that the buyback was not fully taken up, leaving USD 320.3 mn of the bond outstanding, which the government will still need to repay at maturity, possibly indicating improved investor confidence into the country’s credit risk. While the successful issuance of the new bond demonstrates Kenya’s continued access to international markets, the higher interest rate on the new issuance and the increased cumulative external debt highlight the country’s increasing debt burden and financing costs.
- Stanbic Bank’s February 2025 Purchasing Manager’s Index (PMI)
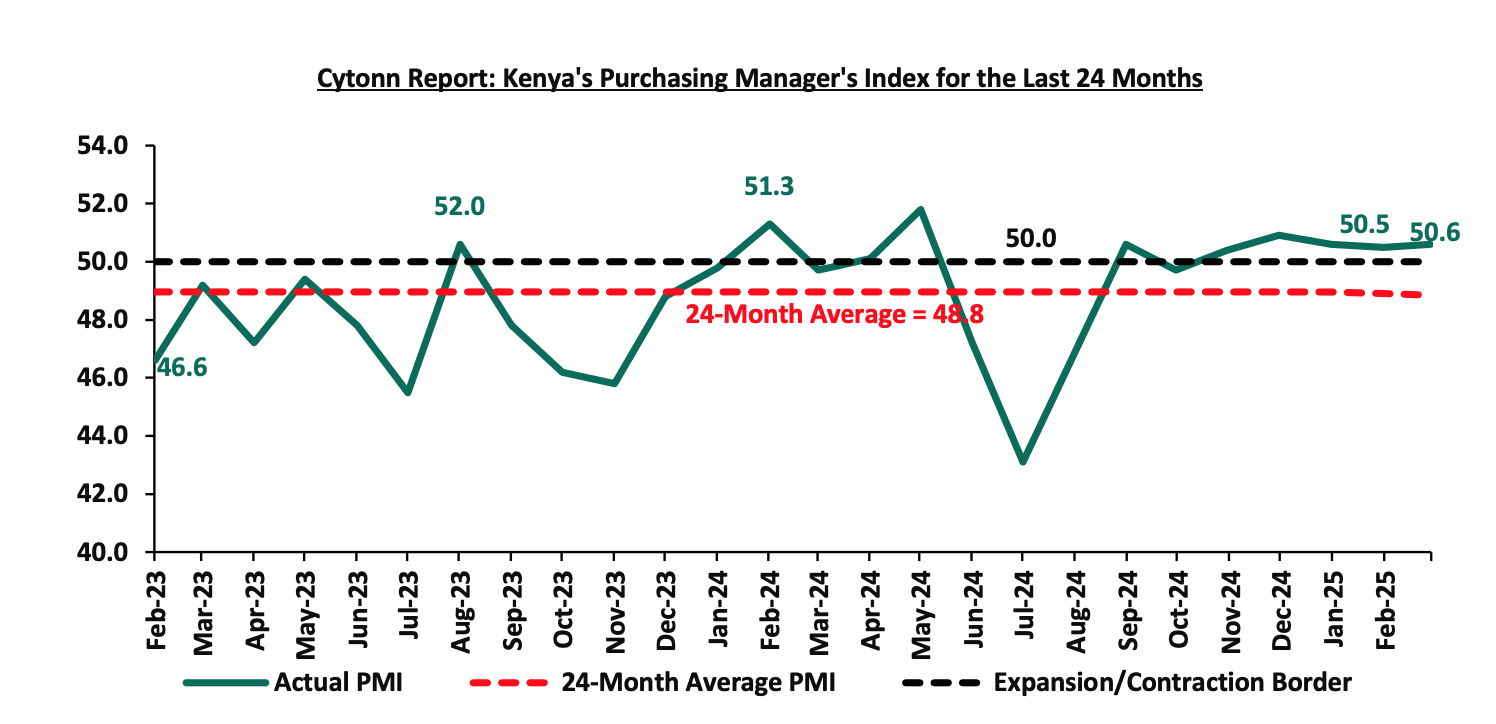
During the week, Stanbic Bank released its monthly Purchasing Manager's Index (PMI) highlighting that the index for the month of February 2025 increased slightly, coming in at 50.6, up from 50.5 in January 2025, signaling another marginal improvement in business conditions. This marked the fifth month that index fell above the 50.0 neutral mark. Increased output, new orders and employment growth supported the marginal improvement. On a year-to-year basis, the index however recorded a 1.4% decrease from the 51.3 recorded in February 2024. The modest improvement of the general business environment is mainly attributable to inflation remaining relatively low in February coming in at 3.5%, remaining within the Central Bank of Kenya (CBK) target range of 2.5% to 7.5% for the twentieth consecutive month. However, this was a slight increase of 0.2% points from 3.3% in January 2025 attributable to increase in prices of commodities in Food & Non-Alcoholic Beverages and Transport sector by 6.4% and 0.7% respectively. Further, the lower Central Bank Rate (CBR) at 10.75% led to reduced borrowing costs, further promoting improved business activity.
The average input charges marginally increased, attributable to a marginal increase in purchase prices and easing inflationary pressures. As a result, purchase price increases were relatively modest. Meanwhile, output prices rose, just marginally. The sector data showed an increase in output, for the fifth consecutive month attributable to economic stabilization and easing inflationary pressures. However, difficulties in driving sales growth tightened the output. New orders increased for the fifth consecutive month attributable to increased cash flow and more stable pricing conditions. Additionally, employment numbers rose for the first time in two months in February, with most firms marginally increasing their staffing levels. On the sectoral performance, the agriculture, manufacturing and construction sectors performed well benefiting from steady growth in demand and production. However, wholesale, retail and services faced difficulties with lower business activity and reduced input purchases.
Private sector prices increased marginally in February for the fourth consecutive month. The higher purchasing costs led to price increases. Notably, overall sentiment towards future activity of the Kenyan business environment was negative. The outlook reflected concerns about the general economy and high competition despite investment in marketing and new products and services. Key to note, a PMI reading of above 50.0 indicates an improvement in the business conditions, while readings below 50.0 indicate a deterioration. The chart below summarizes the evolution of PMI over the last 24 months
Going forward, we anticipate that the business environment will improve in the short to medium term as a result of the improving economic environment driven by lower interest rates following the easing monetary policy with the CBR decreasing by 50.0 bps to 10.75% from 11.25% in February 2025, the stability of the Kenyan Shilling against the USD, low inflation rates currently at 3.5% and stable fuel prices. However, we expect businesses to be weighed down by the high cost of living coupled with the high taxation, which are set to increase input costs. Overall the private sector is expected to continue with the recovery albeit with potential headwinds in the coming months.
Rates in the Fixed Income market have been on a downward trend due to high liquidity in the money market which allowed the government to front load most of its borrowing. The government is 76.5% ahead of its prorated net domestic borrowing target of Kshs 411.0 bn, and 22.2% ahead of the total FY’2024/25 net domestic borrowing target of Kshs 593.7 bn, having a net borrowing position of Kshs 725.5 bn (inclusive of T-bills). However, we expect a continued downward readjustment of the yield curve in the short and medium term, with the government looking to increase its external borrowing to maintain the fiscal surplus, hence alleviating pressure in the domestic market. As such, we expect the yield curve to stabilize in the short to medium-term and hence investors are expected to shift towards the long-term papers to lock in the high returns
Market Performance
During the week, the equities market was on an upward trajectory, with NSE 20 gaining the most by 1.6%, while NSE 25, NASI and NSE 10 gained by 1.4%, 1.2% and 0.9% respectively, taking the YTD performance to gains of 13.6%, 6.7%, 5.4% and 3.9% for NSE 20, NASI, NSE 25 and NSE 10, respectively. The equities market performance was driven by gains recorded by large-cap stocks such as Stanbic, DTB Kenya and NCBA-Kenya of 9.4%, 3.2%, and 3.0% respectively. The gains were however, weighed down by losses recorded by large-cap stocks such as BAT, Equity and KCB Bank of 1.2%, 0.4%, and 0.4% respectively.;
During the week, equities turnover increased by 40.3% to USD 19.1 mn, from USD 13.7 mn recorded the previous week, taking the YTD total turnover to USD 159.1 mn. Foreign investors remained net sellers for the second consecutive week, with a net selling position of USD 4.7 mn, from a net selling position of USD 2.0 mn recorded the previous week, taking the YTD foreign net selling position to USD 22.7 mn, compared to a net selling position of USD 16.9 mn in 2024,
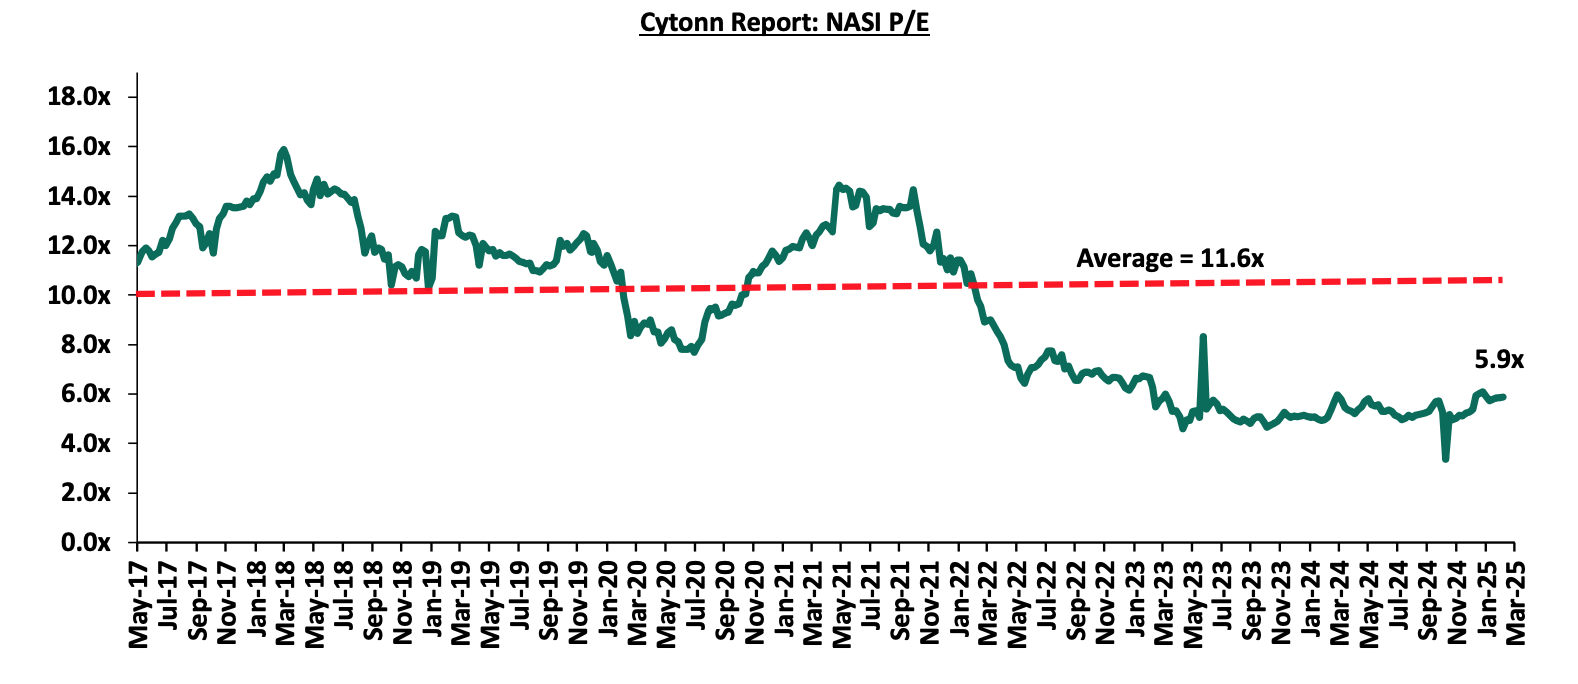
The market is currently trading at a price-to-earnings ratio (P/E) of 5.9x, 49.2% below the historical average of 11.6x. The dividend yield stands at 5.9%, 1.3% points above the historical average of 4.6%. Key to note, NASI’s PEG ratio currently stands at 0.7x, an indication that the market is undervalued relative to its future growth. A PEG ratio greater than 1.0x indicates the market is overvalued while a PEG ratio less than 1.0x indicates that the market is undervalued. The charts below indicate the historical P/E and dividend yields of the market;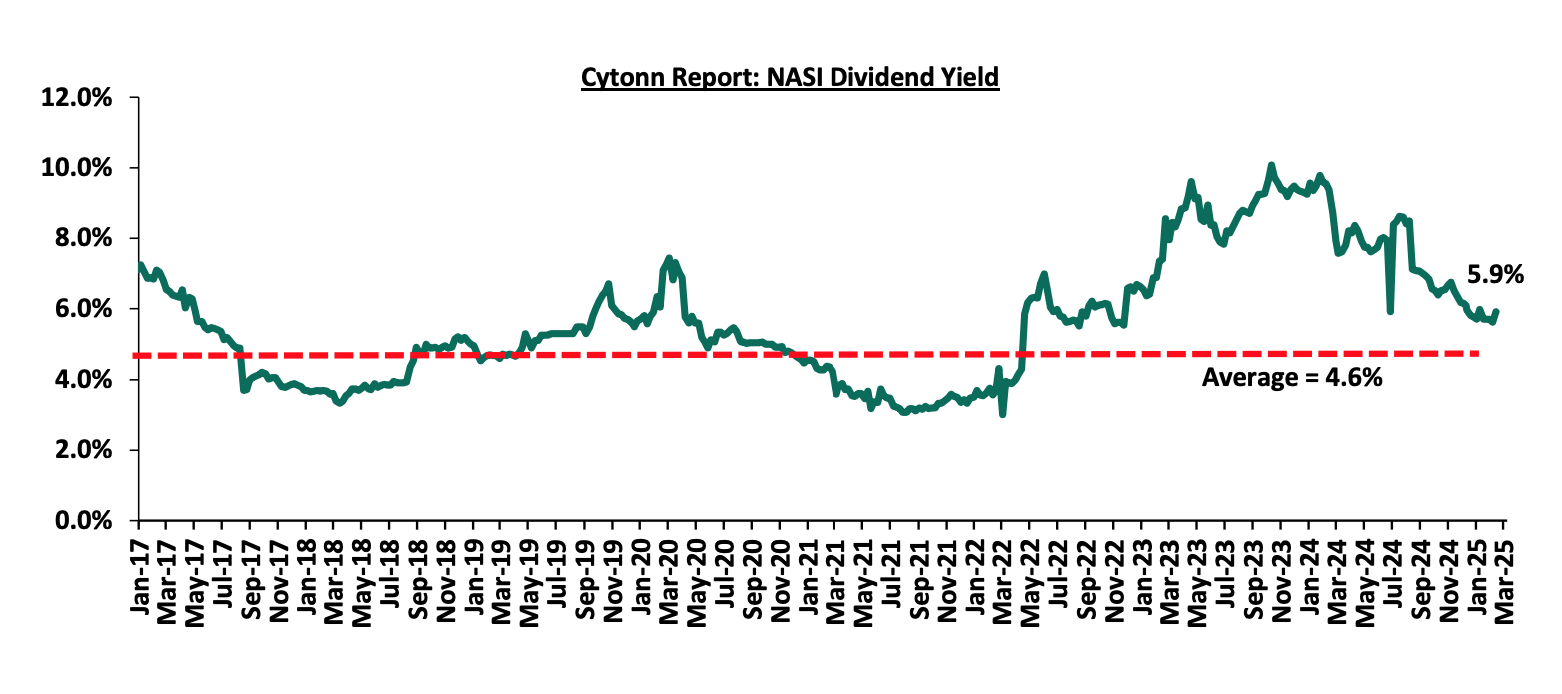
Universe of Coverage:
|
Cytonn Report: Equities Universe of Coverage |
||||||||||
|
Company |
Price as at 28/02/2026 |
Price as at 07/03/2025 |
w/w change |
YTD Change |
Year Open 2025 |
Target Price* |
Dividend Yield*** |
Upside/ Downside** |
P/TBv Multiple |
Recommendation |
|
Equity Group |
48.7 |
48.5 |
(0.4%) |
1.0% |
48.0 |
60.2 |
8.2% |
32.4% |
1.0x |
Buy |
|
Jubilee Holdings |
205.3 |
210.0 |
2.3% |
20.2% |
174.8 |
260.7 |
6.8% |
30.9% |
0.3x |
Buy |
|
Co-op Bank |
16.9 |
16.9 |
0.3% |
(3.2%) |
17.5 |
18.8 |
8.9% |
20.1% |
0.8x |
Buy |
|
Stanbic Holdings |
152.3 |
166.5 |
9.4% |
19.1% |
139.8 |
171.2 |
12.5% |
15.3% |
1.0x |
Accumulate |
|
KCB Group |
45.0 |
44.8 |
(0.4%) |
5.5% |
42.4 |
50.3 |
0.0% |
12.4% |
0.7x |
Accumulate |
|
NCBA |
50.3 |
51.8 |
3.0% |
1.5% |
51.0 |
53.2 |
9.2% |
12.0% |
1.0x |
Accumulate |
|
ABSA Bank |
19.0 |
19.3 |
1.6% |
2.4% |
18.9 |
19.1 |
8.0% |
7.0% |
1.5x |
Hold |
|
CIC Group |
3.0 |
3.0 |
1.3% |
42.1% |
2.1 |
3.1 |
4.3% |
6.3% |
1.0x |
Hold |
|
Standard Chartered Bank |
300.3 |
309.0 |
2.9% |
8.3% |
285.3 |
291.2 |
9.4% |
3.6% |
2.1x |
Lighten |
|
Diamond Trust Bank |
78.0 |
80.5 |
3.2% |
20.6% |
66.8 |
78.1 |
6.2% |
3.2% |
0.3x |
Lighten |
|
I&M Group |
36.0 |
36.1 |
0.3% |
0.1% |
36.0 |
32.3 |
7.1% |
(3.3%) |
0.7x |
Sell |
|
Britam |
7.8 |
7.8 |
0.5% |
34.4% |
5.8 |
7.5 |
0.0% |
(4.1%) |
1.1x |
Sell |
|
*Target Price as per Cytonn Analyst estimates **Upside/ (Downside) is adjusted for Dividend Yield ***Dividend Yield is calculated using FY’2023 Dividends |
||||||||||
Weekly Highlights
- Stanbic FY’2024 results
Below is a summary of Stanbic Group FY’2024 performance:
|
Balance Sheet Items |
FY’2023 |
FY’2024 |
y/y change |
|
Government Securities |
45.3 |
77.4 |
70.6% |
|
Net Loans and Advances |
260.5 |
230.3 |
(11.6%) |
|
Total Assets |
459.3 |
454.8 |
(1.0%) |
|
Customer Deposits |
330.9 |
321.6 |
(2.8%) |
|
Deposits/branch |
11.8 |
10.7 |
(9.3%) |
|
Total Liabilities |
390.7 |
379.4 |
(2.9%) |
|
Shareholders’ Funds |
68.6 |
75.4 |
10.0% |
|
Balance Sheet Ratios |
FY’2023 |
FY’2024 |
% points change |
|
Loan to Deposit Ratio |
78.7% |
71.6% |
(7.1%) |
|
Government Securities to Deposit Ratio |
13.7% |
24.1% |
10.4% |
|
Return on average equity |
18.6% |
19.1% |
0.5% |
|
Return on average assets |
2.8% |
3.0% |
0.2% |
|
Income Statement |
FY’2023 |
FY’2024 |
y/y change |
|
Net Interest Income |
25.6 |
24.3 |
(5.1%) |
|
Net non-Interest Income |
15.7 |
15.4 |
(1.7%) |
|
Total Operating income |
41.3 |
39.7 |
(3.8%) |
|
Loan Loss provision |
(6.2) |
(3.1) |
(50.3%) |
|
Total Operating expenses |
(24.2) |
(20.8) |
(14.2%) |
|
Profit before tax |
17.1 |
19.0 |
11.0% |
|
Profit after tax |
12.2 |
13.7 |
12.8% |
|
Core EPS |
30.8 |
34.7 |
12.8% |
|
Dividend per share |
15.4 |
20.7 |
35.1% |
|
Dividend Payout ratio |
49.9% |
59.8% |
9.9% |
|
Dividend Yield |
14.1% |
12.5% |
(1.6%) |
|
Income Statement Ratios |
FY’2023 |
FY’2024 |
% points change |
|
Yield from interest-earning assets |
10.2% |
12.6% |
2.4% |
|
Cost of funding |
3.7% |
7.1% |
3.4% |
|
Net Interest Margin |
6.9% |
5.9% |
(1.0%) |
|
Net Interest Income as % of operating income |
62.1% |
61.2% |
(0.8%) |
|
Non-Funded Income as a % of operating income |
37.9% |
38.8% |
0.8% |
|
Cost to Income Ratio |
58.6% |
52.3% |
(6.4%) |
|
CIR without LLP |
43.5% |
44.5% |
0.9% |
|
Cost to Assets |
3.9% |
3.9% |
(0.0%) |
|
Capital Adequacy Ratios |
FY’2023 |
FY’2024 |
% points change |
|
Core Capital/Total Liabilities |
15.1% |
17.1% |
2.0% |
|
Minimum Statutory ratio |
8.0% |
8.0% |
0.0% |
|
Excess |
7.1% |
9.1% |
2.0% |
|
Core Capital/Total Risk Weighted Assets |
13.0% |
14.9% |
1.9% |
|
Minimum Statutory ratio |
10.5% |
10.5% |
0.0% |
|
Excess |
2.5% |
4.4% |
1.9% |
|
Total Capital/Total Risk Weighted Assets |
16.6% |
18.4% |
1.8% |
|
Minimum Statutory ratio |
14.5% |
14.5% |
0.0% |
|
Excess |
2.1% |
3.9% |
1.8% |
|
Liquidity Ratio |
40.3% |
50.5% |
10.2% |
|
Minimum Statutory ratio |
20.0% |
20.0% |
0.0% |
|
Excess |
20.3% |
30.5% |
10.2% |
Key Take-Outs:
- Strong earnings growth - Core earnings per share increased by 12.8% to Kshs 34.7 from Kshs 30.8 in FY’2023, mainly driven by 14.2% decrease in total operating expenses to Kshs 20.8 bn, from Kshs 24.2 bn in FY’2023, which outpaced the 3.8% decline in total operating income to Kshs 39.7 bn in FY’2024 from Kshs 41.3 bn in FY’2023,
- Decreased Provisioning – Gross NPL ratio decreasing to 9.1% in FY’2024, from 9.5% in FY’2023, attributable to 14.4% decrease in Gross non-performing loans to Kshs 22.6 bn, from Kshs 26.5 bn in FY’2023, which outpaced the 11.1% decrease in gross loans to Kshs 248.1 bn, from Kshs 279.1 bn recorded in FY’2023,
- Declaration of dividends - The directors of Stanbic Group Holdings recommended a final dividend of 18.90, in addition to an interim dividend of 1.84 paid during the year, leading a to a total dividend of 20.74 in 2024, translating to a dividend yield of 12.5% and payout ratio of 59.8%,
- Improved asset quality- Gross NPL ratio decreased to 9.1% in FY’2024, from 9.5% in FY’2023, attributable to 14.4% decrease in Gross non-performing loans to Kshs 22.6 bn, from Kshs 26.5 bn in FY’2023, which outpaced the 11.1% decrease in gross loans to Kshs 248.1 bn, from Kshs 279.1 bn recorded in FY’2023,
- Reduced lending- Customer net loans and advances decreased by 11.6% to Kshs 230.3 bn in FY’2024, from Kshs 260.5 bn in FY’2023 attributed to increased credit risk with high NPLs in the industry, with the lender preferring to invest in government securities during the period.
For more detailed analysis, see our Stanbic Bank FY’2024 Earnings Note
We are “Bullish” on the Equities markets in the short term due to current cheap valuations, lower yields on short-term government papers and expected global and local economic recovery, and, “Neutral” in the long term due to persistent foreign investor outflows. With the market currently trading at a discount to its future growth (PEG Ratio at 0.7x), we believe that investors should reposition towards value stocks with strong earnings growth and that are trading at discounts to their intrinsic value. We expect the current high foreign investors sell-offs to continue weighing down the economic outlook in the short term.
- Residential sector
- Affordable Housing Red Flags
During the week, there were discussions surrounding President William Ruto’s affordable housing initiative that have sparked concerns about the project’s transparency, financial viability, and long-term sustainability. Critics argue that the ambitious program, which aims to address Kenya’s housing deficit by constructing low-cost units across the country, may suffer from inadequate oversight mechanisms and unclear funding structures. One major red flag involves the proposed financing model, which relies on a mandatory levy collected from workers and employers. Although the government contends that this levy will help pool resources for the construction of affordable homes, skeptics question the wisdom of imposing additional financial burdens on citizens already grappling with high living costs. They also point to a lack of clarity on how the funds will be managed, raising fears of potential misallocation or misuse.
Government contracts worth Kshs 49.5 bn have been signed for affordable housing projects on land lacking original title deeds, a move that has deepened public distrust. Auditor-General Nancy Gathungu’s report for the year ending June 2024 noted that land ownership documents were not provided for audit, raising serious concerns about how buyers will secure necessary sectional titles. This issue is one among many that have beset the Affordable Housing Programme (AHP), which has been characterized by unclear targets, shifting promises, and inconsistent communication. Promoted as President William Ruto’s flagship initiative, the AHP now faces controversy over disputed land deals. In a 2019 incident, land originally owned by Nairobi County Government was transferred to Jabavu Village Ltd, a private firm that acquired 80 percent of the title and used it to secure a Kshs 1.9 bn bank loan for project development. Moreover, construction targets have been revised from 250,000 houses per year to 200,000 units, a promise that remains unfulfilled more than two years into Dr. Ruto’s tenure.
The government now plans to release 4,888 units by the end of March 2025, with quarterly releases of approximately 4,000 to 5,000 units, aiming for a total of 140,000 houses, although the Treasury’s Budget Policy Statement cites 124,000 units. Job creation figures are similarly disputed, with estimates ranging from 1.12 mn jobs to 164,000 roles. Buyers will face payment terms extending up to 30 years, with interest rates set at 3.0 % for social housing, 5.0% under the AHP, and 9.0% at market rates. Critics argue that the evolving model—originally a savings scheme turned into a tax-funded approach—imposes undue costs on taxpayers while failing to deliver truly affordable homes. This strategy has been widely criticized by leading economists and the public, who claim it burdens taxpayers with double costs and delays genuine affordable housing.
We expect that the residential sector—particularly affordable housing projects—will likely be marked by heightened scrutiny regarding transparency, financing, and execution. The government’s mandatory levy on workers and employers, intended to fund these initiatives, raises questions about placing an additional financial burden on citizens and ensuring proper use of collected funds. Without robust oversight, there is a risk that resources could be mismanaged or diverted, undermining the program’s ability to deliver genuinely affordable units.
- Real Estate Investments Trusts (REITs)
On the Unquoted Securities Platform, Acorn D-REIT and I-REIT traded at Kshs 25.4 and Kshs 22.2 per unit, respectively, as per the last updated data on 7th March 2025. The performance represented a 27.0% and 11.0% gain for the D-REIT and I-REIT, respectively, from the Kshs 20.0 inception price. The volumes traded for the D-REIT and I-REIT came in at Kshs 12.8 mn and Kshs 35.6 mn shares, respectively, with a turnover of Kshs 323.5 mn and Kshs 791.5 mn, respectively, since inception in February 2021. Additionally, ILAM Fahari I-REIT traded at Kshs 11.0 per share as of 7th March 2025, representing a 45.0% loss from the Kshs 20.0 inception price. The volume traded to date came in at 138,600 shares for the I-REIT, with a turnover of Kshs 1.5 mn since inception in November 2015.
REITs offer various benefits, such as tax exemptions, diversified portfolios, and stable long-term profits. However, the ongoing decline in the performance of Kenyan REITs and the restructuring of their business portfolios are hindering significant previous investments. Additional general challenges include:
- Insufficient understanding of the investment instrument among investors leading to a slower uptake of REIT products,
- Lengthy approval processes for REIT creation,
- High minimum capital requirements of Kshs 100.0 mn for REIT trustees compared to Kshs 10.0 mn for pension funds Trustees, essentially limiting the licensed REIT Trustee to banks only
- The rigidity of choice between either a D-REIT or and I-REIT forces managers to form two REITs, rather than having one Hybrid REIT that can allocate between development and income earning properties
- Limiting the type of legal entity that can form a REIT to only a trust company, as opposed to allowing other entities such as partnerships, and companies,
- We need to give time before REITS are required to list – they would be allowed to stay private for a few years before the requirement to list given that not all companies maybe comfortable with listing on day one, and,
- Minimum subscription amounts or offer parcels set at Kshs 0.1 mn for D-REITs and Kshs 5.0 mn for restricted I-REITs. The significant capital requirements still make REITs relatively inaccessible to smaller retail investors compared to other investment vehicles like unit trusts or government bonds, all of which continue to limit the performance of Kenyan REITs.
We expect Kenya’s Real Estate sector to remain on a growth trend, supported by: i) demand for housing sustained by positive demographics, such as urbanization and population growth rates of 3.8% p.a and 2.0% p.a, respectively, against the global average of 1.7% p.a and 0.9% p.a, respectively, as at 2023,, ii) activities by the government under the Affordable Housing Program (AHP) iii) heightened activities by private players in the residential sector iv) increased investment by local and international investors in the retail sector. However, challenges such as rising construction costs, strain on infrastructure development (including drainage systems), high capital requirements for REITs, and existing oversupply in select Real Estate sectors will continue to hinder the sector’s optimal performance by limiting developments and investments.
In 2024, we published the Nairobi Metropolitan Area Commercial Office Report 2024 themed ‘Persisting Tenant’s Market’. The report provided an in-depth analysis of the sector's performance in 2023, along with insights into future prospects and investment opportunities. According to the report, the sector experienced notable improvements, with average rental yield improved by 0.1% points to 7.7% in FY’2023 from 7.6% recorded in FY’2022, due to improved occupancy and rental rates. Average asking rents per SQFT in the NMA increased by 7.0% to Kshs 103 per SQFT from Kshs 96, owing to increased availability of high-quality Grade A office spaces, exemplified by Regus, Ikigai, and Spaces, which command premium rents. The overall occupancy rates increased by 0.1% points to 79.5% from 79.4% as a result of a slow but rising demand for physical space. Also, the report noted that, Westlands emerged as the top-performing node, boasting an average rental yield of 8.5%, surpassing the market average of 7.7% by 0.8% points. Gigiri followed closely as the second-best performing node, achieving an average rental yield of 8.2%. Karen secured the third position with an average rental yield of 8.0%. The Nairobi Metropolitan Area (NMA) commercial office sector experienced a consistent oversupply of office space, amounting to 5.8 million square feet (SQFT), a figure comparable to that of 2022. The Nairobi Metropolitan Area (NMA) commercial office sector experienced a consistent oversupply of office space, amounting to 5.8 million square feet (SQFT), a figure comparable to that of 2022. This surplus was primarily due to the increase of the new development adding more space into the market and a slow absorption of the existing spaces, thus limiting the influx of additional office space into the market. Additionally, the surge in gross non-performing loans (NPLs) within the Real Estate sector constrained developers' capacity to fund new ventures, prompting them to defer or postpone developments until market conditions stabilized and financing accessibility improved. However, despite the persistent oversupply, there was a notable decline in the average office vacancy rate, decreasing from 20.6% in 2022 to 19.7% in 2023. Consequently, the heightened demand led to faster absorption rates of both new and existing developments throughout 2023, even with the introduction of 0.3 million SQFT of office space into the market—a 50.0% reduction from the 0.6 million SQFT supplied in 2022.
This week, we update our previous research with the Commercial Office Report 2024 themed ‘Supply-Heavy Market’, in order to determine the market’s performance and analyse the ongoing trends, by looking at the following:
- Overview of the Commercial Office Sector,
- Commercial Office Supply in the Nairobi Metropolitan Area,
- Commercial Office Performance, by Location and by Grades, and,
- Office Market Outlook and the Investment Opportunity in the Sector.
Section I: Overview of the Commercial Office Sector
In 2024, the commercial office market across the Nairobi Metropolitan Area experienced a surge in activity compared to 2023. This growth was primarily driven by a rising demand for office spaces and a significant uptick in development projects led by property developers. Additionally, an increasing appetite for convenience has bolstered the appeal of co-working office arrangements, as evidenced by a growing number of developments offering fully serviced offices. A range of factors has collectively spurred this robust market performance, including:
- Business Resurgence: The ongoing post-COVID-19 recovery led to increased business activities, boosting demand for commercial office spaces. This surge contributed to higher occupancy rates and improved rental yields, encouraging the development of new office complexes and the refurbishment of existing ones to meet the growing demand.
- Rise of Flexible Workspaces: Serviced offices and co-working spaces continued to gain popularity in Kenya due to their convenience and flexibility. These spaces offered cost-effective and adaptable solutions for entrepreneurs and small businesses, appealing to both tenants and investors.
- Demand for Premium and Sustainable Spaces: The entry of multinational corporations (MNCs) into Kenya heightened the demand for premium Grade A office spaces with a focus on sustainability. MNCs preferred developments that provided high-quality work environments incorporating Environmental, Social, and Governance (ESG) features, including green technology. Developers recognized that green buildings offered a competitive market advantage and aligned with sustainable business practices, making them more attractive than traditional office spaces.
- Nairobi's Strategic Positioning: Nairobi maintained its status as a key investment destination for MNCs in the region. The establishment of regional offices by organizations such as the Commonwealth Enterprise and Investment Council (CWEIC) underscored Nairobi’s role as East Africa’s business hub, attracting international organizations. This positioning enhanced the commercial office sector's appeal for investment compared to other regional cities.
- Favorable Demographic Trends: Kenya’s urbanization rate stood at 3.8%, surpassing the global average of 1.6%, according to the World Bank as of 2023. Rapid urban growth fueled demand for office spaces as more individuals migrated to urban centers in search of employment opportunities and a better quality of life. This trend was expected to persist, supported by ongoing government initiatives to promote urbanization and infrastructure development.
- Return-to-Office Policies: Mandated in-person work reduced vacancy rates to 14.7% and increased occupancy rates, reinforcing demand for physical office space amid evolving hybrid work models.
- Economic Recovery & Business Confidence: Kenya’s 2024 GDP growth hit 4.0% in Q3’2024 (down from 6.0% in Q3’2023) with Q2 at 4.6%. Inflation eased to 3.6% from 6.8%, and a CBR cut to 12.75% boosted business confidence and spurred office leasing.
Conversely, the sector continues to face setbacks such as;
- Oversupply of Office Space: In 2024, the Nairobi Metropolitan Area continued to face an excess supply of office space, surpassing current demand levels and resulting in an oversupply of 5.7 mn SQFT. This surplus has contributed to prolonged vacancy rates, prompting developers to adopt a cautious "wait-and-see" approach regarding new construction projects until the surplus office space is absorbed. Nairobi has long grappled with an oversupply of office space, exacerbated by escalating capital costs, further contributing to developers' cautious stance towards new investments,
- Remote/ Hybrid Working Model: The implementation of remote or hybrid work setups by certain companies has adversely affected the overall occupancy rates of office spaces and landlords' returns. However, transitioning from full remote work to a hybrid model by select companies is anticipated to enhance the office occupancy rate within the sector, and,
- Financial Constraints: Developers encounter financial constraints as they face challenges in accessing credit loans, with banks tightening their lending terms and requiring more collateral due to escalating default rates. Gross Non-Performing Loans (NPLs) in the Real Estate sector surged by 1.1% to Kshs 99.0 bn in Q3’2024, from Kshs 97.9 bn in Q3’2023, equivalent to 19.5% of the total loans advanced compared to 19.3% recorded in the same period in 2023. This situation is exacerbated by i) Slow uptake of properties due to the economic and political demonstrations ongoing during the quarter which made it hard for developers and practitioners in real estate to fail meeting their financial obligations ii) higher existing taxes and new tax implementations, and, iii) Long incubation periods for real estate projects, and, iv) increased cost of borrowing.
Section II: Commercial Office Supply in the Nairobi Metropolitan Area
In 2024, there was introduction of five new office projects that contributed up to 0.6 mn SQFT of office supply to the commercial office market. These developments comprised the purple tower in Mombasa Road, The Atrium in Kilimani, Matrix One in Westlands, Mandrake in Westlands and Highway Heights in Kilimani. Meanwhile, there are plans for an additional 0.2 mn SQFT of space to be introduced into the market in 2025. This upcoming supply includes projects such as The Angelo in Lavington and 761 Lenana Rd. The table below shows some of the notable office completions during the review period as well as incoming spaces:
|
Cytonn Report: Nairobi Metropolitan Area Commercial Office Space Supply |
|||||||
|
|
Major Commercial Office Space Supply in 2024 |
Major incoming Commercial Office Completion in 2025 |
|||||
|
# |
Development |
Location |
Size (SQFT) |
# |
Development |
Location |
Size (SQFT) |
|
1 |
Purple Tower |
Mombasa Road |
197,800 |
1 |
The Angelo |
Lavington |
42,000 |
|
2 |
The Atrium |
Kilimani |
100,000 |
2 |
761 Lenana Rd |
Kilimani |
127,500 |
|
3 |
Mandrake |
Westlands |
120,000 |
|
|
|
|
|
4 |
Highway Heights |
Kilimani |
100,000 |
|
|
|
|
|
5 |
Matrix One |
Westlands |
108,000 |
|
|
|
|
|
Total |
625,800 |
Total |
169,500 |
||||
Source: Cytonn Research, Knight Frank
In 2024, the Nairobi Metropolitan Area (NMA) commercial office sector experienced a consistent oversupply of office space, amounting to 5.7 mn square feet (SQFT), a figure lower to that of 2023 at 5.8 Mn SQFT. This decrease in the supply can be primarily be contributable to decrease in vacancy rates by 0.4% points to 19.3% in 2024 from 19.7% in 2023. Increase in occupancy rates was supported by factors such as market recovery from the global pandemic which has seen companies and organizations abolish remote working. Consequently, there was heightened demand which led to faster absorption rates of both new and existing developments throughout 2024, even with the introduction of 0.6 Mn SQFT of office space into the market—a 113.5% increase from the 0.3 Mn SQFT supplied in 2023. The oversupply is caused by the factors such as construction of new office spaces such as the purple tower on Mombasa Road, The Atrium in Kilimani , Matrix One in Westlands Mandrake in Westlands and Highway Heights in Kilimani, which outpaced the occupancy and uptake of these spaces
Looking ahead, the release of 0.2 mn of office space in 2025 is expected to further increase the oversupply, however the improving economy will see rise to demand for new spaces as companies and organizations planning expansion balancing the Supply-demand dynamics. The table below summarizes the commercial office space supply over time;
|
Cytonn Report: Nairobi Metropolitan Area Office Space Analysis |
|||||||||||||
|
Year |
2013 |
2014 |
2015 |
2016 |
2017 |
2018 |
2019 |
2020 |
2021 |
2022 |
2023 |
2024 |
2025F |
|
Stock (Mn SQFT) |
9.7 |
15.4 |
22.9 |
28.9 |
31.8 |
35.5 |
36.3 |
36.4 |
36.8 |
37.4 |
37.1 |
37.8 |
37.2 |
|
Completions (Mn SQFT) |
2.1 |
5.9 |
7.8 |
6.5 |
3.5 |
4.3 |
1.5 |
0.8 |
0.5 |
0.6 |
0.3 |
0.6 |
0.2 |
|
Vacancy Rate (%) |
10.0% |
10.0% |
11.0% |
12.0% |
16.8% |
16.7% |
19.5% |
22.3% |
22.1% |
20.6% |
19.7% |
19.3% |
20.2% |
|
Vacant Stock (Mn SQFT) |
1 |
1.5 |
2.5 |
3.5 |
5.3 |
5.9 |
7.1 |
8.1 |
8.1 |
7.7 |
7.3 |
7.3 |
7.5 |
|
Occupied Stock (Mn SQFT) |
8.8 |
13.9 |
20.3 |
25.4 |
26.5 |
29.6 |
29.2 |
28.3 |
28.7 |
29.7 |
29.8 |
30.5 |
29.7 |
|
Net Absorption |
1.7 |
5.1 |
6.5 |
5.1 |
1 |
3.1 |
-0.4 |
-1 |
0.4 |
1 |
0.3 |
0.7 |
(0.8) |
|
Demand |
1.9 |
5.3 |
6.8 |
5.6 |
1.6 |
3.7 |
0.4 |
-0.2 |
1.2 |
1.8 |
1.9 |
1.4 |
(0.1) |
|
Available Supply, AS(T) |
2.6 |
6.5 |
8.8 |
8.4 |
6.3 |
9 |
6.7 |
7.1 |
7.9 |
7.6 |
7.7 |
7.2 |
6.9 |
|
Gap, GAP(T) |
(0.8) |
(1.2) |
(2.1) |
(2.9) |
(4.7) |
(5.2) |
(6.3) |
(7.3) |
(6.7) |
(5.7) |
(5.8) |
(5.7) |
(7.0) |
Source: Cytonn Research/ Building Plan Approvals Data from the Nairobi City County
Section III: Commercial Office Performance, by Location and by Grades
The Commercial Office sector realized a 0.1%-points increase in average rental yields in 2024 to 7.8%, from 7.7% recorded in 2023 attributable to increased occupancy and rental rates. Average asking rents per SQFT in the Nairobi Metropolitan Area (NMA) increased by 1.7% to Kshs 105 per SQFT from Kshs 103 per SQFT in 2023. Additionally, occupancy rates increased by 1.2%-points to 80.7% from 79.5% achieved in 2023. The sector's improved performance can be attributed to various factors, including; i) the gradual resurgence of demand for physical spaces as more firms resumed full operations, ii) economic recovery which boosted business confidence and operations, iii) a more stable and favourable business environment post-COVID-19 era also played a role in the sector's improved performance. The table below summarizes the performance of the commercial office theme over time:
|
|
(All Values in Kshs Unless Stated Otherwise) |
|||||||||||
|
|
Cytonn Report: Commercial Office Performance Over Time |
|||||||||||
|
Year |
2015 |
2016 |
2017 |
2018 |
2019 |
2020 |
2021 |
2022 |
2023 |
2024 |
y/y ∆ 2023 |
|
|
Occupancy (%) |
89.0% |
88.0% |
82.6% |
83.8% |
80.3% |
77.7% |
77.6% |
79.4% |
79.5% |
80.7% |
1.2% |
|
|
Asking Rents (Kshs/SQFT) |
97 |
97 |
101 |
101 |
96 |
93 |
94 |
96 |
103 |
105 |
1.7% |
|
|
Average Prices (Kshs/SQFT) |
12,776 |
12,031 |
12,649 |
12,407 |
12,638 |
12,280 |
12,106 |
12,223 |
12,673 |
12,677 |
(0.5%) |
|
|
Node Average Rental Yields (%) |
8.1% |
8.5% |
7.9% |
8.3% |
7.5% |
7.0% |
7.3% |
7.6% |
7.7% |
7.8% |
0.1% |
|
Source: Cytonn Research
- Commercial Office Performance by Nodes
For the purposes of submarket analysis, we categorized the primary office locations within the Nairobi Metropolitan Area into 9 major nodes; i) Nairobi CBD, ii) Westlands, covering environs including Riverside, iii) Parklands, iv) Mombasa Road, v) Thika Road, vi) Upperhill, vii) Karen, viii) Gigiri, and, ix) Kilimani, which includes offices in Kilimani, Kileleshwa and Lavington.
The table below shows the Nairobi Metropolitan Area (NMA) sub-market performance;
|
All values in Kshs unless stated otherwise |
|||||||||||
|
Cytonn Report: Nairobi Metropolitan Area Commercial Office Market Performance FY’2024 |
|||||||||||
|
Area |
Price/SQFT FY 2023 |
Rent/SQFT FY 2023 |
Occupancy FY 2023 |
Rental Yields FY 2023 |
Price Kshs/ SQFT FY 2024 |
Rent Kshs/ SQFT FY 2024 |
Occupancy FY 2024 |
Rental Yield FY 2024 |
∆ in Rent |
∆ in occupancy |
∆ in Rental Yields (% points) |
|
Gigiri |
15,000 |
128 |
79.8% |
8.2% |
14,850 |
131 |
82.6% |
8.8% |
2.3% |
2.8% |
0.6% |
|
Westlands |
12,504 |
120 |
75.1% |
8.5% |
12,448 |
119 |
80.4% |
8.5% |
(0.7%) |
5.3% |
0.1% |
|
Karen |
14,246 |
115 |
80.1% |
7.8% |
12,873 |
101 |
82.9% |
8.3% |
(12.5%) |
2.8% |
0.5% |
|
Kilimani |
13,051 |
102 |
83.6% |
7.9% |
14,077 |
115 |
80.9% |
8.2% |
12.9% |
(2.7%) |
0.3% |
|
Upperhill |
13,086 |
100 |
75.2% |
6.8% |
12,206 |
92 |
86.6% |
7.9% |
(8.2%) |
11.4% |
1.0% |
|
Parklands |
11,875 |
92 |
85.8% |
8.0% |
11,922 |
94 |
83.0% |
7.8% |
2.2% |
(2.8%) |
(0.2%) |
|
Nairobi CBD |
12,000 |
90 |
85.0% |
7.6% |
12,857 |
104 |
76.1% |
7.6% |
15.7% |
(8.9%) |
0.0% |
|
Thika Road |
12,571 |
79 |
79.4% |
6.0% |
12,643 |
90 |
79.3% |
6.7% |
14.1% |
0% |
0.7% |
|
Mombasa Road |
11,325 |
72 |
74.5% |
5.7% |
11,325 |
80 |
72.2% |
6.5% |
10.7% |
(2.3%) |
0.8% |
|
Average |
12,673 |
103 |
79.5% |
7.7% |
12,614 |
105 |
80.7% |
7.8% |
4.1% |
0.6% |
0.1% |
Source: Cytonn Research
Key take-outs from the table above include;
- In FY’2024, Gigiri emerged as the top-performing node, boasting an average rental yield of 8.8%, surpassing the market average of 7.8% by 1.0% point. Westlands followed closely as the second-best performing node, achieving an average rental yield of 8.5%. Karen secured the third position with an average rental yield of 8.3%. The strong demand for premium office spaces and the attractiveness of investment opportunities in these areas can be attributed to several key factors: i) These locations feature a high concentration of top-tier office buildings that command premium rental rates and yields, ii) Landlords in these areas often prefer to collect rent in dollars, enhancing the investment appeal, iii) Well-developed infrastructure and abundant amenities add significant value to investments in these locations, iv) The presence of multinational corporations, international organizations, and embassies increases the demand for high-quality office spaces, and,
- On the contrary, Mombasa Road emerged as the least performing node in FY’2024, recording an average rental yield of 6.5%, which was 1.2%-points lower than the market average of 7.7%. Several factors contributed to this underperformance: i) The high prevalence of lower-quality office buildings in this area leads to lower average rental rates, typically around Kshs 72 per SQFT as compared to an average of Kshs 103 per SQF , ii) Mombasa Road is predominantly recognized as an industrial zone, reducing its attractiveness to office-based businesses seeking commercial spaces, iii) Intense competition from other sub-markets further compounds the challenges Mombasa Road faces in attracting tenants and achieving higher rental yields.
- Commercial Office Performance by Class/Grade:
Commercial office buildings are categorized into three main classes based on the quality and sizes of office spaces as follows:
- Grade A: These are high quality office buildings characterized by their adequate amenities, facilities, and finishes. They therefore fetch higher rental rates and yields compared to other office types. Also, these office building sizes range from 100,001 - 300,000 SQFT,
- Grade B: These office buildings have their sizes ranging between 50,000 to 100,000 SQFT. They have good amenities and services, however not as good as Grade A offices, hence charge moderate rental rates, and,
- Grade C: These buildings are usually old, hence their lack of adequate services and facilities. Usually, they charge rents below the average market rate.
Based on our analysis of office grade distribution, Grade A offices dominated the office space market in the Nairobi Metropolitan Area during 2024, comprising 49.2% of the total market share. This reflects an increase of 19.2%-points from the 30.0% observed in 2023. This increase can be attributed to the increased completion of Grade A offices, exemplified by developments purple towers, matrix one in Westlands, Mandrake and the Atrium in Kilimani. Notably, the supply of Grade B office spaces contracted by 9.1% to reach 43.2% from the previous 52.4 % recorded in 2023, this decline is attributable increase in the number of the Grade A officers in the market competitively substituting Grade B offices
In our nodal analysis, Gigiri, Mombasa Road and Karen exhibited the highest proportion of Grade A offices, accounting for 79.0%, 73.5% and 62.5% respectively of their total office inventory. Conversely, Kilimani maintained the highest percentage of Grade B offices at 68.2%, a drop from 76.9% recorded in 2023. Regarding Grade C offices, Nairobi CBD retained the highest share of office spaces, comprising 20.0% of the current market share, however, this was a decrease from 29.4% recorded in 2023
In terms of concentration, Westlands boasted the highest mix of office types, with Grade A, Grade B, and Grade C office spaces making up 55.4%, 34.6%, and 10.0% respectively of its total office inventory. The distribution of various office classes/grades is as summarized in the table below: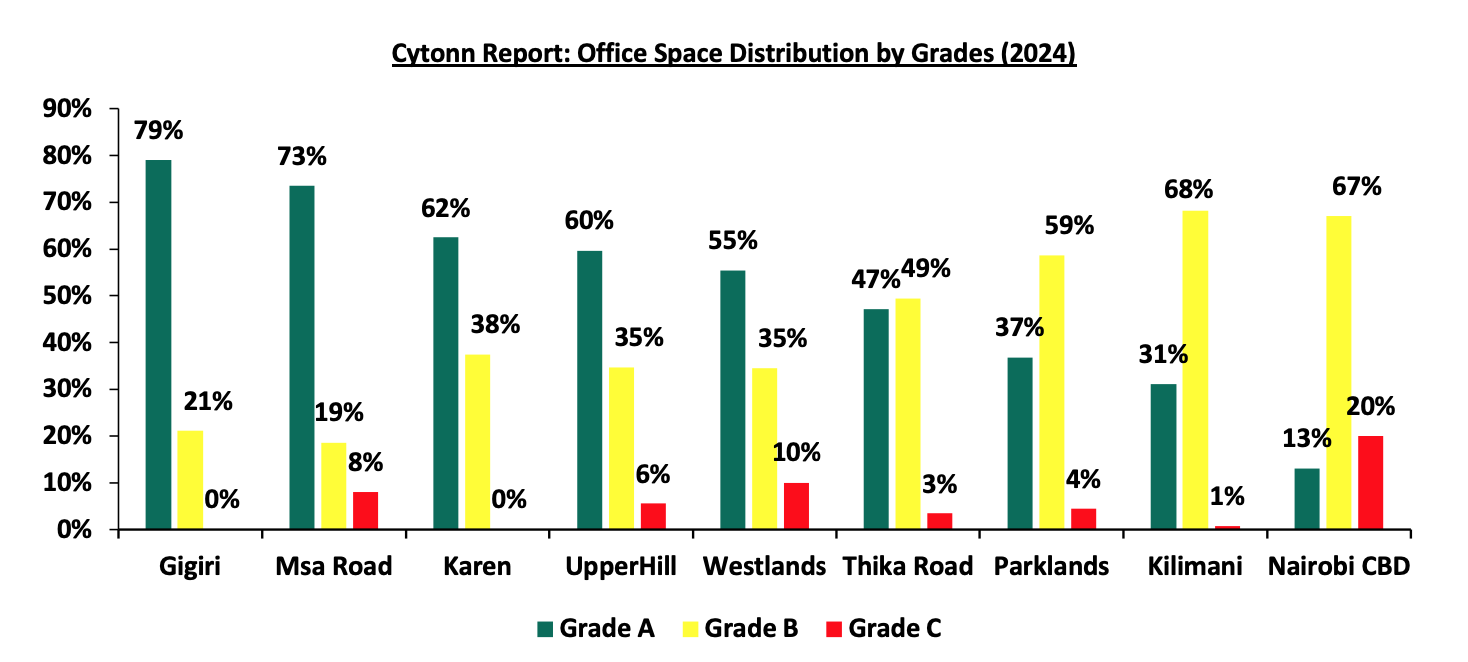
Source: Cytonn Research
In terms of performance;
- Grade A and Grade B office spaces achieved the highest rental yields, both reaching 7.6% and 7.9% respectfully. The strong performance of Grade A offices can be attributed to their growing popularity among tenants, as evidenced by a 2.5% increase in occupancy rates. This rise is mainly due to their competitively affordable rental rates and quality compared to Grade B offices, which experienced a 0.1% increase in occupancy rates. Additionally, Grade A and B offices offer superior technical services compared to Grade C spaces. However, Grade C office spaces demonstrated a significant improvement in occupancy rates, increasing by 2.2% in 2024,
- Grade B offices saw the most substantial Year-on-Year (y/y) rise in rental rates, increasing by 2.9% in 2024 to Kshs 102 per SQFT from Kshs 98.7 per SQFT in 2023. This surge is credited to the affordability of Grade B spaces, which command higher occupancies, as well as heightened demand from the local top tier corporations and organizations, and,
- Grade A offices saw a decrease in the average rental yields, which can be attributed to the decrease in rents by 0.3% to Kshs 119 from Kshs 119.4% in 2023. Grade A offices dominated the office space market in the Nairobi Metropolitan Area during 2024, comprising 49.2% of the total market share. Grade A offices increased to 49.2% in 2024 a19.2%-points increase from the 30.0% observed in 2023. This increase in Grade A offices spaces forced the landlords to lower the rents to remain competitive in the market as well as to attract more tenants as evidenced by 2.5% increase in occupancy rates to 78.9% in 2024 from 76.4% in 2023.
The performance according to grades/class is as summarized in the table below:
|
(All Values in Kshs Unless Stated Otherwise) |
|||||||||||
|
Office Grade |
Price 2023 Kshs/SQFT |
Rent 2023 Kshs/SQFT |
Occupancy 2023 |
Rental Yield 2023 |
Price 2024 Kshs/SQFT |
Rent 2024 Kshs/SQFT |
Occupancy 2024 |
Rental Yield 2024 |
∆ Rent Y/Y |
∆ Occupancy Y/Y |
∆ Rental Yield Y/Y |
|
Grade B |
12,572 |
98.7 |
82.2% |
7.8% |
12,519 |
101.6 |
82.3% |
7.9% |
2.9% |
0.1% |
0.2% |
|
Grade A |
13,695 |
119.4 |
76.4% |
7.8% |
13,546 |
119.0 |
78.9% |
7.6% |
(0.3%) |
2.5% |
(0.3%) |
|
Grade C |
11,124 |
86.4 |
77.0% |
7.2% |
11,208 |
88.5 |
79.2% |
7.2% |
2.4% |
2.2% |
0.1% |
|
Average |
12,673 |
103.0 |
79.5% |
7.7% |
12,614 |
105 |
80.8% |
7.7% |
1.7% |
1.6% |
0.0% |
Source: Cytonn Research
- Commercial Office Performance by Class and Node:
In 2024, Grade A offices in Thika Road and Gigiri achieved the highest average rental yields, reaching 9.5% and 9.0% respectfully. This was primarily due to; i) their strategic locations attract high-end clientele willing to pay premium rates, often in dollars, ii) the availability of adequate amenities and well-developed infrastructure enhancing accessibility in these areas, iii) the serene environment provides an ideal office setting, away from the hustle and bustle of the city center. Grade C offices performed well in some nodes such as Westlands and Nairobi CBD where they out performed Grade A rental yield. For instance; despite Grade A offices in Westlands charging higher rental rates at Kshs 119 per SQFT compared to Grade C offices' average rates of Kshs 88.5 per SQFT, Grade C offices had higher yields at 8.2% compared to the 7.6% recorded by Grade A offices since they have higher occupancy signifying their high demand. In contrast, Grade B offices in Kilimani, gigiri, and Westlands boasted the highest rental yields all to reach a 8.4% in yields. Similarly, Grade C offices in Westlands Nairobi CBD and Upperhill delivered the best returns with average rental yields reaching 8.1%, 7.9% and 7.9% respectively. The class performance by node is as summarized in the table below with the best performing areas of each grade highlighted in yellow;
|
Cytonn Report: Commercial Office Performance in 2024 by Nodes and Grades |
||||||
|
|
Grade A |
|
Grade B |
|
Grade C |
|
|
Location |
Average of Occupancy (%) |
Average of Rental Yield |
Average of Occupancy (%) |
Average of Rental Yield |
Average of Occupancy (%) |
Average of Rental Yield |
|
Gigiri |
83.7% |
9.0% |
81.0% |
8.4% |
|
|
|
Karen |
82.0% |
7.9% |
79.7% |
8.0% |
|
|
|
Kilimani |
78.0% |
7.0% |
84.4% |
8.4% |
78.5% |
4.9% |
|
Msa Road |
75.7% |
6.4% |
72.5% |
6.4% |
70.0% |
5.9% |
|
Nairobi CBD |
60.0% |
6.2% |
88.2% |
7.9% |
88.4% |
7.9% |
|
Parklands |
84.7% |
7.7% |
82.9% |
8.0% |
80.0% |
7.4% |
|
Thika Road |
75.0% |
9.5% |
81.0% |
6.3% |
75.0% |
5.8% |
|
UpperHill |
78.1% |
7.2% |
74.7% |
7.1% |
75.1% |
7.9% |
|
Westlands |
77.1% |
7.6% |
82.5% |
8.4% |
82.0% |
8.1% |
Source: Cytonn Research
- Serviced Offices
In 2024, serviced offices experienced a notable 1.6% year-on-year (y/y) growth in rental revenues, with average rental rates rising to Kshs 215.2 per SQFT, up from Kshs 211.6 per SQFT in 2023. In contrast, unserviced offices saw a more modest revenue increase of 4.1%, with average rental rates climbing to Kshs 105 per SQFT in 2024, compared to Kshs 103 per SQFT in 2023. Notably, serviced offices in Nairobi CBD and Westlands recorded the most substantial rent hikes of 5.0% and 3.5% respectively. The improved performance in these areas can be attributed to several factors: i) the presence of quality infrastructure, enhancing accessibility, ii) increased demand for serviced offices driven by a high-end clientele and international firms with evolving preferences, iii) diverse themes and sophisticated designs demanding top-tier standards, iv) high-quality facilities attracting premium rents, often in dollars, and v) tranquil office locations appealing to clients seeking to escape the hustle and bustle of the city. The table below gives a comparison of the performance of the NMA serviced office sector;
|
(All values in Kshs Unless Stated Otherwise) |
||||||
|
Cytonn Report: Nairobi Metropolitan Area Serviced Office Performance |
||||||
|
Location |
Revenue Per SQFT 2023 |
Revenue Per SQFT 2024 |
Serviced Offices Revenue growth (%) |
Unserviced Offices Revenue growth (%) |
||
|
Serviced Offices |
Un-serviced Offices |
Serviced Offices |
Un-serviced Offices |
|||
|
Westlands |
258 |
120 |
267 |
119 |
3.5% |
(0.7%) |
|
Karen |
217 |
115 |
221 |
101 |
2.0% |
(12.5%) |
|
Parklands |
193 |
92 |
194 |
94 |
0.3% |
2.2% |
|
Gigiri |
278 |
128 |
283 |
131 |
1.6% |
2.3% |
|
Upperhill |
242.5 |
100 |
243 |
92 |
0.2% |
(8.2%) |
|
Kilimani |
229 |
102 |
233 |
115 |
1.7% |
12.9% |
|
Nairobi CBD |
187 |
90 |
196 |
104 |
5.0% |
15.7% |
|
Msa Rd |
180 |
72 |
180 |
80 |
0.0% |
10.7% |
|
Thika Rd |
120 |
79 |
120 |
90 |
0.0% |
14.1% |
|
Average |
211.6 |
103 |
215.2 |
105 |
1.6% |
4.1% |
Source: Cytonn Research
In 2024, there was a noticeable surge in the development of specialized office spaces tailored to specific niches in Kenya, particularly in the realm of co-working spaces. Illustrating this trend, IWG, a global leader in hybrid working solutions known for its prestigious lineup of brands like Spaces and Regus, unveiled a workspace center on Pramukh Towers Westlands. Spanning an impressive 20000 square feet, this center offers a diverse array of co-working zones, private offices, cutting-edge meeting facilities, and inspiring creative spaces. We expect a rise in the establishment of additional co-working spaces in the future. According to Knight Frank’s H2 2024 Kenya Market Update, many organizations opted to return to working from office adopting physical offices over working remote. The table below highlights major co-working office spaces released into the market in 2024;
|
Cytonn Report: Notable Co-working Space Office Developments delivered in 2024 |
||||
|
# |
Space provider |
Office Name |
Location |
Size (SQFT) |
|
1 |
IWG |
Pramukh Towers |
Westlands |
20,000 |
|
2 |
Horizons |
Two Rivers |
Ruaka |
|
Source: Cytonn Research, Knight Frank
Section IV: Office Market Outlook and the Investment Opportunity in the Sector
Our overall outlook for the Nairobi Metropolitan Area commercial office sector is POSITIVE. We expect the sector to remain stable with a slight improvement attributable to i) the increasing presence of multinational companies in Kenya is likely to drive up occupancy levels, ii) co-working spaces are gaining in popularity in the region iii) the gradual return to “working from office” after the Covid-19 pandemic, iv) more start-ups are expected to drive demand for commercial spaces, and v) a considerable take-up of prevailing commercial office spaces after developers adopted a 'wait-and-see' approach to avoid vacancies in newly built spaces, However, the sector continues to face challenges due to a significant oversupply of office space, currently standing at 5.7 mn SQFT. Despite these challenges, there are attractive investment opportunities in areas such as Westlands, Gigiri, Karen and Kilimani, which offer returns that exceed the market average.
|
Cytonn Report: Nairobi Metropolitan Area (NMA) Commercial Office Outlook |
||||
|
Measure |
2023 Sentiment |
2024 Sentiment and 2025 Outlook |
2024 Review |
2025 Outlook |
|
Supply |
The oversupply of commercial office space remained unchanged at approximately 5.8 mn SQFT in 2023 attributable to escalating construction costs, which dissuaded developers from initiating new projects or expanding existing ones, thus limiting the influx of additional office space into the market. Despite the persistent oversupply, there was a notable decline in the average office vacancy rate, decreasing from 20.6% in 2022 to 19.7% in 2023. This decline was attributed to the gradual recovery in demand for office space following the impact of the COVID-19 pandemic in 2020. Consequently, the heightened demand led to faster absorption rates of both new and existing developments throughout 2023, even with the introduction of 0.3 Mn SQFT of office space into the market—a 50.0% reduction from the 0.6 Mn SQFT supplied in 2022 |
In 2024, the Nairobi Metropolitan Area (NMA) commercial office sector experienced a consistent oversupply of office space, amounting to 5.7 mn square feet (SQFT), a figure comparable to that of 2023 5.8 Mn. This decrease in the supply can be primarily be contributable to decrease in vacancy rates by 0.4% points to 19.3% in 2024 from 19.7% in 2023. Increase in occupancy rates was supported by factors such as market recovery from the global pandemic which has seen companies and organizations abolish remote working. Consequently, there was heightened demand which led to faster absorption rates of both new and existing developments throughout 2024, even with the introduction of 0.6 Mn SQFT of office space into the market—a 113.5% increase from the 0.3 Mn SQFT supplied in 2023. The oversupply is caused by the factors such as construction of new office spaces such as Purple Towers in Mombasa road and the Atrium in Nyali road and easing economic pressures evidenced by reducing inflation rate and CBK rates We expect the office space oversupply to increase by 29.6% to 7.0 mn SQFT from 5.7 mn SQFT in 2024 attributable to an expected increase in vacancy rates by 0.9% to 20.2% from 19.3% in 2024, and reduced demand from 1.7 mn SQFT in 2024 to 0.1 mn SQFT in 2025. Also, construction of new office spaces expected within 2025 year amounting to more than 0.2 Mn SQF |
Neutral |
Neutral |
|
Demand |
There was an increased demand for office spaces in the NMA, evidenced by the 0.1% increase in the average occupancy rates which came in at 79.5% in 2023 from 79.4% recorded in 2022. This was mainly attributed to i) the gradual resurgence of demand for physical spaces as more firms resumed full operations, increased availability of high-quality Grade A office spaces, exemplified by Regus, Ikigai, and Spaces, which command premium rents, iii) expansion strategies adopted by companies like Call Centre International (CCI) Group bolstering occupancy rates, and iv) a more stable and favorable business environment post-COVID-19 era also played a role in the sector's improved performance. Furthermore, office space uptake rose by 10.0% to reach 1.1 mn SQFTin 2023, up from the 1.0 mn SQFT registered in 2022. This increase is credited to a higher occupancy rate of both conventional unserviced and serviced office spaces, driven by the resumption of full business operations across various sectors |
The Commercial Office sector realized a 0.1%-points increase in average rental yields in 2024 to 7.8%, from 7.7% recorded in 2023 attributable to increased occupancy and rental rates. Average asking rents per SQFT in the Nairobi Metropolitan Area (NMA) increased by 1.7% to Kshs 105 per SQFT from Kshs 103 per SQFT in 2023. Additionally, occupancy rates increased by 1.2%-points to 80.7% from 79.5% achieved in 2023. The sector's improved performance can be attributed to various factors, including; i) the gradual resurgence of demand for physical spaces as more firms resumed full operations, ii) economic recovery which boosted business confidence and operations, iii) a more stable and favourable business environment post-COVID-19 era also played a role in the sector's improved performance. Furthermore, office space uptake rose by 93.6% to reach 0.7 Mn SQFT in 2023, up from the 0.3 Mn SQFT registered in 2023. This increase is credited to a higher occupancy rate of both conventional unserviced and serviced office spaces, driven by the resumption of full business operations across various sectors We expect the occupancy rates to stabilize mainly attributed to the recovery that has been happening since 2020, businesses are still exercising caution due to the uncertainties in the market, abolition of remote work policies by companies, however the occupancies might be affected by an oversupply of 7.0 mn SQFT of office spaces in 2025. These factors are likely to stabilize absorption rates |
Positive |
Neutral |
|
Office Market Performance |
The average rental yield improved by 0.1% points to 7.7% in FY’2023 from 7.6% recorded in FY’2022, due to improved occupancy and rental rates. Average asking rents per SQFT in the NMA increased by 7.0% to Kshs 103 per SQFT from Kshs 96, owing to increased availability of high-quality Grade A office spaces, exemplified by Regus, Ikigai, and Spaces, which command premium rents. The overall occupancy rates increased by 0.1% points to 79.5% from 79.4% as a result of a slow but rising demand for physical space on the back of various firms resuming full operations, coupled with the expansion strategy by various firms such Call Centre International (CCI) Group. |
The Commercial Office sector realized a 0.1%-points increase in average rental yields in 2024 to 7.8%, from 7.7% recorded in 2023 attributable to increased occupancy and rental rates. Average asking rents per SQFT in the Nairobi Metropolitan Area (NMA) increased by 1.7% to Kshs 105 per SQFT from Kshs 103 per SQFT in 2023. Additionally, occupancy rates increased by 1.2%-points to 80.7% from 79.5% achieved in 2023. The sector's improved performance can be attributed to various factors, including; i) the gradual resurgence of demand for physical spaces as more firms resumed full operations, ii) economic recovery which boosted business confidence and operations, iii) a more stable and favourable business environment post-COVID-19 era also played a role in the sector's improved performance. Serviced offices experienced a notable 1.6% year-on-year (y/y) growth in rental revenues, with average rental rates rising to Kshs 215.2 per SQFT, up from Kshs 211.6 per SQFT in 2023. In contrast, unserviced offices saw a more modest revenue increase of 4.1%, with average rental rates climbing to Kshs 105 per SQFT in 2024, compared to Kshs 103 per SQFT in 2023. We anticipate a modest increase in rental yields for the sector in 2025, driven by several factors; i) the growing popularity of serviced office spaces is expected to contribute positively to this trend, ii) while the sector's expansion may be gradual, it is steadily progressing, supported by the ongoing recovery of the economy towards pre-COVID-19 levels, iii) the pipeline of developments in the sector is expected to help address the oversupply challenge, thereby improving absorption rates for available and incoming spaces. As a result, we foresee an improvement in occupancy rates and asking rents, which will ultimately enhance average rental yields. However, the projected oversupply of office spaces, estimated at 6.8 Mn square feet in the Nairobi Metropolitan Area, is expected to exert downward pressure on the sector's overall performance by dampening demand for physical space. |
Positive |
Positive |
Our overall outlook for the Nairobi Metropolitan Area commercial office sector is POSITIVE. We expect the sector to remain stable with a slight improvement attributable to i) the increasing presence of multinational companies in Kenya is likely to drive up occupancy levels, ii) co-working spaces are gaining in popularity in the region iii) the gradual return to “working from office” after the Covid-19 pandemic, iv) more start-ups are expected to drive demand for commercial spaces, and v) a considerable take-up of prevailing commercial office spaces after developers adopted a 'wait-and-see' approach to avoid vacancies in newly built spaces, However, the sector continues to face challenges due to a significant oversupply of office space, currently standing at 5.7 mn SQFT. Despite these challenges, there are attractive investment opportunities in areas such as Westlands, Gigiri, and Kilimani, which offer returns that exceed the market average.
Disclaimer: The views expressed in this publication are those of the writers where particulars are not warranted. This publication, which follows Section 2 of the Capital Markets Authority Act Cap 485A, is meant for general information only and is not a warranty, representation, advice or solicitation of any nature. Readers are advised in all circumstances to seek the advice of a registered investment advisor

- Talk to us
- Kenya
- P.O Box 20695 - 00200, Nairobi, Kenya
- Cell +254709101200
- Tel +254709101200
- WhatsApp +254741676635
- United States
- +254709101200
- DOWNLOAD OUR APP
-


- Kenya
- 8th Floor, Pinetree Plaza, Kaburu Drive, Ngong Road, Nairobi, Kenya
- USA
- Suite 1150, 1775 Eye Street NW, USA, Washington DC 20006, USA
- Investments
- High Yield
- Private Equity
- Real Estate
- Real Estate
- RiverRun Estates
- Cytonn Towers
- The Ridge
- Taraji Heights
- The Alma