Nairobi Metropolitan Area (NMA) Land Report 2025, & Cytonn Weekly #38.2025
By Research Team, Sep 28, 2025
Executive Summary
Fixed Income
During the week, T-bills were undersubscribed for the second consecutive week, with the overall subscription rate coming in at 62.9%, lower than the subscription rate of 95.7% recorded the previous week. Investors’ preference for the shorter 91-day paper waned, with the paper receiving bids worth Kshs 1.6 bn against the offered Kshs 4.0 bn, translating to a subscription rate of 40.5%, lower than the subscription rate of 106.2%, recorded the previous week. The subscription rates for the 182-day and 364-day papers decreased to 19.4% and 115.3% from the 55.8% and 131.3% respectively recorded the previous week. The government accepted a total of Kshs 15.0 bn worth of bids out of Kshs 15.1 bn bids received, translating to an acceptance rate of 99.3%. The yields on the government papers were on a downward trajectory with the yields on the 91-day paper decreasing the most by 3.2 bps to 7.91% from the 7.95% recorded the previous week while the yields on the 182-day and 364-day paper decreased by 2.5 bps and 0.4 bps to 7.99% and 9.53% respectively, from the 8.01% and 9.54% respectively recorded the previous week;
In the primary bond market, the government is looking to raise Kshs 50.0 bn through the reopened bonds; FXD1/2018/015 and FXD1/2021/020 with fixed coupon rates of 12.7% and 13.4% respectively and tenors to maturity of 7.7 years, and 15.9 years respectively. The period of sale for the two bonds opened on Friday, 26th September 2025 will close on 15th October 2025. Our recommended bidding ranges for FXD1/2018/015 and FXD1/2021/020 are 12.75%-13.50% and 13.50%-14.50% respectively;
We are projecting the y/y inflation rate for September 2025 to remain stable within the range of 4.1% – 4.6%;
Equities
During the week, the equities market was on an upward trajectory, with NSE 10 gaining the most by 3.7%, while NSE 25, NSE 20 and NASI gained by 3.0%, 2.6% and 2.5% respectively, taking the YTD performance to gains of 44.7%, 41.9%, 34.7% and 34.0% for NSE 20, NASI, NSE 10 and NSE 25 respectively. The equities market performance was driven by gains recorded by large-cap stocks such as Co-operative bank, Equity bank and KCB of 10.4%, 7.4% and 6.0% respectively;
Additionally, in the regional equities market, the East African Exchanges 20 (EAE 20) share index lost by 0.1% to 100.2 from 100.3 recorded the previous week, attributable to losses recorded by large cap stocks such as ABSA, NMB Bank and Stanbic Uganda of 12.6%, 4.6% and 4.0% respectively. The performance was, however, supported by gains recorded by large cap stocks such as KCB, Equity Bank and CRDB of 8.5%, 5.6% and 4.5% respectively;
Real Estate
During the week, The Athi River–Machakos dual carriageway was officially completed, marking a major milestone in efforts to ease traffic congestion along the busy Mombasa Road corridor. Spanning 20 kilometers, the road is an extension of the Mombasa Road dual carriageway and was designed to improve safety and reduce traffic delays in the area. The project cost Kshs 6.2 bn and was jointly funded by the World Bank and the Kenyan government, with contributions made on a 60:40 basis;
On the Unquoted Securities Platform, Acorn D-REIT and I-REIT traded at Kshs 27.4 and Kshs 23.2 per unit, respectively, as per the last updated data on 19th September 2025. The performance represented a 37.0% and 16.0% gain for the D-REIT and I-REIT, respectively, from the Kshs 20.0 inception price. Additionally, ILAM Fahari I-REIT traded at Kshs 11.0 per share as of 19th September 2025, representing a 45.0% loss from the Kshs 20.0 inception price;
Focus of the Week
In July 2024, we released the Nairobi Metropolitan Area Land Report 2024, which highlighted that the Nairobi Metropolitan Area (NMA) land sector recorded an improvement in performance with the average annual price appreciation coming in at 3.9% in FY’2023/24, 0.6% points lower than the 4.5% appreciation recorded in FY’2022/23. The performance represented a 13-year average price appreciation CAGR of 8.2%, with the average selling price for land coming in at Kshs 132.7 mn in FY’2023/24, from Kshs 47.9 mn in 2011.
The performance during this period was mainly driven by the increased demand for Un-serviced land in satellite towns of the Nairobi Metropolitan and serviced land in Satellite Towns mainly driven by; i) the government’s significant investments in infrastructure particularly road networks and utilities which in turn stimulated growth in Satellite towns e.g. the Southern and Eastern Bypass, ii) heightened construction activities, especially in the residential sector, driven by the government’s affordable housing agenda, which in turn boosted demand for land, iii) limited supply of land especially in urban areas which contributed to rising land prices as demand from buyers outpaced availability, iv) growing demand for housing which was driven by positive demographics such as high population and urbanization, which by then stood at 1.9% and 3.7% respectively, and, v) growth in popularity of satellite towns by investors and buyers which provided affordable land options in comparison to the suburbs and key commercial zones.
This week, we update our report by discussing the overall performance of the NMA land sector over time, and examining various factors that influence its performance based on selling prices and annual capital appreciation. Additionally, we identify investment opportunities for the sector, using 2025 market research data.
Investment Updates:
- Weekly Rates:
- Cytonn Money Market Fund closed the week at a yield of 12.8% p.a. To invest, dial *809# or download the Cytonn App from Google Play store here or from the Appstore here;
- We continue to offer Wealth Management Training every Tuesday, from 7:00 pm to 8:00 pm. The training aims to grow financial literacy among the general public. To register for any of our Wealth Management Trainings, click here;
- If interested in our Private Wealth Management Training for your employees or investment group, please get in touch with us through wmt@cytonn.com;
- Cytonn Insurance Agency acts as an intermediary for those looking to secure their assets and loved ones’ future through insurance namely; Motor, Medical, Life, Property, WIBA, Credit and Fire and Burglary insurance covers. For assistance, get in touch with us through insuranceagency@cytonn.com;
- Cytonn Asset Managers Limited (CAML) continues to offer pension products to meet the needs of both individual clients who want to save for their retirement during their working years and Institutional clients that want to contribute on behalf of their employees to help them build their retirement pot. To more about our pension schemes, kindly get in touch with us through pensions@cytonn.com;
Hospitality Updates:
- We currently have promotions for Staycations. Visit cysuites.com/offers for details or email us at sales@cysuites.com;
Money Markets, T-Bills Primary Auction:
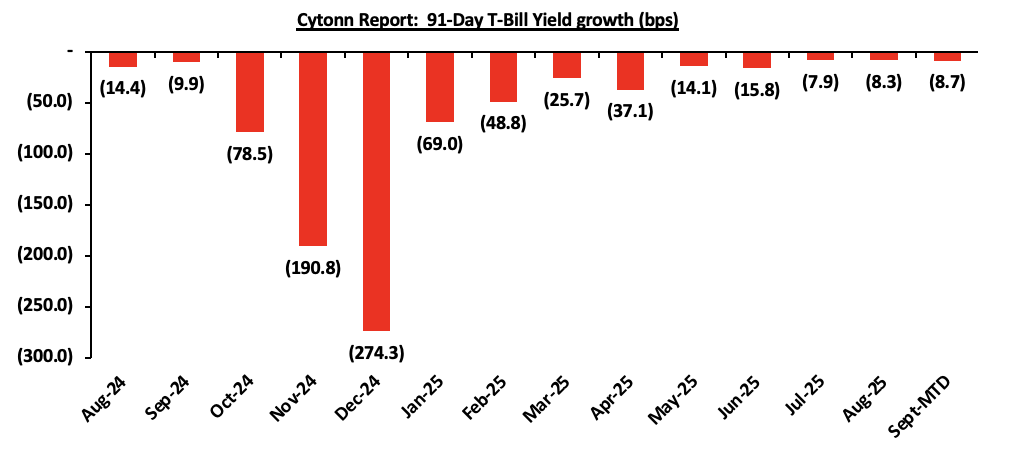
This week, T-bills were undersubscribed for the second consecutive week, with the overall subscription rate coming in at 62.9%, lower than the subscription rate of 95.7% recorded the previous week. Investors’ preference for the shorter 91-day paper waned, with the paper receiving bids worth Kshs 1.6 bn against the offered Kshs 4.0 bn, translating to a subscription rate of 40.5%, lower than the subscription rate of 106.2%, recorded the previous week. The subscription rates for the 182-day and 364-day papers decreased to 19.4% and 115.3% from the 55.8% and 131.3% respectively recorded the previous week. The government accepted a total of Kshs 15.0 bn worth of bids out of Kshs 15.1 bn bids received, translating to an acceptance rate of 99.3%. The yields on the government papers were on a downward trajectory with the yields on the 91-day paper decreasing the most by 3.2 bps to 7.91% from the 7.95% recorded the previous week while the yields on the 182-day and 364-day paper decreased by 2.5 bps and 0.4 bps to 7.99% and 9.53% respectively, from the 8.01% and 9.54% respectively recorded the previous week.
The chart below shows the yield growth rate for the 91-day paper in the year to August 2025 and month-to-date:
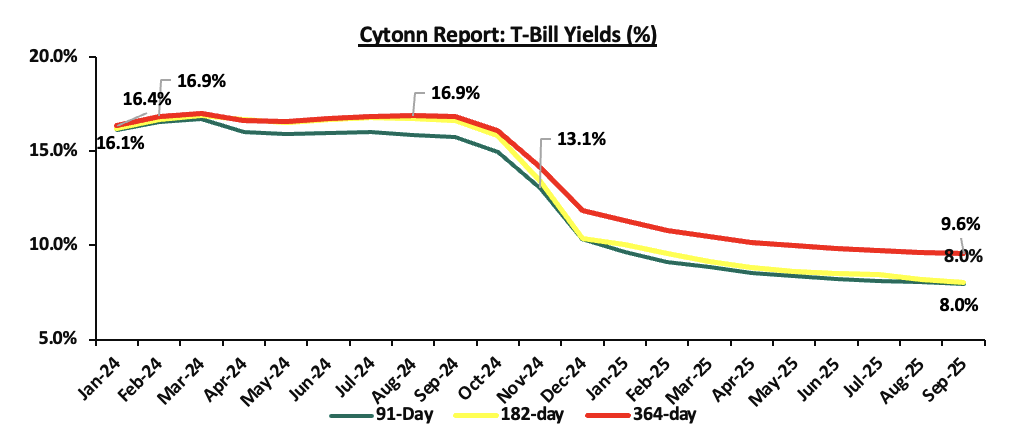
The charts below show the performance of the 91-day, 182-day and 364-day papers from January 2024 to September 2025:
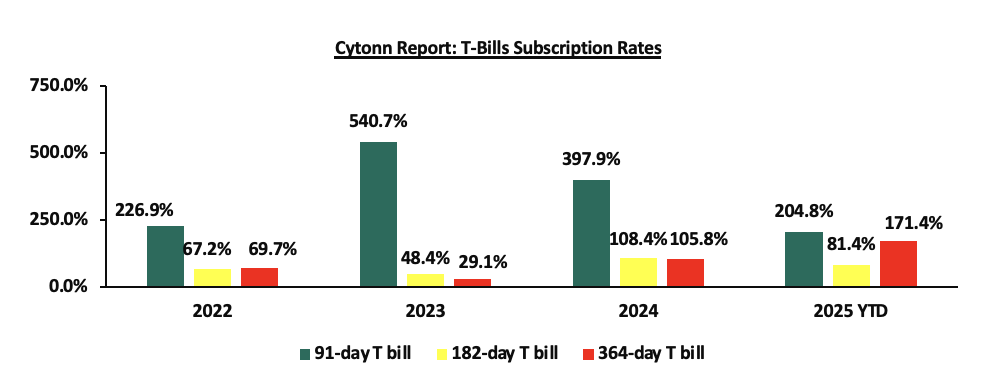
The chart below compares the overall average T-bill subscription rates obtained in 2022,2023, 2024 and 2025 Year-to-date (YTD):
In the primary bond market, the government is looking to raise Kshs 50.0 bn through the reopened bonds; FXD1/2018/015 and FXD1/2021/020 with fixed coupon rates of 12.7% and 13.4% respectively and tenors to maturity of 7.7 years, and 15.9 years respectively. The period of sale for the two bonds opened on Friday, 26th September 2025 will close on 15th October 2025. Our recommended bidding ranges for FXD1/2018/015 and FXD1/2021/020 are 12.75%-13.50% and 13.50%-14.50% respectively.
Money Market Performance:
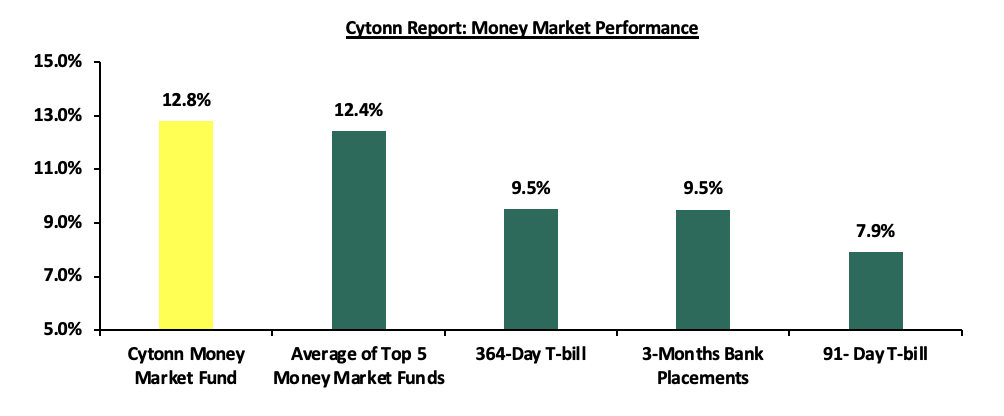
In the money markets, 3-month bank placements ended the week at 9.5% (based on what we have been offered by various banks), The yield on the 91-day paper decreased 3.2 bps to 7.91% from the 7.95% recorded the previous week while the yield on the 364-day paper decreased by 0.4 bps to 9.53% from the 9.54% recorded the previous week. The yield on the Cytonn Money Market Fund decreased by 12.0 bps to 12.8%, from 12.9% recorded in the previous week, while the average yields on the Top 5 Money Market Funds decreased by 20.2 bps to 12.4% from 12.6% recorded the previous week.
The table below shows the Money Market Fund Yields for Kenyan Fund Managers as published on 26th September 2025:
|
Money Market Fund Yield for Fund Managers as published on 26th September 2025 |
||
|
Rank |
Fund Manager |
Effective Annual Rate |
|
1 |
Ndovu Money Market Fund |
13.1% |
|
2 |
Cytonn Money Market Fund ( Dial *809# or download Cytonn App) |
12.8% |
|
3 |
Gulfcap Money Market Fund |
12.2% |
|
4 |
Nabo Africa Money Market Fund |
12.1% |
|
5 |
Lofty-Corban Money Market Fund |
12.1% |
|
6 |
Etica Money Market Fund |
12.1% |
|
7 |
Arvocap Money Market Fund |
11.9% |
|
8 |
Kuza Money Market fund |
11.5% |
|
9 |
Enwealth Money Market Fund |
11.1% |
|
10 |
Madison Money Market Fund |
10.9% |
|
11 |
Old Mutual Money Market Fund |
10.7% |
|
12 |
Jubilee Money Market Fund |
10.7% |
|
13 |
British-American Money Market Fund |
10.6% |
|
14 |
GenAfrica Money Market Fund |
10.5% |
|
15 |
Apollo Money Market Fund |
10.0% |
|
16 |
Orient Kasha Money Market Fund |
10.0% |
|
17 |
Dry Associates Money Market Fund |
9.8% |
|
18 |
Faulu Money Market Fund |
9.7% |
|
19 |
Mali Money Market Fund |
9.6% |
|
20 |
Sanlam Money Market Fund |
9.5% |
|
21 |
KCB Money Market Fund |
9.3% |
|
22 |
Co-op Money Market Fund |
9.2% |
|
23 |
CPF Money Market Fund |
9.1% |
|
24 |
ICEA Lion Money Market Fund |
9.1% |
|
25 |
Genghis Money Market Fund |
8.6% |
|
26 |
CIC Money Market Fund |
8.5% |
|
27 |
Mayfair Money Market Fund |
8.4% |
|
28 |
Absa Shilling Money Market Fund |
8.1% |
|
29 |
AA Kenya Shillings Fund |
7.5% |
|
30 |
Ziidi Money Market Fund |
6.8% |
|
31 |
Stanbic Money Market Fund |
6.5% |
|
32 |
Equity Money Market Fund |
5.2% |
Source: Business Daily
Liquidity:
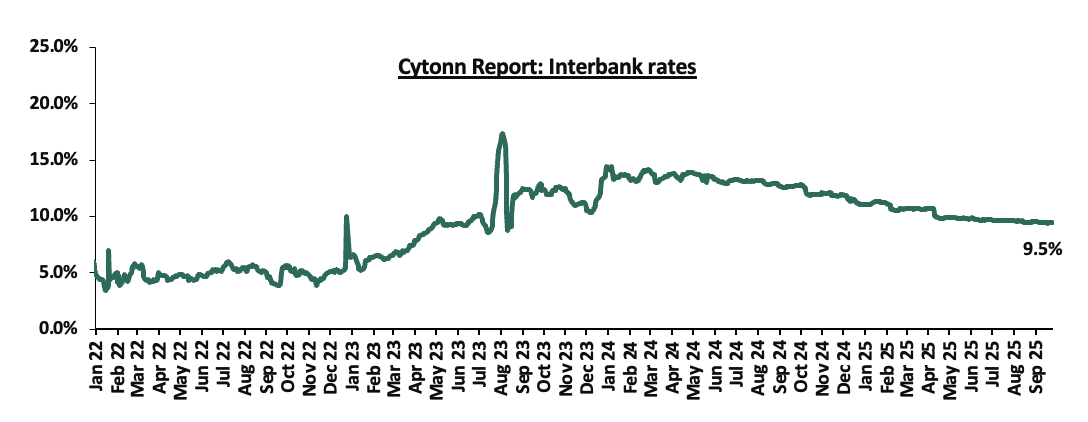
During the week, liquidity in the money markets marginally tightened with the average interbank rate increasing by 1.2 bps, to remain relatively unchanged from the 9.5% recorded the previous week, partly attributable to tax remittances that offset government payments. The average interbank volumes traded increased significantly by 118.0% to Kshs 17.2 bn from Kshs 7.9 bn recorded the previous week.
The chart below shows the interbank rates in the market over the years:
Kenya Eurobonds:
During the week, the yields on Kenya’s Eurobonds were on an upward trajectory with the yields on the 12-year Eurobond issued in 2019 increasing the most by 28.1 bps to 8.2% from 7.9% recorded the previous week. The table below shows the summary performance of the Kenyan Eurobonds as of 25th September 2025;
|
Cytonn Report: Kenya Eurobond Performance |
|||||||
|
|
2018 |
2019 |
2021 |
2024 |
2025 |
||
|
Tenor |
10-year issue |
30-year issue |
7-year issue |
12-year issue |
13-year issue |
7-year issue |
11-year issue |
|
Amount Issued (USD) |
1.0 bn |
1.0 bn |
0.9 bn |
1.2 bn |
1.0 bn |
1.5 bn |
1.5 bn |
|
Years to Maturity |
2.5 |
22.5 |
1.7 |
6.7 |
8.8 |
5.5 |
10.5 |
|
Yields at Issue |
7.3% |
8.3% |
7.0% |
7.9% |
6.2% |
10.4% |
9.9% |
|
2-Jan-25 |
9.1% |
10.3% |
8.5% |
10.1% |
10.1% |
10.1% |
|
|
1-Sep-25 |
6.8% |
9.8% |
- |
8.7% |
9.2% |
8.4% |
|
|
18-Sep-25 |
5.9% |
9.2% |
- |
7.9% |
8.3% |
7.7% |
|
|
19-Sep-25 |
6.2% |
9.4% |
- |
8.2% |
8.6% |
8.0% |
|
|
22-Sep-25 |
6.3% |
9.5% |
- |
8.3% |
8.7% |
8.1% |
|
|
23-Sep-25 |
6.2% |
9.4% |
- |
8.2% |
8.6% |
8.1% |
|
|
24-Sep-25 |
6.0% |
9.3% |
- |
8.1% |
8.4% |
7.9% |
10.0% |
|
25-Sep-25 |
6.1% |
9.3% |
- |
8.2% |
8.5% |
8.0% |
|
|
Weekly Change |
0.2% |
0.1% |
- |
0.3% |
0.1% |
0.3% |
- |
|
MTD Change |
(0.7%) |
(0.5%) |
- |
(0.5%) |
(0.7%) |
(0.4%) |
- |
|
YTD Change |
(3.0%) |
(1.0%) |
- |
(1.9%) |
(1.6%) |
(2.1%) |
- |
Source: Central Bank of Kenya (CBK) and National Treasury
Kenya Shilling:
During the week, the Kenya Shilling depreciated by 1.7 bps to Kshs. 129.3 from the Kshs.129.2 recorded previous week. On a year-to-date basis, the shilling has appreciated by 3.4 bps against the dollar, compared to the 17.6% appreciation recorded in 2024.
We expect the shilling to be supported by:
- Diaspora remittances standing at a cumulative USD 5,078.8 mn in the twelve months to August 2025, 9.4% higher than the USD 4,644.5 mn recorded over the same period in 2024. These has continued to cushion the shilling against further depreciation. In the August 2025 diaspora remittances figures, North America remained the largest source of remittances to Kenya accounting for 60.6% in the period,
- The tourism inflow receipts which came in at Kshs 452.2 bn in 2024, a 19.8% increase from Kshs 377.5 bn inflow receipts recorded in 2023, and owing to tourist arrivals that improved by 8.0% to 2,303,028 in the 12 months to February 2025 from 2,133,612 in the 12 months to February 2024, and,
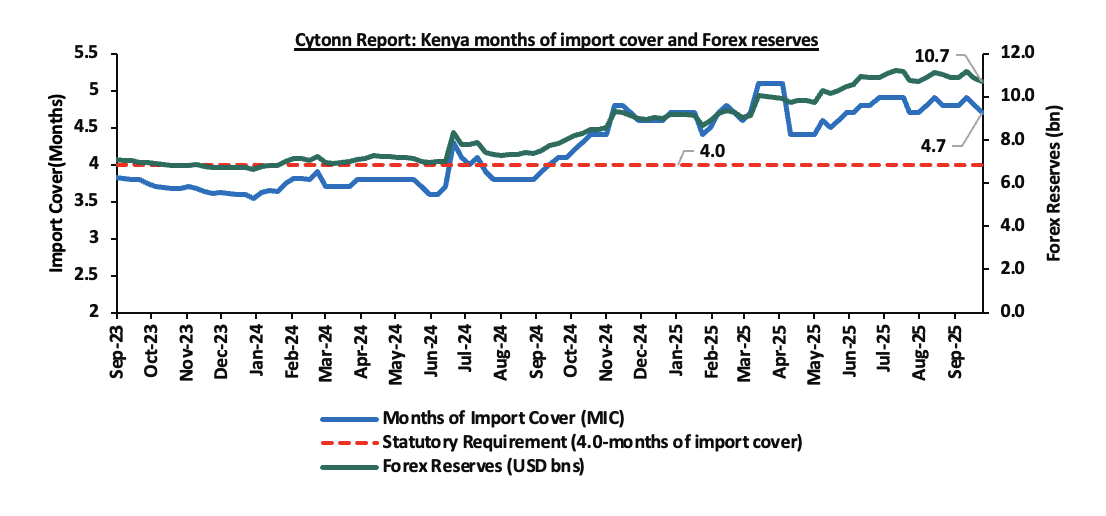
- Improved forex reserves currently at USD 10.7 bn (equivalent to 4.7-months of import cover), which is above the statutory requirement of maintaining at least 4.0-months of import cover and above the EAC region’s convergence criteria of 4.0-months of import cover.
The shilling is however expected to remain under pressure in 2025 as a result of:
- An ever-present current account deficit which came at 1.6% of GDP in the twelve months to June 2025, and,
- The need for government debt servicing, continues to put pressure on forex reserves given that 61.4% of Kenya’s external debt is US Dollar-denominated as of March 2025.
Key to note, Kenya’s forex reserves decreased by 1.2% during the week, to USD 10.7 bn from the USD 10.9 bn recorded in the previous week, equivalent to 4.7 months of import cover, and above the statutory requirement of maintaining at least 4.0-months of import cover and above the EAC region’s convergence criteria of 4.0-months of import cover.
The chart below summarizes the evolution of Kenya's months of import cover over the years:
Weekly Highlight
- September 2025 Inflation Projection Highlight
We are projecting the y/y inflation rate for September 2025 to remain stable within the range of 4.1% – 4.6%, mainly on the back of:
- The decrease in the Central Bank Rate (CBR) by 25.0 bps to 9.50% from 9.75% – In 2025, the CBK Monetary Policy Committee has continued adopting an accommodative monetary policy stance, reducing the Central Bank Rate (CBR) by a cumulative 175.0 bps from 11.25% at the beginning of the year. Notably, the MPC cut the Central Bank Rate (CBR) by 25.0 bps in August 2025, lowering it to 9.50% from 9.75% in June 2025. This reduction in the CBR is likely to increase the money supply through lower borrowing costs, which may cause a slight rise in inflation rates as the effects of the CBR continue to gradually take hold in the broader economy.
- Depreciation of the Kenya Shilling against the US Dollar – The Kenya Shilling has recorded a 1.5 bps month-to-date depreciation as of 26th September to Kshs 129.3 from Kshs 129.2 recorded at the beginning of the month. This depreciation in the exchange rate could induce inflationary pressures, making imported goods more expensive.
We, however, expect that inflation rate will, however, be supported by:
- Decreasing Fuel Prices in August 2025– In their last fuel prices release, EPRA announced that the maximum retail fuel prices in Kenya, effective from 15th September 2025 to 14th October 2025. The price for Super Petrol, Diesel and Kerosene decreased by Kshs 0.8, Kshs 0.1 and Kshs 0.8 per litre respectively. Consequently, Super Petrol, Diesel and Kerosene will now retail at Kshs 184.5, Kshs 171.5 and Kshs 154.8 per litre respectively, from Kshs 185.3, Kshs 171.6 and Kshs 155.6 per litre respectively, representing decreases of 0.4%, 0.1% and 0.5% for Super Petrol, Diesel and Kerosene respectively. This notable decrease in fuel prices may alleviate upward pressure on inflation, given fuel's significant role in transportation and production costs across the economy.
- Reduced electricity prices – In September 2025, electricity prices decreased marginally on the back of a decrease in the forex adjustment charges. EPRA set the forex adjustment charge at Kshs 0.8, down from Kshs 1.2 in August 2025. Notably, EPRA increased the fuel cost charge to Kshs 3.6 up from Kshs 2.99 in August 2025. With electricity being one the major inputs of inflation, this decrease is expected to decrease production costs for businesses as well as decrease electricity costs for households and thus easing inflation.
Going forward, we expect inflationary pressures to remain anchored in the short term, remaining within the CBK’s target range of 2.5%-7.5% aided by reduced electricity prices. However, risks remain, particularly from the potential for increased demand-driven inflation due to accommodative monetary policy. The decision to lower the CBR to 9.50% during the latest MPC meeting will likely increase money supply, in turn increasing inflation, especially with further cuts expected in the coming meetings. The CBK’s ability to balance growth and inflation through close monitoring of both inflation and exchange rate stability will be key to maintaining inflation within the target range.
Rates in the Fixed Income market have been on a downward trend due to high liquidity in the money market which allowed the government to front load most of its borrowing. The government is 165.8% ahead of its prorated net domestic borrowing target of Kshs 156.9 bn, having a net borrowing position of Kshs 417.1 bn (inclusive of T-bills). However, we expect stabilization of the yield curve in the short and medium term, with the government looking to increase its external borrowing to maintain the fiscal surplus, hence alleviating pressure in the domestic market. As such, we expect the yield curve to stabilize in the short to medium-term and hence investors are expected to shift towards the long-term papers
Market Performance
During the week, the equities market was on an upward trajectory, with NSE 10 gaining the most by 3.7%, while NSE 25, NSE 20 and NASI gained by 3.0%, 2.6% and 2.5% respectively, taking the YTD performance to gains of 44.7%, 41.9%, 34.7% and 34.0% for NSE 20, NASI, NSE 10 and NSE 25 respectively. The equities market performance was driven by gains recorded by large-cap stocks such as Co-operative bank, Equity bank and KCB of 10.4%, 7.4% and 6.0% respectively.
Additionally, in the regional equities market, the East African Exchanges 20 (EAE 20) share index lost by 0.1% to 100.2 from 100.3 recorded the previous week, attributable to losses recorded by large cap stocks such as ABSA, NMB Bank and Stanbic Uganda of 12.6%, 4.6% and 4.0% respectively. The performance was, however, supported by gains recorded by large cap stocks such as KCB, Equity Bank and CRDB of 8.5%, 5.6% and 4.5% respectively.
During the week, equities turnover increased by 4.1% to USD 43.0 mn, from USD 41.3 mn recorded the previous week, taking the YTD total turnover to USD 778.8 mn. Foreign investors remained net sellers for the fourth consecutive week, with a net selling position of USD 0.3 mn, from a net selling position of USD 22.9 mn recorded the previous week, taking the YTD foreign net selling position to USD 55.3 mn, compared to a net selling position of USD 16.9 mn in 2024.
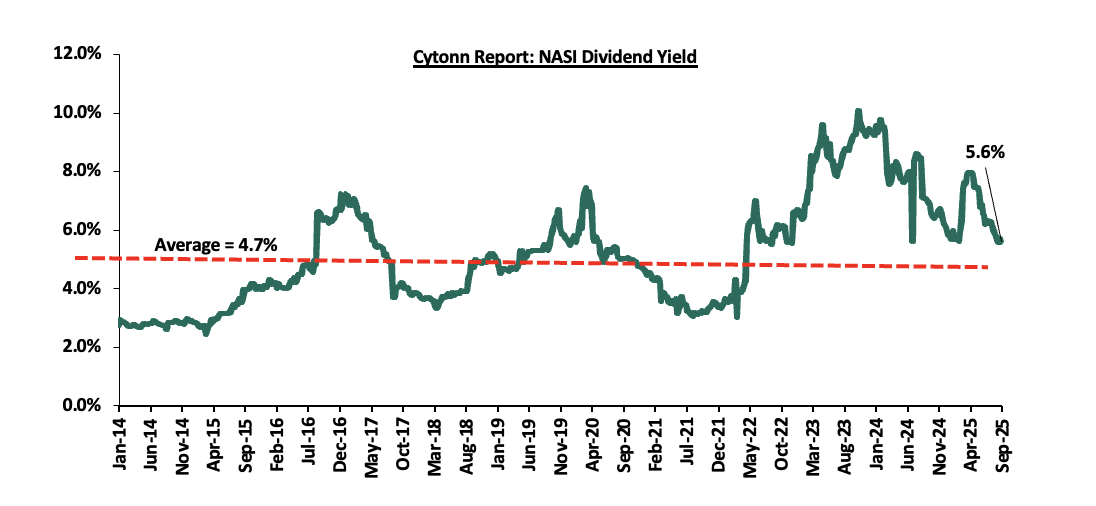
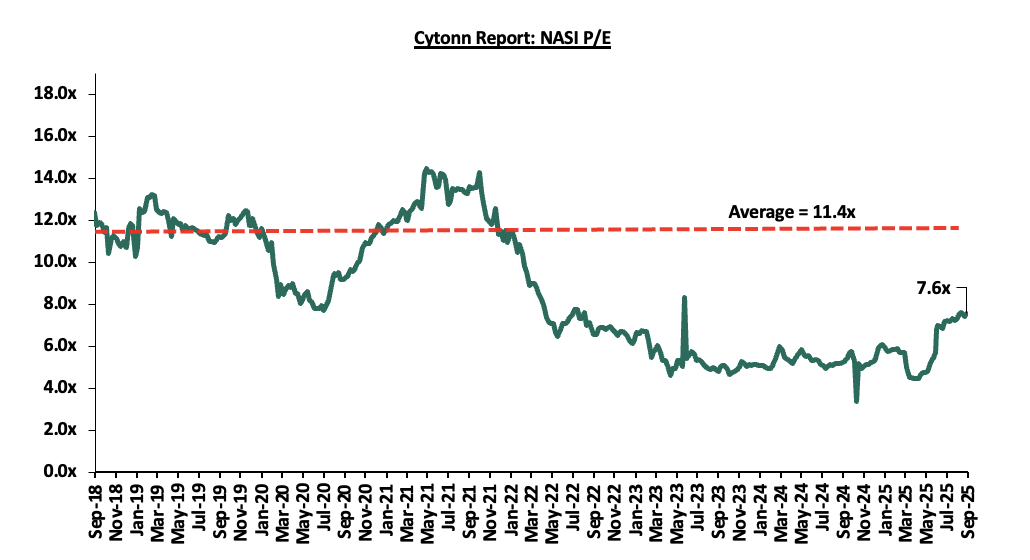
The market is currently trading at a price-to-earnings ratio (P/E) of 7.6x, 33.5% below the historical average of 11.4x. The dividend yield stands at 5.6%, 0.9% points above the historical average of 4.7%. Key to note, NASI’s PEG ratio currently stands at 0.9x, an indication that the market is at par relative to its future growth. A PEG ratio greater than 1.0x indicates the market is overvalued while a PEG ratio less than 1.0x indicates that the market is undervalued. The charts below indicate the historical P/E and dividend yields of the market;
Universe of Coverage:
|
Cytonn Report: Equities Universe of Coverage |
||||||||||
|
Company |
Price as at 19/09/2025 |
Price as at 26/09/2025 |
w/w change |
YTD Change |
Year Open 2025 |
Target Price* |
Dividend Yield |
Upside/ Downside** |
P/TBv Multiple |
Recommendation |
|
Diamond Trust Bank |
104.8 |
104.5 |
(0.2%) |
56.6% |
66.8 |
128.3 |
6.7% |
29.4% |
0.4x |
Buy |
|
Standard Chartered Bank |
284.0 |
285.0 |
0.4% |
(0.1%) |
285.3 |
314.1 |
15.8% |
26.0% |
1.6x |
Buy |
|
ABSA Bank |
21.3 |
20.60 |
(3.1%) |
9.3% |
18.9 |
24.1 |
8.5% |
25.4% |
1.3x |
Buy |
|
NCBA |
68.5 |
69.0 |
0.7% |
35.3% |
51.0 |
79.0 |
8.0% |
22.5% |
1.1x |
Buy |
|
I&M Group |
43.0 |
43.0 |
(0.1%) |
19.3% |
36.0 |
48.2 |
7.0% |
19.2% |
0.8x |
Accumulate |
|
Stanbic Holdings |
181.3 |
183.3 |
1.1% |
31.1% |
139.8 |
194.8 |
11.3% |
17.6% |
1.1x |
Accumulate |
|
KCB Group |
53.8 |
57.0 |
6.0% |
34.4% |
42.4 |
63.6 |
5.3% |
16.8% |
0.7x |
Accumulate |
|
Equity Group |
54.0 |
58.0 |
7.4% |
20.8% |
48.0 |
61.2 |
7.3% |
12.8% |
1.0x |
Accumulate |
|
Co-op Bank |
19.2 |
21.2 |
10.4% |
21.2% |
17.5 |
21.1 |
7.1% |
7.0% |
0.7x |
Hold |
|
Britam |
8.8 |
8.9 |
1.6% |
53.6% |
5.8 |
9.5 |
0.0% |
6.5% |
0.8x |
Hold |
|
Jubilee Holdings |
324.3 |
320.3 |
(1.2%) |
83.3% |
174.8 |
312.9 |
4.2% |
1.9% |
0.5x |
Lighten |
|
CIC Group |
4.3 |
4.9 |
13.7% |
129.4% |
2.1 |
4.0 |
2.6% |
(15.3%) |
1.3x |
Sell |
|
*Target Price as per Cytonn Analyst estimates **Upside/ (Downside) is adjusted for Dividend Yield ***Dividend Yield is calculated using FY’2024 Dividends |
||||||||||
We are “Bullish” on the Equities markets in the short term due to current cheap valuations, lower yields on short-term government papers and expected global and local economic recovery, and, “Neutral” in the long term due to persistent foreign investor outflows. With the market currently trading at par with its future growth (PEG Ratio at 0.9x), we believe that investors should reposition towards value stocks with strong earnings growth and that are trading at discounts to their intrinsic value. We expect the current high foreign investors sell-offs to continue weighing down the economic outlook in the short term.
- Infrastructure Sector
- New Dual Carriageway Connecting Athi River and Machakos Completed
During the week, The Athi River–Machakos dual carriageway was officially completed, marking a major milestone in efforts to ease traffic congestion along the busy Mombasa Road corridor. Spanning 20 kilometers, the road is an extension of the Mombasa Road dual carriageway and was designed to improve safety and reduce traffic delays in the area. The project cost Kshs 6.2 bn and was jointly funded by the World Bank and the Kenyan government, with contributions made on a 60:40 basis.
Although the project was initially commissioned in 2017, actual construction began in 2019 due to delays caused by land acquisition challenges and disruptions from the COVID-19 pandemic. Over 76 landowners had to be compensated to make way for the construction.
Now completed, the road has been handed over to the government and is expected to require only routine maintenance. The upgraded route includes two major flyovers and elevated bridges over the Athi River and Stoni Athi River to help prevent flooding. Additionally, the road’s slopes were landscaped to control erosion and enhance its appearance.
The use of flyovers in place of roundabouts and at-grade junctions is expected to reduce traffic congestion and improve the overall flow of vehicles. These improvements aim to increase efficiency on one of the country’s most critical transport corridors.
We expect this development to stimulate economic activity, with rising land values and an increase in commercial developments along the route. Retail outlets, fuel stations, and business centers are also expected to emerge rapidly in the surrounding area. The government has continued to show support to the infrastructure sector with an increase of 12.2% in its budget allocation for infrastructure to Kshs 535.6 bn in FY’25/26 from the Kshs 477.2 bn allocated in FY’24/25
- Real Estate Investments Trusts (REITs)
On the Unquoted Securities Platform, Acorn D-REIT and I-REIT traded at Kshs 27.4 and Kshs 23.2 per unit, respectively, as per the last updated data on 19th September 2025. The performance represented a 37.0% and 16.0% gain for the D-REIT and I-REIT, respectively, from the Kshs 20.0 inception price. Additionally, ILAM Fahari I-REIT traded at Kshs 11.0 per share as of 19th September 2025, representing a 45.0% loss from the Kshs 20.0 inception price. The volumes traded for the D-REIT and I-REIT came in at Kshs 12.8 mn and Kshs 39.8 mn shares, respectively, with a turnover of Kshs 323.5 mn and Kshs 791.5 mn, respectively, since inception in February 2021. Additionally, ILAM Fahari I-REIT traded at Kshs 11.0 per share as of 19th September 2025, representing a 45.0% loss from the Kshs 20.0 inception price. The volume traded to date came in at 1,235,285 shares for the I-REIT, with a turnover of Kshs 1.5 mn since inception in November 2015.
REITs offer various benefits, such as tax exemptions, diversified portfolios, and stable long-term profits. However, the ongoing decline in the performance of Kenyan REITs and the restructuring of their business portfolios are hindering significant previous investments. Additional general challenges include:
- Insufficient understanding of the investment instrument among investors leading to a slower uptake of REIT products,
- Lengthy approval processes for REIT creation,
- High minimum capital requirements of Kshs 100.0 mn for REIT trustees compared to Kshs 10.0 mn for pension funds Trustees, essentially limiting the licensed REIT Trustee to banks only
- The rigidity of choice between either a D-REIT or and I-REIT forces managers to form two REITs, rather than having one Hybrid REIT that can allocate between development and income earning properties
- Limiting the type of legal entity that can form a REIT to only a trust company, as opposed to allowing other entities such as partnerships, and companies,
- We need to give time before REITS are required to list – they would be allowed to stay private for a few years before the requirement to list given that not all companies may be comfortable with listing on day one, and,
- Minimum subscription amounts or offer parcels set at Kshs 0.1 mn for D-REITs and Kshs 5.0 mn for restricted I-REITs. The significant capital requirements still make REITs relatively inaccessible to smaller retail investors compared to other investment vehicles like unit trusts or government bonds, all of which continue to limit the performance of Kenyan REITs.
We expect Kenya’s Real Estate sector to remain resilient, supported by continued investor interest across key segments such as residential, industrial, and hospitality, as well as government initiatives like the Affordable Housing Program (AHP), and large-scale infrastructure projects such as the Athi River- Machakos dual carriage way. These developments are expected to spur demand for housing, industrial parks, logistics facilities, and complementary commercial and social infrastructure. However, challenges such as high capital requirements and regulatory hurdles for REITs, rising construction costs, infrastructure bottlenecks, and oversupply in select market segments will continue to weigh on the sector’s optimal performance by slowing project pipelines and deterring some investor participation.
In July 2024, we released the Nairobi Metropolitan Area Land Report 2024, which highlighted that the Nairobi Metropolitan Area (NMA) land sector recorded an improvement in performance with the average annual price appreciation coming in at 3.9% in FY’2023/24, 0.6% points lower than the 4.5% appreciation recorded in FY’2022/23. The performance represented a 13-year average price appreciation CAGR of 8.2%, with the average selling price for land coming in at Kshs 132.7 mn in FY’2023/24, from Kshs 47.9 mn in 2011.
The performance during this period was mainly driven by the increased demand for Un-serviced land in satellite towns of the Nairobi Metropolitan and serviced land in Satellite Towns mainly driven by; i) the government’s significant investments in infrastructure particularly road networks and utilities which in turn stimulated growth in Satellite towns e.g. the Southern and Eastern Bypass, ii) heightened construction activities, especially in the residential sector, driven by the government’s affordable housing agenda, which in turn boosted demand for land, iii) limited supply of land especially in urban areas which contributed to rising land prices as demand from buyers outpaced availability, iv) growing demand for housing which was driven by positive demographics such as high population and urbanization, which by then stood at 1.9% and 3.7% respectively, and, v) growth in popularity of satellite towns by investors and buyers which provided affordable land options in comparison to the suburbs and key commercial zones.
This week, we update our report by discussing the overall performance of the NMA land sector over time, and examining various factors that influence its performance based on selling prices and annual capital appreciation. Additionally, we identify investment opportunities for the sector, using 2025 market research data. As such, in this topic, we shall focus on;
- Introduction to the Nairobi Metropolitan Area (NMA) Land Sector,
- NMA Land Sector Performance in 2025 Based on Various Locations, and,
- Summary and investment opportunities in the sector, and,
- Conclusion and Outlook for the Sector.
Section I: Introduction to the Nairobi Metropolitan Area (NMA) Land Sector
The land sector within the Nairobi Metropolitan Area (NMA) has remained notably resilient, continuing to post consistent improvements in performance despite prevailing challenges. These include persistent increases in construction costs, limited access to development financing, and oversupply in specific real estate segments such as commercial offices and retail spaces. As a result, demand for land has been subdued in select areas, particularly within commercial zones and high-end suburbs. Nevertheless, the sector recorded improved performance in FY’2024/25, underpinned by several key drivers, including:
- Demographics: Kenya continues to record positive demographics shown by high population growth and urbanization rates of 2.0% p.a and 3.8% p.a, respectively compared to the global averages 1.0% p.a and 1.8% p.a, respectively, as at 2024. Given this, the demand for residential and commercial spaces continues to soar, which in turn boosts demand for development land,
- Continued government investment in infrastructure: In 2025, the Kenyan government has sustained momentum in implementing strategic infrastructure projects aimed at accelerating economic development and enhancing regional connectivity. Key ongoing and completed projects include the dualling of the Mombasa Road-Athi River stretch, the expansion of Kiambu Road, progress on the LAPSSET Corridor, and utility extensions (water, electricity, sewer) to satellite towns. These projects have enhanced accessibility and opened up new investment frontiers in towns such as Joska, Kamulu, and Thika, resulting in increased land demand and value appreciation.
- Acceleration of affordable housing projects: The government's Affordable Housing Programme has gained notable traction in 2025, with more than 40,000 new units launched or under construction across Nairobi Metropolitan Area. Major developments include the Kibera Soweto B and Starehe AHPs in Nairobi, and others in Ruaka, Thika, and Mavoko. These initiatives continue to drive demand for land in areas earmarked for housing development and surrounding regions benefiting from complementary infrastructure upgrades.
- Diminishing land availability in urban centers: As Nairobi’s urban center becomes increasingly built-up, scarcity of available land parcels has driven investors and developers to the outskirts and emerging satellite towns. This limited land supply—especially within serviced zones—has contributed to upward pressure on prices, particularly in areas with infrastructure access and proximity to key commercial centers.
- Diaspora and institutional investor interest: There has been a marked increase in land acquisitions by diaspora investors, facilitated by improved transparency in land transactions through digitization, and greater interest by institutional players seeking strategic land banks. This trend is further supported by capital flight from more volatile investment classes amid global uncertainty.
However, the sector’s full potential in 2025 has continued to be constrained by a number of challenges:
- Elevated construction costs: Although inflation slightly eased by 1.9% points to average at 3.7% in H1’2025 from 5.6% in H1’2024 , construction costs remain high, averaging Kshs 73,400 per SQM in 2025, up from Kshs 71,200 in 2024 representing a 3.1% increase. Prices of key inputs; cement, steel, glass, and fittings, remain elevated due to import costs and VAT policies, which continue to impede development activity and temper land absorption rates.
- Persistent oversupply in certain Real Estate segments: The glut in commercial offices (estimated oversupply at 5.7 mn SQFT) and retail space (oversupply at 3.6 mn SQFT nationally) has continued to depress land demand in Nairobi’s high-end and commercial zones, with developers shifting focus to mixed-use and residential-led masterplans.
- Infrastructure gaps in periphery zones: Despite major infrastructure investments, certain peripheral areas still lack essential amenities such as sewerage systems, storm drainage, and water connections. These limitations have held back land uptake in areas with otherwise high potential due to increased development costs and project risks.
Looking ahead, some key trends expected to shape the land sector include:
- Continued Expansion of Ardhisasa and Digitization of Land Processes: The digitization of land records under the Ardhisasa platform has expanded to cover more counties within the Nairobi Metropolitan Area in 2025. This initiative is expected to further improve transaction transparency, reduce fraud, and shorten approval timelines, which will boost investor confidence and streamline land acquisition processes.
- ISK's Push for Credible Listings: The Institution of Surveyors of Kenya (ISK) launched a Multi-Listing Service (MLS) platform in April 2025, allowing only verified estate agents to list properties. The platform ensures genuine, transparent listings with detailed documentation and analytics, boosting buyer trust and reducing fraud in Kenya’s real estate market.
- Increased Regulation and Compliance Costs: Enforcement of existing land-use plans, zoning regulations, and environmental impact assessments has tightened in 2025. While this is a step toward sustainable urban development, it has introduced new costs and approval complexities for developers, potentially affecting investment timelines.
- Impact of Capital Gains Tax (CGT): The 15% CGT rate continues to influence investor behavior, with some sellers increasing asking prices to offset tax obligations. While this has slowed down transaction volumes in high-value areas, it has also spurred more structured investment planning and bundling of land parcels to realize economies of scale.
Overall, the Nairobi Metropolitan Area's land sector is expected to remain attractive due to ongoing urban sprawl, infrastructure-led growth, and strong demographic fundamentals, although policy headwinds and high development costs may continue to shape investment decisions moving forward.
Section II: NMA Land Sector Performance in 2025 Based on Various Locations
For the analysis, we conducted research on various major towns within the NMA and classified them as follows;
- High Rise Residential Areas: They comprise of areas such as Dagoretti, Embakasi, and Kasarani, and are majorly characterized by the numerous high-rise buildings such as the apartments found within,
- High End Residential Suburbs: These are areas which generally consist of low-rise buildings such as the bungalows, maisonettes and villas and also high-end apartments. They include; Kitisuru, Runda, Ridgeways, Kileleshwa, Karen, and Spring Valley,
- Commercial Zones: They comprise of areas such as Kilimani, Westlands, Riverside, and Upper Hill, and are popular because of the numerous commercial office buildings that they have, and,
- Satellite Towns: Land in the area was categorized into serviced (site and service schemes) and unserviced land. It comprises of areas such as Syokimau, Ruiru, Rongai, Juja, Utawala, Limuru, Athi River, and, Limuru.
The NMA land sector continues to show resilience in performance with the average Year-on-Year (YoY) price appreciation coming in at 3.4% in FY’2024/25, 0.4% faster than the 3.0% appreciation recorded in FY’2023/24. This is as the average asking prices came in at Kshs 136.7 mn in FY’2024/25 from Kshs 132.7 mn in FY’2023/24. The performance also represented a 14-year average price appreciation CAGR of 7.8%, with the average selling price for land coming in at Kshs 136.7 mn in FY’2024/25, from Kshs 47.9 mn in 2011/12. The below graph shows CAGR from 2011/12 to 2024/25.
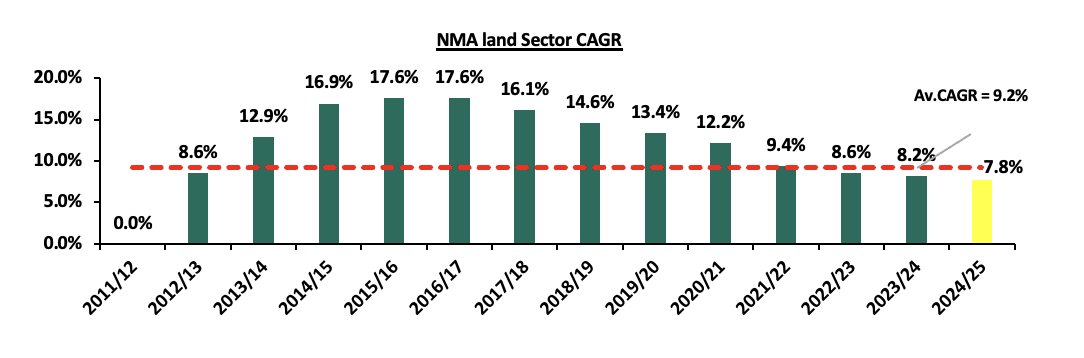
Source: Cytonn Research
This signifies the continued rise in the demand for development land mainly driven by; i) the government’s significant investments in infrastructure particularly road networks and utilities which in turn stimulates growth in Satellite towns e.g. the Southern, Western and Eastern Bypass, ii) heightened construction activity, especially in the residential sector, driven by the government and private sector affordable housing agenda, which in turn boosts demand for land, iii) limited supply of land especially in urban areas which has contributed to rising land prices as demand from buyers outpaces availability, iv) growing demand for housing which is driven by positive demographics such as high population and urbanization, which currently stands at 2.0% and 3.7% respectively, and, v) growth in popularity of satellite towns by investors and buyers which provide affordable land options in comparison to the suburbs and key commercial zones.
The graph below shows the capital appreciation of land in the NMA from FY’2023/24 to FY’2024/25;
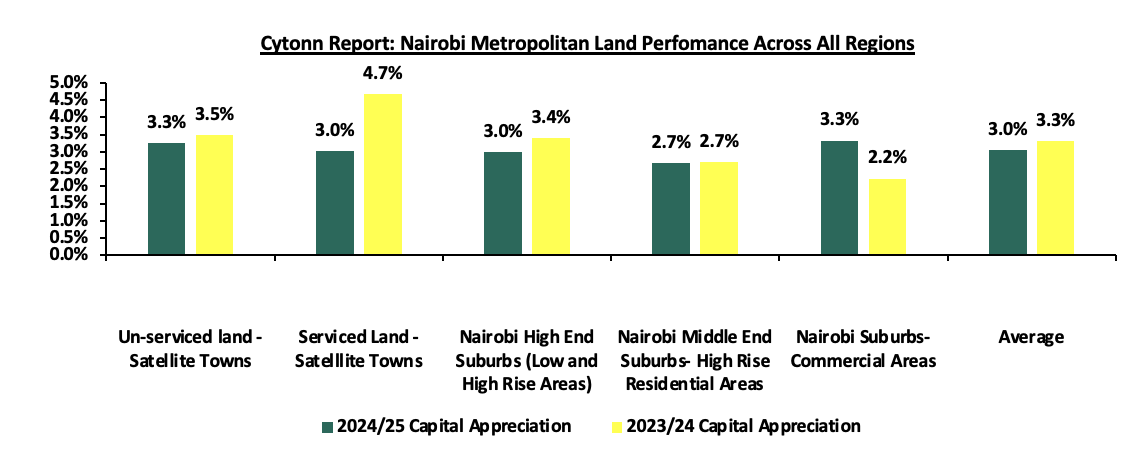
Source: Cytonn Research
The table below shows the performance summary of the NMA land sector based on the average asking prices, CAGR and capital appreciation;
|
Location |
*Price in 2011 |
*Price in 2012 |
*Price in 2013 |
*Price in 2014 |
*Price in 2015 |
*Price in 2016 |
*Price in 2017 |
*Price 18/19 |
*Price 19/20 |
*Price 20/21 |
*Price 21/22 |
*Price 22/23 |
*Price 23/24 |
*Price 24/25 |
14-Year CAGR |
23/24 Capital Appreciation |
24/25 Capital Appreciation |
∆ in Capital Appreciation |
|
Serviced Land - Satellite Towns |
5.6 |
6.8 |
8.3 |
11.1 |
13.8 |
15.2 |
16.8 |
18.4 |
19.2 |
20.4 |
17 |
18.3 |
19.24 |
20.2 |
10.5% |
3.0% |
4.9% |
1.9% |
|
Unserviced land - Satellite Towns |
3.6 |
5.1 |
6.5 |
7.5 |
8.4 |
11.6 |
12.3 |
13.2 |
14.1 |
15 |
14.7 |
15.7 |
17.0 |
17.6 |
12.4% |
3.5% |
3.3% |
(0.2%) |
|
Nairobi Suburbs- Commercial Areas |
145 |
173.1 |
215.3 |
291.4 |
359.3 |
421.8 |
452.6 |
470.3 |
485.7 |
492.1 |
403.4 |
397.3 |
411.5 |
424.4 |
8.1% |
2.2% |
3.3% |
1.1% |
|
Nairobi High End Suburbs (Low and High Rise Areas) |
54.5 |
62.3 |
71.2 |
83.5 |
94.3 |
113 |
125 |
133 |
139 |
145 |
130.5 |
135.5 |
136.3 |
138.9 |
7.6% |
3.4% |
3.0% |
(0.4%) |
|
NMA High Rise Residential Areas |
31 |
35.2 |
43.7 |
54.8 |
64.3 |
71.7 |
75.2 |
79.3 |
82.6 |
85.9 |
76.3 |
78.3 |
80.4 |
82.6 |
7.2% |
2.7% |
2.7% |
0.0% |
|
Average |
47.9 |
56.5 |
69.0 |
89.7 |
108.0 |
126.7 |
136.4 |
142.8 |
148.1 |
151.7 |
128.4 |
129.0 |
132.9 |
136.7 |
9.2% |
3.0% |
3.4% |
0.5% |
Source: Cytonn Research
Performance per node:
- Satellite Towns -Unserviced Land
Unserviced land in the satellite towns of Nairobi recorded an average iiipYoY capital price appreciation of 3.3%, with average asking prices coming in at Kshs 17.6 mn in FY’2024/25, from the Kshs 17.0 mn recorded in FY’2023/24. Additionally, the performance grew by a 14-year average CAGR of 12.4%, to average asking prices of Kshs 17.6 mn in FY’2024/25 from the Kshs 3.6 mn recorded in 2011. The performance was supported by; i) Ongoing and planned infrastructure improvements, such as the Western, South and Eastern bypass, commuter railways and other utilities have made satellite towns more accessible and appealing for investment, and, ii) Investors looking for capital gains have been buying land in these towns, anticipating future appreciation as the areas develop and urbanize.
In terms of performance per node, Limuru was the best performing with a Year-on-Year (YoY) capital appreciation of 7.0% attributed to; i) Infrastructure upgrades enhancing roads e.g Waiyaki way and Western bypass, utilities, and overall accessibility, ii) Strategic proximity to Nairobi making commuting and settlement easier iii) Rising demand driven by urbanization, population growth, and housing needs, iv) Relative affordability compared to inner Nairobi suburbs attracting buyers v) Speculative investment as investors anticipate rapid future development. The table below shows the performance of unserviced land in satellite towns within the NMA;
|
All values is Kshs mn per Acre unless stated otherwise |
|
||||||||||||||||
|
Cytonn Report: NMA Satellite Towns - Unserviced Land Performance |
|
||||||||||||||||
|
Location |
*Price in 2011 |
*Price in 2015 |
*Price in 2016 |
*Price in 2017 |
*Price 18/19 |
*Price 19/20 |
*Price 20/21 |
*Price 21/22 |
*Price 22/23 |
*Price 23/24 |
*Price 24/25 |
14-Year CAGR |
2023/24 Capital Appreciation |
2024/25 Capital Appreciation |
∆ in Capital appreciation |
||
|
Limuru |
5 |
13 |
17 |
20 |
20 |
21 |
21.2 |
24.1 |
23.9 |
24.8 |
26.5 |
12.7% |
3.8% |
7.0% |
3.3% |
||
|
Utawala |
6 |
9 |
10 |
11 |
12 |
12 |
12.4 |
14.1 |
16.7 |
17.4 |
18.2 |
8.2% |
4.2% |
4.6% |
0.4% |
||
|
Juja |
3 |
7 |
9 |
10 |
10 |
10 |
10.6 |
12.2 |
14.6 |
15.5 |
16.0 |
12.7% |
6.2% |
3.2% |
(2.9%) |
||
|
Rongai |
2 |
10 |
18 |
18 |
18 |
19 |
19 |
18.9 |
17.9 |
18.3 |
18.5 |
17.2% |
2.2% |
1.1% |
(1.1%) |
||
|
Athi River |
2 |
3 |
4 |
4 |
4 |
4 |
4.5 |
4.4 |
8.8 |
8.9 |
8.9 |
11.3% |
1.1% |
0.3% |
(0.8%) |
||
|
Average |
3.6 |
8.4 |
11.6 |
12.6 |
12.8 |
13.2 |
13.5 |
14.7 |
16.4 |
17.0 |
17.6 |
12.4% |
3.5% |
3.3% |
(0.2%) |
||
Source: Cytonn Research
- Nairobi Suburbs – High End (Low and High Rise) Residential Areas
High end residential areas of Nairobi suburbs registered an average YoY capital appreciation of 3.0%, with the average asking prices coming at Kshs 138.9 mn in FY’2024/25, from Kshs 136.3 mn in FY’2023/24. Additionally, the performance represented a 14-year average CAGR of 7.6%, with average asking prices coming in at Kshs 138.9mn in FY’2024/25 from the Kshs 54.5 mn recorded in 2011. These areas continue to remain attractive to investors due to; i) their serene and green environments, combined with larger plots offering a tranquil environment away from the bustling city center, ii) their proximity to the Central Business District(CBD) making them ideal for professionals who want to live in a serene area while still being close to their workplace, iii) relatively affordable prices at Kshs 138.9 mn per acre compared to the commercial zones averaging at Kshs 424.4 mn per acre.
In terms of performance per node, Karen was the best performing with an average YoY price appreciation of 6.6%, 3.6% points higher than the market average of 3.0.% due to; i) Proximity to Nairobi CBD and key nodes like Kilimani, Lavington and Kileleshwa, making it attractive for both residential and institutional investors, ii) Improved infrastructure, especially the expansion and maintenance of Ngong Road and Lang’ata Road, enhancing accessibility, iv) Growing middle- and upper-middle-class demand for gated residential developments and townhouses, v) Presence of key amenities, including shopping malls (The Hub and Galleria Malls), international schools, and hospitals, vi) Lower land saturation compared to older high-end suburbs, providing room for strategic investments, vii) Security and exclusivity, contributing to sustained demand from high-net-worth individuals and developers.
The table below shows the performance of land in high end (low and high rise) suburbs within the NMA;
|
All values is Kshs mn per Acre unless stated otherwise |
|
|
|||||||||||||||
|
Cytonn Report: NMA High End Suburbs (Low- and High-Rise Areas) Land Performance |
|
|
|||||||||||||||
|
Location |
*Price in 2011 |
*Price in 2015 |
*Price in 2016 |
*Price in 2017 |
*Price 2018/19 |
*Price 2019/20 |
*Price 2020/21 |
*Price 2021/22 |
*Price 2022/23 |
*Price 2023/24 |
*Price 2024/25 |
14-Year CAGR |
2023/24 Capital Appreciation |
2024/25 Capital Appreciation |
∆ in Capital appreciation |
||
|
Karen |
25 |
40 |
46 |
52 |
53 |
56 |
59.6 |
62 |
62.5 |
63.6 |
67.8 |
7.4% |
1.7% |
6.6% |
4.9% |
||
|
Kitisuru |
32 |
59 |
70 |
70 |
71 |
73 |
77.9 |
90.3 |
90.5 |
92.5 |
98.0 |
8.3% |
2.2% |
6.0% |
3.7% |
||
|
Runda |
33 |
58 |
67 |
68 |
68 |
70 |
74.3 |
81.7 |
85.9 |
90.2 |
92.5 |
7.6% |
5.1% |
2.5% |
(2.6%) |
||
|
Spring Valley |
64 |
131 |
147 |
154 |
148 |
156 |
161 |
161.7 |
164.5 |
168.3 |
172.4 |
7.3% |
2.3% |
2.5% |
0.2% |
||
|
Ridgeways |
24 |
51 |
62 |
68 |
65 |
66 |
68.8 |
81.4 |
83 |
86.4 |
87.1 |
9.6% |
4.1% |
0.7% |
(3.4%) |
||
|
Kileleshwa |
149 |
227 |
286 |
306 |
311 |
303 |
300.9 |
305.8 |
301.9 |
316.8 |
315.4 |
5.5% |
4.9% |
(0.4%) |
(5.4%) |
||
|
Average |
54.5 |
94.3 |
113 |
119.7 |
119.3 |
120.7 |
123.8 |
130.5 |
135.5 |
136.3 |
138.9 |
7.6% |
3.4% |
3.0% |
(0.4%) |
||
Source: Cytonn Research
- Satellite Towns - Serviced Land
Serviced land in the satellite towns of Nairobi recorded an average YoY capital appreciation of 3.0%, with the average asking prices coming in at Kshs 20.2 mn in FY’2024/25, from Kshs 19.2 mn in FY’2023/24. Additionally, the performance represented a 14-year average CAGR of 10.5%, with average asking prices coming in at Kshs 20.2 mn in FY’2024/25 from the Kshs 5.6 mn recorded in 2011. The performance was supported by; i) Continuous improvement of infrastructure such as the Eastern bypass and Thika Superhighway, ii) relatively quick access to the city, increasing investor appeal for development of residential and commercial units, and, iii) rapid urbanization and population growth increasing the demand for housing.
In terms of performance per node, Syokimau was the best performing with a relatively high average YoY price appreciation of 4.3%. This was mainly driven by; i) Enhanced transport connectivity, particularly via the Nairobi Expressway, Mombasa Road upgrades, and SGR commuter services, improving access to Nairobi CBD and JKIA, ii) presence of amenities such as Kitengela, Crystall Rivers and Signature malls,iii) Proximity to major economic hubs, such as the Industrial Area, JKIA, and Mombasa Road corridor, attracting both residential and logistics-related investments. and iv) growth of industries around the area has led to job creation which is increasing demand for housing and commercial properties. On the other hand, Ruai recorded the lowest price appreciation of 0.1 % attributed to reduced land transactions within the period under review. The table below shows the performance of serviced land in satellite towns within the NMA;
|
All values is Kshs mn per Acre unless stated otherwise |
||||||||||||||||
|
Cytonn Report: NMA Satellite Towns - Serviced Land Performance |
||||||||||||||||
|
Location |
*Price in 2011 |
*Price in 2015 |
*Price in 2016 |
*Price in 2017 |
*Price 2018/19 |
*Price 2019/20 |
*Price 2020/21 |
*Price 2021/22 |
*Price 2022/23 |
*Price 2023/24 |
*Price 2024/25 |
14-Year CAGR |
2023/24 Capital Appreciation |
2024/25 Capital Appreciation |
∆ in Capital appreciation |
|
|
Syokimau |
3 |
12 |
12 |
12 |
12 |
12 |
11.8 |
13.9 |
17.2 |
18.5 |
19.3 |
14.2% |
7.6% |
4.3% |
(3.2%) |
|
|
Athi River |
2 |
11 |
13 |
13 |
12 |
12 |
13.1 |
13.3 |
15.9 |
17.4 |
18.1 |
17.0% |
9.4% |
3.9% |
(5.5%) |
|
|
Ruiru & Juja |
8 |
18 |
19 |
21 |
23 |
24 |
25.3 |
25.9 |
28.1 |
29 |
30.1 |
9.9% |
3.2% |
3.8% |
0.6% |
|
|
Rongai |
7 |
16 |
19 |
19 |
19 |
18 |
20 |
20.4 |
19.8 |
20.6 |
21.2 |
8.2% |
4.0% |
2.9% |
(1.1%) |
|
|
Ruai |
8 |
12 |
13 |
15 |
14 |
14 |
13.5 |
11.6 |
12.5 |
12.4 |
12.4 |
3.2% |
(0.8%) |
0.1% |
0.9% |
|
|
Average |
5.6 |
13.8 |
15.2 |
16 |
16 |
16 |
16.7 |
17 |
18.3 |
19.6 |
20.2 |
10.5% |
4.7% |
3.0% |
(1.7%) |
|
source: Cytonn Research
- Nairobi Suburbs - Commercial Zones
Land in Nairobi suburbs commercial zones recorded an average YoY capital appreciation of 3.3%, with the average asking prices coming in at Kshs 424.4 mn in FY’2024/25, from Kshs 411.5 mn in FY’2023/24. Additionally, the performance represented a 14-year average CAGR of 8.1%, with average asking prices coming in at Kshs 424.4 mn in FY’2024/25 from the Kshs 145.0 mn recorded in 2011. This is mainly due to: i) availability of desirable amenities such as hospitals, schools, supermarkets and fitness centers making the area ideal for residential development, ii) good road network improving the connectivity to the Central Business District and other parts of NMA, and iii) availability of individuals who are willing to pay premium prices for land in these areas.
In terms of performance per node, Riverside was the best performing with a relatively high average YoY price appreciation of 6.9% owing to: i) availability of ample amenities ideal for residential development, ii) proximity to the city centre and connectivity to other Nairobi surburbs e.g. Westland’s and a surging middle class in the area. Conversely, Kilimani recorded the lowest price appreciation of 0.0 %, resulting from a stiff competition from neighboring areas such as Riverside and Westlands
The table below shows the performance of land in commercial zones within the NMA;
|
All values is Kshs mn per Acre unless stated otherwise |
|
|
|
|||||||||||||||
|
Cytonn Report: NMA Suburbs - Commercial Zones Land Performance |
|
|
|
|||||||||||||||
|
Location |
*Price in 2011 |
*Price in 2015 |
*Price in 2016 |
*Price in 2017 |
*Price 2018/19 |
*Price 2019/20 |
*Price 2020/21 |
*Price 2021/22 |
*Price 2022/23 |
*Price 2023/24 |
*Price 202425 |
14-Year CAGR |
2023/24 Capital Appreciation |
2024/25 Capital Appreciation |
∆ in Capital appreciation |
|||
|
Riverside |
116 |
343 |
362 |
361 |
363 |
351 |
335.7 |
343.1 |
342.1 |
327.1 |
349.7 |
8.2% |
(4.4%) |
6.9% |
11.3% |
|||
|
Westlands |
150 |
350 |
453 |
474 |
430 |
421 |
413.6 |
418.3 |
423.2 |
433.2 |
447.2 |
8.1% |
2.4% |
3.2% |
0.9% |
|||
|
Upper Hill |
200 |
450 |
512 |
510 |
488 |
506 |
487.3 |
471.9 |
468.1 |
471.4 |
486.1 |
6.5% |
0.7% |
3.1% |
2.4% |
|||
|
Kilimani |
114 |
294 |
360 |
387 |
403 |
398 |
381.7 |
380.4 |
375.9 |
414 |
414.5 |
9.7% |
10.2% |
0.0% |
(10.2%) |
|||
|
Average |
145 |
359.3 |
421.8 |
433 |
421 |
419 |
404.6 |
403.4 |
397.3 |
411.5 |
424.4 |
8.1% |
2.2% |
3.3% |
1.1% |
|||
Source: Cytonn Research
- Nairobi Suburbs – High Rise Residential Areas
High rise residential areas of Nairobi realized an average YoY capital appreciation of 2.7%, with the average asking prices coming in at Kshs 82.6 mn in FY’2024/25 from Kshs 80.4 mn recorded in FY’2023/24. Additionally, the performance represented a 14-year average CAGR of 7.2%, with average asking prices coming in at Kshs 82.6 mn in FY’2024/25 from the Kshs 31.0 mn recorded in 2011. The performance was supported by; i) Rising population and urbanization in Nairobi increasing demand for housing in the subject areas, ii) unrestricted zoning regulations offering flexibility and growth potential to investors, and, iii) relatively affordable land prices compared to other investment areas.
In terms of performance per node, Kasarani was the best performing, with an average YoY price appreciation of 5.2 %, 2.5% points higher than the 2.7% market average. This was mainly driven by; i) Nairobi’s rapid urbanization and population growth pushing residents to seek affordable housing options, leading to increased demand in Nairobi peripheral areas, ii) availability of infrastructure with the area being served by Thika super highway hence easily accessible, iii) proximity to various amenities such as JKIAA, and SGR via Eastern bypass and iv) an increasing middle class in the area. The table below shows the performance of land in high rise residential areas within the NMA;
|
All values is Kshs mn per Acre unless stated otherwise |
|
|
|||||||||||||||
|
Cytonn Report: NMA Middle End Suburbs – High Rise Residential Areas Land Performance |
|
|
|||||||||||||||
|
Location |
*Price in 2011 |
*Price in 2015 |
*Price in 2016 |
*Price in 2017 |
*Price 2018/19 |
*Price 2019/20 |
*Price 2020/21 |
*Price 2021/22 |
*Price 2022/23 |
*Price 2023/24 |
*Price 2024/25 |
14-Year CAGR |
2022/23 Capital |
2023/24 Capital Appreciation |
∆ in Capital appreciation |
||
|
Appreciation |
|||||||||||||||||
|
Kasarani |
32 |
51 |
60 |
64 |
66 |
65 |
67.7 |
66.9 |
72.45 |
74.4 |
78.3 |
6.6% |
2.8% |
5.2% |
2.5% |
||
|
Dagoretti |
28 |
81 |
95 |
99 |
100 |
103 |
95.2 |
95.2 |
88.6 |
91.1 |
93.9 |
9.0% |
2.8% |
3.1% |
0.3% |
||
|
Embakasi |
33 |
61 |
60 |
70 |
61 |
63 |
67.2 |
66.9 |
73.9 |
75.8 |
75.5 |
6.1% |
2.5% |
(0.4%) |
(2.9%) |
||
|
Average |
31 |
64.3 |
71.7 |
77.7 |
75.7 |
77 |
76.7 |
76.1 |
78.3 |
80.4 |
82.6 |
7.2% |
2.7% |
2.7% |
(0.0%) |
||
Source: Cytonn Research
Section III: Summary and Investment Opportunity in the Sector
The table below summarizes the performance in capital appreciation of the various areas:
|
Summary and Conclusions - y/y Capital Appreciation Nairobi Metropolitan Area |
|
|
Land Capital Appreciation |
|
|
FY’2024/25 |
Areas |
|
>5.0% |
Limuru, Kitisuru, Karen, Kasarani and Riverside |
|
1.0%- 4.9% |
Upper Hill, Athi River, Rongai, Syokimau, Ridgeways, Spring Valley, Ruiru and Juja, Ruai, Dagoretti, Westlands |
|
<1.0% |
Kileleshwa, Embakasi, Kilimani |
|
Un-serviced Land Capital Appreciation |
|
|
FY’2024/25 |
Areas |
|
>5.0% |
Limuru |
|
1.0% - 4.9% |
Utawala, Rongai, Juja, Athi River, Rongai |
Source: Cytonn Research
Investment Opportunity
- Satellite Towns (Unserviced land) - The investment opportunity in this segment lies in Limuru, Utawala, and Juja submarkets which registered the highest YoY capital returns at 7.0%, 4.6% and 3.2%, respectively, against a market average of 3.3% owing to relative affordability of land and good access to the city center thereby drawing investments,
- High End Residential Suburbs - The investment opportunity in this segment lies in Karen and Kitisuru which recorded the highest YoY capital appreciations of 6.6% and 6.0%, respectively, against the market average of 3.0%. The impressive performance was driven by the relatively high demand resulting from their serene environment, prime locations attracting high net worth investments, availability of adequate infrastructure and various amenities,
- Satellite Towns (Serviced Land) - The investment opportunity in the segment lies in Syokimau, Ruiru& Juja and Athi River which recorded the highest YoY capital appreciations of 4.3%,4.0% and 6%, respectively, against the market average of 3.0%. The performance was supported by; rapid demand driven by the existing growing middle-income class earners, availability of infrastructure networks such as the commuter train station in Syokimau and Thika superhighway and Tatu City to Ruiru and Juja area relatively affordable prices,
- Commercial Zones – The investment opportunity in the segment lies in Riverside, westlands and Upperhill which recorded the highest YoY capital appreciations of 6.9%, 3.2% and 3.1%, respectively, against the market average of 3.3 %. driven close proximity to Nairobi’s Central Business District (CBD) and availability of essential amenities, and
- High Rise Residential Areas - The investment opportunity in the segment lies in Kasarani and Dagoretti which recorded the highest YoY capital appreciations of 5.2% and 3.1%, respectively, against the market average of 2.7%, driven by increased demand for development land to cater for the rapidly dense population in the areas.
Section IV: Conclusion and Outlook for the Sector
|
Cytonn Report: Nairobi Metropolitan Area (NMA) 2025 Land Sector Outlook |
||||
|
Indicator |
2024 Projections |
2025 Projections |
2024 Outlook |
2025 Outlook |
|
Infrastructure Development |
We expect the government continued efforts to launch infrastructural projects such as tarmac roads, sewer lines, water supply, and electricity connectivity will stimulate the economic growth. These factors will in turn lead to growth in Real Estate market and drive up land values Goods and services move to new areas. Additionally, the government increased infrastructure budget allocation by 16.9%, to Kshs 286.6bn in FY’ 2023/2024 from Kshs 245.1 bn in FY’2022/2023. The allocation will be distributed as follows Kshs 113.9 bn to Construction of Roads and Bridges, Kshs 50.9 bn to Maintenance of Roads, and Kshs 80.1 bn for rehabilitation of Roads. However, we foresee the pace of infrastructure development slowing down, considering that the funding for road construction was reduced by Kshs 55.6 bn in the recent mini-budget. The budget for roads in the financial year 2023/24 has been decreased to Kshs 177.1 bn from the initially allocated Kshs 232.7 bn for the State Department for Roads.
|
Infrastructure development in the NMA is expected to intensify, with the government targeting completion of key road corridors such as Eastern Bypass, Kenol–Marua Highway, and Phase II of Nairobi Railway City. The anticipated connection of SGR to Isiolo and onward to Moyale under LAPSSET will further elevate investment appeal in Northern satellite towns. Additionally, utility infrastructure (water, sewer, electricity) is likely to improve with increased allocation for service delivery in underserved peri-urban zones. The government has allocated Kshs 217.3 bn to road development in FY’2025/26, covering Kshs 30.9 bn for construction of new roads and bridges, Kshs 70.8 bn for rehabilitation, and Kshs 115.6 bn for road maintenance. This represents a continued prioritization of the transport sector, although the State Department for Roads’ overall budget stands at Kshs 195.0 bn, reflecting fiscal consolidation pressures. While the allocations signal commitment to sustaining infrastructure growth, the sector still faces funding gaps and a reliance on supplementary financing to meet obligations to contractors.
Some of the notable projects in focus include development of Nairobi railway city, rehabilitation of locomotives, extension of standard gauge railway (SGR) and expansion of airports and airstrips. Additionally, the government plans to complete various infrastructural projects in the country including Riruta – Lenana – Ngong Railway Line, phase I of Nairobi Railway City, the Meter Gauge Railway (MGR) Link from Mombasa SGR Terminus to Mombasa MGR Station, and the Railway Bridge across Makupa Causeway.
As a result of this projects we expect the opening up of satellite towns to Real Estate development and a subsequent rise in property prices.
|
Neutral |
Neutral |
|
Credit Supply |
The government has continued to promote access to affordable credit through the Kenya Mortgage Refinance Company (KMRC) which has been crucial in providing Kenyans with low cost loans increasing home ownership. However, lenders continue to tighten their lending requirements and demand more collateral from developers as a result of elevated credit risk in the Real Estate sector as evidenced by the gross Non-Performing Loans (NPLs) in the Real Estate sector realized a q/q increase of 15.0% to Kshs 117.1 bn in Q1’2024, from Kshs 101.7.0 bn in Q4’2023. As a result, we expect these factors to slow down developers seeking to invest in land purchases and property developments |
Credit conditions may marginally ease in 2025 as inflation stabilizes and the CBR adjusts downward. However, traditional credit channels will remain tight for land developers. Developers may increasingly seek capital through non-traditional financing options like green bonds, land-backed securities, or joint ventures with capitalized institutional investors. KMRC may expand its scope to cover more SACCOs and tier II banks, unlocking limited access for residential land buyers. |
Negative |
Neutral |
|
Legal Reforms |
We expect continued streamlining of the Real Estate Sector through new legal policies and regulations to ensure transparency and efficiency in the land sector.
The high court declined to issue orders stopping the imposition of the affordable housing levy that is currently at the rate of 1.5% of gross salary. Additionally, as of 1st January 2023 the government tripled the Capital Gains Tax (CGT) upon transfer of property to 15.0% from the 5.0% previously chargeable. This is expected to provide the government with much needed capital
|
The government is expected to implement land digitization programs across counties, especially in Nairobi, Machakos, Kiambu and Kajiado. These efforts will streamline e-conveyancing, enhance transaction security, reduce fraud and shorten due diligence periods. Additionally, legal frameworks may be introduced to enable fractional land ownership and securitization of land assets, improving liquidity and transparency in the land market. |
Neutral |
Positive |
|
Real Estate Activities |
We expect the Real Estate sector to record increased and continuous performance on the back of support from; i) government infrastructural development initiatives and focus on affordable housing, ii) continuous focus on mortgage financing through the KMRC, iii) aggressive expansion by both local and international retailers, and, iv) Kenya's positive demographics driving housing demand However, factors such as increased construction costs on the back of inflation, constrained financing to developers with increased underdeveloped capital markets, oversupply in select sectors and low of investor appetite in Real Estate Investments Trusts (REITs) are expected to continue impeding performance of the sector |
The real estate sector's focus on affordable housing will drive up demand for low-cost development land. A shift in investor appetite toward residential and mixed-use land parcels will emerge, particularly in towns like Juja, Athi River, Kamulu, and Ngong. Additionally, speculative buying driven by diaspora remittances and youth-led cooperative models is likely to increase land uptake. The rise of modular construction and land-leasing models may reshape traditional land investment preferences. |
Neutral |
Positive |
|
Land Sector Performance |
Land sector in the NMA continued to record improved performance as a reliable investment opportunity. We expect that the sector's performance to be supported by; i) infrastructural developments opening up satellite towns to real estate investment and development. ii) rising demand for development land facilitated by positive population demographics, ii) ongoing efforts by the government to streamline land transactions creating a more efficient and accessible market, iii) notable increase in the initiation and completion of affordable housing projects owing to both government and private sector involvement, and, iv) rapid expansion of satellite towns, accompanied by substantial infrastructural developments resulting in elevated property prices |
The NMA land sector is expected to remain the most resilient real estate sub-sector, with an estimated 10–20% capital appreciation in well-serviced satellite towns. Demand will be driven by infrastructure-led access, digital land reforms, affordable housing rollouts, and increased interest from diaspora investors. The rise of planned communities and land banking strategies by SACCOs and cooperatives will further deepen the market. However, zoning restrictions, land fragmentation, and delayed approvals may continue to pose moderate structural risks. |
positive |
positive |
|
We have three Positive outlooks; for Real Estate activities, legal reforms and Land sector performance and two neutral outlooks for credit supply and for the infrastructure development thereby bringing our overall outlook for the sector to POSITIVE. We expect the performance to be further boosted by factors driving demand for development land such as; i) Increased infrastructure developments which has improved and opened up areas for investment, ii) Roll out of numerous affordable housing projects by both the public and private sectors, iii) Affordability of land in the satellite towns, iv) Limited supply of land especially in urban areas which has contributed to exorbitant prices, and, v) Positive demographics driving demand for land upwards, facilitated by high population growth and urbanization rates of 2.0% p.a and 3.7% p.a, respectively against the global averages 1.0% p.a and 1.7% p.a, respectively. |
||||
Disclaimer: The views expressed in this publication are those of the writers where particulars are not warranted. This publication, which is in compliance with Section 2 of the Capital Markets Authority Act Cap 485A, is meant for general information only and is not a warranty, representation, advice or solicitation of any nature. Readers are advised in all circumstances to seek the advice of a registered investment advisor

- Talk to us
- Kenya
- P.O Box 20695 - 00200, Nairobi, Kenya
- Cell +254709101200
- Tel +254709101200
- WhatsApp +254741676635
- United States
- +254709101200
- DOWNLOAD OUR APP
-


- Kenya
- 8th Floor, Pinetree Plaza, Kaburu Drive, Ngong Road, Nairobi, Kenya
- USA
- Suite 1150, 1775 Eye Street NW, USA, Washington DC 20006, USA
- Investments
- High Yield
- Private Equity
- Real Estate
- Real Estate
- RiverRun Estates
- Cytonn Towers
- The Ridge
- Taraji Heights
- The Alma