Nairobi Metropolitan Area (NMA) Serviced Apartments Report 2025 & Cytonn Weekly #52/2025
By Research Team, Dec 28, 2025
Executive Summary
Fixed Income
This week, T-bills were undersubscribed for the second consecutive time, with the overall subscription rate coming in at 22.5%, lower than the subscription rate of 67.3% recorded the previous week. Investors’ preference for the shorter 91-day paper persisted, with the paper receiving bids worth Kshs 2.4 bn against the offered Kshs 4.0 bn, translating to a subscription rate of 60.4%, albeit lower than the subscription rate of 89.2%, recorded the previous week. The subscription rates for the 182-day paper decreased to 7.1% from 13.9% recorded the previous week, while that of the 364-day papers decreased to 22.8% from 111.9% recorded the previous week. The government accepted a total of Kshs 5.40 bn worth of bids out of Kshs 5.41 bn bids received, translating to an acceptance rate of 99.9%. The yields on the government papers showed mixed performance with the yields on the 182-day paper remaining unchanged at 7.8% recorded the previous week, while the 91-day and 364-day papers decreased by 4.7 bps and 1.8 bps to 7.7% and 9.21% respectively from the 7.8% and 9.23% recorded the previous week;
We are projecting the y/y inflation rate for December 2025 to decrease to within the range of 4.3% – 4.5%;
Equities
During the week, the equities market recorded a mixed performance, with NSE 20 and NSE 10 gaining by 0.3% and 0.1% respectively while both NASI and NSE 25 declined by 0.3% taking the YTD performance to gains of 50.6%, 46.8%, 45.5% and 45.0% of NSE 20, NASI, NSE 10 and NSE 25 respectively. The equities market performance was mainly driven by gains recorded by large cap stocks such as Equity, Absa and Cooperative Bank of 5.2%, 4.1% and 1.9% respectively. The performance was, however, weighed down by losses recorded by large-cap stocks such as EABL, NCBA and Safaricom of 7.2%, 6.7% and 0.9% respectively;
Also, during the week, the banking sector index gained by 1.1% to 199.3 from 197.2 recorded the previous week. This is attributable to gains recorded by stocks such as Equity, Absa and Cooperative Bank of 5.2%, 4.1% and 1.9% respectively;
Real Estate
During the week, the Kenya National Bureau of Statistics (KNBS) released the Leading Economic Indicators (LEI) October 2025 Reports, which highlighted the performance of major economic indicators;
During the week, the Kenya Mortgage Refinance Company (KMRC) announced that it has supported the issuance of 4,500 affordable home loans, a move that has contributed to the mortgage market in Kenya reaching about 30,000 mortgages outstanding, a milestone for the sector. The support by KMRC, which included Kshs 21.4 bn in refinancing as at August 2025, enabled banks and other lenders to offer home loans at 10.0% interest, significantly lower than the market average of 16.2%, making home ownership more accessible to low- and middle-income households;
During the week, the National Treasury announced that it has cleared Kshs 123.0 bn in road contractors’ pending bills through a structured financing arrangement with commercial banks. The settlement was achieved by borrowing from local banks and issuing infrastructure bonds, easing cash flow pressures on contractors and reducing the stock of verified pending bills within the roads sector. This move is expected to improve liquidity for contractors, stabilize the construction sector, and reduce the accumulation of arrears going forward;
On the Unquoted Securities Platform, Acorn D-REIT and I-REIT traded at Kshs 27.4 and Kshs 23.2 per unit, respectively, as per the last updated data on 5th December 2025. The performance represented a 33.4% and 14.5% gain for the D-REIT and I-REIT, respectively, from the Kshs 20.0 inception price. Additionally, ILAM Fahari I-REIT traded at Kshs 11.0 per share as of 5th December 2025, representing a 45.0% loss from the Kshs 20.0 inception price;
Focus of the Week
In 2024, we published the Nairobi Metropolitan Area Serviced Apartments Report 2024, which highlighted that the average rental yield for serviced apartments within the NMA increased by 0.5% points to 7.3% in 2024 from 6.8% in 2023. The improvement in performance was primarily on the back of improved occupancy rates and monthly charges by 5.9% points and 3.6%, to 72.2% and Kshs 3,155 per SQM, respectively, in 2024. This week, we update our report using 2025 market research data, in which we discuss and determine the progress, performance, and investment opportunities for serviced apartments in the NMA. In terms of performance, the average rental yield for serviced apartments within the NMA increased by 0.1% points to 7.4% in 2025 from 7.3% recorded in 2024. The improvement in performance was primarily on the back of improved occupancy rates and monthly charges by 2.5% points and 6.7%, to 74.7% and Kshs 3,366 per SQM, respectively, in 2025;
Investment Updates:
- Weekly Rates:
- Cytonn Money Market Fund closed the week at a yield of 12.0% p.a. To invest, dial *809# or download the Cytonn App from Google Play store here or from the Appstore here;
- We continue to offer Wealth Management Training every Tuesday, from 7:00 pm to 8:00 pm. The training aims to grow financial literacy among the general public. To register for any of our Wealth Management Trainings, click here;
- If interested in our Private Wealth Management Training for your employees or investment group, please get in touch with us through wmt@cytonn.com;
- Cytonn Insurance Agency acts as an intermediary for those looking to secure their assets and loved ones’ future through insurance namely; Motor, Medical, Life, Property, WIBA, Credit and Fire and Burglary insurance covers. For assistance, get in touch with us through insuranceagency@cytonn.com;
- Cytonn Asset Managers Limited (CAML) continues to offer pension products to meet the needs of both individual clients who want to save for their retirement during their working years and Institutional clients that want to contribute on behalf of their employees to help them build their retirement pot. To more about our pension schemes, kindly get in touch with us through pensions@cytonn.com;
Hospitality Updates:
- We currently have promotions for Staycations. Visit cysuites.com/offers for details or email us at sales@cysuites.com;
Money Markets, T-Bills Primary Auction:
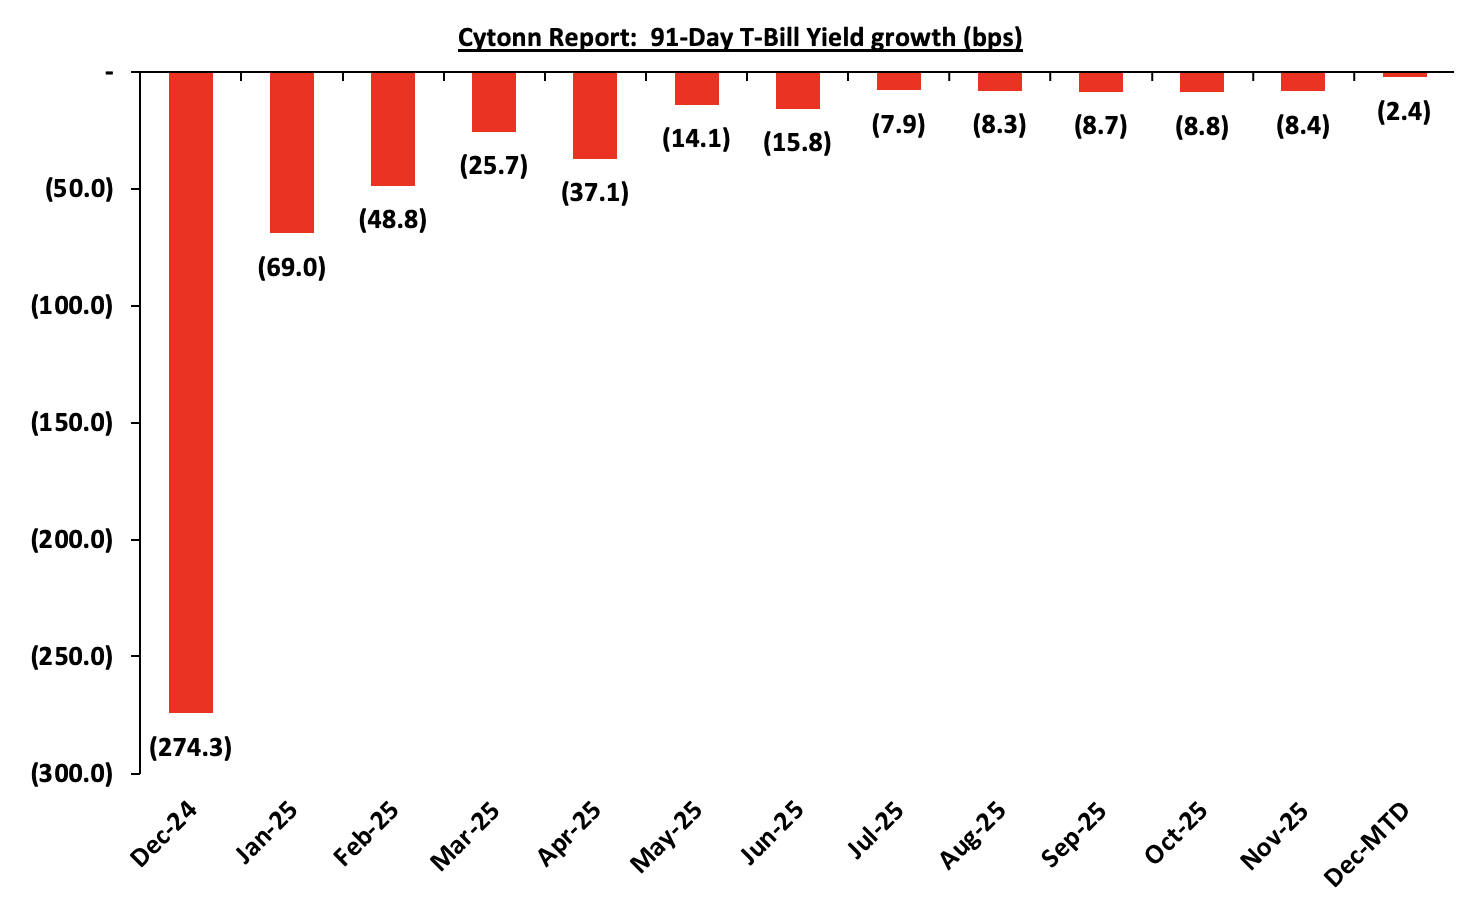
This week, T-bills were undersubscribed for the second consecutive time, with the overall subscription rate coming in at 22.5%, lower than the subscription rate of 67.3% recorded the previous week. Investors’ preference for the shorter 91-day paper persisted, with the paper receiving bids worth Kshs 2.4 bn against the offered Kshs 4.0 bn, translating to a subscription rate of 60.4%, albeit lower than the subscription rate of 89.2%, recorded the previous week. The subscription rates for the 182-day paper decreased to 7.1% from 13.9% recorded the previous week, while that of the 364-day papers decreased to 22.8% from 111.9% recorded the previous week. The government accepted a total of Kshs 5.40 bn worth of bids out of Kshs 5.41 bn bids received, translating to an acceptance rate of 99.9%. The yields on the government papers showed mixed performance with the yields on the 182-day paper remaining unchanged from the 7.8% recorded the previous week, while the 91-day and 364-day papers decreased by 4.7 bps and 1.8 bps to 7.73% and 9.21% respectively from the 7.77% and 9.23% recorded the previous week.
The chart below shows the yield growth rate for the 91-day paper from December 2024 to December month-to-date:
The charts below show the performance of the 91-day, 182-day and 364-day papers from January 2024 to December 2025:

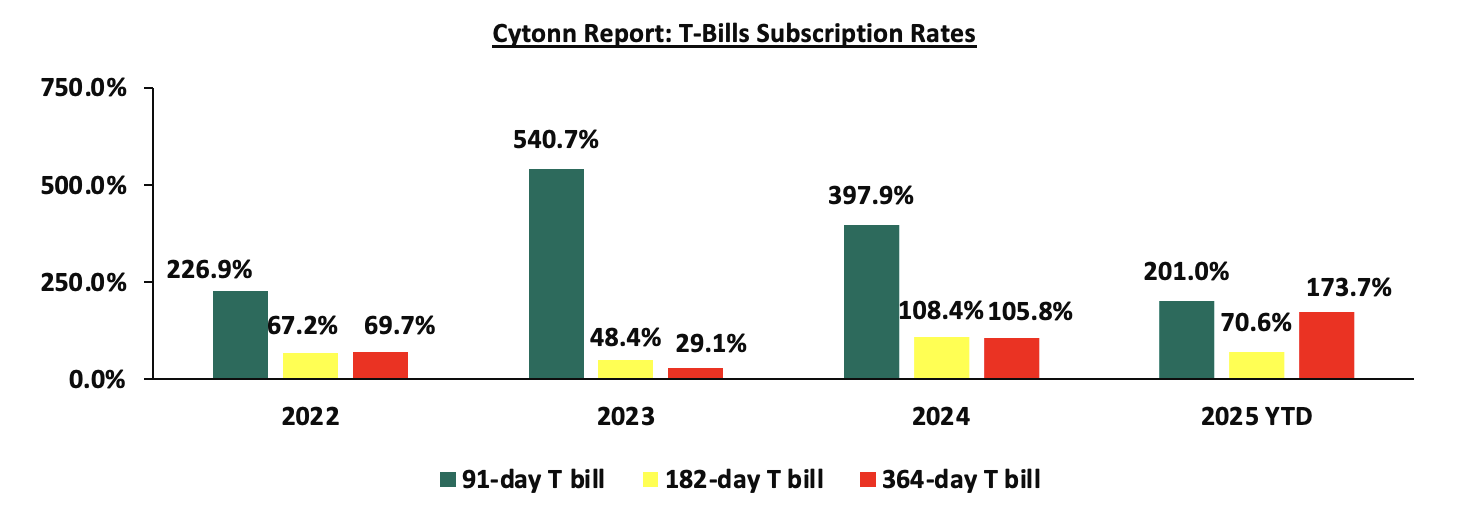
The chart below compares the overall average T-bill subscription rates obtained in 2022,2023, 2024 and 2025 Year-to-date (YTD):
Money Market Performance:
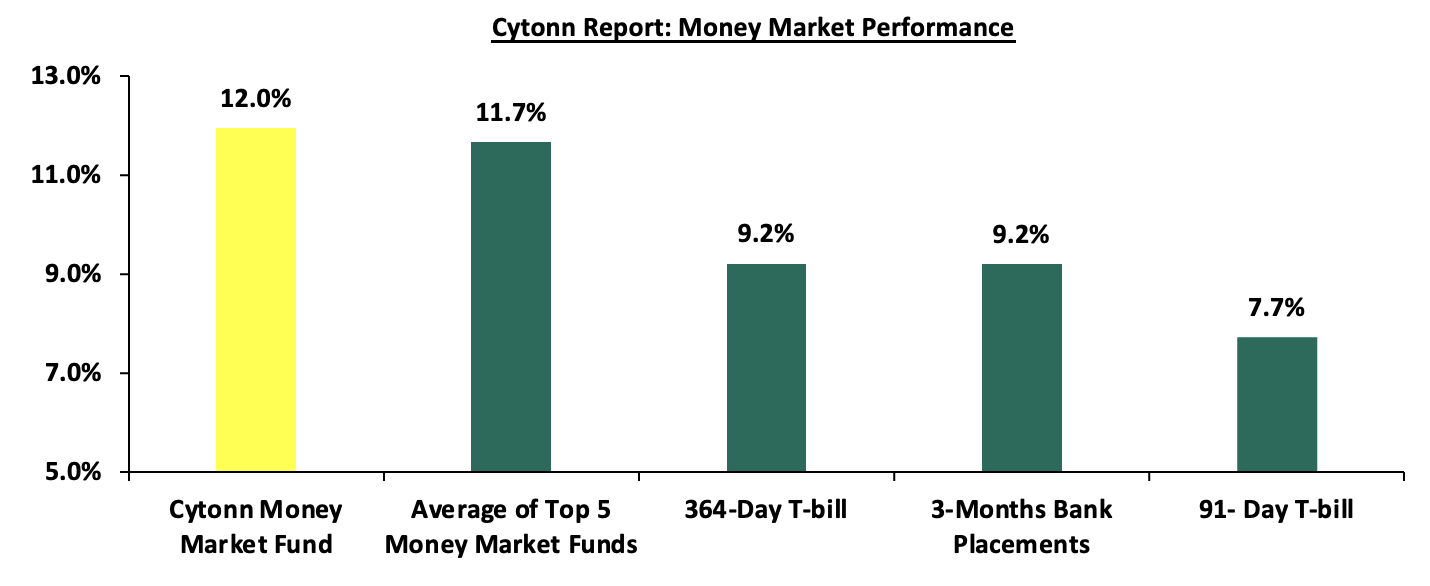
In the money markets, 3-month bank placements ended the week at 9.2% (based on what we have been offered by various banks). The yields on the 91-day and 364-day papers decreased by 4.7 bps and 1.8 bps to 7.7% and 9.21% respectively from the 7.8% and 9.23% recorded the previous week. The yield on the Cytonn Money Market Fund increased by 2.0 bps to 12.0% from the 11.9% recorded in the previous week, while the average yields on the Top 5 Money Market Funds decreased by 3.6 bps to remain unchanged from the 11.7% recorded the previous week.
The table below shows the Money Market Fund Yields for Kenyan Fund Managers as published on 25th December 2025:
|
Money Market Fund Yield for Fund Managers as published on 25th December 2025 |
||
|
Rank |
Fund Manager |
Effective Annual Rate |
|
1 |
Cytonn Money Market Fund (Dial *809# or download Cytonn App) |
12.0% |
|
2 |
Nabo Africa Money Market Fund |
11.9% |
|
3 |
Arvocap Money Market Fund |
11.8% |
|
4 |
Etica Money Market Fund |
11.6% |
|
5 |
Lofty-Corban Money Market Fund |
11.1% |
|
6 |
Enwealth Money Market Fund |
11.1% |
|
7 |
Ndovu Money Market Fund |
11.1% |
|
8 |
Gulfcap Money Market Fund |
10.8% |
|
9 |
Jubilee Money Market Fund |
10.8% |
|
10 |
Kuza Money Market fund |
10.6% |
|
11 |
Old Mutual Money Market Fund |
10.6% |
|
12 |
Madison Money Market Fund |
10.2% |
|
13 |
Orient Kasha Money Market Fund |
9.8% |
|
14 |
Faulu Money Market Fund |
9.8% |
|
15 |
British-American Money Market Fund |
9.8% |
|
16 |
Dry Associates Money Market Fund |
9.6% |
|
17 |
SanlamAllianz Money Market Fund |
9.5% |
|
18 |
Apollo Money Market Fund |
9.5% |
|
19 |
KCB Money Market Fund |
9.5% |
|
20 |
Genghis Money Market Fund |
8.9% |
|
21 |
GenAfrica Money Market Fund |
8.8% |
|
22 |
CIC Money Market Fund |
8.5% |
|
23 |
ICEA Lion Money Market Fund |
8.4% |
|
24 |
CPF Money Market Fund |
8.3% |
|
25 |
Mali Money Market Fund |
8.1% |
|
26 |
Co-op Money Market Fund |
8.0% |
|
27 |
Absa Shilling Money Market Fund |
7.6% |
|
28 |
AA Kenya Shillings Fund |
6.6% |
|
29 |
Ziidi Money Market Fund |
6.3% |
|
30 |
Mayfair Money Market Fund |
6.1% |
|
31 |
Stanbic Money Market Fund |
6.0% |
|
32 |
Equity Money Market Fund |
5.0% |
Source: Business Daily
Liquidity:
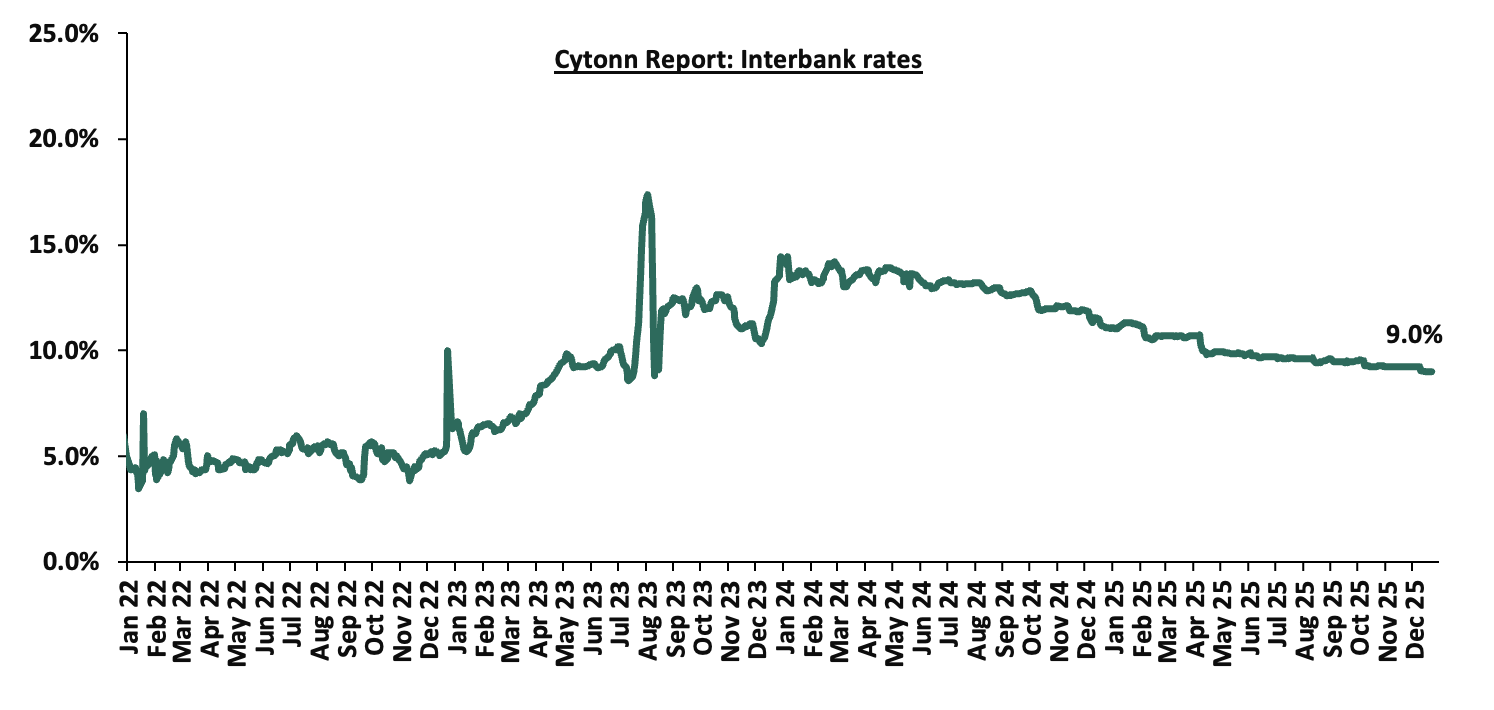
During the week, liquidity in the money markets tightened with the average interbank rate increasing marginally by 0.5 bps to remain unchanged from 9.0% recorded the previous week, partly attributable to tax remittances that offset government payments. The average interbank volumes traded decreased by 10.6% to Kshs 10.1 bn from Kshs 11.3 bn recorded the previous week. The chart below shows the interbank rates in the market over the years:
Kenya Eurobonds:
During the week, the yields on the Eurobonds were on a downward trajectory with the yield on the 12-year Eurobond issued in 2021 decreasing the most by 11.5 bps to 7.9% from 8.0% recorded the previous week. The table below shows the summary performance of the Kenyan Eurobonds as of 23rd December 2025;
|
Cytonn Report: Kenya Eurobond Performance |
|||||||
|
|
2018 |
2019 |
2021 |
2024 |
2025 |
||
|
Tenor |
10-year issue |
30-year issue |
7-year issue |
12-year issue |
13-year issue |
7-year issue |
11-year issue |
|
Amount Issued (USD) |
1.0 bn |
1.0 bn |
0.9 bn |
1.2 bn |
1.0 bn |
1.5 bn |
1.5 bn |
|
Years to Maturity |
2.5 |
22.5 |
1.7 |
6.7 |
8.8 |
5.5 |
10.5 |
|
Yields at Issue |
7.3% |
8.3% |
7.0% |
7.9% |
6.2% |
10.4% |
9.9% |
|
2-Jan-25 |
9.1% |
10.3% |
8.5% |
10.1% |
10.1% |
10.1% |
|
|
4-Dec-25 |
6.2% |
9.1% |
- |
8.1% |
8.6% |
7.9% |
|
|
18-Dec-25 |
6.2% |
8.9% |
- |
7.4% |
8.0% |
7.3% |
|
|
19-Dec-25 |
6.2% |
8.9% |
- |
7.3% |
7.9% |
7.2% |
|
|
22-Dec-25 |
6.1% |
8.9% |
- |
7.3% |
7.9% |
7.2% |
10.0% |
|
23-Dec-25 |
6.1% |
8.9% |
- |
7.3% |
7.9% |
7.2% |
|
|
Weekly Change |
(0.1%) |
0.0% |
- |
(0.1%) |
(0.1%) |
(0.1%) |
0.0% |
|
MTD Change |
(0.1%) |
(0.3%) |
- |
(0.8%) |
(0.8%) |
(0.7%) |
0.0% |
|
YTD Change |
(2.9%) |
(1.4%) |
- |
(2.8%) |
(2.2%) |
(2.9%) |
0.0% |
Source: Central Bank of Kenya (CBK) and National Treasury
Kenya Shilling:
During the week, the Kenya Shilling depreciated against the US Dollar by 3.3 bps, to Kshs 129.00 from Kshs 128.95 recorded the previous week. On a year-to-date basis, the shilling has appreciated by 24.0 bps against the dollar, lower than the 17.6% appreciation recorded in 2024.
We expect the shilling to be supported by:
- Diaspora remittances standing at a cumulative USD 5,046.6 mn in the twelve months to November 2025, 3.6% higher than the USD 4,872.2 mn recorded over the same period in 2024. This has continued to cushion the shilling against further depreciation. In the November 2025 diaspora remittances figures, North America remained the largest source of remittances to Kenya accounting for 60.6% in the period,
- The tourism inflow receipts which are projected to reach Kshs 560.0 bn in 2025 up from Kshs 452.2 bn in 2024 a 23.9% increase, and owing to tourist arrivals that improved by 9.9% to 2,424,382 in the 12 months to June 2025 from 2,206,469 in the 12 months to June 2024, and,
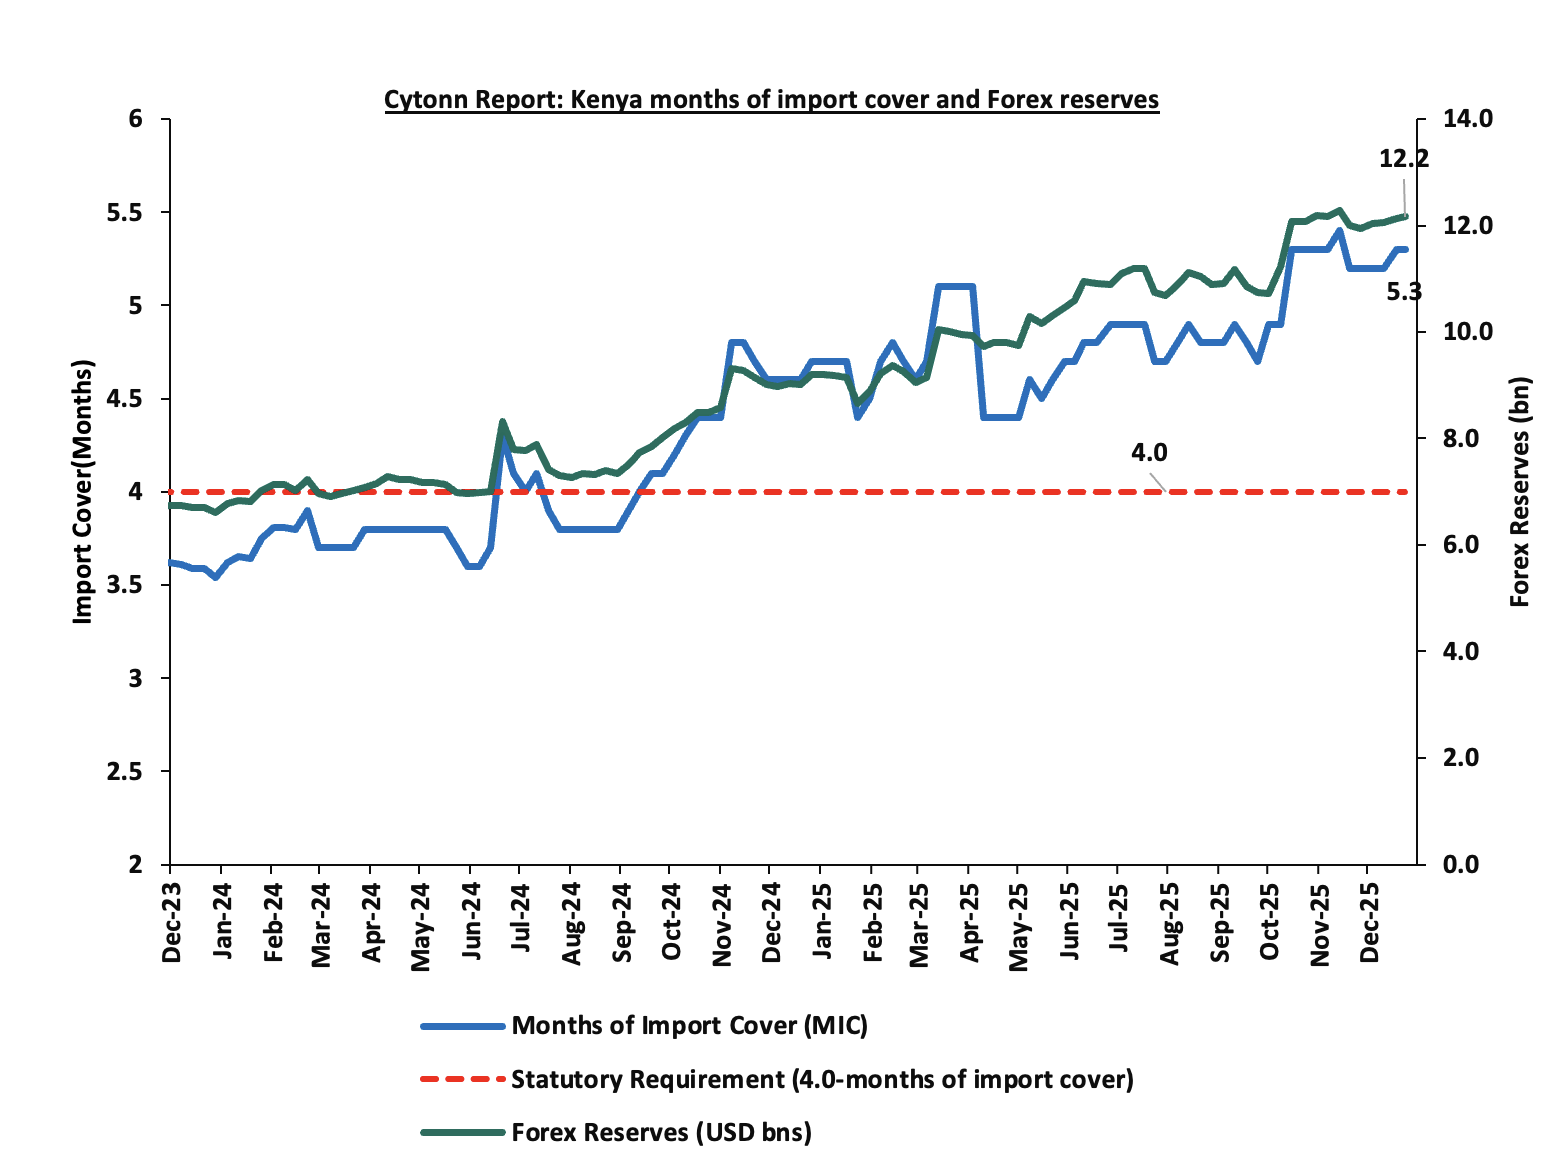
- Improved forex reserves currently at USD 12.2 bn (equivalent to 5.3-months of import cover), which is above the statutory requirement of maintaining at least 4.0-months of import cover and above the EAC region’s convergence criteria of 4.5-months of import cover.
The shilling is however expected to remain under pressure in 2025 as a result of:
- An ever-present current account deficit which came at 2.2% of GDP in the twelve months to October 2025, and,
- The need for government debt servicing, continues to put pressure on forex reserves given that 59.7% of Kenya’s external debt is US Dollar-denominated as of June 2025.
Kenya’s forex reserves increased by 0.3% during the week to remain relatively unchanged from the USD 12.2 bn recorded the previous week, equivalent to 5.3 months of import cover, and above the statutory requirement of maintaining at least 4.0-months of import cover.
The chart below summarizes the evolution of Kenya's months of import cover over the years:
Weekly Highlights
- December 2025 Inflation Projection
We are projecting the y/y inflation rate for December 2025 to reduce to within the range of 4.3% – 4.5%, mainly on the back of:
- Appreciation of the Kenya Shilling against the US Dollar – The Kenya Shilling has recorded a 4 bps month-to-date appreciation as of 24th December to Kshs 129.0 from Kshs 129.8 recorded at the beginning of the month. This appreciation in the exchange rate could ease inflationary pressures, making imported goods more affordable.
- Stable Fuel Prices in December 2025– The Energy and Petroleum Regulatory Authority (EPRA) released their monthly statement on the maximum retail fuel prices in Kenya, effective from 15th December 2025 to 14th January 2026. Notably, the maximum allowed prices for Super Petrol, Diesel and Kerosene remained unchanged from the previous pricing cycle in October. Consequently, Super Petrol, Diesel and Kerosene will continue to retail at Kshs 184.5, Kshs 171.5 and Kshs 8 per litre respectively. This unchanged fuel prices may alleviate upward pressure on inflation, given fuel's significant role in transportation and production costs across the economy.
We, however, expect that inflation rate will, however, be weighed down by:
- The decrease in the Central Bank Rate (CBR) by 0 bps to 9.00% from 9.25% in the last sitting – In 2025, the CBK Monetary Policy Committee has continued adopting an accommodative monetary policy stance, reducing the Central Bank Rate (CBR) by a cumulative 225.0 bps from 11.25% at the beginning of the year. Notably, the MPC cut the Central Bank Rate (CBR) by 25.0 bps in December 2025, lowering it to 9.00% from 9.25% in October 2025. This reduction in the CBR is likely to increase the money supply through lower borrowing costs, which may cause a slight rise in inflation rates as the effects of the CBR continue to gradually take hold in the broader economy.
Going forward, we expect inflationary pressures to remain anchored in the short term, remaining within the CBK’s target range of 2.5%-7.5% aided by the stability of the Shilling and fuel prices. However, risks remain, particularly from the potential for increased demand-driven inflation due to accommodative monetary policy and the possible high food prices. The decision to lower the CBR to 9.00% during the latest MPC meeting will likely increase money supply, in turn increasing inflation, especially with further cuts expected in the coming meetings. The CBK’s ability to balance growth and inflation through close monitoring of both inflation and exchange rate stability will be key to maintaining inflation within the target range.
Rates in the Fixed Income market have been on a downward trend due to high liquidity in the money market which allowed the government to front load most of its borrowing. The government is 110.7% ahead of its prorated net domestic borrowing target of Kshs 315.6 bn, having a net borrowing position of Kshs 664.9 bn (inclusive of T-bills). However, we expect a stabilization of the yield curve in the short and medium term, with the government looking to increase its external borrowing to maintain the fiscal surplus, hence alleviating pressure in the domestic market. As such, we expect the yield curve to stabilize in the short to medium-term and hence investors are expected to shift towards the long-term papers to lock in the high returns
Market Performance:
During the week, the equities market recorded a mixed performance, with NSE 20 and NSE 10 gaining by 0.3% and 0.1% respectively while both NASI and NSE 25 declined by 0.3% taking the YTD performance to gains of 50.6%, 46.8%, 45.5% and 45.0% of NSE 20, NASI, NSE 10 and NSE 25 respectively. The equities market performance was mainly driven by gains recorded by large cap stocks such as Equity, Absa and Cooperative Bank of 5.2%, 4.1% and 1.9% respectively. The performance was, however, weighed down by losses recorded by large-cap stocks such as EABL, NCBA and Safaricom of 7.2%, 6.7% and 0.9% respectively.
Also, during the week, the banking sector index gained by 1.1% to 199.3 from 197.2 recorded the previous week. This is attributable to gains recorded by stocks such as Equity, Absa and Cooperative Bank of 5.2%, 4.1% and 1.9% respectively.
During the week, equities turnover decreased by 80.4% to USD 11.8 mn from USD 60.2 mn recorded the previous week, taking the YTD total turnover to USD 1,106.0 mn. Foreign investors became net sellers for the first time in three weeks with a net selling position of USD 0.5 mn, from a net buying position of USD 0.9 mn recorded the previous week, taking the YTD foreign net selling position to USD 93.0 mn, compared to a net selling position of USD 16.9 mn recorded in 2024.
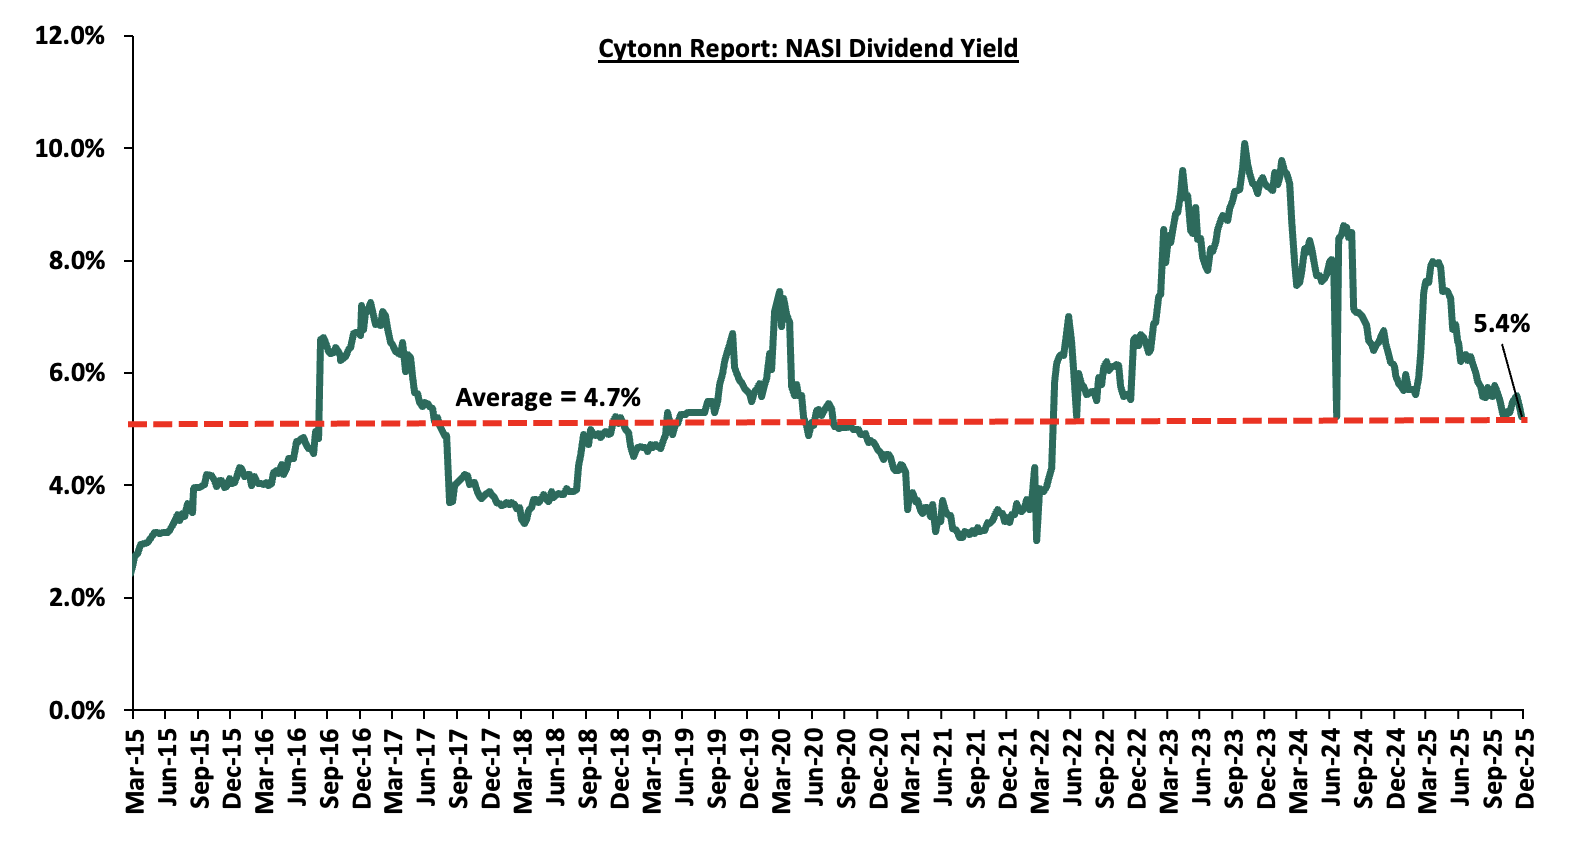
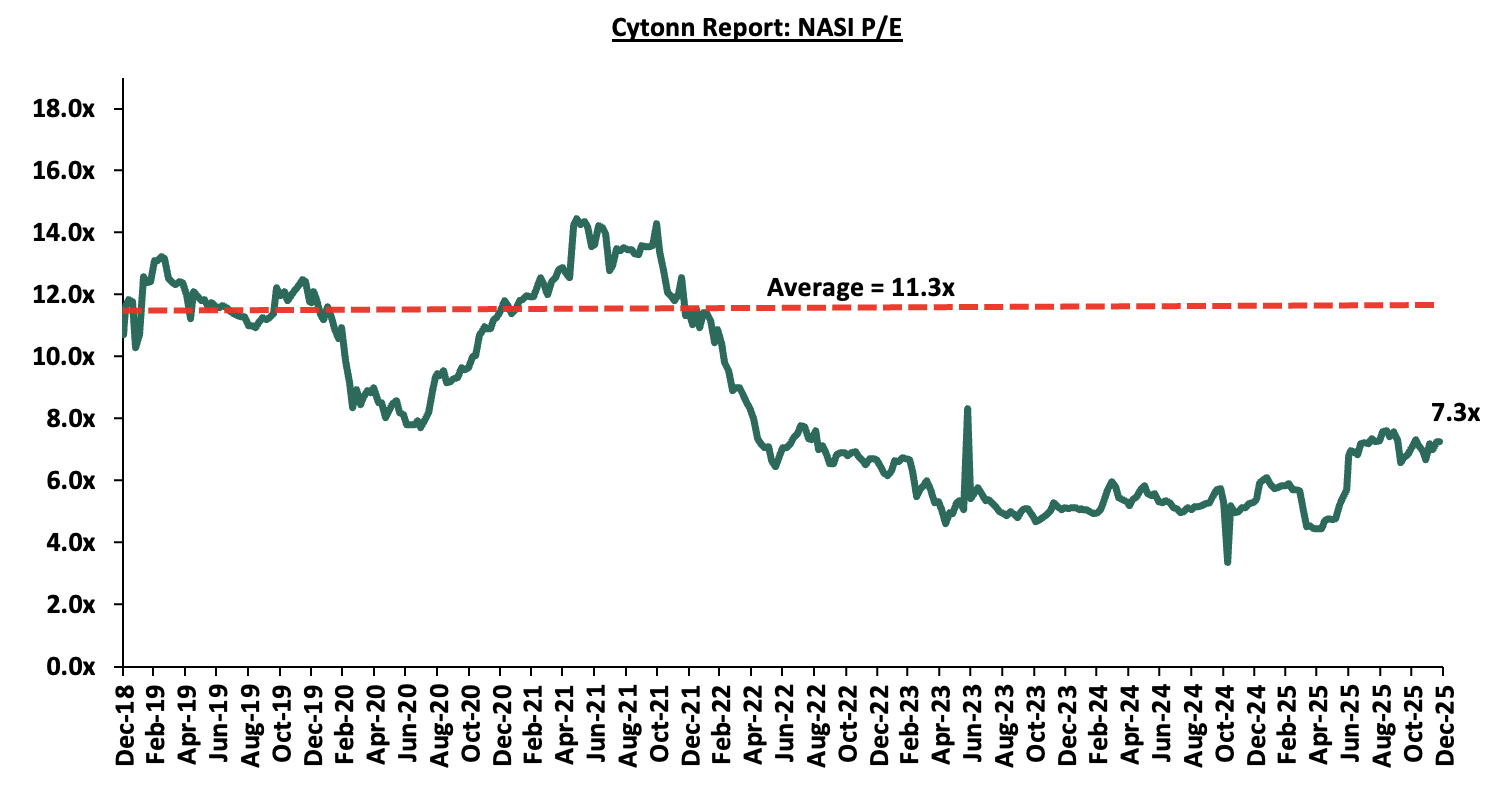
The market is currently trading at a price to earnings ratio (P/E) of 7.3x, 36.1% below the historical average of 11.3x. The dividend yield stands at 5.4%, 0.7% points above the historical average of 4.7%. Key to note, NASI’s PEG ratio currently stands at 0.9x, an indication that the market is slightly undervalued relative to its future growth. A PEG ratio greater than 1.0x indicates the market may be overvalued while a PEG ratio less than 1.0x indicates that the market is undervalued.
The charts below indicate the historical P/E and dividend yields of the market;
Universe of Coverage:
|
Cytonn Report: Equities Universe of Coverage |
|||||||||||
|
Company |
Price as at 19/12/2025 |
Price as at 24/12/2025 |
w/w change |
YTD Change |
Year Open 2025 |
Target Price* |
Dividend Yield |
Upside/ Downside** |
P/TBv Multiple |
Recommendation |
|
|
I&M Group |
42.9 |
42.4 |
(1.1%) |
17.8% |
36.0 |
53.1 |
7.1% |
32.3% |
0.7x |
Buy |
|
|
ABSA Bank |
22.1 |
23.0 |
4.1% |
22.0% |
18.9 |
28.3 |
7.6% |
30.7% |
1.5x |
Buy |
|
|
NCBA |
89.0 |
83.0 |
(6.7%) |
62.7% |
51.0 |
101.3 |
6.6% |
28.7% |
1.3x |
Buy |
|
|
Equity Group |
62.5 |
65.8 |
5.2% |
37.0% |
48.0 |
75.2 |
6.5% |
20.8% |
1.1x |
Buy |
|
|
Diamond Trust Bank |
114.0 |
114.0 |
0.0% |
70.8% |
66.8 |
129.4 |
6.1% |
19.6% |
0.4x |
Accumulate |
|
|
Co-op Bank |
23.3 |
23.7 |
1.9% |
35.8% |
17.5 |
26.8 |
6.3% |
19.4% |
0.8x |
Accumulate |
|
|
Standard Chartered Bank |
300.0 |
300.0 |
0.0% |
5.2% |
285.3 |
307.9 |
15.0% |
17.6% |
1.7x |
Accumulate |
|
|
Stanbic Holdings |
195.5 |
197.3 |
0.9% |
41.1% |
139.8 |
205.5 |
10.5% |
14.7% |
1.2x |
Accumulate |
|
|
KCB Group |
62.3 |
62.5 |
0.4% |
47.4% |
42.4 |
65.8 |
4.8% |
10.1% |
0.8x |
Accumulate |
|
|
Britam |
8.9 |
9.0 |
1.1% |
54.3% |
5.8 |
9.5 |
0.0% |
6.0% |
0.8x |
Hold |
|
|
Jubilee Holdings |
311.8 |
329.8 |
5.8% |
88.7% |
174.8 |
333.5 |
4.1% |
5.2% |
0.5x |
Hold |
|
|
CIC Group |
4.4 |
4.7 |
7.1% |
118.2% |
2.1 |
4.8 |
2.8% |
4.5% |
1.3x |
Sell |
|
|
*Target Price as per Cytonn Analyst estimates **Upside/ (Downside) is adjusted for Dividend Yield ***Dividend Yield is calculated using FY’2024 Dividends |
|
||||||||||
We are “Bullish” on the Equities markets in the short term due to current attractive valuations, lower yields on short-term government papers and expected global and local economic recovery, and, “Neutral” in the long term due to persistent foreign investor outflows. With the market currently trading at a discount to its future growth (PEG Ratio at 0.9x), we believe that investors should reposition towards value stocks with strong earnings growth and that are trading at discounts to their intrinsic value. We expect the current high foreign investors sell-offs to continue weighing down the economic outlook in the short term.
- Residential Sector
During the week, the National Treasury disclosed that KMRC’s interventions have helped lift cumulative mortgage lending to Kshs 21.4 bn as at August 2025 and that more than 4,500 affordable home loans were disbursed across 39 counties under its refinancing programme. These loans have an average interest rate of 10.0%, made possible by KMRC’s provision of long-term funding to primary mortgage lenders (PMLs) at approximately 5.0%, which in turn helps reduce borrowing costs for homebuyers.
The lower interest rate through KMRC-backed facilities is substantially cheaper compared with the broader market’s average mortgage rates, which have been above 16.0%, thus boosting the accessibility and affordability of housing finance for many Kenyans. The Treasury highlighted that this has made home ownership more affordable for households that would otherwise struggle with higher interest costs.
KMRC was established in 2018 with the goal of increasing the availability of affordable mortgage financing in Kenya. Since its inception, the number of mortgage loans in the market has risen modestly, crossing the 30,000 mark for the first time in 2024. At the end of December 2024, there were 30,016 mortgage loans, according to Central Bank of Kenya, up from 29,260 the year before. Outstanding mortgage values also increased slightly during this period.
The government is also leveraging KMRC to support its broader Affordable Housing Programme (AHP), which has seen over 214,000 housing units under construction nationwide. Completed units and ongoing projects span all 47 counties, and the programme has already started handing over units to beneficiaries. The Treasury also noted that affordable housing initiatives have created significant employment, with projected job creation reaching one million by 2026.
This move is expected to positively impact the residential Real Estate sector by lowering the cost of home ownership and increasing effective housing demand, particularly within the affordable and mid-income segments. Improved access to long-term, lower-cost mortgage financing is likely to enhance absorption of existing housing stock, improve sales uptake, encourage developers to scale up residential developments, and support sustained growth and stability within Kenya’s residential real estate market.
- Industry Report
- October Leading Economic Indicators (LEI)
During the week, the Kenya National Bureau of Statistics (KNBS) released the Leading Economic Indicators (LEI) October 2025 Report, which highlighted the performance of major economic indicators. Key highlights related to the Real Estate sector include:
- In October 2025, cement consumption reached 960,182 metric tonnes, representing a 19.0% y/y increase from the same month in 2024. Month-on-month, consumption grew by 3.3%, reflecting sustained momentum in the construction sector. The performance was anchored by (i) continued private sector construction activity in urban hubs such as Nairobi, Mombasa, and Kisumu, (ii) government-led infrastructure investments under the Bottom-Up Economic Transformation Agenda (BETA), including roads, affordable housing, water, and sanitation projects, and (iii) public works initiatives in rural and semi-urban areas, which both support livelihoods and expand critical infrastructure.
The chart below shows cement consumption in metric tonnes in Kenya between Q1’2023 and October 2025.
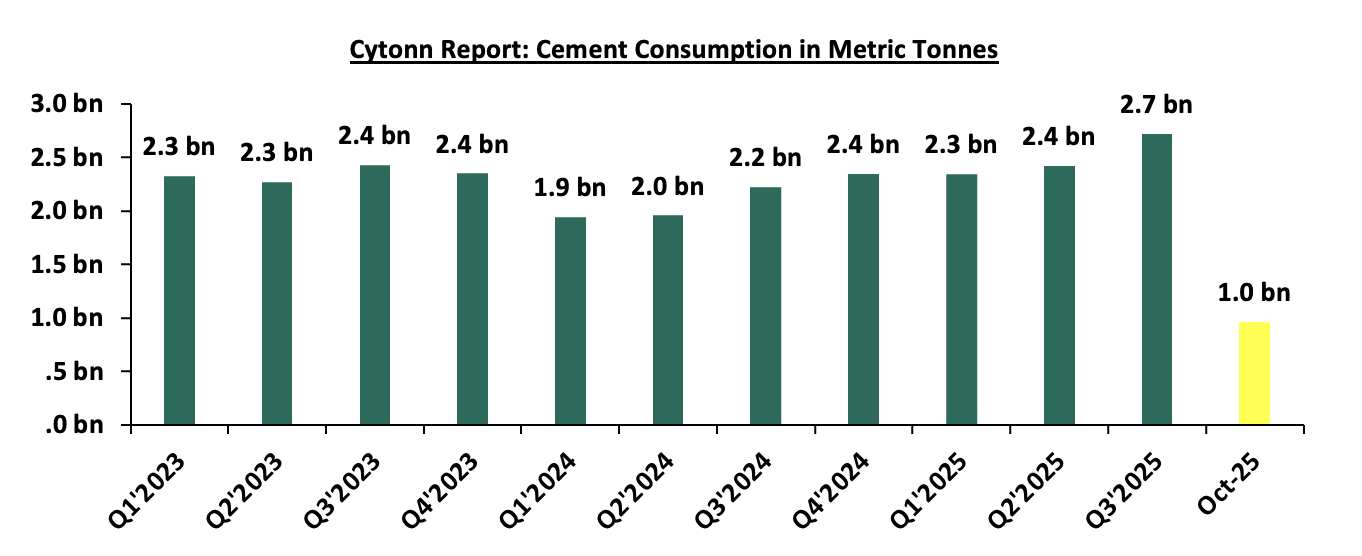
Source: Kenya National Bureau of Statistics (KNBS)
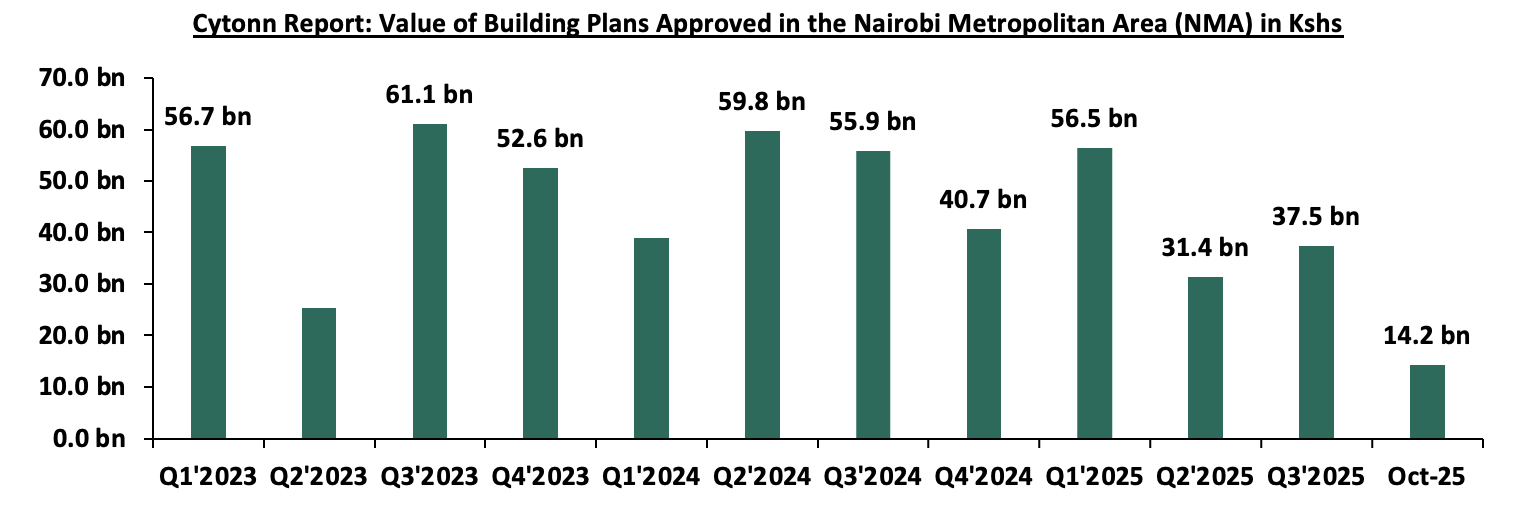
- In October 2025, the value of building plans approved in Nairobi City County was Ksh 14.2 bn, representing a 50.9% increase on a year-on-year basis from Ksh 9.4 bn in October 2024, but a 5.9% decline compared to September 2025, pointing to a mixed development outlook. The strong year-on-year growth reflects (i) a gradual recovery in investor confidence in the real estate sector following earlier market caution, (ii) developers’ continued focus on completing ongoing projects, particularly in high-demand residential segments, and (iii) improvements in planning processes that have partially eased previous procedural bottlenecks. The slight month-on-month decline, however, suggests that developers are pacing new project launches in response to temporary market saturation in certain high-end residential and commercial segments, as well as ongoing procedural adjustments within the planning authority that have caused short-term delays in approvals.
The chart below shows the building plans approved in billions in Kenya between Q1’2023 and October 2025.
Source: Kenya National Bureau of Statistics (KNBS)
- Infrastructure Sector
National Treasury Clears Road Contractors Pending Bills
During the week, the Treasury disclosed that it had settled Kshs 123.0 bn worth of pending bills owed to road contractors, primarily through loans from local commercial banks and proceeds from infrastructure bond issuances. The payments covered obligations accumulated up to December 2024, with the funds channeled directly to contractors to clear long-outstanding dues.
The Treasury noted that the settlement was financed through Kshs 93.0 bn in commercial bank loans and Kshs 30.0 bn from infrastructure bonds, with repayment structured over time to reduce immediate fiscal pressure. The borrowing involved several local banks, including KCB Bank, Equity Bank, Cooperative Bank, and Absa Bank Kenya, highlighting strong domestic participation in government financing.
According to the Treasury, clearing the pending bills was aimed at addressing liquidity constraints faced by contractors, many of whom had slowed or halted projects due to delayed payments. The move is also expected to improve the financial health of contractors, reduce non-performing loans in the banking sector linked to unpaid government obligations, and restore confidence among suppliers engaged in public infrastructure projects.
The Treasury further indicated that measures are being put in place to prevent the re-accumulation of pending bills, including stricter verification processes, improved cash flow planning, and tighter controls on contract awards to ensure alignment with available funding.
This move is expected to have a positive impact on the Real Estate construction sectors, as improved liquidity among road contractors supports the timely completion of infrastructure projects, enhances connectivity, and lowers development costs. Improved road infrastructure is likely to unlock new development corridors, support residential expansion in peri-urban areas, and strengthen overall activity within the residential real estate market by improving accessibility and investor confidence
- Real Estate Investments Trusts
- REITs Weekly Performance
On the Unquoted Securities Platform, Acorn D-REIT and I-REIT traded at Kshs 27.4 and Kshs 23.2 per unit, respectively, as per the last updated data on 5th December 2025. The performance represented a 33.4% and 14.5% gain for the D-REIT and I-REIT, respectively, from the Kshs 20.0 inception price. The volumes traded for the D-REIT and I-REIT came in at Kshs 12.8 mn and Kshs 40.6 mn shares, respectively, with a turnover of Kshs 323.5 mn and Kshs 791.5 mn, respectively, since inception in February 2021. Additionally, ILAM Fahari I-REIT traded at Kshs 11.0 per share as of 5th December 2025, representing a45.0% loss from the Kshs 20.0 inception price. The volume traded to date came in at 1.2 mn shares for the I-REIT, with a turnover of Kshs 1.5 mn since inception in November 2015.
REITs offer various benefits, such as tax exemptions, diversified portfolios, and stable long-term profits. However, the ongoing decline in the performance of Kenyan REITs and the restructuring of their business portfolios are hindering significant previous investments. Additional general challenges include:
- Insufficient understanding of the investment instrument among investors leading to a slower uptake of REIT products,
- Lengthy approval processes for REIT creation,
- High minimum capital requirements of Kshs 100.0 mn for REIT trustees compared to Kshs 10.0 mn for pension funds Trustees, essentially limiting the licensed REIT Trustee to banks only
- The rigidity of choice between either a D-REIT or and I-REIT forces managers to form two REITs, rather than having one Hybrid REIT that can allocate between development and income earning properties
- Limiting the type of legal entity that can form a REIT to only a trust company, as opposed to allowing other entities such as partnerships, and companies,
- We need to give time before REITS are required to list – they would be allowed to stay private for a few years before the requirement to list given that not all companies maybe comfortable with listing on day one, and,
- Minimum subscription amounts or offer parcels set at Kshs 0.1 mn for D-REITs and Kshs 5.0 mn for restricted I-REITs. The significant capital requirements still make REITs relatively inaccessible to smaller retail investors compared to other investment vehicles like unit trusts or government bonds, all of which continue to limit the performance of Kenyan REITs.
We expect the performance of Kenya’s Real Estate sector to remain resilient, supported by several factors: i) growth in key indicators as highlighted by the October 2025 Leading Economic Indicators report, ii) the support by KMRC, which has contributed to the issuance of 4,500 affordable home loans and lowered mortgage rates to 10.0%, and iii) improving investor confidence in structured real estate securities, evidenced by gains in Acorn’s D-REIT 33.4% and I-REIT 14.5% since inception. However, challenges such as weak investor appetite in listed REITs such as ILAM Fahari I-REIT (down 45% from inception) will continue to impede the sector’s optimal performance.
In 2024, we published the Nairobi Metropolitan Area Serviced Apartments Report 2024, which highlighted that the average rental yield for serviced apartments within the NMA increased by 0.5% points to 7.3% in 2024 from 6.8% in 2023. The improvement in performance was primarily on the back of improved occupancy rates and monthly charges by 5.9% points and 3.6%, to 72.2% and Kshs 3,155 per SQM, respectively, in 2024. This week, we update our report using 2025 market research data and by focusing on;
- Overview of the Kenyan Hospitality Sector,
- Introduction to Serviced Apartments,
- Supply and Distribution of Serviced Apartments within the NMA,
- Performance of Serviced Apartments in the NMA,
- Serviced Apartments Performance by Node
- Comparative Analysis - 2024/2025 Market Performance
- Performance per Typology
- Recommendations and Outlook.
Section I: Overview of the Kenyan Hospitality Sector
In 2025, Kenya's hospitality sector continues to display remarkable resilience in the aftermath of the COVID-19 pandemic. Its performance is largely supported by Nairobi's emergence as a regional business hub, attracting multinational companies to set up offices and hosting major international conferences. Additionally, Kenya’s status as a leading tourist destination has further driven recovery and growth, with increased business travel and tourism playing a significant role in strengthening the sector's contribution to the economy.
In terms of international arrivals, Kenya National Bureau of Statistics’ Leading Economic Indicators – September 2025 report highlighted that the number of arrivals was 745,720 reflecting a 35.1% increase from 552,108 arrivals recorded in Q2’2025. On a year-on-year basis, this represented a 52.2% increase compared to 489,831 arrivals in Q3’2024. The improved performance can be attributed to several factors; i) recovery globally in the tourism industry coupled with a strong marketing campaigns, ii) visa openness following the introduction of the Electronic Tourist Authorization (eTA) at the beginning of the year, iii) improvements in air connectivity through introduction of new routes and more frequencies by major airlines and the introduction of direct flights by three new airlines—IndiGo (Mumbai-Nairobi), Fly Dubai (Dubai-Mombasa), and Airlink (Johannesburg-Nairobi), iv) the creation of specialized tourism offerings such as cruise, adventure, cultural, and sports tourism, and, v) expanded global promotion of Kenya's tourism by the Ministry of Tourism and the Kenya Tourism Board using platforms like Magical Kenya. The chart below shows the number of international arrivals in Kenya between Q1’2023 and Q3’2025;
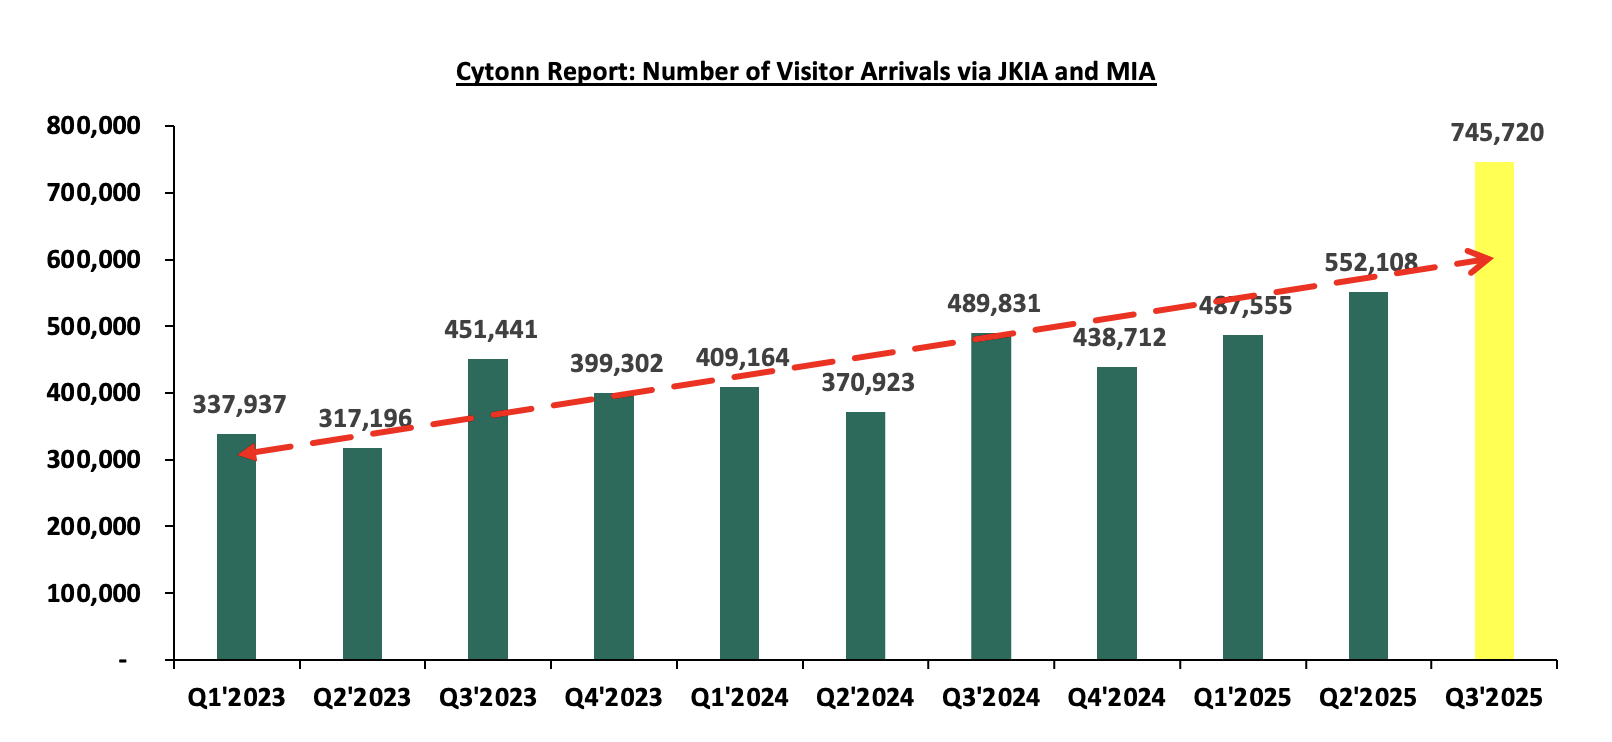
Source: Kenya National Bureau of Statistics
Some of the factors that continue to cushion the hospitality sector include;
- Tourism recovery and growth- International arrivals rebounded strongly post-COVID, driven by renewed long-haul travel, aggressive destination marketing by the Kenya Tourism Board, and the return of conferences, safaris, and beach tourism.
- Active promotion of Kenya as a Tourist Hub: The government continues to market the country as leading tourist destination. Initiatives such as Magical Kenya Travel Expo, Ziara campaign and strategic partnership with airlines have been instrumental in attracting a broad range of visitors strengthening the industry.
- Diverse tourist attractions: The country boasts of rich variety of attractions—including its iconic wildlife reserves, cultural landmarks, and stunning landscapes—continues to draw global attention. Key sites such as the Lake Turkana National Parks, Lake Nakuru National Park, Mount Kenya National Park, Lamu Old Town, and Fort Jesus remain popular due to ongoing conservation efforts and innovative tourism experiences that offer travelers authentic and immersive adventures.
- Expansion of business and diplomatic travel: Nairobi’s role as a regional business, UN, and diplomatic hub continues to drive demand for hotels and serviced apartments, especially from expatriates, consultants, NGOs, and multinational firms.
- Growth of serviced apartments and alternative accommodation: Increased preference for long-stay, flexible, and cost-efficient accommodation has boosted serviced apartments, particularly among corporate travelers and relocating professionals.
- Improved air connectivity and infrastructure: Expansion of direct international flights (e.g. Europe, Middle East, Asia) and upgrades at JKIA and regional airports have improved accessibility and reduced travel friction.
- Rise of domestic and regional tourism: Growth of Kenya’s middle class, regional travel from East and Central Africa, and “staycation” culture has supported occupancy, especially during low international seasons.
- Entry of international hotel brands and professional management: Global brands (Marriott, Accor, Ascott, Radisson, CityBlue) have improved service standards, marketing reach, and investor confidence, lifting overall sector performance.
Nevertheless, the sector continues to face challenges, mainly;
- Escalating Costs of Operation: In 2025, persistently high energy, food, water, and logistics costs have compressed margins, making it difficult for operators to maintain service quality without raising room rates. Increased Non-Performing Loans (NPLs) by 2% in hospitality-related lending reflect liquidity stress, constrained refinancing options, and pressure on cash flows.
- Inadequate Reputational Management: Kenya’s hospitality sector remains vulnerable to the impacts of negative travel advisories issued during times of crisis, resulting in reduced international visitor numbers. Currently, there is no dedicated government strategy to proactively manage or mitigate these reputational risks. Consequently, the industry continues to face setbacks from travel advisories sometimes issued by foreign governments.
Section II: Introduction to Serviced Apartments
Serviced apartments, fully furnished for both short-term and extended stays, have firmly established themselves as a key segment of the hospitality industry within the Nairobi Metropolitan Area (NMA). Combining the comfort of a home with the convenience of hotel services, these residences offer a variety of amenities. They typically include spacious living areas, fully equipped kitchens, separate bedrooms, and en-suite bathrooms, creating a self-contained and adaptable living space for guests. As of 2025, serviced apartments continued to transform the hospitality experience by catering to a wide audience, such as business professionals, families, digital nomads, and vacationers, with customized offerings to meet diverse preferences. Their popularity stems from distinct advantages and features, including:
- Ample Space and Flexibility: Serviced apartments offer significantly more room than standard hotel accommodations, featuring separate areas for living, dining, and sleeping. This spacious setup provides a home-like atmosphere that enhances guest comfort,
- Personalized Services: These apartments deliver a variety of personalized services, such as housekeeping, concierge support, and amenities, ensuring guests’ unique needs and preferences are met.
- Technological Integration: Equipped with cutting-edge technology, including smart home features and intuitive apps, serviced apartments provide guests with greater convenience and control over their experience.
- Integration with Local Communities: Often situated within or near residential neighbourhoods, serviced apartments allow guests to immerse themselves in the local culture, fostering a sense of belonging and community integration, and,
- Long-term Stay Options: With the growing popularity of remote work and long-term travel, serviced apartments cater to guests seeking longer stays, offering dedicated workspaces and amenities designed for extended comfort and productivity.
Section III: Supply and Distribution of Serviced Apartments in the Nairobi Metropolitan Area
The number of serviced apartments within the Nairobi Metropolitan Area (NMA) has increased by a 7-year CAGR of 3.5% to 7,115 apartments in 2025, from 5,593 apartments in 2019 with Divine residences in Riverside adding more than 200 units to the market. The table below shows the growth in supply of serviced apartments in the Nairobi Metropolitan Area over the last seven years;
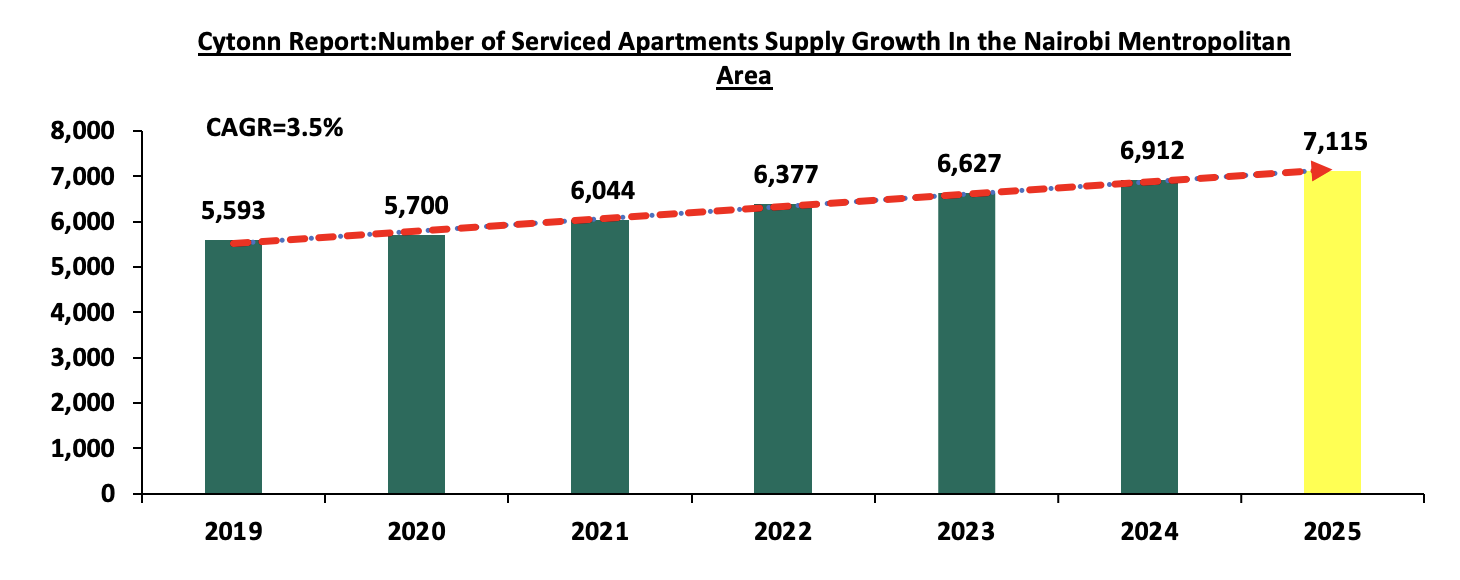
Source: Cytonn Research
In terms of distribution, Westlands and Kilimani have approximately the largest market share of serviced apartments within the Nairobi Metropolitan Area, at 29.4% and 27.6%, respectively attributable to;
- The growing presence of international organizations aiming to strengthen their operations in Africa, such as PricewaterhouseCoopers Kenya Headquarters, United Nations agencies, and various embassies, has resulted in an increasing number of expatriates and a rising demand for serviced apartments. The presence of premium serviced apartments commanding higher rents and rental yields, has instilled confidence among investors in the region,
- Improved infrastructure, including projects like the Nairobi Expressway, enhances connectivity to Jomo Kenyatta International Airport (JKIA) and provides better road networks, making key locations more accessible,
- Premium serviced apartments in the region command higher rents and offer attractive rental yields, fostering greater confidence among investors.
- Vast social amenities, such as shopping centres and well-coordinated delivery service providers, further enhances the convenience and appeal of these areas.
The table provided below illustrates the market share of serviced apartments in the Nairobi Metropolitan Area in 2025;
|
Cytonn Report: Nairobi Metropolitan Area (NMA) Serviced Apartments Market Share 2025 |
|
|
Area |
Percentage Market share |
|
Westlands |
29.4% |
|
Kilimani |
27.6% |
|
Nairobi CBD |
10.4% |
|
Limuru Road |
9.8% |
|
Kileleshwa |
9.8% |
|
Upperhill |
8.0% |
|
Thika road |
4.9% |
|
Total |
100.0% |
Source: Cytonn Research
For the projects in the pipeline, serviced apartments and hotels with serviced apartments’ concepts currently under development in the Nairobi Metropolitan Area currently include;
|
Cytonn Report: NMA Serviced Apartments Projects in the Pipeline 2025 |
|||
|
Name |
Location |
Number of Units |
Estimated Completion Date |
|
DG West Apartments |
Westland’s |
200 |
2026 |
|
Somerset Rosslyn Nairobi |
Runda |
150 |
2026 |
|
Total |
|
350 |
|
Source: Cytonn Research
Section IV: Performance of Serviced Apartments in the Nairobi Metropolitan Area
In the development of the report, the performance of seven nodes within the Nairobi Metropolitan Area was tracked, and compared to the performance in 2024, with emphasis on the following metrics;
- Charged Rates: It is the daily, weekly and monthly rates that are charged to guests for serviced apartments in specific markets. This which form the basis for evaluation of the likely rental income to be received by investors in serviced apartments,
- Occupancy Rates: It measures the number of inhabited apartments as a percentage of the total number of units available. It also guides in determining the expected rental yields for various developments, and,
- Rental Yields: It measures the Real Estate investment return from the annualized collected rental income. It provides investors with an estimate of the returns expected from the property, as well as the time it will take to recover the investment. In the calculation of rental yields, we estimate annual income from monthly revenues and deduct operational costs (assumed as 40.0% of revenues).
In the estimations for the investment value, we have calculated development costs per SQM through factoring in land costs (location-based), costs of construction, equipping costs, professional fees and other costs relating to development. The formula thus used in the calculation rental yields is as follows;
It is important to note that investors will generally incur varying costs depending on the actual land costs incurred, the plot ratios, and the level of finishing and equipping. In analyzing performance, we will start by the node during the year, followed by a comparison with 2024 then the performance by typology will then be covered.
- Serviced Apartments Performance by Node
The average rental yield for serviced apartments within the NMA increased by 0.1% points to 7.4% in 2025 from 7.3% recorded in 2024. Westlands and Limuru Road emerged the best performing nodes, with rental yields of 11.4% and 9.2% respectively, compared to the market average of 7.4%. The performance was attributed to, i) enhanced accessibility through well-developed infrastructure and road networks, making these areas more convenient for residents and visitors, ii) close proximity to Nairobi’s Central Business District (CBD) and other high-end neighborhoods further adds to their appeal and desirability, iii) availability of high-quality serviced apartments in these areas, allowing for premium pricing and attracting high-end clients, iv) proximity to international organizations and embassies, which has significantly boosted demand for serviced apartments due to an influx of expatriates and foreign nationals. On the other hand, Thika Road was the least performing node, with an average yield of 4.5%, 2.9% points lower than the market average of 7.4%. The performance is attributed to, i) low demand for serviced apartments due to their unpopularity, ii) heavy traffic during rush hours due to congestions, which can deter potential tenants who prioritize convenience and ease of movement. The table below highlights the performance of the various nodes within the NMA;
|
NMA Serviced Apartments Performance per Node - 2025 |
|||||||||
|
Node |
Studio |
1 Bed |
2 Bed |
3 bed |
Monthly Charge/ |
Occupancy |
Devt Cost/SQM (Kshs) |
Rental Yield |
|
|
SQM (Kshs) |
|||||||||
|
Westlands |
220,920 |
317,965 |
373,147 |
413,280 |
4,658 |
81.5% |
231,000 |
11.4% |
|
|
Limuru Road |
6,435 |
219,403 |
382,500 |
322,000 |
4,826 |
63.0% |
245,000 |
9.2% |
|
|
Kilimani |
185,531 |
254,945 |
320,378 |
484,784 |
3,410 |
78.2% |
220,000 |
8.6% |
|
|
Kileleshwa & Lavington |
233,800 |
228,667 |
358,851 |
357,000 |
3,304 |
82.7% |
235,000 |
8.3% |
|
|
Nairobi CBD |
195,000 |
187,955 |
265,881 |
567,506 |
3,110 |
66.0% |
250,000 |
4.7% |
|
|
Upperhill |
|
196,370 |
333,071 |
350,000 |
2,342 |
59.5% |
225,500 |
4.6% |
|
|
Thika Road |
|
104,200 |
1,965 |
1,284 |
1,915 |
92.1% |
231,000 |
4.5% |
|
|
Average |
168,337 |
215,643 |
290,828 |
356,551 |
3,366 |
74.7% |
233,929 |
7.4% |
|
Source: Cytonn Research
- Comparative Analysis - 2024/2025 Market Performance
The performance of the serviced apartments improved on y/y, with the occupancy rates coming in at 74.7% in 2025, a 2.5%-points increase from the 72.2% recorded in 2024. The improvement in performance can be attributed to increase in the number of arrivals to 745,720 reflecting a 52.2% increase compared to 489,831 arrivals in Q3’2024 boosting the occupancy in the serviced apartments. The average monthly charges for 2025 increased by 6.7% to Kshs 3,366 per SQM from 3,155 recorded in 2024. This was attributed to increased demand for serviced apartments in Westlands and Limuru nodes. Consequently, the average rental yield increased to 7.4% in 2025, 0.1% points increase from the 7.3% recorded in 2024. The improvement in performance was primarily on the back of; i) Increase in the number of visitors arriving in the country compared to a similar period in 2024, ii) The country effecting a Visa free policy at the start of the year for all visitors in a bid to boost number of arrivals in the country, iii) continued recovery of the Kenyan hospitality sector, iv) the intensive marketing of Kenya’s tourism market through platforms such as the Magical Kenya platform and various, v) Guests preference to stay within the city for extended periods. The table below shows the comparative analysis between 2024 and 2025;
|
All values in Kshs unless stated otherwise |
|||||||||
|
Comparative Analysis-2024/2025 Market Performance |
|||||||||
|
Node |
Monthly Charge/SQM 2024 |
Occupancy 2024 |
Rental Yield 2024 |
Monthly Charge/SQM 2025 |
Occupancy 2025 |
Rental Yield 2025 |
Change in Monthly Charges/SQM |
Change in Occupancy |
Change in Rental Yield |
|
Westlands |
4,148 |
77.1% |
11.0% |
4,658 |
81.5% |
11.4% |
12.3% |
4.4% |
0.4% |
|
Limuru Road |
4,768 |
62.6% |
9.1% |
4,826 |
63.0% |
9.2% |
1.2% |
0.4% |
0.1% |
|
Kilimani |
3,269 |
70.2% |
8.8% |
3,410 |
78.2% |
8.6% |
4.3% |
8.0% |
(0.2%) |
|
Kileleshwa & Lavington |
3,109 |
75.8% |
7.6% |
3,304 |
82.7% |
8.3% |
6.3% |
6.9% |
0.7% |
|
Nairobi CBD |
2,753 |
64.1% |
3.9% |
3,110 |
66.0% |
4.7% |
13.0% |
1.9% |
0.8% |
|
Upperhill |
2,339 |
66.7% |
5.4% |
2,342 |
59.5% |
4.6% |
0.1% |
(7.2%) |
(0.8%) |
|
Thika Road |
1,698 |
89.1% |
5.3% |
1,915 |
92.1% |
4.5% |
12.8% |
3.0% |
(0.8%) |
|
Average |
3,155 |
72.2% |
7.3% |
3,366 |
74.7% |
7.4% |
7.1% |
2.5% |
0.1% |
Source:Cytonn Research
Section V: Recommendations and Outlook
Having looked at the various factors driving the hospitality industry and with a particular focus on the serviced apartments sector, including challenges and current performance, we conclude with a recommendation of existing investment opportunities in the sector, and outlook as depicted below;
|
|
Cytonn Report: Serviced Apartments Sector Outlook 2026 |
|
|
Measure |
Sentiment |
Outlook |
|
Serviced Apartments Performance |
· The average rental yield for serviced apartments within the NMA increased by 0.1% points to 7.4% in 2025 from 7.3% recorded in 2024. The occupancy rates came in at 74.7% in 2025, a 2.5%-points increase from the 72.2% recorded in 2024. The average monthly charges for 2025 increased by 6.7% to Kshs 3,366 per SQM from 3,155 recorded in 2024 · Our outlook for the sector is positive, as we expect that performance will be supported by increased tourist arrivals into the country and the continued positive performance of the overall Kenyan hospitality industry. Additionally, Nairobi’s growing popularity as a leading business travel destination, alongside the above factors will propel the sector’s performance on an upward trajectory · However, we anticipate that the current increasing operational costs will weigh down optimum performance of the sector. |
Neutral |
|
International Tourism |
· In terms of international arrivals, Kenya National Bureau of Statistics’ Leading Economic Indicators – September 2025 report highlighted that the number of arrivals was 745,720 reflecting a 35.1% increase from 552,108 arrivals recorded in Q2’2025. On a year-on-year basis, this represented a 52.2% increase compared to 489,831 arrivals in Q3’2024. The improved performance can be attributed to several factors; i) recovery globally in the tourism industry coupled with a strong marketing campaign, ii) visa openness following the introduction of the Electronic Tourist Authorization (eTA) at the beginning of the year, iii) improvements in air connectivity through introduction of new routes and more frequencies by major airlines and the introduction of direct flights by three new airlines—IndiGo (Mumbai-Nairobi), Fly Dubai (Dubai-Mombasa), and Airlink (Johannesburg-Nairobi), iv) the creation of specialized tourism offerings such as cruise, adventure, cultural, and sports tourism, and, v) expanded global promotion of Kenya's tourism by the Ministry of Tourism and the Kenya Tourism Board using platforms like Magical Kenya. The chart below shows the number of international arrivals in Kenya between Q1’2023 and Q3’2025; · While the sector demonstrated resilience in its overall performance in 2025, the outlook remains cautiously optimistic. Kenya continues to face significant competition from neighboring markets, such as Rwanda, which employs aggressive promotional strategies, alongside Zanzibar, Tanzania, and South Africa. These regions actively position themselves as attractive alternatives, challenging Kenya's market share in the region. |
Neutral |
|
Supply |
· The number of serviced apartments within the Nairobi Metropolitan Area (NMA) has increased by a 7-year CAGR of 3.5% to 7,115 apartments in 2025, from 5,593 apartments in 2019 with Divine residences in Riverside adding more than 200 units to the market · In addition, the Nairobi Metropolitan Area has several developments in the pipeline. The upcoming developments are positioned to boost the existing supply. · Furthermore, the year-on-year (y/y) gross loans advanced to the Real Estate sector increased by 1.0% to Kshs 507.0 bn, from Kshs 502.0 bn in Q2’2024. |
Positive |
Given that majority of our key metrics are neutral, we have a NEUTRAL overall outlook for the serviced apartments sector. The Investment opportunity lies in Westlands, Limuru Road, Kilimani, and Kileleshwa-Lavington which performed the best among all the nodes, with rental yields of 11.1%, 9.2%, 8.6% and 8.3% respectively, compared to the market average of 7.4%.
Disclaimer: The views expressed in this publication are those of the writers where particulars are not warranted. This publication, which is in compliance with Section 2 of the Capital Markets Authority Act Cap 485A, is meant for general information only and is not a warranty, representation, advice or solicitation of any nature. Readers are advised in all circumstances to seek the advice of a registered investment advisor.

- Talk to us
- Kenya
- P.O Box 20695 - 00200, Nairobi, Kenya
- Cell +254709101200
- Tel +254709101200
- WhatsApp +254741676635
- United States
- +254709101200
- DOWNLOAD OUR APP
-


- Kenya
- 8th Floor, Pinetree Plaza, Kaburu Drive, Ngong Road, Nairobi, Kenya
- USA
- Suite 1150, 1775 Eye Street NW, USA, Washington DC 20006, USA
- Investments
- High Yield
- Private Equity
- Real Estate
- Real Estate
- RiverRun Estates
- Cytonn Towers
- The Ridge
- Taraji Heights
- The Alma