
Nairobi Metropolitan Area (NMA) Industrial Report 2026, & Cytonn Weekly #42.2026
By Research Team, Oct 25, 2026
Executive Summary
Fixed Income
During the week, T-bills were oversubscribed for the twelfth consecutive week, with the overall subscription rate coming in at 103.0% lower than the subscription rate of 244.6% recorded the previous week. Investors’ preference for the shorter 91-day paper persisted, with the paper receiving bids worth Kshs 14.3 bn against the offered Kshs 8.0 bn, translating to a subscription rate of 179.2% significantly lower than the subscription rate of 622.5%, recorded the previous week. The subscription rate for the 182-day paper decreased to 76.9% from 120.6% recorded the previous week, while that of the 364-day paper increased to 68.0% from 66.4% recorded the previous week. The government accepted a total of Kshs 28.79 bn worth of bids out of Kshs 28.83 bn bids received, translating to an acceptance rate of 99.9%. The yields on the government papers were on a downward trajectory with the yields on the 364-day paper decreasing by 1.2 bps to 9.03% from the 9.04% recorded the previous week. The yields on the 91-day paper decreased by 0.2bps to remain relatively unchanged at 8.75% recorded the previous week. The yield on the 182-day paper decreased by 0.1 bps to 8.86% from 8.87% recorded the previous week.
During the week, the government announced a prospectus for the re-opening of two Treasury bonds, FXD3/2019/015 and FXD1/2026/030, seeking to raise Kshs 50.0 bn for budgetary support through a multi-price bid auction. The 15-year bond, FXD3/2019/015, carries a fixed coupon rate of 12.3% and a remaining tenor to maturity of 7.8 years, while the 30-year bond, FXD1/2026/030, carries a fixed coupon rate of 12.5% and a remaining tenor to maturity of 29.5 years. The offer period opened on 23rd October 2026 and closes on 4th November 2026, with the auction and settlement dates set for 4th and 9th November 2026, respectively. Our recommended bidding ranges are 12.5%-13.0% for FXD3/2019/015 and 13.8%-14.4% for FXD1/2026/030.
During the week, The National Treasury gazetted the revenue and net expenditures for the third month of FY’2026/2027, ending 30th September 2026, highlighting that the total revenue collected as at the end of September 2026 amounted to Kshs 685.4 bn, equivalent to 23.0 % of the original estimates of Kshs 2,985.7 bn for FY’2026/2027 and is 91.8% of the prorated estimates of Kshs 746.4 bn.
On October 2026 inflation projection, we project Kenya’s year-on-year inflation for October 2026 to edge up to 6.6%-6.9%;
Equities
During the week, the equities market was on a downward trajectory, with the NSE 20, NSE 10, NSE 25, and NASI declining by 3.6%, 2.8%, 2.3%, and 1.7% respectively, taking their YTD performance to gains of 33.0%, 30.8%, 29.7%, and 25.4% respectively for NSE 20, NSE 10, NSE 25 and NASI respectively. The week-on-week equities market performance was mainly driven by losses recorded by large-cap stocks such as EABL, KCB, and Safaricom of 5.7%, 4.7%, and 4.6% respectively. The performance was however supported by gains recorded by large-cap stocks such as NCBA, and Co-operative of 2.3% and 0.7% respectively;
During the week, the banking sector index decreased by 2.3% to 276.4 from the 282.9 recorded the previous week. This is attributable to losses recorded by large cap stocks such as KCB, ABSA and Equity of 4.7%, 4.1%, and 2.5% respectively. The performance was however supported by gains recorded by large-cap stocks such as NCBA and Co-op of 2.3% and 0.7% respectively;
During the week, equities turnover increased by 1333.7% to USD 350.8 mn from USD 24.5 mn recorded the previous week, taking the YTD total turnover to USD 3,443.4 mn. Foreign investors remained net sellers with a net selling position of USD 9.45 mn, from a net selling position of USD 9.46 mn recorded the previous week, taking the YTD foreign net selling position to USD 190.7 mn, compared to a net selling position of USD 92.9 mn recorded in 2025;
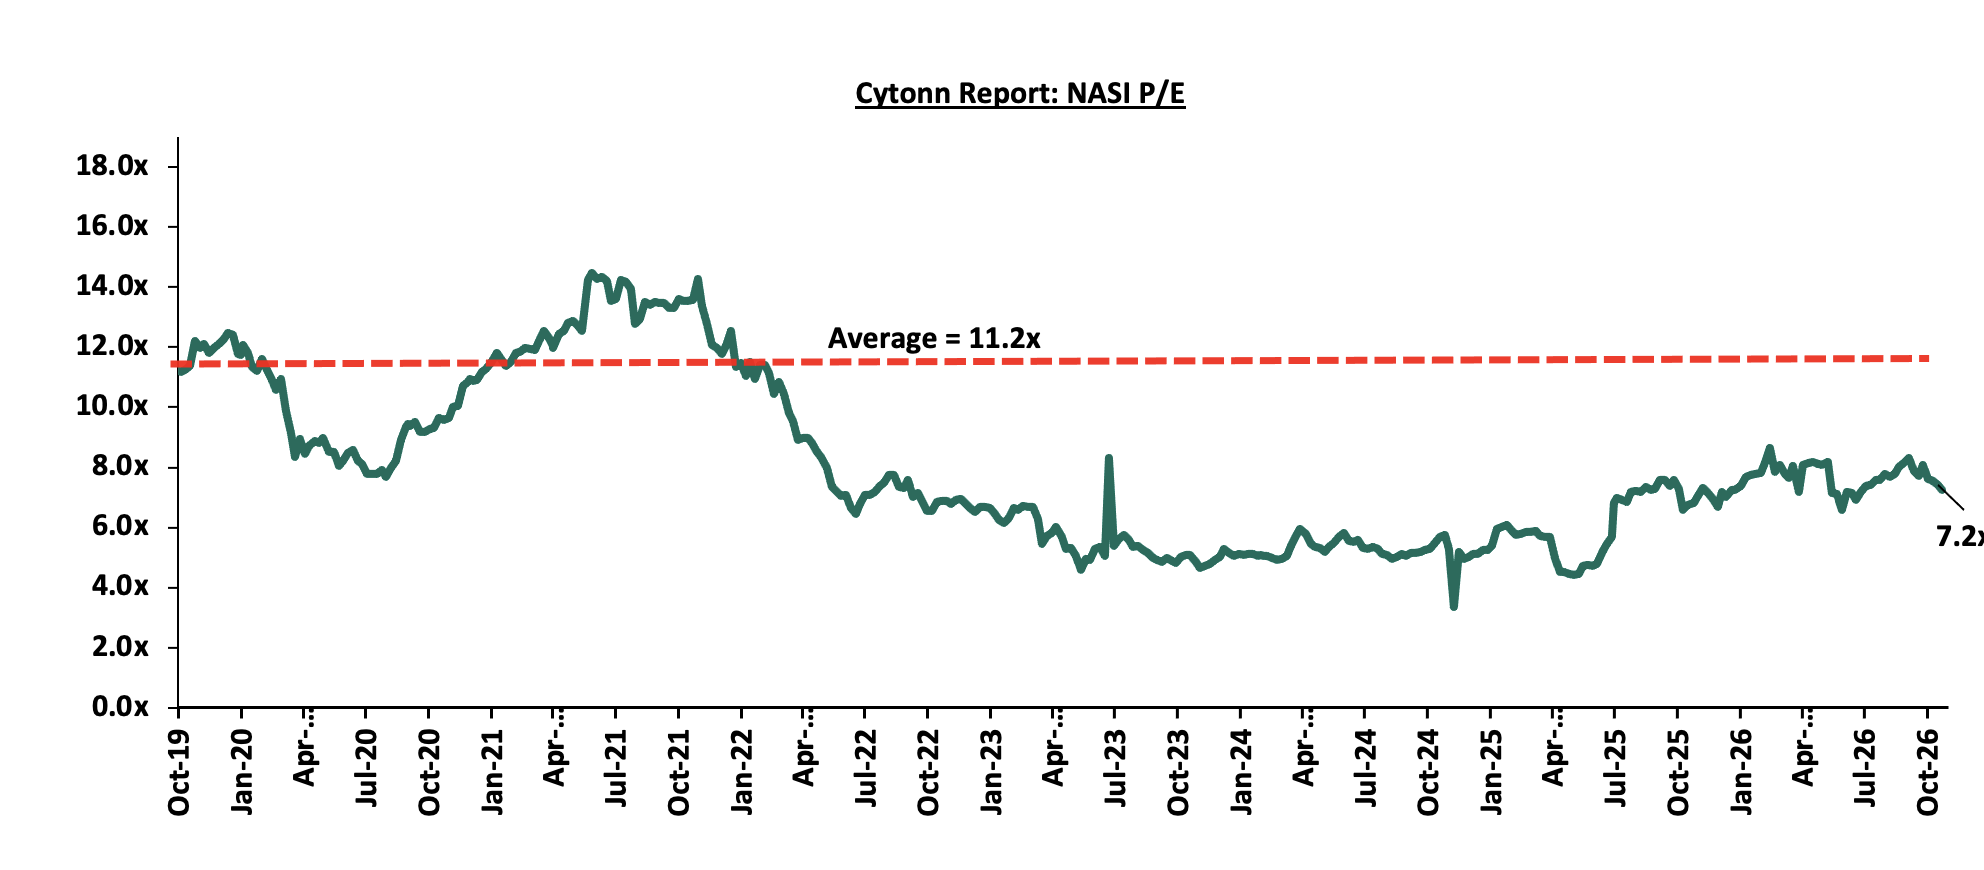
The market is currently trading at a price to earnings ratio (P/E) of 7.2x, 35.2% below the historical average of 11.2x, and a dividend yield of 6.1%, 1.3% points above the historical average of 4.8%. Key to note, NASI’s PEG ratio currently stands at 0.9x, an indication that the market is slightly undervalued relative to its future growth. A PEG ratio greater than 1.0x indicates the market may be overvalued while a PEG ratio less than 1.0x indicates that the market is undervalued;
Real Estate
During the week, , the Kenya National Bureau of Statistics (KNBS) released the Leading Economic Indicators (LEI) August 2026 Report, which highlighted the performance of major economic indicators;
During the week, the President announced plans to scrap stamp duty on land and property transactions valued at Kshs1.0 mn or below, to be offset by a progressive duty structure that shifts more of the tax burden onto higher-value transactions. The proposal is still being finalized before going to Parliament.
During the week, KNBS recorded air travel between Kenya and the Middle East staged a strong rebound in Q3,2026, even as regional conflict persists
On the Unquoted Securities Platform Acorn D-REIT and I-REIT traded at Kshs 29.7 and Kshs 24.4 per unit, respectively, as per the last updated data on 16th October 2026. The performance represented a 48.5% and 22.0% gain for the D-REIT and I-REIT, respectively, from the Kshs 20.0 inception price. The volumes traded for the D-REIT and I-REIT came in at 13.7 mn and 46.0 mn shares, respectively. Additionally, ILAM Fahari I-REIT traded at Kshs 13.8 per share as of 16th October 2026, representing a 31.0% loss from the Kshs 20.0 inception price. The volume traded came in at 1.2 mn shares;
Digital Payments
During the week, Visa announced three enhanced commercial payment capabilities: SESA 2.0, which uses AI-driven analytics to identify supplier card-payment opportunities; Visa Commercial Fraud Solutions, which strengthens supplier verification, virtual-card authentication and transaction-level spending controls; and a live pilot with BILL and Billtrust enabling authorized AI agents to complete buyer-approved invoice payments through supplier portals using tokenized credentials;
During the week, Mastercard announced Stablecoin Security, a risk intelligence solution developed with Borderless. xyz and Keyrails to help financial institutions detect fraud, scams, sanctions exposure and other financial-crime risks across stablecoin payments. The platform combines payment intelligence and blockchain analytics to generate pre-transaction risk scores and integrate with existing compliance and fraud-management systems;
During the week, American Express introduced its Amex Business Playbook for Agentic Commerce, providing research-backed insights and practical guidance to help merchants prepare for AI-driven product discovery and purchasing. The initiative addresses opportunities for businesses to attract customers through AI-powered searches while maintaining customer relationships and integrating emerging technologies;
During the week, Block announced it had joined the Open Secure AI Alliance, hosted by the Linux Foundation and comprising over 120 companies, including NVIDIA, Amazon, Microsoft, Intel and Visa, to promote open and secure AI development. The move builds on Block’s use of AI in fraud detection, loan underwriting and business operations, including Money Bot, which serves over 1.0 mn Cash App users, and Manager Bot, which automates sellers’ marketing and operational tasks;
The digital payment stocks we track (AXP, Visa, Mastercard, Circle, Block, and PayPal) are currently trading at an average forward P/E of 26.0x, implying that investors continue to price in resilient earnings growth and strong digital payment adoption, although elevated operating costs and higher client incentives across legacy card networks may moderate valuation expansion in the near term;
Focus of the Week
Industrial real estate in the Nairobi Metropolitan Area (NMA) recorded mixed performance, with core nodes continuing to command higher rents and selling prices than emerging locations. Industrial Area was the best-performing node, recording average rents of Kshs 561 per sqm per month and selling prices of Kshs 90,568 per sqm representing 0.5% and 0.1% increase from 2025 respectively, while Mlolongo recorded the lowest performance, with rents of Kshs 265 per sqm per month despite being a 0.8% increase from Kshs 263 per sqm in 2025. The sector continues to benefit from demand for modern warehouses, manufacturing facilities and specialized industrial space, supported by infrastructure development, e-commerce, regional trade and government initiatives through Special Economic Zones (SEZs) and Export Processing Zones (EPZs). Investment opportunities exist in established nodes with proven occupier demand and emerging locations offering potential for future growth, although high development costs, infrastructure gaps and power reliability remain key constraints. The performance is expected to depend on the ability of developers to deliver quality facilities at competitive costs and investors to identify locations with sustainable occupancy and attractive rental yields;
Investment Updates:
-
Weekly Rates: Cytonn Money Market Fund closed the week at a yield of 11.01% p.a. To invest, dial *809# or download the Cytonn App from Google Play store here or from the Appstore here;
-
We continue to offer Wealth Management Training every Tuesday, from 7:00 pm to 8:00 pm. The training aims to grow financial literacy among the general public. To register for any of our Wealth Management Trainings, click here; If interested in our Private Wealth Management Training for your employees or investment group, please get in touch with us through wmt@cytonn.com;
-
Cytonn Asset Managers Limited (CAML) continues to offer pension products to meet the needs of both individual clients who want to save for their retirement during their working years and Institutional clients that want to contribute on behalf of their employees to help them build their retirement pot. To more about our pension schemes, kindly get in touch with us through pensions@cytonn.com;
Hospitality Updates:
-
We currently have promotions for Staycations. Visit cysuites.com/offers for details or email us at sales@cysuites.com;
Money Markets, T-Bills Primary Auction:
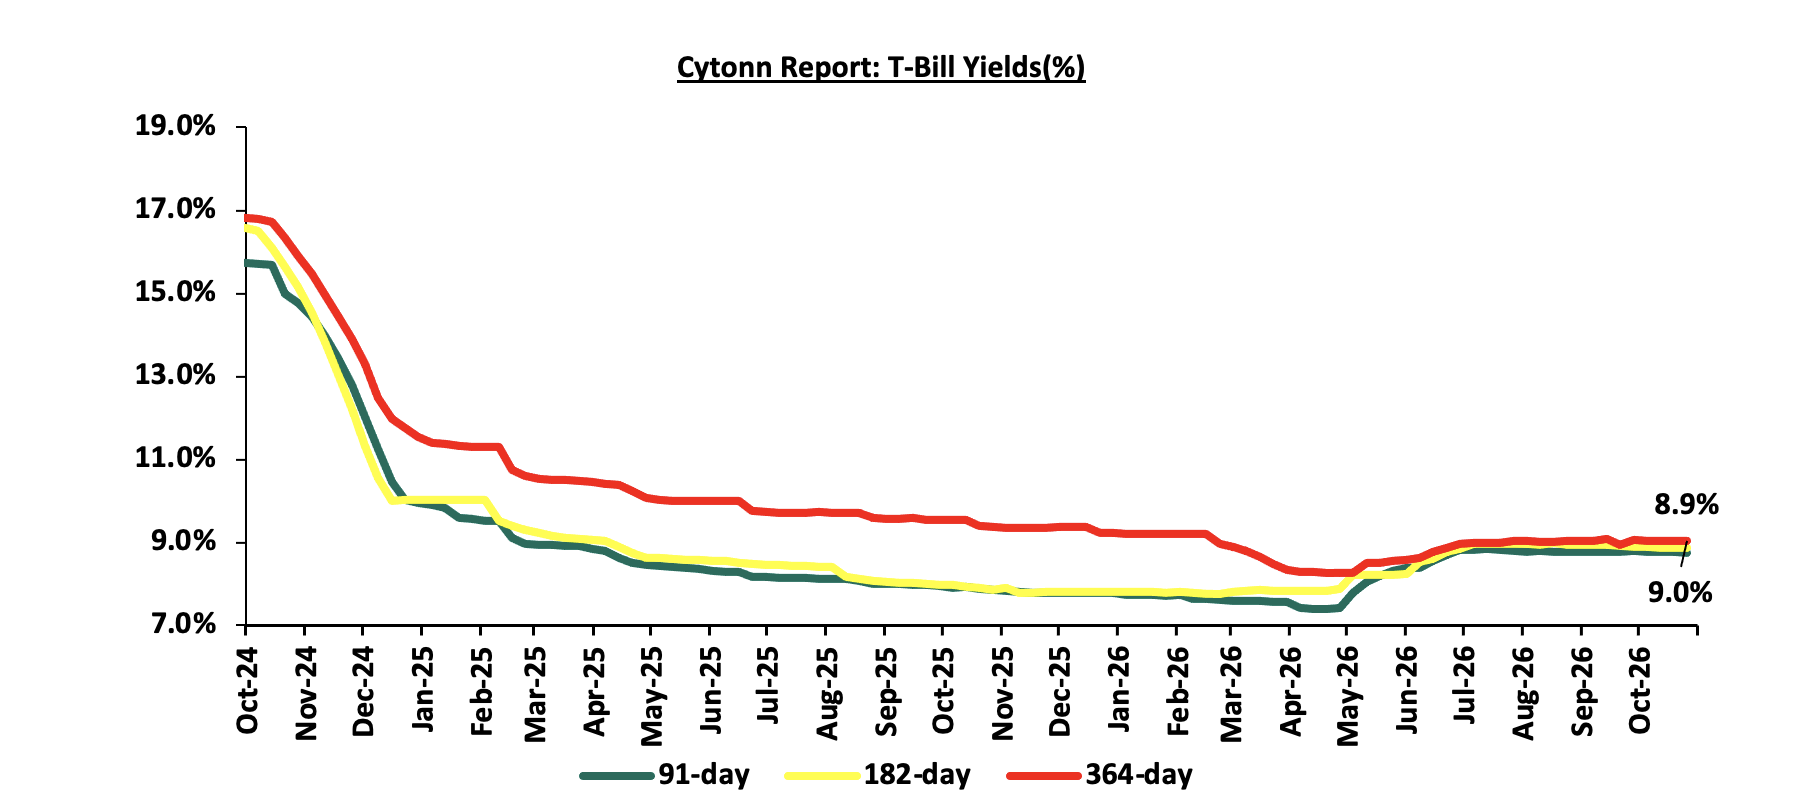
This week, T-bills were oversubscribed for the twelfth consecutive week, with the overall subscription rate coming in at 103.0% lower than the subscription rate of 244.6% recorded the previous week. Investors’ preference for the shorter 91-day paper persisted, with the paper receiving bids worth Kshs 14.3 bn against the offered Kshs 8.0 bn, translating to a subscription rate of 179.2% significantly lower than the subscription rate of 622.5%, recorded the previous week. The subscription rate for the 182-day paper decreased to 76.9% from 120.6% recorded the previous week, while that of the 364-day paper increased to 68.0% from 66.4% recorded the previous week. The government accepted a total of Kshs 28.79 bn worth of bids out of Kshs 28.83 bn bids received, translating to an acceptance rate of 99.9%. The yields on the government papers were on a downward trajectory with the yields on the 364-day paper decreasing by 1.2 bps to 9.03% from the 9.04% recorded the previous week. The yields on the 91-day paper decreased by 0.2bps to remain relatively unchanged at 8.75% recorded the previous week. The yield on the 182-day paper decreased by 0.1 bps to 8.86% from 8.87% recorded the previous week.
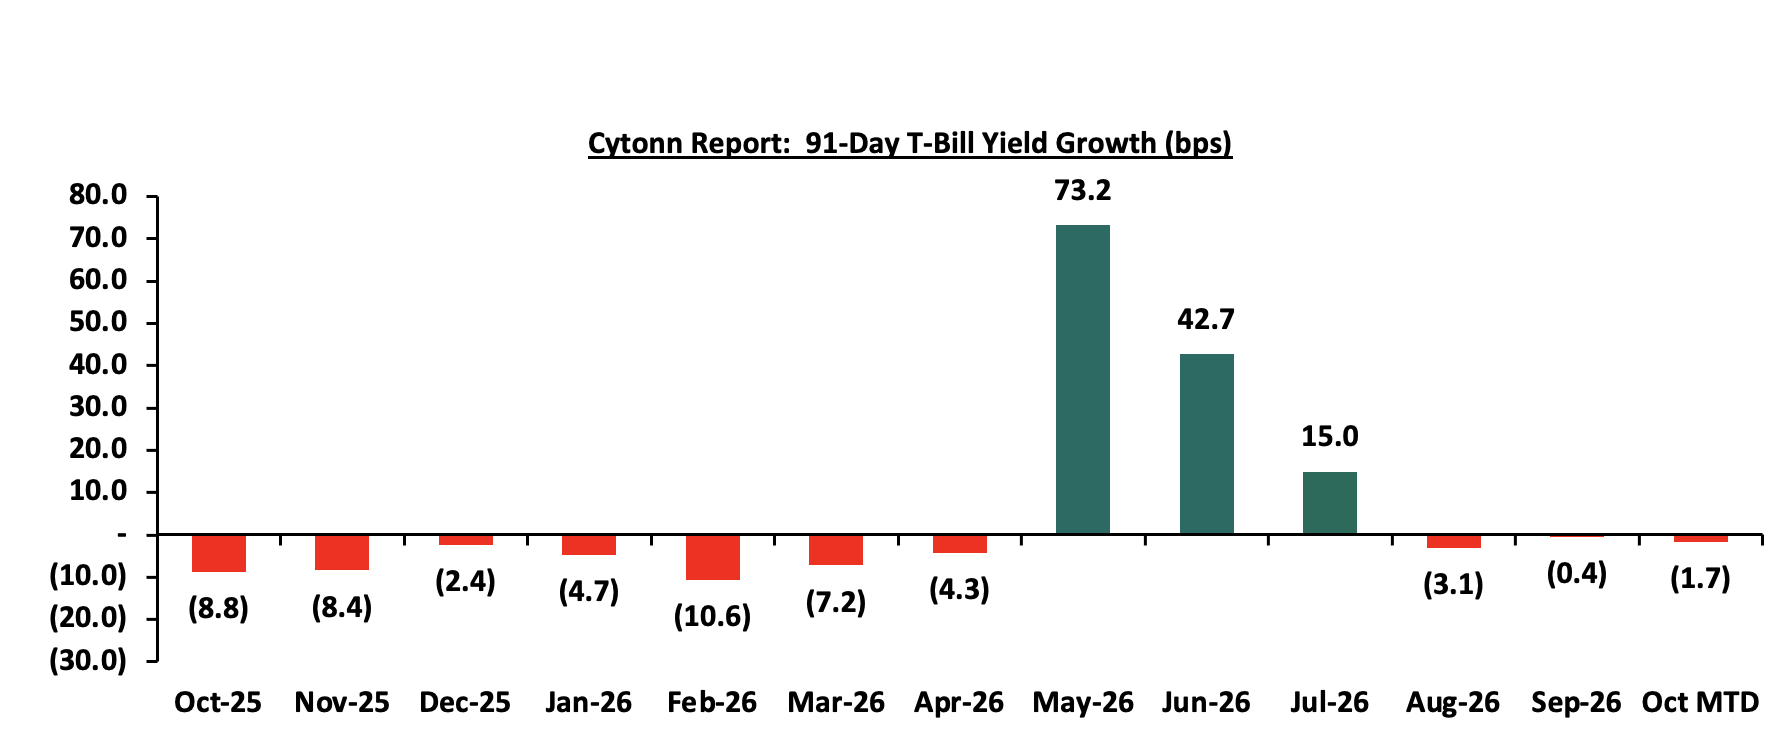
The chart below shows the yield growth rate for the 91-day paper from October 2025 to date:
The chart below shows the performance of the 91-day, 182-day and 364-day papers from October 2024 to October 2026:
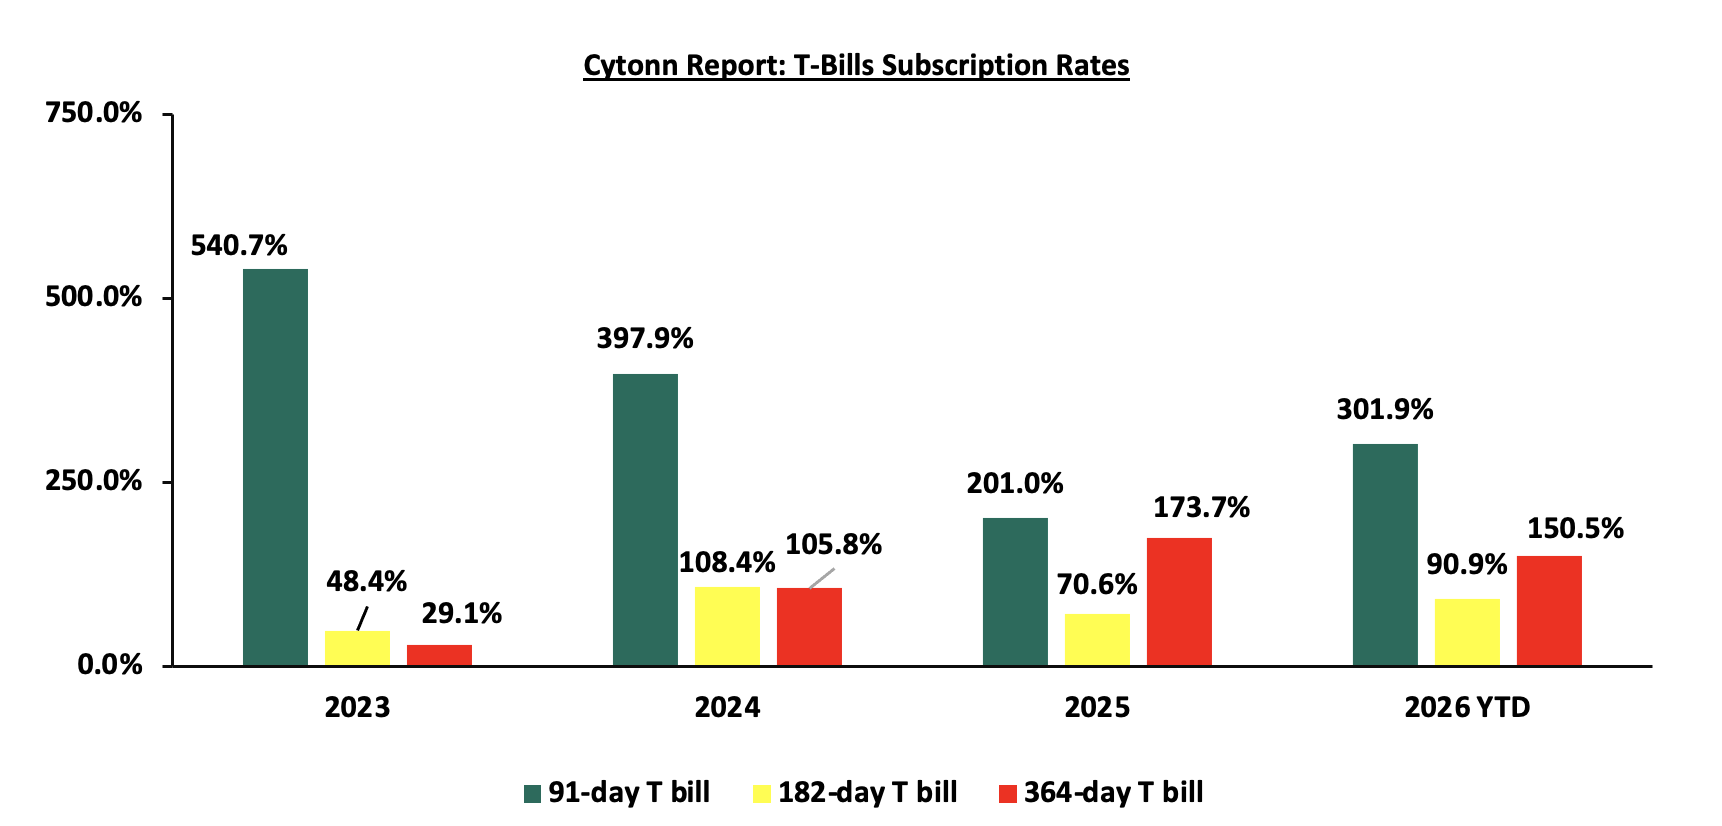
The chart below compares the overall average T-bill subscription rates obtained in 2023, 2024, 2025 and 2026 Year-to-date (YTD):
T-Bonds Primary Auction:
During the week, the government announced a prospectus for the re-opening of two Treasury bonds, FXD3/2019/015 and FXD1/2026/030, seeking to raise Kshs 50.0 bn for budgetary support through a multi-price bid auction. The 15-year bond, FXD3/2019/015, carries a fixed coupon rate of 12.3% and a remaining tenor to maturity of 7.8 years, while the 30-year bond, FXD1/2026/030, carries a fixed coupon rate of 12.5% and a remaining tenor to maturity of 29.5 years. The offer period opened on 23rd October 2026 and closes on 4th November 2026, with the auction and settlement dates set for 4th and 9th November 2026, respectively. Our recommended bidding ranges are 12.5%-13.0% for FXD3/2019/015 and 13.8%-14.4% for FXD1/2026/030.
Money Market Performance:
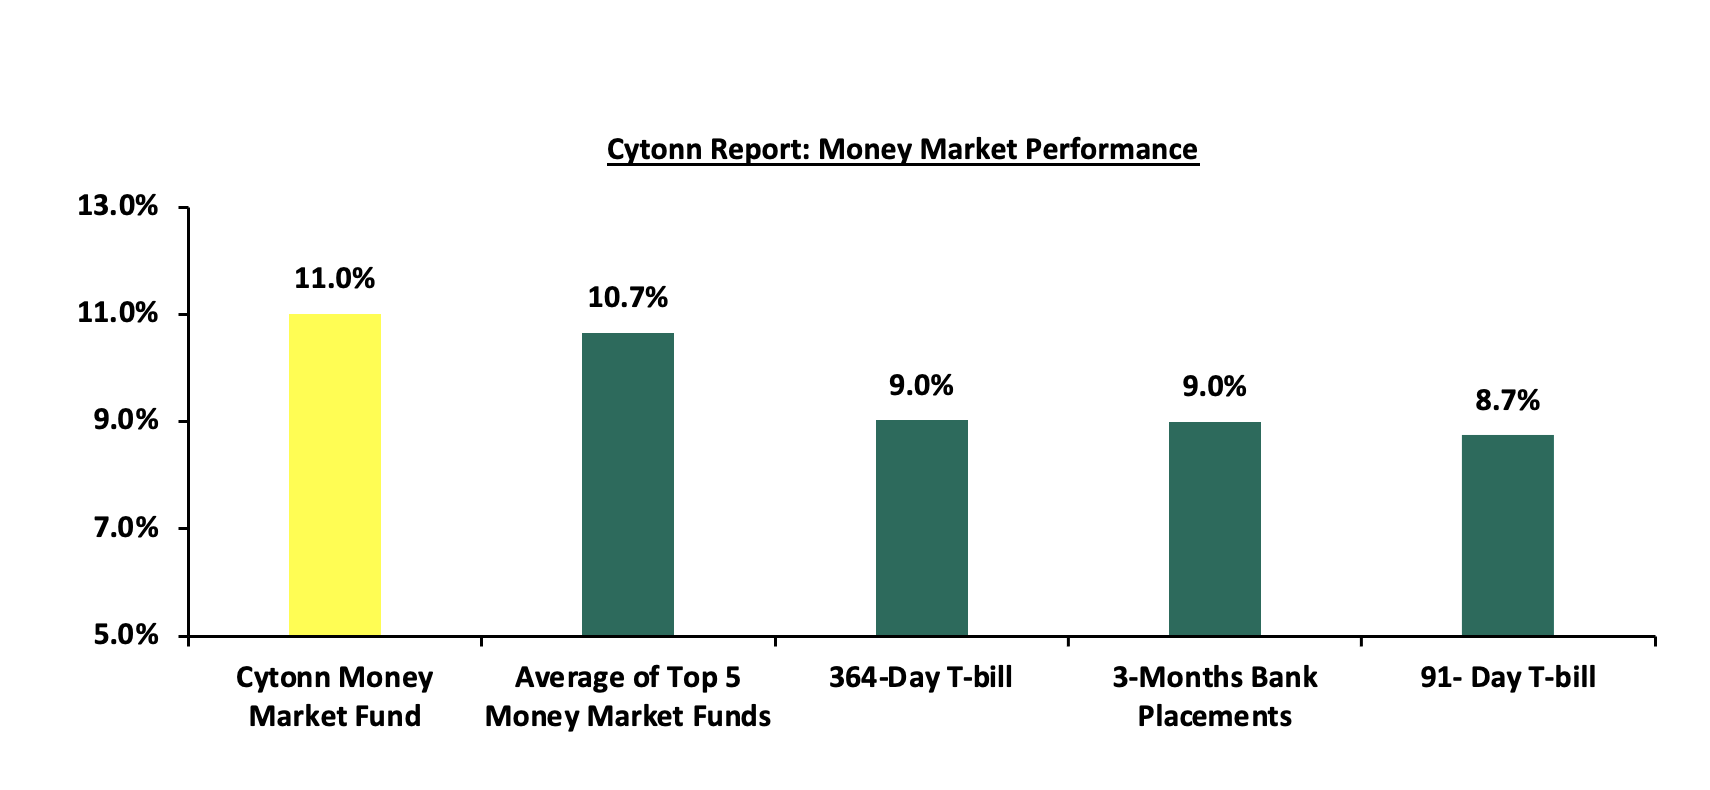
In the money markets, 3-month bank placements ended the week at 9.0% (based on rates offered by various banks). The yields on the government papers were on a downward trajectory with the yields on the 364-day paper decreasing by 1.2 bps to 9.03% from the 9.04% recorded the previous week. The yields on the 91-day paper decreased by 0.2bps to remain relatively unchanged at 8.75% recorded the previous week. The yield on the 182-day paper decreased by 0.1 bps to 8.86% from 8.87% recorded the previous week. The yield on the Cytonn Money Market Fund remained relatively unchanged from the 11.01% recorded the previous week, while the average yields on Top 5 Money Market Funds decreased by 0.6 bps to remain relatively unchanged from the 10.7% recorded the previous week.
The table below shows the Money Market Fund Yields for Kenyan Fund Managers as published on 23rd October 2026
|
Money Market Fund Yield for Fund Managers as published on 23rd October 2026 |
||
|
Rank |
Fund Manager |
Effective Annual Rate |
|
1 |
Cytonn Money Market Fund (Dial *809# or download Cytonn App) |
11.0% |
|
2 |
Faulu Money Market Fund |
10.8% |
|
3 |
Lofty-Corban Money Market Fund |
10.6% |
|
4 |
Ndovu Money Market Fund |
10.5% |
|
5 |
Madison Money Market Fund |
10.4% |
|
6 |
Orient Kasha Money Market Fund |
10.4% |
|
7 |
Enwealth Money Market Fund |
10.4% |
|
8 |
Nabo Africa Money Market Fund |
10.4% |
|
9 |
Kuza Money Market fund |
10.4% |
|
10 |
Old Mutual Money Market Fund |
10.3% |
|
11 |
Rejesha Money Market Fund |
10.3% |
|
12 |
GenAfrica Money Market Fund |
10.3% |
|
13 |
Jubilee Money Market Fund |
10.2% |
|
14 |
Etica Money Market Fund |
10.1% |
|
15 |
Gulfcap Money Market Fund |
10.1% |
|
16 |
Arvocap Money Market Fund |
10.1% |
|
17 |
British-American Money Market Fund |
9.7% |
|
18 |
Apollo Money Market Fund |
9.6% |
|
19 |
Globetec Money Market Fund |
9.6% |
|
20 |
SanlamAllianz Money Market Fund |
9.5% |
|
21 |
KCB Money Market Fund |
9.4% |
|
22 |
Dry Associates Money Market Fund |
9.2% |
|
23 |
Genghis Money Market Fund |
8.8% |
|
24 |
CPF Money Market Fund |
8.6% |
|
25 |
CIC Money Market Fund |
8.4% |
|
26 |
Mayfair Money Market Fund |
8.3% |
|
27 |
Co-op Money Market Fund |
8.1% |
|
28 |
Mali Money Market Fund |
8.0% |
|
29 |
ICEA Lion Money Market Fund |
7.9% |
|
30 |
AA Kenya Shillings Fund |
7.6% |
|
31 |
Absa Shilling Money Market Fund |
7.2% |
|
32 |
Ziidi Money Market Fund |
6.1% |
|
33 |
Equity Money Market Fund |
5.5% |
|
34 |
Stanbic Money Market Fund |
5.4% |
Source: Business Daily
Liquidity:
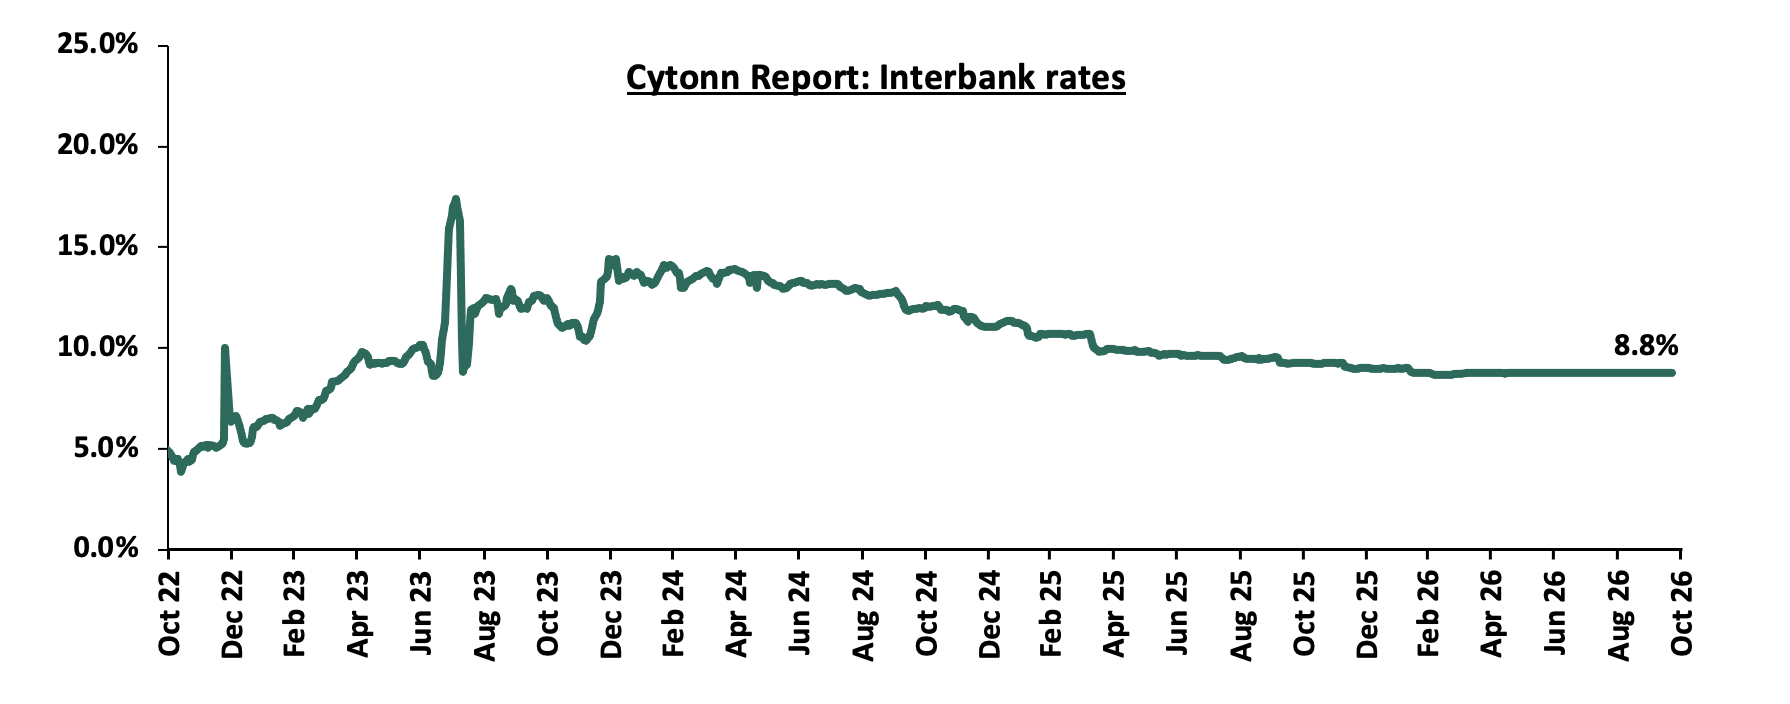
During the week, liquidity in the money markets eased with the average interbank rate decreasing marginally by 0.03 bps to remain relatively unchanged at 8.8% recorded the previous week, partly attributable government payments that offset tax remittances. The average interbank volumes traded increased by 33.1% to Kshs 19.8 bn from Kshs 14.9 bn recorded the previous week. The chart below shows the interbank rates in the market over the years:
Kenya Eurobonds:
During the week, the yields on the Eurobonds were on an upward trajectory with the yields on the 13 -year 2021 issue increasing the most by 38.6 bps to 9.6% from 9.2% recorded the previous week. The table below shows the summary performance of the Kenyan Eurobonds as of 23rd October 2026:
|
Cytonn Report: Kenya Eurobonds Performance |
||||||
|
|
2018 |
2019 |
2021 |
2024 |
||
|
Tenor |
10-year issue |
30-year issue |
12-year issue |
13-year issue |
7-year issue |
|
|
Amount Issued (USD) |
1.0 bn |
1.0 bn |
1.0 bn |
1.5 bn |
1.5 bn |
|
|
Years to Maturity |
2.5 |
22.5 |
8.8 |
5.5 |
10.5 |
|
|
Yields at Issue |
7.3% |
8.3% |
6.2% |
10.4% |
9.9% |
|
|
2-Jan-26 |
6.1% |
8.8% |
7.2% |
7.8% |
7.1% |
|
|
1-Oct-26 |
7.6% |
9.8% |
8.8% |
9.2% |
8.3% |
|
|
15-Oct-26 |
7.3% |
9.9% |
8.7% |
9.2% |
8.0% |
|
|
16-Oct-26 |
7.2% |
10.0% |
8.7% |
9.2% |
9.9% |
|
|
19-Oct-26 |
7.5% |
10.2% |
8.9% |
9.5% |
10.0% |
|
|
20-Oct-26 |
7.5% |
10.3% |
9.1% |
9.6% |
9.9% |
|
|
21-Oct-26 |
7.4% |
10.1% |
8.9% |
9.5% |
10.0% |
|
|
22-Oct-26 |
7.4% |
10.2% |
9.0% |
9.6% |
8.2% |
|
|
Weekly Change |
0.1% |
0.3% |
0.3% |
0.4% |
0.3% |
|
|
MTD Change |
(0.2%) |
0.4% |
0.3% |
0.4% |
(0.1%) |
|
|
YTD Change |
1.3% |
1.4% |
1.8% |
1.8% |
1.1% |
|
Source: Central Bank of Kenya (CBK) and National Treasury
Kenya Shilling:
During the week, the Kenya Shilling remained unchanged against the US Dollar at 129.9 recorded the previous week. On a year-to-date basis, the shilling has depreciated by 65.1 bps against the dollar, as compared to the 22.9 bps appreciation recorded in 2025.
We expect the shilling to be supported by:
-
Diaspora remittances standing at a cumulative USD 5,031.5 mn in the twelve months to September 2026, slightly lower than the USD 5,080.5 mn recorded over the same period in 2025. These have continued to cushion the shilling against further depreciation. In the September 2026 diaspora remittances figures, North America remained the largest source of remittances to Kenya accounting for 49.1% in the period,
-
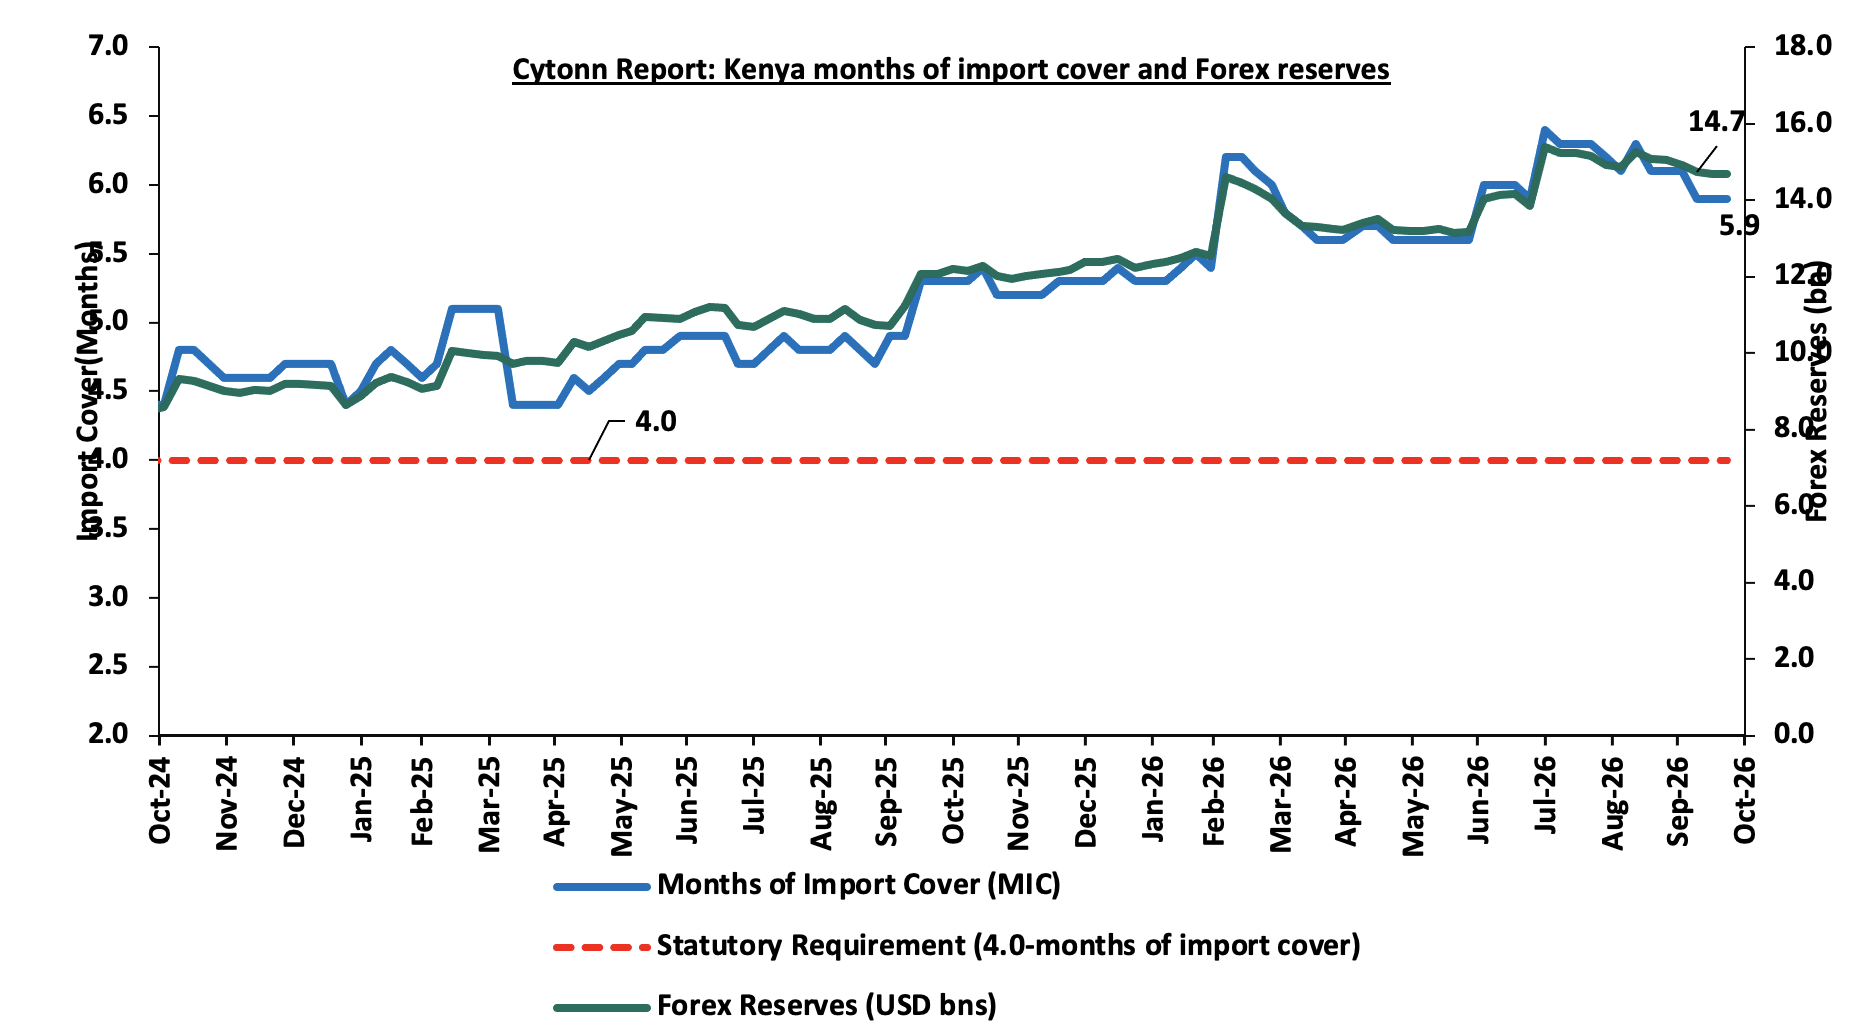
Improved forex reserves currently at USD 14.7 bn (equivalent to 5.9-months of import cover), which is above the statutory requirement of maintaining at least 4.0-months of import cover and above the EAC region’s convergence criteria of 4.5-months of import cover.
The shilling is however expected to remain under pressure in 2026 as a result of:
-
An ever-present current account deficit which widened to 3.1% of GDP in the 12 months to August 2026 compared to 2.1% of GDP in a similar period in 2025 and,
-
The need for government debt servicing, continues to put pressure on forex reserves given that 54.7% of Kenya’s external debt is US Dollar-denominated as of July 2026.
-
Rising geopolitical tensions in the Middle East, which could exert pressure on the shilling through higher global oil prices and increased uncertainty in international markets. Given that Kenya is a net importer of petroleum products, any sustained increase in oil prices would widen the import bill, increase demand for US Dollars, and consequently put depreciation pressure on the shilling
Kenya's forex reserves increased marginally by 0.03% during the week to remain relatively unchanged from the USD 14.7 bn recorded the previous week, equivalent to 5.9 months of import cover, and above the statutory requirement of maintaining at least 4.0-months of import cover. The chart below summarizes the evolution of Kenya's months of import cover over from October 2024 to October 2026:
Weekly Highlights
-
Exchequer Highlight September 2026
The National Treasury gazetted the revenue and net expenditures for the third month of FY’2026/2027, ending 30th September 2026, highlighting that the total revenue collected as at the end of September 2026 amounted to Kshs 685.4 bn, equivalent to 23.0 % of the original estimates of Kshs 2,985.7 bn for FY’2026/2027 and is 91.8% of the prorated estimates of Kshs 746.4 bn. Below is a summary of the performance:
|
FY'2026/2027 Budget Outturn - As at 30th September 2026 |
|||||
|
Amounts in Kshs billions unless stated otherwise |
|||||
|
Item |
12-months Original Estimates |
Actual Receipts/Release |
Percentage Achieved |
Prorated |
% achieved of the Prorated |
|
Opening Balance |
|
29.2 |
|
|
|
|
Tax Revenue |
2,858.7 |
631.8 |
22.1% |
714.7 |
88.4% |
|
Non-Tax Revenue |
127.1 |
24.4 |
19.2% |
31.8 |
76.8% |
|
Total Revenue |
2,985.7 |
685.4 |
23.0% |
746.4 |
91.8% |
|
External Loans & Grants |
612.3 |
58.0 |
9.5% |
153.1 |
37.9% |
|
Domestic Borrowings |
1,568.1 |
565.6 |
36.1% |
392.0 |
144.3% |
|
Other Domestic Financing |
11.3 |
1.6 |
14.4% |
2.8 |
57.5% |
|
Total Financing |
2,191.7 |
625.2 |
28.5% |
547.9 |
114.1% |
|
Recurrent Exchequer issues |
1,713.6 |
427.2 |
24.9% |
428.4 |
99.7% |
|
CFS Exchequer Issues |
2,563.0 |
532.5 |
20.8% |
640.7 |
83.1% |
|
Development Expenditure & Net Lending |
473.0 |
104.5 |
22.1% |
118.2 |
88.4% |
|
County Governments + Contingencies |
428.0 |
96.3 |
22.5% |
107.0 |
90.0% |
|
Total Expenditure |
5,177.5 |
1,160.6 |
22.4% |
1,294.4 |
89.7% |
|
Fiscal Deficit excluding Grants |
2,191.7 |
475.2 |
21.7% |
547.9 |
86.7% |
|
Total Borrowing |
2,180.5 |
623.6 |
28.6% |
545.1 |
114.4% |
The key take-outs from the release include;
-
Total revenue collected as at the end of September 2026 amounted to Kshs 685.4 bn, equivalent to 23.0% of the original estimates of Kshs 2,985.7 bn for FY’2026/2027 and is 91.8% of the prorated estimates of Kshs 746.4 bn. Cumulatively, tax revenues amounted to Kshs 631.8 bn, equivalent to 22.1% of the original estimates of Kshs 2,858.7 bn and 88.4% of the prorated estimates of Kshs 714.7 bn,
-
Total financing amounted to Kshs 625.2 bn, equivalent to 28.5% of the original estimates of Kshs 2,191.7 bn and is equivalent to 114.1% of the prorated estimates of Kshs 547.9 bn. Additionally, domestic borrowing amounted to Kshs 565.6 bn, equivalent to 36.1% of the original estimates of Kshs 1,568.1 bn and is 144.3% of the prorated estimates of Kshs 392.0 bn.
-
The total expenditure amounted to Kshs 1,160.6 bn, equivalent to 22.4% of the original estimates of Kshs 5,177.5 bn, and is 89.7% of the prorated target expenditure estimates of Kshs 1,294.4 bn. Additionally, the net disbursements to recurrent expenditures came in at Kshs 427.2 bn, equivalent to 24.9% of the original estimates of Kshs 1,713.6 bn and are equivalent to 99.7% of the prorated estimates of Kshs 428.4 bn,
-
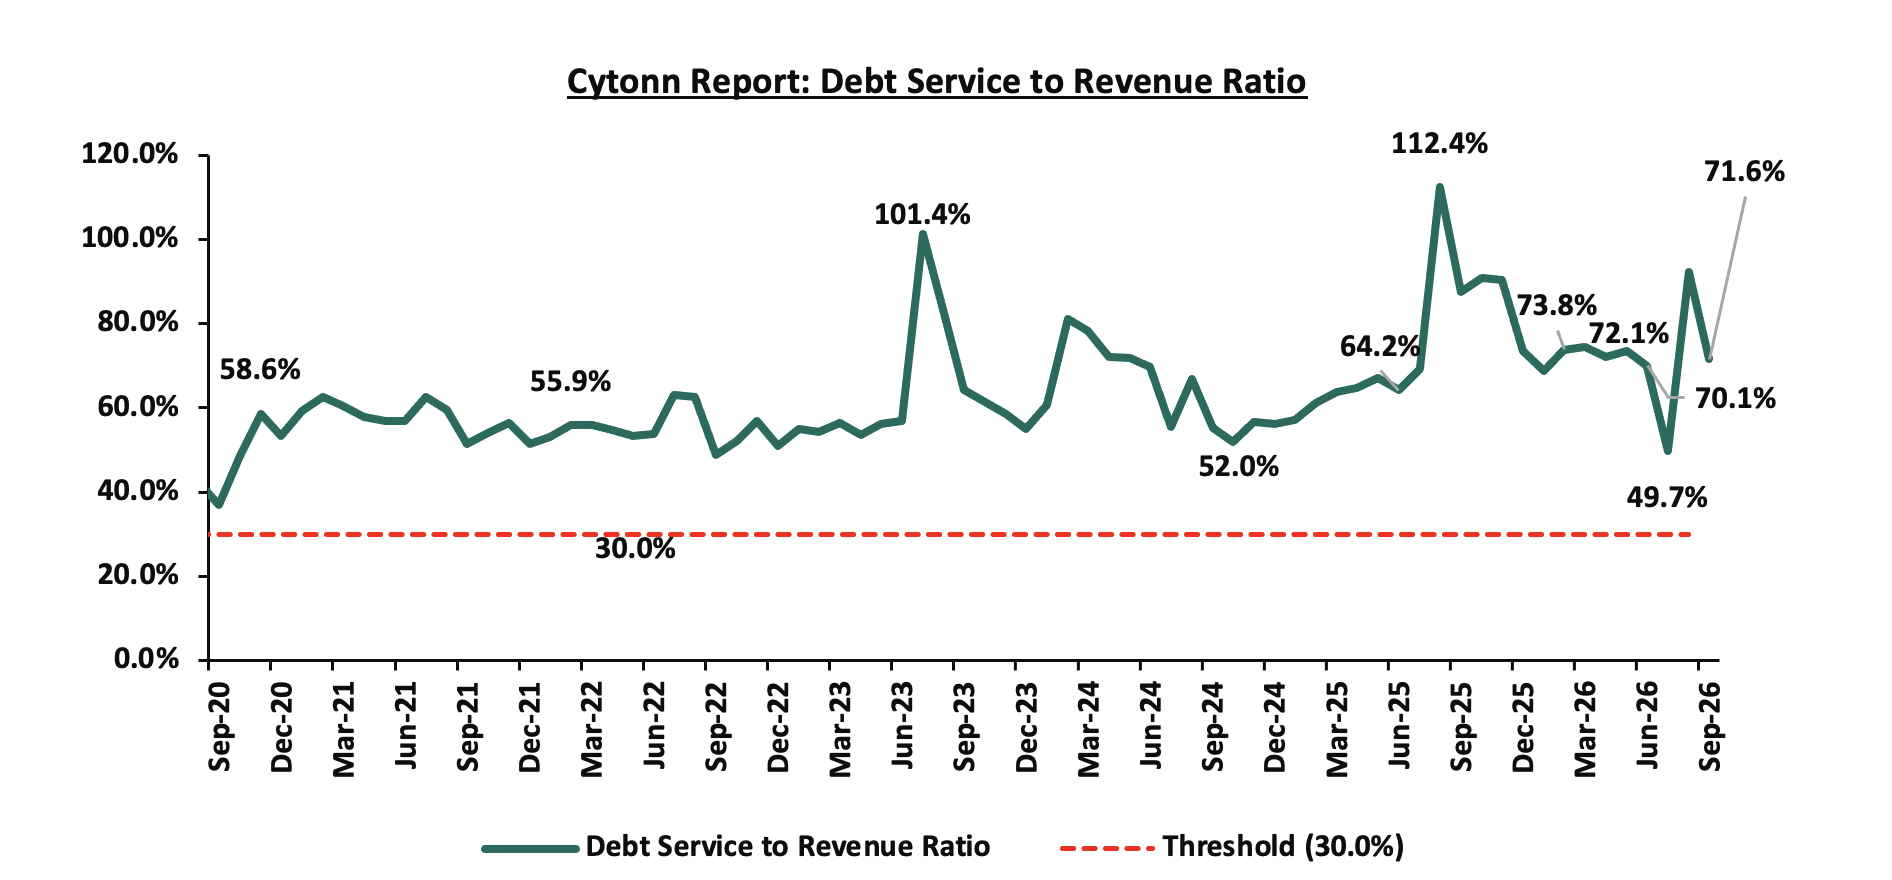
Consolidated Fund Services (CFS) Exchequer issues came in at Kshs 532.5 bn, equivalent to 20.8% of the original estimates of Kshs 2,563.0 bn, and are 83.1% of the prorated amount of Kshs 640.7 bn. The cumulative public debt servicing cost amounted to Kshs 490.5 bn which is 21.2% of the original estimates of Kshs 2,315.9 bn and is 84.7% of the prorated estimates of Kshs 579.0 bn. Additionally, the Kshs 490.5 bn debt servicing cost is equivalent to 71.6% of the actual cumulative revenues collected as at the end of September 2026. The chart below shows the debt servicing cost to revenue ratio over the period;
-
Total borrowings as at the end of September 2026 amounted to Kshs 623.6 bn, equivalent to 28.6% of the original estimates of Kshs 2,180.5 bn for FY’2026/2027 and are 114.4% of the prorated estimates of Kshs 545.1 bn. The Kshs 1,568.1 bn domestic borrowing estimate for the year comprises Net Domestic Borrowing of Kshs 919.4 bn and Internal Debt Redemptions (Roll-overs) of Kshs 648.8 bn.
The government underachieved its prorated revenue targets for the third month of the FY’2026/2027, achieving 91.8% of the prorated revenue targets in September 2026, higher than 83.0% achieved in August 2026. This was driven by shortfall in tax revenues and non-tax revenues, which stood at 88.4% and 76.8% of prorated levels respectively, with collections amounting to Kshs 631.8 bn in tax revenue and Kshs 24.4 bn in non-tax revenue. External loans and grants were significantly behind prorated target at 37.9%, increasing reliance on domestic borrowing, which came in at 144.3% of the prorated target of Kshs 392.0 bn. Expenditure absorption stood at 89.7% of prorated levels, with development spending at 88.4%, an improvement from 56.2% recorded in August 2026. However, development expenditure continued to lag recurrent expenditure, which recorded an absorption rate of 99.7% of prorated levels. Future revenue performance will depend on how quickly private sector activity strengthens, easing credit conditions following the decision to maintain the Central Bank Rate at 8.75% in October 2026, and continued efforts to broaden the tax base, curb evasion, and stimulate economic growth. However, the outlook remains vulnerable to external shocks, with inflation remaining elevated at 6.8% and potential oil supply disruptions arising from the Middle East conflict posing further upside risks to inflation and production costs. These pressures could constrain private sector expansion and weaken revenue mobilization.
-
October 2026 Inflation Projection
We are projecting that the year-on-year inflation rate for October 2026 will fall within the range of 6.6%-6.9%, mainly on the back of:
-
Higher Retail Fuel Prices in October 2026: Energy and Petroleum Regulatory Authority (EPRA) released its monthly statement on the maximum retail fuel prices in Kenya, effective from 15th October 2026 to 14th November 2026. Notably, the maximum allowed prices for Kerosene, Super Petrol and Diesel increased by Kshs 28.5, Kshs 12.9 and Kshs 9.9 to Kshs 219.9, Kshs 227.0 and Kshs 227.8 per litre, respectively, from Kshs 191.4, Kshs 214.0 and Kshs 217.9 set in September, reflecting the pass-through of higher landed costs. Given Diesel's importance as an input into transportation, manufacturing, agriculture, and logistics, and Kerosene's role as a household energy source, the higher retail prices should push up transport, production and household energy costs, supporting our October inflation projection. However, since the new prices took effect mid-month, part of the impact is likely to be felt in November.
-
Geopolitical Risks to Global Oil Prices: Global oil prices remain an upside risk to inflation amid continued disruptions to energy flows through the Strait of Hormuz. Brent crude oil prices increased to USD 107.8 per barrel as of 19th October 2026, from USD 102.6 per barrel as of 30th September 2026, representing a 5.1% increase. The increase has been driven by continued restrictions on shipping through the Strait of Hormuz, attacks on tankers, escalating Middle East tensions and strikes on Russian refineries, which have tightened global supply. Given Kenya's reliance on imported petroleum products, sustained elevation in global oil prices could increase imported fuel costs and place further upward pressure on domestic inflation in subsequent pricing cycles.
We, however, expect the upward pressures to be partly moderated by:
-
Maintaining the Central Bank Rate (CBR) at 8.75%: The MPC decided to hold the CBR at 8.75% at its October 2026 meeting, the fourth consecutive hold since the rate was cut to 8.75% in February 2026. With no fresh rate cuts feeding new demand-side pressure into the economy, and the MPC signalling that it will monitor global oil prices and any second-round effects on inflation, the hold should cushion inflation against cost-push pressures from higher fuel prices and keep demand-driven price pressures contained.
-
Relatively Stable Kenya Shilling: The Kenya Shilling has remained relatively stable against the US dollar, trading at Kshs 129.8 against the US dollar, remaining relatively unchanged from the beginning of the month. The relative stability of the currency should continue to limit imported inflationary pressures, particularly on fuel and other imported goods, partly cushioning the impact of higher global oil prices on our October inflation projection.
-
Marginal Decline in Electricity Costs: Electricity costs recorded a marginal decline in October, with total variable pass-through charges falling to Kshs 4.10 per kWh, from Kshs 4.16 per kWh in September, representing a Kshs 0.06 per kWh decline. The Foreign Exchange Fluctuation Adjustment decreased to Kshs 0.87 from Kshs 1.14 per kWh and the Water Resources Management Authority levy edged down to Kshs 0.013 from Kshs 0.015 per kWh, which more than offset an increase in the Fuel Energy Cost Charge to Kshs 3.2 from Kshs 3.0 per kWh. However, given the modest decline across the components, its impact on overall inflation is expected to remain limited, although it provides some downward pressure on energy-related costs during the month.
Going forward, we expect inflationary pressures to remain within the Central Bank of Kenya’s (CBK) target range of 2.5%-7.5%, with headline inflation projected to range between 7.0%-7.3% in October 2026, from 6.8% in September 2026. This is supported by the increase in retail fuel prices effective 15th October and elevated global oil prices amid ongoing disruptions around the Strait of Hormuz. However, these factors are partly offset by the Central Bank Rate (CBR) holding at 8.75%, the relative stability of the Kenya Shilling, and a marginal decline in electricity costs. On balance, the October inflation projection stands at 6.6%-6.9%.
We maintain a “cautiously optimistic” short-term outlook supported primarily earnings-led attractive valuations, despite heightened geopolitical risks such as Iran war that may weigh on investor
sentiment, and, “neutral” in the long term as persistent foreign investor outflows continue to constrain market liquidity and limit broad-based market re-rating. With the market currently trading at a
discount to its future growth (PEG Ratio at 0.9x), where performance will be driven by company-specific fundamentals rather than general market direction, we believe that investors should reposition towards value stocks exhibiting strong earnings growth, attractive dividend yields, solid balance sheets, sustainable competitive advantages and trading at compelling discounts to their intrinsic value.
While foreign investor sell-offs are expected to continue exerting pressure in the near term, we believe this will create selective entry opportunities for long-term investors
Market Performance:
During the week, the equities market was on a downward trajectory, with the NSE 20, NSE 10, NSE 25, and NASI declining by 3.6%, 2.8%, 2.3%, and 1.7% respectively, taking their YTD performance to gains of 33.0%, 30.8%, 29.7%, and 25.4% respectively for NSE 20, NSE 10, NSE 25 and NASI respectively. The week-on-week equities market performance was mainly driven by losses recorded by large-cap stocks such as EABL, KCB, and Safaricom of 5.7%, 4.7%, and 4.6% respectively. The performance was however supported by gains recorded by large-cap stocks such as NCBA, and Co-operative of 2.3% and 0.7% respectively;
During the week, the banking sector index decreased by 2.3% to 276.4 from the 282.9 recorded the previous week. This is attributable to losses recorded by large cap stocks such as KCB, ABSA and Equity of 4.7%, 4.1%, and 2.5% respectively. The performance was however supported by gains recorded by large-cap stocks such as NCBA and Co-op of 2.3% and 0.7% respectively.
During the week, equities turnover increased by 1333.7% to USD 350.8 mn from USD 24.5 mn recorded the previous week, taking the YTD total turnover to USD 3,443.4 mn. Foreign investors remained net sellers with a net selling position of USD 9.45 mn, from a net selling position of USD 9.46 mn recorded the previous week, taking the YTD foreign net selling position to USD 190.7 mn, compared to a net selling position of USD 92.9 mn recorded in 2025;
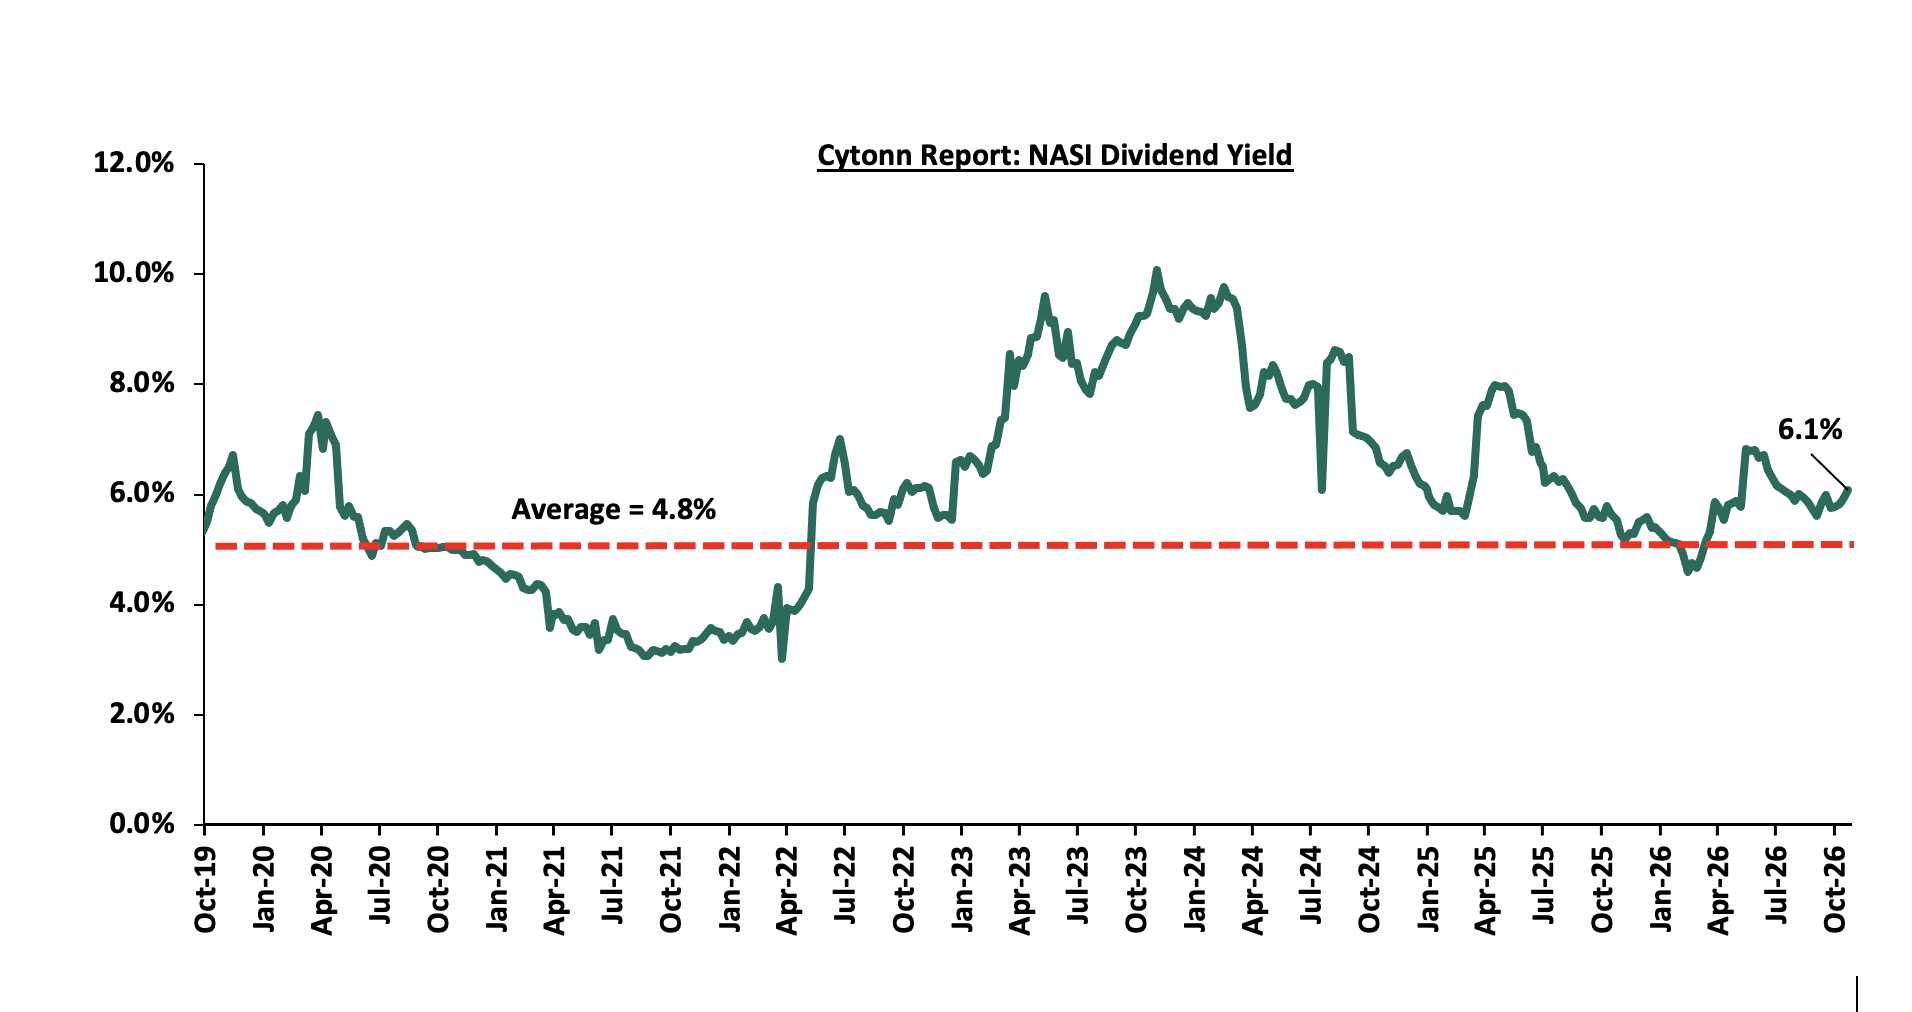
The market is currently trading at a price to earnings ratio (P/E) of 7.2x, 35.2% below the historical average of 11.2x, and a dividend yield of 6.1%, 1.3% points above the historical average of 4.8%. Key to note, NASI’s PEG ratio currently stands at 0.9x, an indication that the market is slightly undervalued relative to its future growth. A PEG ratio greater than 1.0x indicates the market may be overvalued while a PEG ratio less than 1.0x indicates that the market is undervalued;
The charts below indicate the historical P/E and dividend yields of the market:
Universe of Coverage:
|
Cytonn Report: Equities Universe of Coverage |
|||||||||||
|
Company |
Price as at 16/10/2026 |
Price as at 23/10/2026 |
w/w change |
m/m change |
YTD Change |
Year Open 2026 |
Target Price* |
Dividend Yield |
Upside/ Downside** |
P/TBv Multiple |
Recommendation |
|
Co-op Bank |
36.6 |
36.8 |
0.7% |
(0.7%) |
52.9% |
23.9 |
46.1 |
6.8% |
32.1% |
1.4x |
Buy |
|
NCBA |
86.0 |
88.0 |
2.3% |
0.3% |
3.5% |
85.0 |
108.9 |
8.1% |
31.9% |
1.2x |
Buy |
|
KCB Group |
89.5 |
85.3 |
(4.7%) |
(7.8%) |
36.1% |
65.8 |
104.4 |
8.2% |
30.7% |
0.9x |
Buy |
|
Family Bank |
27.7 |
25.8 |
(6.7%) |
(10.1%) |
53.6% |
18.0 |
32.5 |
4.7% |
30.6% |
1.3x |
Buy |
|
ABSA Bank |
32.6 |
31.2 |
(4.1%) |
(5.6%) |
31.0% |
24.9 |
36.8 |
6.6% |
24.6% |
1.7x |
Buy |
|
Equity Group |
100.0 |
97.5 |
(2.5%) |
(7.6%) |
49.3% |
67.0 |
113.5 |
5.9% |
22.3% |
1.3x |
Buy |
|
Standard Chartered Bank |
317.5 |
314.8 |
(0.9%) |
(1.5%) |
5.9% |
299.8 |
345.8 |
9.8% |
19.7% |
1.9x |
Accumulate |
|
Stanbic Holdings |
275.8 |
272.0 |
(1.4%) |
(3.0%) |
39.4% |
197.8 |
300.3 |
8.2% |
18.6% |
1.5x |
Accumulate |
|
I&M Group |
85.0 |
81.3 |
(4.4%) |
(1.5%) |
98.6% |
42.8 |
90.4 |
4.6% |
15.9% |
1.3x |
Accumulate |
|
Diamond Trust Bank |
186.8 |
186.3 |
(0.3%) |
(1.5%) |
62.7% |
114.8 |
199.5 |
4.8% |
12.0% |
0.5x |
Accumulate |
|
Jubilee Holdings |
393.3 |
393.0 |
(0.1%) |
(1.5%) |
21.9% |
322.5 |
420.5 |
3.8% |
10.8% |
0.5x |
Accumulate |
|
Britam |
18.4 |
18.5 |
0.5% |
(1.1%) |
102.5% |
9.1 |
18.5 |
0.0% |
0.0% |
1.4x |
Sell |
|
CIC Group |
5.1 |
5.1 |
0.8% |
1.6% |
12.3% |
4.5 |
5.0 |
2.5% |
(1.0%) |
1.3x |
Sell |
|
*Target Price as per Cytonn Analyst estimates **Upside/ (Downside) is adjusted for Dividend Yield ***Dividend Yield is calculated using FY’2025 Dividends |
|||||||||||
We maintain a “cautiously optimistic” short-term outlook supported primarily earnings-led attractive
valuations, despite heightened geopolitical risks such as Iran war that may weigh on investor
sentiment, and, “neutral” in the long term as persistent foreign investor outflows continue to constrain
market liquidity and limit broad-based market re-rating. With the market currently trading at a
discount to its future growth (PEG Ratio at 0.9x), where performance will be driven by company-specific
fundamentals rather than general market direction, we believe that investors should reposition
towards value stocks exhibiting strong earnings growth, attractive dividend yields, solid balance
sheets, sustainable competitive advantages and trading at compelling discounts to their intrinsic value.
While foreign investor sell-offs are expected to continue exerting pressure in the near term, we believe
this will create selective entry opportunities for long-term investors
- Industry Report
a) June Leading Economic Indicators (LEI)
During the week, the Kenya National Bureau of Statistics (KNBS) released the Leading Economic Indicators (LEI) August 2026 Report, which highlighted the performance of major economic indicators. The key highlights related to the Real Estate sector include:
- Cement consumption: In August 2026, cement consumption reached 1.0 metric tonnes, representing an 14.6% y/y increase from 0.9 metric tonnes in August 2025. Month-on-month, consumption increased by 3.1%, to 1,039,351 from 1,008,078 in July attributable to eased construction input cost during the period, such as transport and fuel. The y/y performance was anchored by (i) continued private sector construction activity in urban hubs such as Nairobi, Mombasa, and Kisumu, (ii) government-led infrastructure investments under the Bottom-Up Economic Transformation Agenda (BETA), including roads, affordable housing, water, and sanitation projects, and (iii) public works initiatives in rural and semi-urban areas, which both support livelihoods and expand critical infrastructure.
The chart below shows cement consumption in metric tonnes in Kenya between Q1’2023 and Q3’2026.

-
Building plans: In August 2026, the value of building plans approved in Nairobi City County increased by 181.3% on year-on-year basis to Kshs 26.5 bn from Kshs 9.4 bn in August 2025. On a month-on-month basis, approved building plans increased by 38.4% from Kshs 19.1 bn recorded in July 2026. The increase on month on month basis reflects a sustained recovery and growing confidence in the real estate and construction sector driven by (i) improved demand for residential and commercial developments, (ii) eased lending rates by financial institutions due to the consistent maintaining of the CBR rate which currently stands at 8.75%. This has enabled more developers to initiate and submit construction projects for approval. (iii) the ongoing digitization and streamlining of the development approval process by the Nairobi City County Government, which has improved efficiency, reduced approval timelines, and encouraged more developers to formally submit building plans
The chart below shows the building plans approved in billions in Kenya between Q1’2023 and Q3’2026;

- Cement consumption: In August 2026, cement consumption reached 1.0 metric tonnes, representing an 14.6% y/y increase from 0.9 metric tonnes in August 2025. Month-on-month, consumption increased by 3.1%, to 1,039,351 from 1,008,078 in July attributable to eased construction input cost during the period, such as transport and fuel. The y/y performance was anchored by (i) continued private sector construction activity in urban hubs such as Nairobi, Mombasa, and Kisumu, (ii) government-led infrastructure investments under the Bottom-Up Economic Transformation Agenda (BETA), including roads, affordable housing, water, and sanitation projects, and (iii) public works initiatives in rural and semi-urban areas, which both support livelihoods and expand critical infrastructure.
- Land Sector
- The president plans to scrap stamp duty on land and property transactions
The exemption lowers a direct transaction cost that has long discouraged formal registration among smallholders and low-income buyers, and we expect this to translate into higher transaction volumes and improved land market data in the low-value segment, which has historically been underrepresented in formal records due to the cost of titling. This action will also reduce the cost of land subdivision and transfer at the entry-level end, which should support faster uptake of affordable housing projects by narrowing the gap between informal and formal land ownership. The progressive rates proposed for higher-value transactions will raise acquisition costs for premium and luxury property, a cost that developers and investors in that segment will need to price into their feasibility models.
Going forward, we expect increased land registration and transaction activity as buyers take advantage of the waived stamp duty, alongside closer scrutiny from authorities to curb undervaluation of properties. We also expect the premium and luxury segments to face marginally higher costs once the progressive rates are finalized, which could slow transaction velocity at the top end. Overall, the policy’s long-term effect will depend on how Parliament sets the final valuation brackets.
- The president plans to scrap stamp duty on land and property transactions
- Hospitality Sector
- Improved Air Travel between Kenya and Middle East
During the week, KNBS recorded air travel between Kenya and the Middle East staged a strong rebound in Q3,2026, even as regional conflict persists. Departures from JKIA to Middle Eastern destinations like Dubai and Doha climbed by 16.0% in July and August combined, rising to 151,295 passengers from 130,156 in 2025. Dubai in particular overtook London as JKIA’s top departure destination, with 35,994 passengers flying to Dubai in August compared to 28,598 to London. This marks a sharp recovery from March 2026, when total Middle East-bound traffic had slumped to just 20,599 passengers, its lowest level in over five years, following the regional conflict’s disruption of Gulf airspace and travel demand.
This signals renewed business and leisure travel demand, which supports occupancy and room rates for hotels, serviced apartments, and facilities. Increased flight frequency from carriers like Kenya Airways and flydubai also strengthens Nairobi’s position as a regional aviation and logistics hub, which can bolster demand for airport-adjacent commercial developments near JKIA.
Going forward, we expect sustained growth in Kenya-Middle East air traffic to support occupancy and rates for Nairobi’s hotels and serviced apartments, given the route’s dominant share of business travel through JKIA. We also expect this traffic growth to add weight to the case for JKIA’s planned Kshs 154.2 bn expansion, supporting demand for commercial and logistics real estate near the airport. We expect the sector to remain exposed to regional conflict risk, as seen in March 2026, when a similar disruption could again suppress Gulf-linked travel and the real estate demand it supports.
- Improved Air Travel between Kenya and Middle East
- Real Estate Investments Trusts
- REITs Weekly Performance
On the Unquoted Securities Platform Acorn D-REIT and I-REIT traded at Kshs 29.7 and Kshs 24.4 per unit, respectively, as per the last updated data on 16th October 2026. The performance represented a 48.3% and 22.2% gain for the D-REIT and I-REIT, respectively, from the Kshs 20.0 inception price. The volumes traded for the D-REIT and I-REIT came in at 13.7 mn and 46.0 mn shares, respectively. Additionally, ILAM Fahari I-REIT traded at Kshs 13.8 per share as of 16th October 2026, representing a 31.0% loss from the Kshs 20.0 inception price. The volume traded came in at 1.2 mn shares. REITs offer various benefits, such as tax exemptions, diversified portfolios, and stable long-term profits. However, the ongoing decline in the performance of Kenyan REITs and the restructuring of their business portfolios are hindering significant previous investments. Additional general challenges include:
- Insufficient understanding of the investment instrument among investors leading to a slower uptake of REIT products,
- Lengthy approval processes for REIT creation,
- High minimum capital requirements of Kshs 100.0 mn for REIT trustees compared to Kshs 10.0 mn for pension funds Trustees, essentially limiting the licensed REIT Trustee to banks only,
- The rigidity of choice between either a D-REIT or I-REIT forces managers to form two REITs, rather than having one Hybrid REIT that can allocate between development and income earning properties
- Limiting the type of legal entity that can form a REIT to only a trust company, as opposed to allowing other entities such as partnerships, and companies,
- We need to give time before REITs are required to list – they would be allowed to stay private for a few years before the requirement to list given that not all companies may be comfortable with listing on day one, and,
- Minimum subscription amounts or offer parcels set at Kshs 0.1 mn for D-REITs and Kshs 5.0 mn for restricted I-REITs. The significant capital requirements still make REITs relatively inaccessible to smaller retail investors compared to other investment vehicles like unit trusts or government bonds, all of which continue to limit the performance of Kenyan REITs.
- REITs Weekly Performance
We expect the performance of Kenya's Real Estate sector to remain resilient, supported by several factors, including: i) increase in cement consumption to 1.0metric tonnes, Mariginal JKIA/MIA arrivals significan increase of value of building plans ii) President Ruto Plans to Scrap Stamp Duty on Land and Propert Transactions and iii) Improved Air Travel between Kenya and Middle East. However, challenges such as weak investor appetite in listed REITs and high capital requirements will continue to constrain the sector's optimal performance.
-
Visa Announces Enhanced Capabilities That Can Bring Trust and Control to the Future of Business Payments
During the week, Visa announced three enhanced commercial payment capabilities: SESA 2.0, which uses AI-driven analytics to identify supplier card-payment opportunities; Visa Commercial Fraud Solutions, which strengthens supplier verification, virtual-card authentication and transaction-level spending controls; and a live pilot with BILL and Billtrust enabling authorized AI agents to complete buyer-approved invoice payments through supplier portals using tokenized credentials. SESA has identified more than USD 600.0 bn in potential card able spend, while Juniper Research projects global B2B virtual-card payment volumes will reach USD 14.6 tn by 2029, accounting for 83.0% of the global virtual-card market. These developments could strengthen Visa’s commercial payments business by expanding card acceptance, reducing fraud risks, improving payment efficiency and positioning the company to benefit from AI-driven commerce. However, the financial impact will depend on adoption, transaction growth and the effectiveness of security controls. Payment Controls are available to eligible issuers in supported markets, while Supplier Validation and Virtual Authentication remain in pilot, with general availability expected in 2027.
-
Mastercard Introduces Risk Intelligence to enable more Secure Stable Coin Payments
During the week, Mastercard announced Stablecoin Security, a risk intelligence solution developed with Borderless. xyz and Keyrails to help financial institutions detect fraud, scams, sanctions exposure and other financial-crime risks across stablecoin payments. The platform combines payment intelligence and blockchain analytics to generate pre-transaction risk scores and integrate with existing compliance and fraud-management systems. Its launch addresses growing transaction complexity, with a 2025 study of 593 million stablecoin transfers across 141 million Ethereum transactions finding that nearly 60% involved multiple steps. Initially launching in North America, the solution is expected to become commercially available worldwide in 2027, with further expansion planned through BVNK, acquired by Mastercard in August 2026. The initiative could strengthen Mastercard’s digital payments security business and support institutional adoption of stablecoins for cross-border and B2B transactions, although its financial impact will depend on adoption rates and the effectiveness of its risk-detection capabilities.
-
How American Express is Helping Business Owners Prepare for an Agentic Commerce
During the week, American Express introduced its Amex Business Playbook for Agentic Commerce, providing research-backed insights and practical guidance to help merchants prepare for AI-driven product discovery and purchasing. The initiative addresses opportunities for businesses to attract customers through AI-powered searches while maintaining customer relationships and integrating emerging technologies. American Express executives Anna Marrs, Group President of Global Merchant & Network Services, and Luke Gebb, Executive Vice President of Global Innovation, highlighted agentic commerce’s potential to increase merchant revenue and address operational challenges, including payment disputes, abandoned purchases and product returns. The initiative could strengthen American Express’ relationships with merchants and position its network to benefit from the growth of AI-enabled commerce, although its impact will depend on merchant adoption, technological development and the extent to which AI-driven transactions translate into higher sales and improved operational efficiency.
-
Block Joins the Open Secure AI Alliance
During the week, Block announced it had joined the Open Secure AI Alliance, hosted by the Linux Foundation and comprising over 120 companies, including NVIDIA, Amazon, Microsoft, Intel and Visa, to promote open and secure AI development. The move builds on Block’s use of AI in fraud detection, loan underwriting and business operations, including Money Bot, which serves over 1.0 mn Cash App users, and Manager Bot, which automates sellers’ marketing and operational tasks. Block also supports open-source AI through tools such as Goose, Berd and Buzz, alongside security frameworks for vulnerability detection, model governance and agent accountability. The initiative could strengthen Block’s position in AI infrastructure while promoting accessible, collaborative security solutions for businesses, although its impact will depend on industry adoption and the effectiveness of shared safeguards against evolving AI threats.
-
Digital Payments Stock Performance
The table below presents a snapshot of NYSE-listed digital payments stocks, covering Visa, Mastercard, American Express (AXP), Wise Plc, Block and PayPal:
|
Cytonn Report: Digital Payments NYSE and LSE stock perfomance |
|
|||||
|
Company |
Year Open 2026 |
Price 16/10/2026 |
Price 23/10/2026 |
w/w change |
YTD change |
Forward P/E |
|
American Express |
372.7 |
313.6 |
313.2 |
(0.1%) |
(16.0%) |
15.6x |
|
Visa |
346.5 |
402.6 |
407.9 |
1.3% |
17.7% |
27.2x |
|
Mastercard |
563.1 |
617.4 |
623.6 |
1.0% |
10.7% |
27.0x |
|
Circle |
83.5 |
82.2 |
85.9 |
4.5% |
2.9% |
60.1x |
|
Block |
65.2 |
77.9 |
76.5 |
(1.8%) |
17.4% |
14.7x |
|
Paypal Holdings |
58.1 |
56.7 |
57.0 |
0.6% |
(1.9%) |
9.9x |
|
Global Payments Inc |
77.0 |
83.7 |
82.8 |
(1.0%) |
7.5% |
27.5x |
|
Average |
|
|
|
|
|
26.0x |
Source: Visa, AXP, Circle, Global Payments, Mastercard, Block and PayPal financials, NYSE, PE* calculated using forward FY’2027 audited financials
The stocks are currently trading at an average forward P/E multiple of 26.0x, indicating that investors are pricing in strong future earnings growth and are prepared to pay a substantial premium for current earnings. This also suggests that valuations may be stretched relative to near-term fundamentals.
We expect the global digital payments sector to continue shifting toward greater payment sovereignty and reduced reliance on traditional card-based networks, as governments and financial institutions prioritize control over domestic payment ecosystems. The European Central Bank's progress toward launching the Digital Euro signals a growing move toward central bank-backed payment infrastructure, which is likely to intensify competition with established private networks such as Visa Inc. and Mastercard Incorporated. However, despite these favorable long-term tailwinds, valuations remain elevated, with the companies under coverage trading at an average forward P/E of 26.0x, suggesting that much of the expected growth may already be priced in. As such, we expect near-term performance to remain sensitive to regulatory developments, execution risk, and how quickly incumbents and new entrants adapt to the changing payments landscape.
Industrial real estate plays a critical role in supporting manufacturing, trade, logistics and the broader economy, yet it often receives less attention than residential, commercial office and retail real estate. In Kenya, government initiatives such as Special Economic Zones (SEZs) and Export Processing Zones (EPZs), administered under the Ministry of Investments, Trade and Industry (MITI), have supported industrial development and investment. At the same time, population growth, rising consumption and expanding regional trade continue to drive demand for production facilities, warehouses and distribution centres. The sector is also evolving beyond conventional manufacturing and warehousing to encompass specialized facilities such as slaughterhouses, cold-chain storage and data centres. These developments are creating new investment opportunities while exposing the sector to constraints related to infrastructure, energy reliability and development costs. Given these developments, we find it prudent to analyze the Industrial Real Estate sector, with a particular focus on the Nairobi Metropolitan Area (NMA);
In analyzing the Industrial Real Estate sector in Nairobi Metropolitan Area (NMA) we discuss the following;
-
Overview of the Real Estate sector in Kenya,
-
Overview of the Industrial sector in Kenya,
-
Demand Drivers, Challenges, Opportunities and Recent Developments in NMA Industrial Real Estate
-
Summary Performance of the NMA Industrial Sector in 2026,
-
Conclusion and Recommendation
-
Outlook for the NMA Industrial Real Estate sector.
Section I: Overview of the Real Estate Sector in Kenya
The Real Estate sector in Kenya has grown over the years to become one of the largest contributors to the country’s Gross Domestic Product contributing 10.2% in Q2’2026, supported by factors such as; i) positive demographics including higher urbanization and population growth rates of 2.9% p.a and 1.9% p.a, respectively, against the global average of 1.4% p.a and 0.9% p.a, respectively, as at 2025 ii) government’s sustained efforts to promote infrastructural development, opening up new areas for investments, iii) emphasis to provide affordable housing by the government through programs such as the Affordable Housing Program (AHP), iv) increased investment by both local and foreign investors, and, v) increased accessibility to low-interest loans provided by entities such as Kenya Mortgage Refinance Company (KMRC) among others.
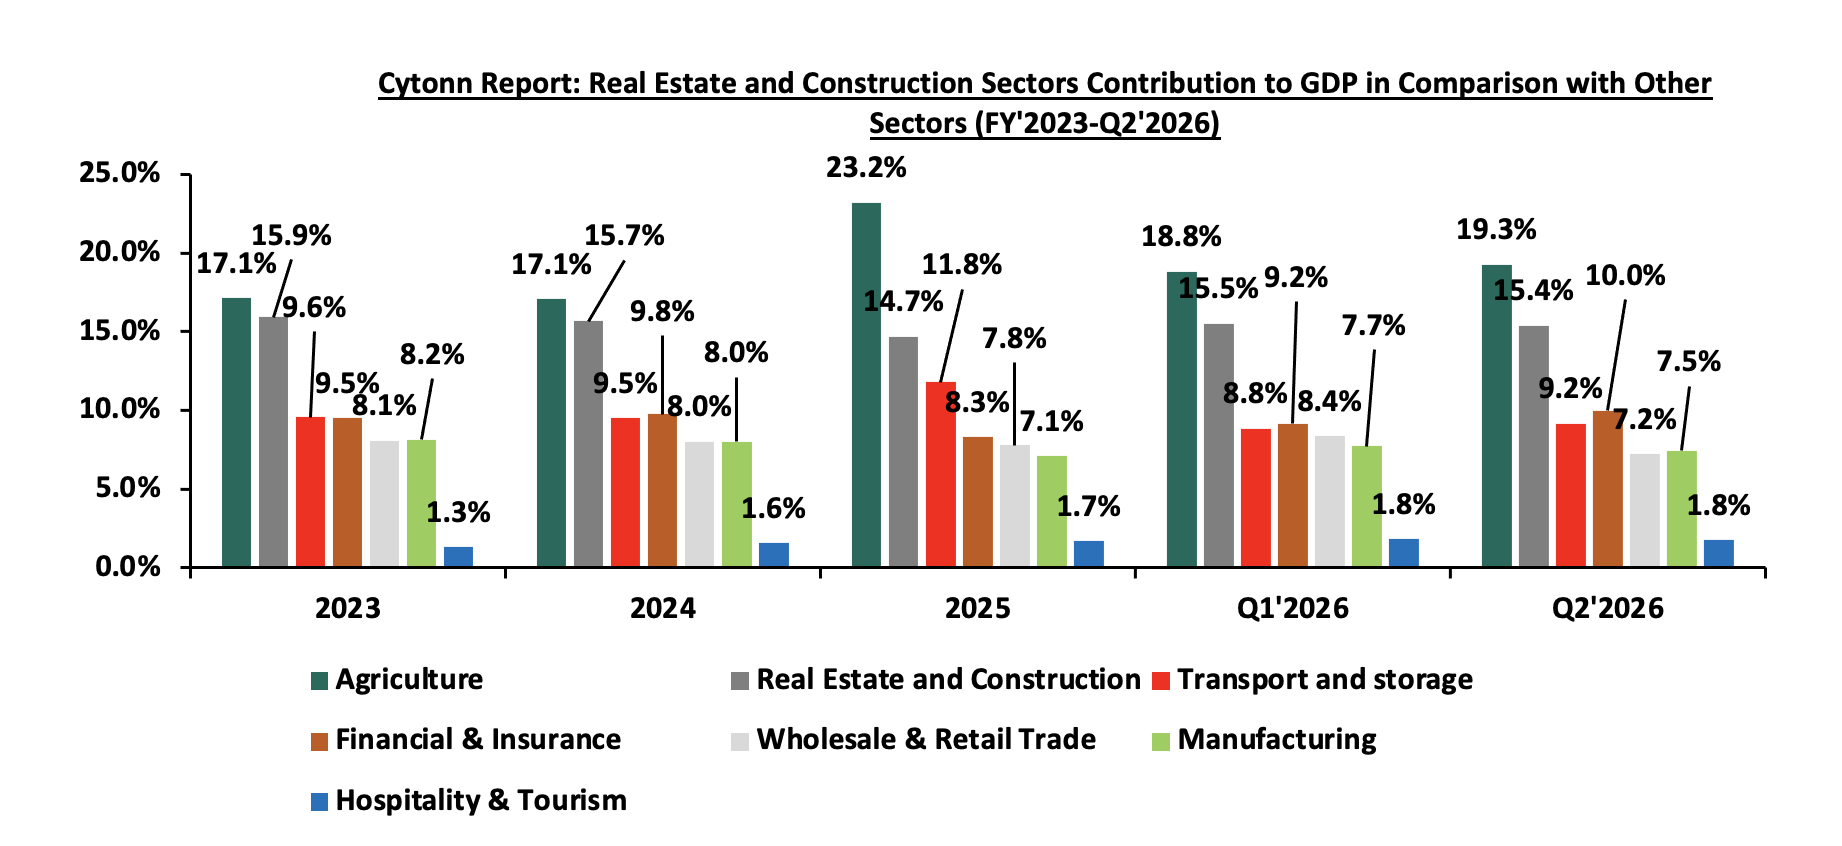
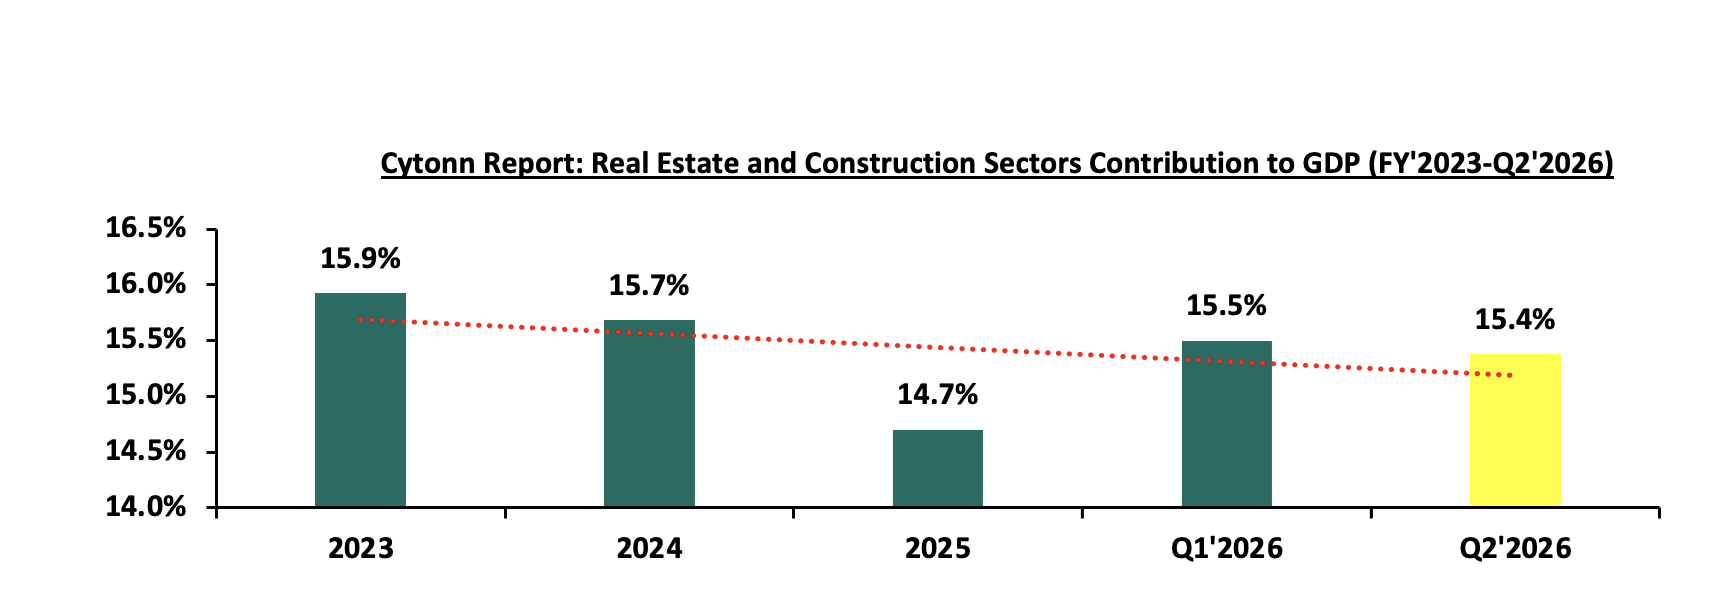
Construction and Real Estate sectors jointly contributed to 15.4% to the country’s GDP in Q2’2026, subsequently being the second largest contributors after Agriculture which contributed 19.3%. The graph below shows the trend of the Real Estate and Construction sectors contribution to GDP between FY’2023 and Q2’2026;
Source: Kenya National Bureau of Statistics (KNBS)
The graph below shows the combined Real Estate and Construction sectors contribution to GDP between FY’2023 and Q2’2026;
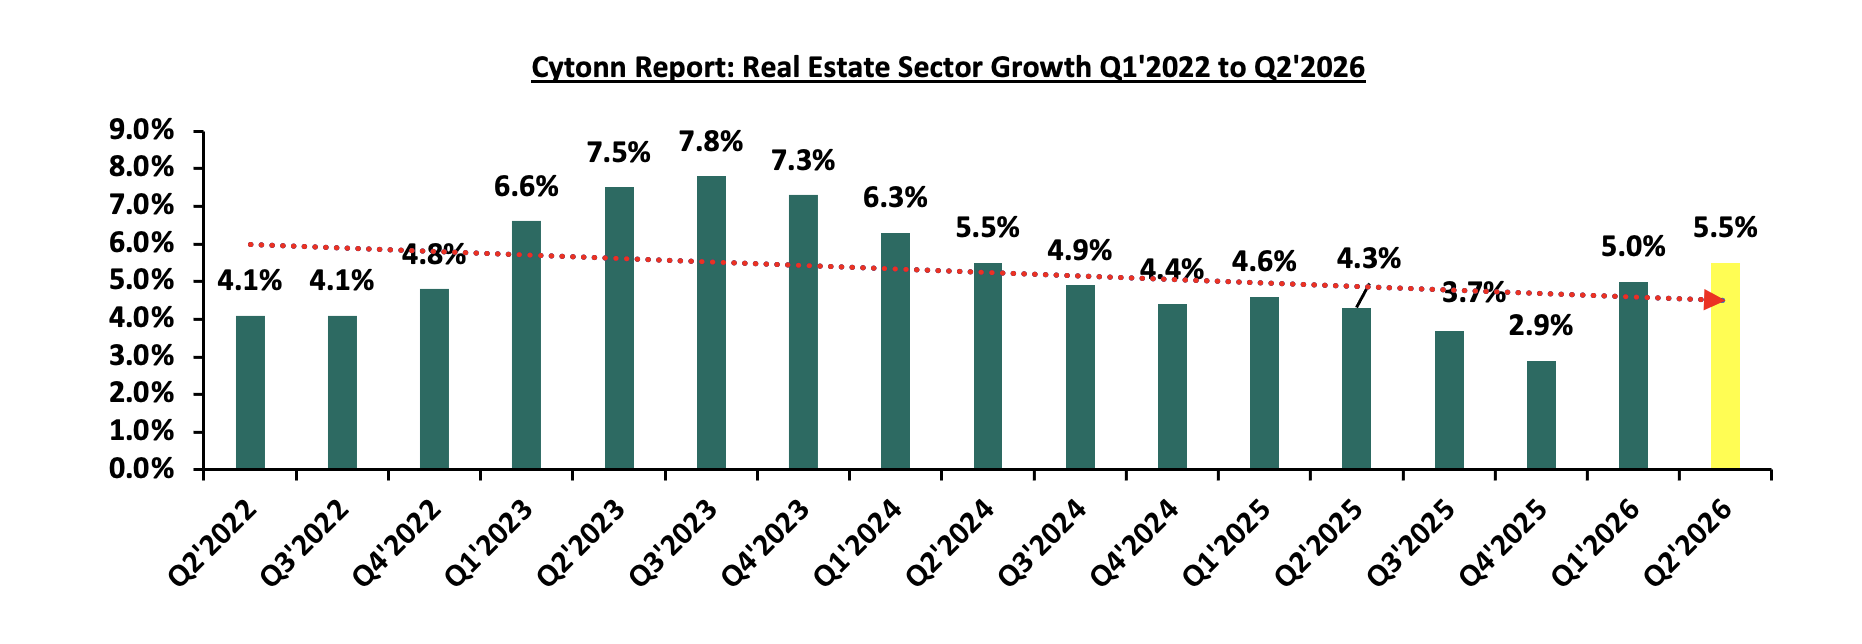
The Real Estate sector in 2026 posted steady growth of 5.5% in Q2’2026, which is 1.2% points faster than the 4.3% growth registered in Q2’2025. This growth can be attributed to the increasing demand for housing in the country, the value of approved building plans in the Nairobi Metropolitan Area (NMA), increased y/y basis by 63.5% to Kshs 43.2 bn in Q2’2026, from Kshs 26.4 bn recorded in Q2’2025. However, growth remained subdued due to the sustained increase in construction costs, which constrained investment and reduced activity in the sector during the period under review. This was reflected in the Construction Input Price Index (CIPI), which increased by 5.5% to 126.4 in Q2’2026, from 119.8 in Q2’2025, raising the cost of construction projects and posing a hurdle to investors. Additionally, diminishing consumer purchasing power continued to weigh on demand in the sector. The graph below shows the Real Estate Sector growth rate between Q2’2022 and Q2’2026;
Source: Kenya National Bureau of Statistics (KNBS)
Section II: Overview of the Industrial Sector in Kenya
The Nairobi Metropolitan Area (NMA) continues to lead Kenya’s industrial real estate sector, accounting for approximately 90.0% of the country’s total industrial space, with Nairobi County holding the largest share at 66.0%, largely due to its status as the capital city and East Africa’s business hub. However, industrial development is increasingly extending to satellite nodes in Kiambu, Machakos, and Kajiado, driven by the growing demand for modern logistics facilities, the expansion of e-commerce, favorable demographics, and improvements in transport infrastructure. Kiambu County, in particular, has attracted significant industrial investments through developments such as Tatu City, Nairobi Gate Industrial Park (NGIP), Tilisi, and Northlands City, alongside logistics facilities such as Africa Logistics Property (ALP) West in Tilisi and ALP North in Tatu City. This decentralization of industrial development has been supported by government-led initiatives aligned with Vision 2030, the development of Special Economic Zones (SEZs), and increased foreign investment, reinforcing the NMA’s position as Kenya’s primary industrial and logistics hub. Below are the Naiobi Metropolitan Area (NMA) Industrial sub-sectors;
-
Manufacturing
Manufacturing is a key sub-sector of industrial real estate, encompassing factories, assembly plants, and production facilities designed to accommodate machinery, production lines, and other specialized equipment. These facilities are integral to supply chains, supporting the transformation of raw materials into finished goods. Their key requirements include high ceilings, reinforced floors, reliable power and water supply, and adequate transport access to facilitate production and distribution. Industrial parks and designated zones, including Special Economic Zones (SEZs) and Export Processing Zones (EPZs), further support manufacturing by integrating production facilities with warehousing and logistics infrastructure. The growth of manufacturing activities drives demand for industrial space, attracts domestic and foreign investment, supports small and medium-sized enterprises (SMEs), creates employment, and strengthens regional trade, making the sub-sector an important contributor to economic growth.
The manufacturing industry has seen gradual decline in performance, having the contribution to GDP decrease by 0.1% points to 7.5% in Q2’2026 from 7.6% recorded in Q2’2025. The graph below shows the manufacturing sector contribution to GDP from FY’2023 to Q2’2026
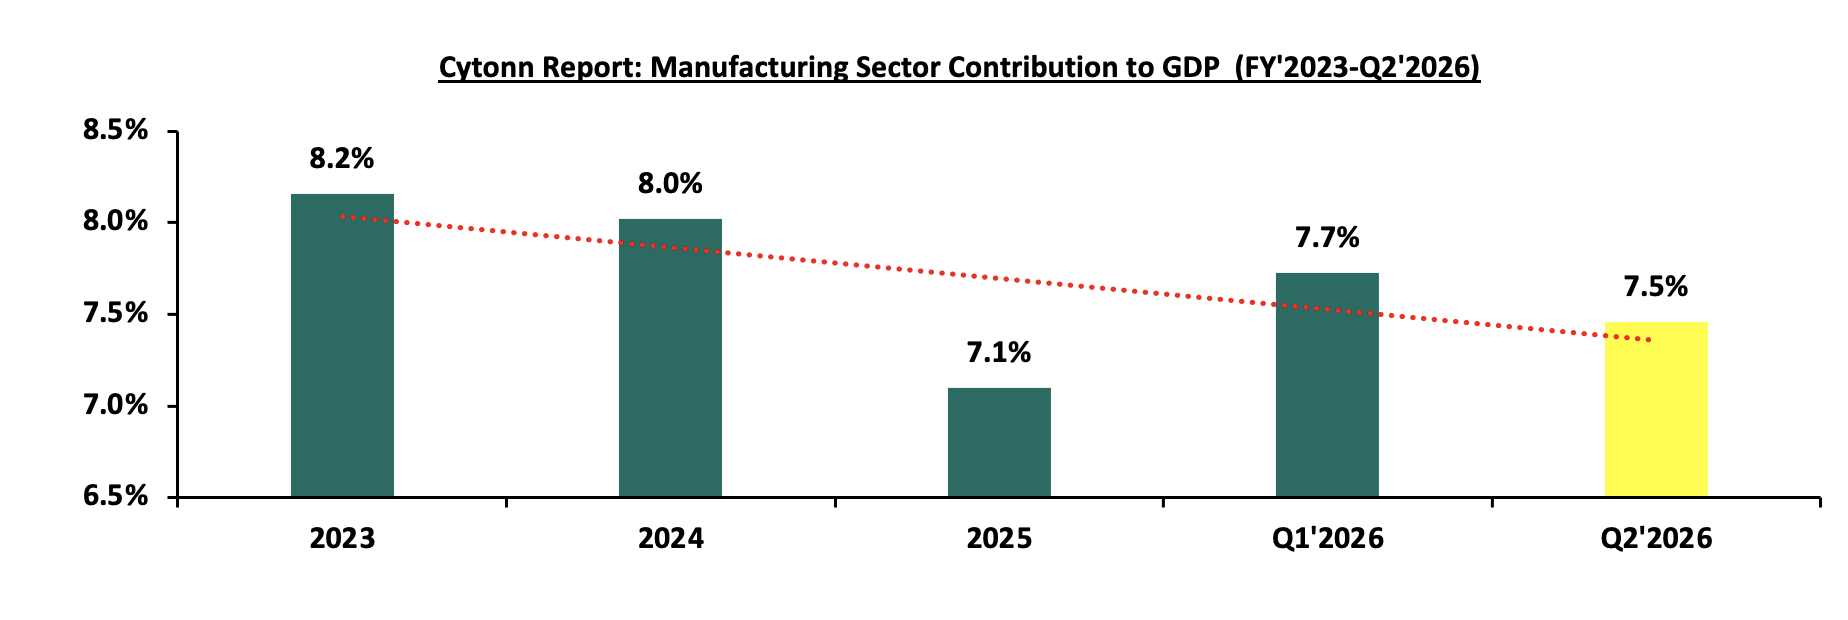
Source: Kenya National Bureau of Statistics (KNBS)
The reduced performance in manufacturing can be attributed to i) high costs of production driven by harsh economic conditions, both locally; such as increased taxes and globally; due to supply chain disruption caused by geopolitical factors such as the US/Israel-Iran war, ii) competition from imports, as some companies find it cost-effective to import goods rather than produce them locally, and, iii) decreasing purchasing power in the country hence a reduced demand of manufactured commodities. Despite the reduced growth, the industry is being promoted by the below activities;
-
Textiles and Apparel: The textile and apparel sector remain an important contributor to Kenya’s manufacturing and export performance, supported by preferential access to international markets and established Export Processing Zones (EPZs). According to the KNBS Economic Survey 2026, exports under the Apparel and Clothing category amounted to Kshs 63.3 bn in 2025. Additionally, employment among apparel enterprises operating under the African Growth and Opportunity Act (AGOA) increased by 22.8% to 82,026 workers, while apparel exports to the United States under the programme declined by 4.1% to Kshs 58.1 bn, from Kshs 60.6 bn in 2024. The extension of AGOA to December 2028 provides continued preferential access to the US market for eligible Kenyan exports, supporting export competitiveness and investment in production capacity. Industrial developments, including the textile park at Nairobi Gate Industrial Park and the designation of Tilisi Logistics Park as an EPZ, further support manufacturing activity and demand for industrial space. However, high production costs and competition from Asian manufacturers remain key constraints, underscoring the need to improve cost competitiveness, diversify export markets, and expand into higher-value products.
-
Agro-processing: Kenya's large agricultural sector provides a strong raw-material base for agro-processing, including tea and coffee processing, horticultural packaging, edible oils, dairy products, and meat processing. Increasing investment in value addition enables manufacturers to produce higher-value goods, reduce post-harvest losses, and access regional and international markets. Government initiatives promoting local processing, export diversification, and investment in agricultural value chains further support the subsector. These activities drive demand for processing plants, packaging facilities, cold-storage warehouses, and specialized logistics infrastructure, particularly where industrial facilities are linked to agricultural production and export routes.
-
Pharmaceuticals: Kenya is seeking to strengthen its pharmaceutical manufacturing capacity to reduce reliance on imported medicines, improve supply-chain resilience, and serve regional markets. The Kenya Health Products and Technologies Local Manufacturing Strategy 2026-2030 targets local production of at least 50.0% of the country's essential health products. Government support, opportunities to supply public healthcare programmes, and growing regional demand are expected to encourage investment in pharmaceutical production. The expansion of this subsector could increase demand for specialized manufacturing facilities, quality-control laboratories, temperature-controlled storage, and compliant distribution infrastructure. However, scaling production will depend on access to financing, specialized technology, reliable supplies of pharmaceutical ingredients, and compliance with stringent quality and regulatory standards.
-
Electric mobility and vehicle assembly: Electric mobility is an emerging manufacturing subsector, supported by growing demand for electric motorcycles and buses, investment in local assembly, and opportunities to develop domestic supply chains. Kenyan firms are expanding assembly capacity and related activities, including vehicle components, battery systems, and charging infrastructure. In October 2026, the Government of Kenya and Endelevu Enterprise Corporation signed a Memorandum of Understanding (MoU) for a proposed USD 3.0 bn investment in an integrated electric-mobility ecosystem, encompassing vehicle production and solar-powered charging infrastructure. If implemented, such investments could stimulate demand for assembly plants, component-manufacturing facilities, warehouses, and distribution centres. The subsector's longer-term growth will depend on effective project implementation, local supplier development, access to affordable financing, and sustained demand for electric vehicles.
-
Data Centres
Data centres are an increasingly important component of Kenya’s industrial real estate sector, driven by the growing adoption of cloud computing, artificial intelligence (AI), fintech applications, and digital services, alongside rising demand for secure local data storage and low-latency connectivity. The Nairobi Metropolitan Area (NMA) remains the focal point for data centre development, supported by its established fibre-optic infrastructure, concentration of businesses and financial institutions, and connectivity to international submarine cable systems, including TEAMS and SEACOM. These factors position Nairobi as a strategic hub for serving enterprise, regional, and multinational clients. Major investments are reinforcing this position, including Africa Data Centres’ existing facilities and expansion plans, the development of a 44 MW data centre by Nxtra by Airtel Africa at Tatu City, and plans to expand iXAfrica’s Nairobi campus. These developments are expected to increase demand for specialised industrial facilities designed to accommodate high-density computing equipment, reliable power supply, advanced cooling systems, and robust security infrastructure. However, the sub-sector faces significant barriers, including i) high initial capital expenditure, ii) substantial electricity and cooling requirements, iii) the risk of power disruptions, and iv) the need for clear regulatory frameworks governing data centre operations, cybersecurity, and data protection. In this regard, the Communications Authority of Kenya’s proposed standalone licensing framework for data centres represents an important step towards clarifying regulatory requirements. Going forward, investment in reliable power infrastructure, energy-efficient cooling, resilient fibre connectivity, and regulatory clarity will be critical to attracting further investment and sustaining demand for specialised industrial real estate.
-
Ware Housing and Logistics/Ecommerce
The warehousing and logistics sub-sector are a key component of the Nairobi Metropolitan Area’s (NMA) industrial real estate market, driven by the expansion of e-commerce, fast-moving consumer goods (FMCG), agribusiness, and regional trade. The growth of online shopping has increased demand for warehouses, order fulfilment centres, and distribution hubs to support inventory management and last-mile delivery. E-commerce platforms such as Jumia and Kilimall, alongside delivery operators such as Glovo, rely on efficient logistics networks to fulfil orders and serve customers. For instance, Jumia operates an 11,000-square-metre integrated warehouse and logistics facility along Mombasa Road, which consolidates warehousing and fulfilment operations to improve delivery efficiency. This has increased demand for strategically located, modern warehouses that improve supply-chain efficiency.
Industrial developments such as Tatu City and Infinity Industrial Park in Athi River are supporting the provision of modern warehousing and logistics facilities, while specialized facilities such as Cold Solutions Kenya’s temperature-controlled warehouse at Tatu City cater to cold-chain storage requirements. However, the sub-sector faces constraints, including limited availability of Grade-A warehouses, high development costs, and inadequate road infrastructure in some emerging logistics hubs. Improving transport connectivity and increasing investment in modern facilities will be key to meeting rising demand and strengthening Nairobi’s position as a regional distribution hub.
-
Slaughter Houses
Slaughterhouses are an important component of industrial real estate in the Nairobi Metropolitan Area (NMA), supporting meat processing, cold storage, and distribution to domestic and export markets. Facilities in areas such as Kiamaiko, Burma, and Lucky Summer serve Nairobi’s meat supply chain, while demand for export-quality meat creates opportunities for modern abattoirs that meet stringent hygiene, veterinary, and halal certification requirements. Kenya’s export regulations require meat and meat products to originate from registered slaughterhouses, reinforcing the need for compliant processing facilities. However, environmental compliance remains a significant challenge. Inspections documented inadequate effluent treatment and improper disposal of blood, offal, and other waste at Kiamaiko, raising concerns over pollution of the Nairobi River and public health. These shortcomings highlight opportunities for investment in modern slaughterhouses equipped with wastewater treatment systems, hygienic processing areas, cold-chain facilities, and appropriate waste-management infrastructure. Nevertheless, high development and compliance costs, limited space in densely populated areas, inadequate access roads, and the risk of regulatory closures pose challenges to operators. Addressing these constraints through investment in purpose-built facilities, improved infrastructure, and effective environmental management would support a more efficient meat value chain while creating demand for specialized industrial real estate.
-
Special Economic Zones (SEZs) and Export Processing Zones (EPZs)
Special Economic Zones (SEZs) and Export Processing Zones (EPZs) are important components of the industrial real estate sector in the Nairobi Metropolitan Area (NMA), supporting industrialization, investment, and export-led economic growth. While both frameworks aim to attract local and foreign investors through fiscal and operational incentives, they differ in scope and objectives. SEZs accommodate a broader range of economic activities, including manufacturing, logistics, information and communications technology (ICT), agro-processing, and business services, while EPZs primarily focus on manufacturing and other approved activities for export markets. In Kenya, these zones support industrial development by providing an enabling business environment, facilitating investment, and promoting the establishment of modern industrial and commercial facilities.
The key benefits of operating within SEZs and EPZs include:
-
Tax and fiscal incentives: SEZ and EPZ enterprises benefit from preferential corporate tax rates, with SEZs offering rates of 10.0% for the first 10 years and 15.0% for the subsequent 10 years, while EPZs offer a 0.0% rate for the first 10 years and 25.0% for the subsequent 10 years. Both regimes apply a 30.0% rate thereafter. Other incentives include applicable import duty and VAT exemptions, while SEZs offer a 100.0% investment deduction on qualifying expenditure on buildings and machinery. These incentives lower operating costs, improve investment returns, and attract industrial investment.
-
Infrastructure development: SEZs and EPZs provide or facilitate access to serviced industrial land, factory premises, warehouses, utilities, telecommunications, and transport and logistics networks. Such infrastructure reduces the initial investment required to establish operations and supports efficient production, storage, and distribution. For industrial real estate investors, the availability of serviced land and purpose-built facilities enhances the attractiveness of designated zones to manufacturers, distributors, and logistics operators.
-
Simplified regulatory procedures: Streamlined licensing and administrative facilitation, including one-stop-shop services where available, help investors navigate business approvals, permits, and other regulatory requirements. This reduces administrative burdens and delays, improves the ease of establishing and operating businesses, and makes the zones more attractive to investors seeking predictable operating environments.
-
Increased foreign direct investment (FDI): Preferential incentives, supporting infrastructure, and streamlined administrative processes can attract domestic and international investors seeking competitive operating environments. Increased investment supports the establishment and expansion of manufacturing plants, warehouses, logistics facilities, and technology-based businesses, creating employment opportunities, facilitating technology transfer, and stimulating demand for industrial real estate.
-
Export promotion and trade facilitation: EPZs primarily support export-oriented production, while SEZs accommodate a wider range of economic activities serving domestic and international markets. Export-oriented enterprises may benefit from preferential market-access arrangements, such as the African Growth and Opportunity Act (AGOA), subject to prevailing eligibility and trade requirements. Access to imported inputs and efficient logistics infrastructure can improve production efficiency, strengthen competitiveness in international markets, and support integration into global value chains.
-
Economic diversification and industrial development: SEZs and EPZs encourage investment across manufacturing, agro-processing, textiles and apparel, pharmaceuticals, electronics, ICT, and logistics, helping diversify the economy and broaden its productive base. The concentration of businesses within designated zones also promotes industrial clustering, enabling enterprises to benefit from proximity to suppliers, service providers, labor markets, and transport networks. This can strengthen industrial linkages, create employment, and support the development of specialized industrial facilities.
Within the NMA, Tatu City and Konza Technopolis SEZs attract investment in manufacturing, technology, and logistics, while Athi River EPZ hosts export-oriented industries, particularly textiles, apparel, food processing, and assembly. These developments and the diversification of industrial activities continue to drive demand for modern factories, warehouses, and logistics facilities. However, the sub-sector faces challenges, including uncertainty surrounding preferential market access under arrangements such as AGOA, high export compliance costs, and infrastructure constraints. Addressing these through improved transport networks, reliable utilities, and serviced industrial land will be critical to attracting investment and sustaining demand for industrial real estate across the NMA
Section III: Demand Drivers, Challenges, Opportunities and Recent Developments in NMA Industrial Real Estate
The industrial real estate market in the Nairobi Metropolitan Area (NMA) is being shaped by improving financing conditions, expanding trade opportunities and sustained demand for modern industrial facilities. However, rising input costs, infrastructure constraints and power requirements continue to influence development viability. In 2026, the market is increasingly favoring modern, well-connected and energy-efficient facilities, creating opportunities for developers and investors while placing pressure on older industrial stock.
-
Demand Drivers
-
Lower borrowing costs: The Central Bank Rate (CBR) stood at 8.75% in June 2026 with the MPC holding the rate for the August 2026 and October 2026 meetings, while average lending rates declined by 0.7% points to 14.4% in Q3’2026 compared to 15.2% in Q3’2025. Lower financing costs can improve the feasibility of industrial property developments and support occupiers’ expansion plans, although the effect depends on construction costs, credit availability and expected rental returns.
-
Preferential Access to Export Markets: The extension of the African Growth and Opportunity Act (AGOA) to December 2028 provides continued preferential access to the United States market for eligible Kenyan exports. This supports export-oriented manufacturers, particularly apparel producers operating in Export Processing Zones (EPZs), and sustains demand for factory space and related logistics facilities. However, the benefits will depend on Kenya’s ability to maintain cost competitiveness and meet export requirements.
-
Manufacturing Policy and Investment: The Kenya Association of Manufacturers’ (KAM) Manufacturing Priority Agenda 2026 targets an increase in manufacturing’s contribution to gross domestic product (GDP) to above 20.0% by 2030. Progress towards this target could support demand for industrial facilities, particularly where policy measures translate into investment in production capacity, export competitiveness and local value chains.
-
Industrial Infrastructure and Institutional Investment: Industrial parks and special economic zones (SEZs), including Tatu City and Athi River Export Processing Zone, provide serviced sites and facilities for manufacturing, warehousing and logistics. The listing of the Africa Logistics Properties Industrial I-REIT on the Nairobi Securities Exchange (NSE) in March 2026 also provides a listed investment vehicle for exposure to income-generating logistics property, supporting the development of the sector’s investment market.
-
E-commerce and Supply-Chain Expansion: E-commerce, fast-moving consumer goods (FMCG), agribusiness and regional trade continue to increase the need for distribution centres, fulfilment warehouses and temperature-controlled storage. As businesses seek to improve inventory management and shorten delivery times, strategically located modern warehouses become increasingly important.
-
Key Challenges
-
High Development and Operating Costs: Construction costs, fuel prices, electricity expenses and financing costs can weaken project feasibility and increase the rental levels required to achieve target returns. These pressures may delay developments or constrain occupier expansion, particularly where rental growth cannot fully offset higher costs.
-
Electricity Reliability and Infrastructure Gaps: Industrial facilities depend on reliable power, road access, water and other essential services. Power constraints are particularly material for energy-intensive manufacturing and data centres, where interruptions can increase operating costs and disrupt production. Inadequate road connectivity and gaps in supporting infrastructure can also reduce the attractiveness of emerging industrial locations.
-
Exposure to Export-Market Concentration: Kenya’s apparel exports to the United States under AGOA declined by 4.1% to Kshs 58.1 bn in 2025, from Kshs 60.6 bn in 2024, despite the increase in employment among participating apparel enterprises. This divergence highlights the sector’s exposure to external demand and competitiveness pressures. A prolonged slowdown in export orders could constrain manufacturers’ space requirements and investment in production capacity.
-
Uneven Business Conditions: The Stanbic Bank Kenya Purchasing Managers’ Index (PMI) rose to 51.3 in September 2026, from 49.7 in August, indicating a return to private-sector expansion. However, rising operating costs continue to weigh on businesses. Therefore, stronger activity does not necessarily translate into an equivalent increase in industrial property demand, as occupiers must balance expansion plans against cost pressures.
-
Limited Availability of Suitable Grade-A Space: Although demand for modern industrial facilities is increasing, the availability of appropriately located, high-quality space remains an important consideration. Developers must also contend with land and construction costs, approval timelines and the provision of utilities. A mismatch between available space and occupier requirements could limit absorption even as overall demand grows.
-
Opportunities
-
Development and Refurbishment of Grade-A Warehouses: The need for modern, well-connected facilities creates opportunities to develop new warehouses and upgrade older properties. Projects that prioritize efficient layouts, loading facilities, security, power reliability and access to major transport routes are better positioned to attract and retain tenants.
-
Green and Energy-Efficient Industrial Buildings: Incorporating solar power, efficient lighting and other energy-saving systems can help manage operating costs and strengthen a property’s appeal to tenants. Green certification may also differentiate industrial assets in a market where occupiers increasingly consider building efficiency and sustainability.
-
Specialised Logistics and Cold-Chain Facilities: Growth in e-commerce, pharmaceuticals, food distribution and agribusiness create opportunities for purpose-built fulfilment centres, temperature-controlled warehouses and specialised storage. These facilities can serve requirements that conventional warehouses may not adequately meet, although their viability depends on suitable locations, reliable utilities and sufficient occupier demand.
-
Investment in EPZs and SEZs: Industrial zones, including Tatu City Special Economic Zone, and Athi Export Processing Zone, offer opportunities to accommodate manufacturing, processing and logistics activities. Their ability to attract sustained investment will depend on serviced land, transport connectivity, reliable utilities, regulatory efficiency and access to export markets.
-
Institutional Investment in Logistics Property: The listing of ALP I-REIT provides an avenue for investors to access logistics real estate through the capital markets. For the sector, broader institutional participation could support asset development and professional management, while investment performance will remain dependent on occupancy, rental income, asset quality and disciplined capital allocation.
-
Recent Developments
Below are some of the key developments witnessed throughout the year;
-
Listing of ALP I-REIT: Africa Logistics Properties’ Industrial Real Estate Investment Trust (ALP REIT) listed on the Nairobi Securities Exchange (NSE) on 11th March 2026, providing investors with a new avenue to access industrial and logistics real estate. The restricted offer comprised 30.0 mn units at USD 1.00 per unit, raising USD 29.6 mn at a subscription rate of 98.5%. Including 10.4 mn units issued to the promoter in exchange for initial properties, 39.6 mn units were listed. InfraCo Africa Investment Limited’s additional USD 5.0 mn commitment towards a pipeline asset raised overall subscription to 115.2%. The listing provides investors with access to income-generating warehouses while broadening funding channels for industrial real estate development in Kenya.
-
Digital Realty Opened NBO2 Data Centre: Digital Realty opened its 6.4 MW Nairobi Two (NBO2) data centre, expanding its Nairobi campus and strengthening the city’s digital infrastructure capacity. The development highlights growing investment in specialized facilities that require reliable power, cooling and connectivity, creating opportunities beyond conventional warehousing and manufacturing space.
-
Extension of AGOA: The extension of the African Growth and Opportunity Act (AGOA) to December 2028 maintains preferential access to the United States market for eligible Kenyan exports. This provides greater certainty for export-oriented manufacturers, particularly in the apparel sector, supporting investment in production facilities and demand for industrial space within Export Processing Zones (EPZs)
Section IV: Summary Performance of the NMA Industrial Sector in 2026:
-
Performance of Industrial Spaces in Kenya
Average rental prices for Industrial spaces in the Nairobi Metropolitan Area remains relatively unchanged from Kshs 431 per SQM recorded in 2025 whereas the average selling prices increased by marginally by 0.1% to Kshs 75,850 per SQM in 2026 from Kshs 75,800 per SQM recorded in 2025. The graph below shows average monthly rental prices within the Kenyan Industrial Real Estate Sector in 2026;
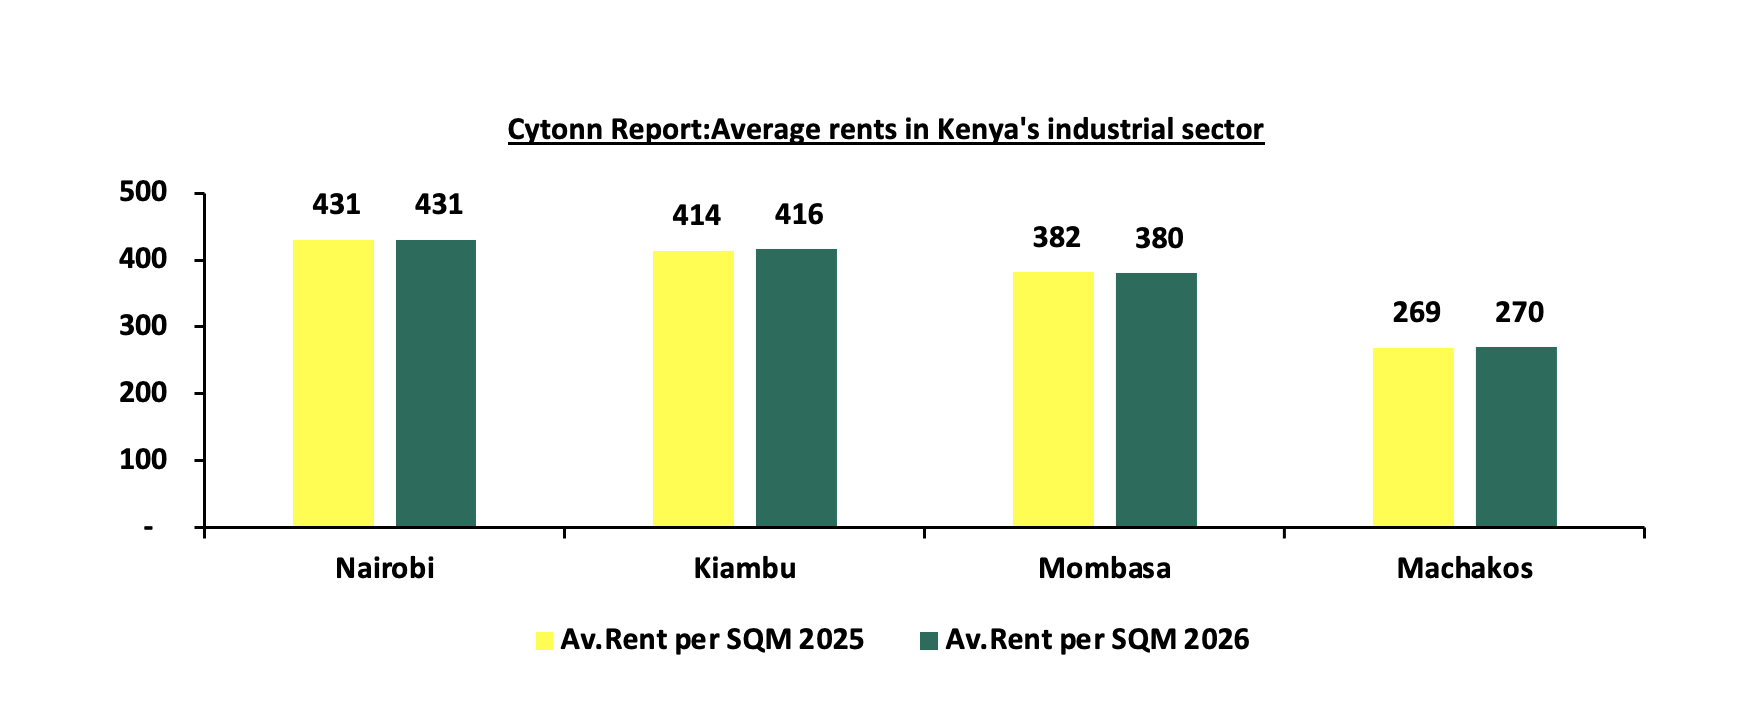
Source: Cytonn Research
The graph below shows average sale prices per Sqm within the Kenyan Industrial Real Estate Sector in 2026;
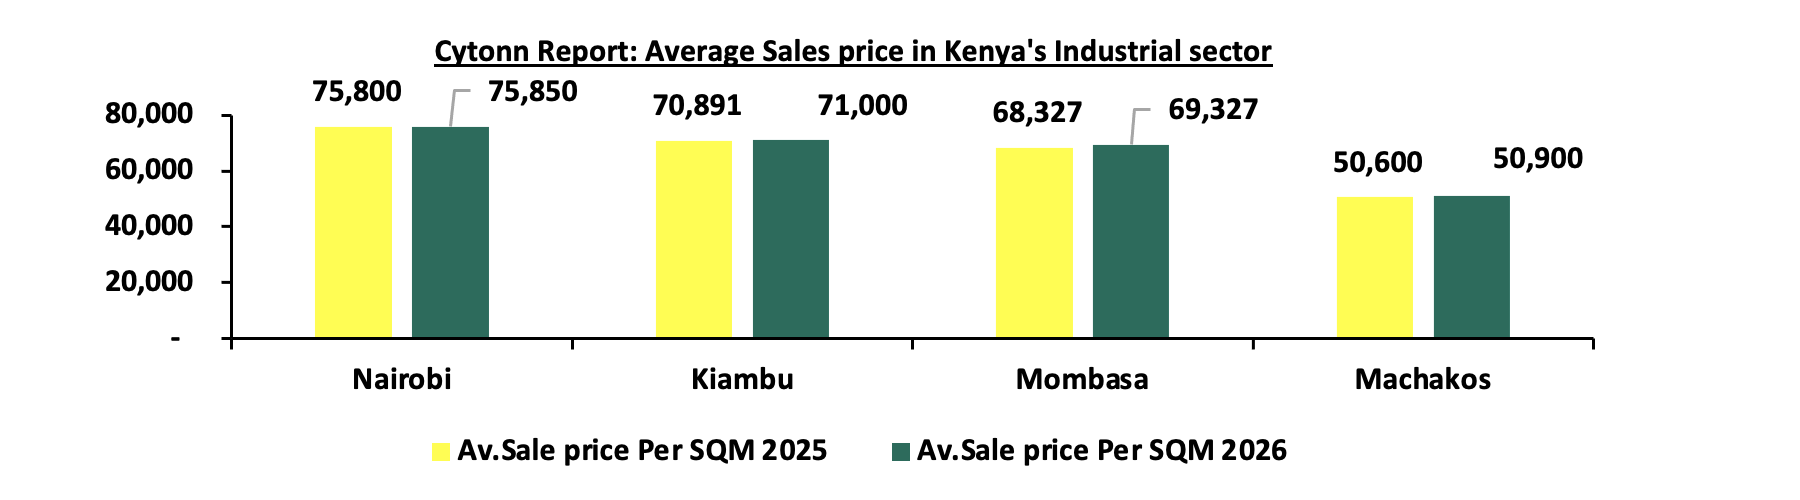
Source: Cytonn Research
The table below compares average monthly rents and selling prices per sqm for industrial space across Nairobi, Kiambu, Mombasa and Machakos in 2025 and 2026. Rents were largely stable, with the average unchanged at Kshs 374 per sqm, while average selling prices rose by 0.6% to Kshs 66,769 per sqm. Mombasa was the only market to record a rental decline, at 0.5% to Kshs 380 per sqm, although it posted the strongest increase in selling prices at 1.5%.
|
Cytonn Report: Average Rental and Sale Prices per sqm for Industrial Sector |
||||||
|
Area |
Av.Rent per SQM 2025 |
Av.Sale price Per SQM 2025 |
Av.Rent per SQM 2026 |
Av.Sale price Per SQM 2026 |
Y/Y Rental Prices Change |
Y/Y Sales Price Change |
|
Nairobi |
431 |
75,800 |
431 |
75,850 |
0.0% |
0.1% |
|
Kiambu |
414 |
70,891 |
416 |
71,000 |
0.4% |
0.2% |
|
Mombasa |
382 |
68,327 |
380 |
69,327 |
(0.5%) |
1.5% |
|
Machakos |
269 |
50,600 |
270 |
50,900 |
0.3% |
0.6% |
|
Average |
374 |
66,405 |
374 |
66,769 |
0.1% |
0.6% |
Source: Cytonn Research
The market’s performance and attractiveness to industrial occupiers are supported by several structural factors, including:
-
Transport infrastructure and connectivity: Nairobi benefits from an extensive road network, including major highways and bypasses, as well as access to the Standard Gauge Railway (SGR) and Jomo Kenyatta International Airport (JKIA). These connections facilitate the movement of raw materials, finished goods and exports, supporting demand for strategically located industrial facilities.
-
Strategic location and market access: Nairobi serve as a major commercial and logistics hub for Kenya and the wider East African region. Its connectivity to regional markets, supported by the East African Community (EAC) and the African Continental Free Trade Area (AfCFTA), creates opportunities for manufacturers and distribution businesses serving domestic and regional customers.
-
Access to utilities: Compared with more remote locations, established industrial areas within the NMA may benefit from better access to electricity, water and telecommunications infrastructure. However, power reliability, connection costs and utility capacity vary by location and remain important considerations for industrial occupiers.
-
Availability of skilled labour: Nairobi’s concentration of universities, technical institutions and vocational training centres provides a pool of talent for manufacturing, engineering, logistics and technology-related industries. This supports businesses requiring specialised skills and a reliable workforce.
-
Industrial zones and investment incentives: The NMA hosts established industrial areas and EPZs, particularly around Athi River, alongside SEZ developments such as Tatu City and Konza Technopolis. These zones can attract manufacturers and logistics operators through dedicated infrastructure, streamlined investment facilitation and applicable fiscal incentives, supporting demand for industrial land, factories and warehouses.
-
Political and institutional stability: Kenya’s established institutions and business environment support long-term investment decisions. However, political uncertainty and policy changes can still affect investor confidence and the timing of industrial property investments.
-
Performance of Industrial spaces in NMA by nodes
Industrial Area, Ruaraka and Mombasa Road areas, attract high rental and selling prices. Industrial area has the highest average rent per month of Kshs 561 per SQM and selling price of Kshs 90,568 per SQM contributable to factors such as proximity to the Jomo Kenyatta International Airport (JKIA), increased road and rail network such as the Mombasa Road, Eastern Bypass, SGR and the Nairobi Expressway. On the other hand, Mlolongo is the least performing node with monthly rates of Kshs 265 per SQM attributable to the distance from the CBD, increased freight costs, and limited road access. The graph below compares monthly rental performance of various nodes;
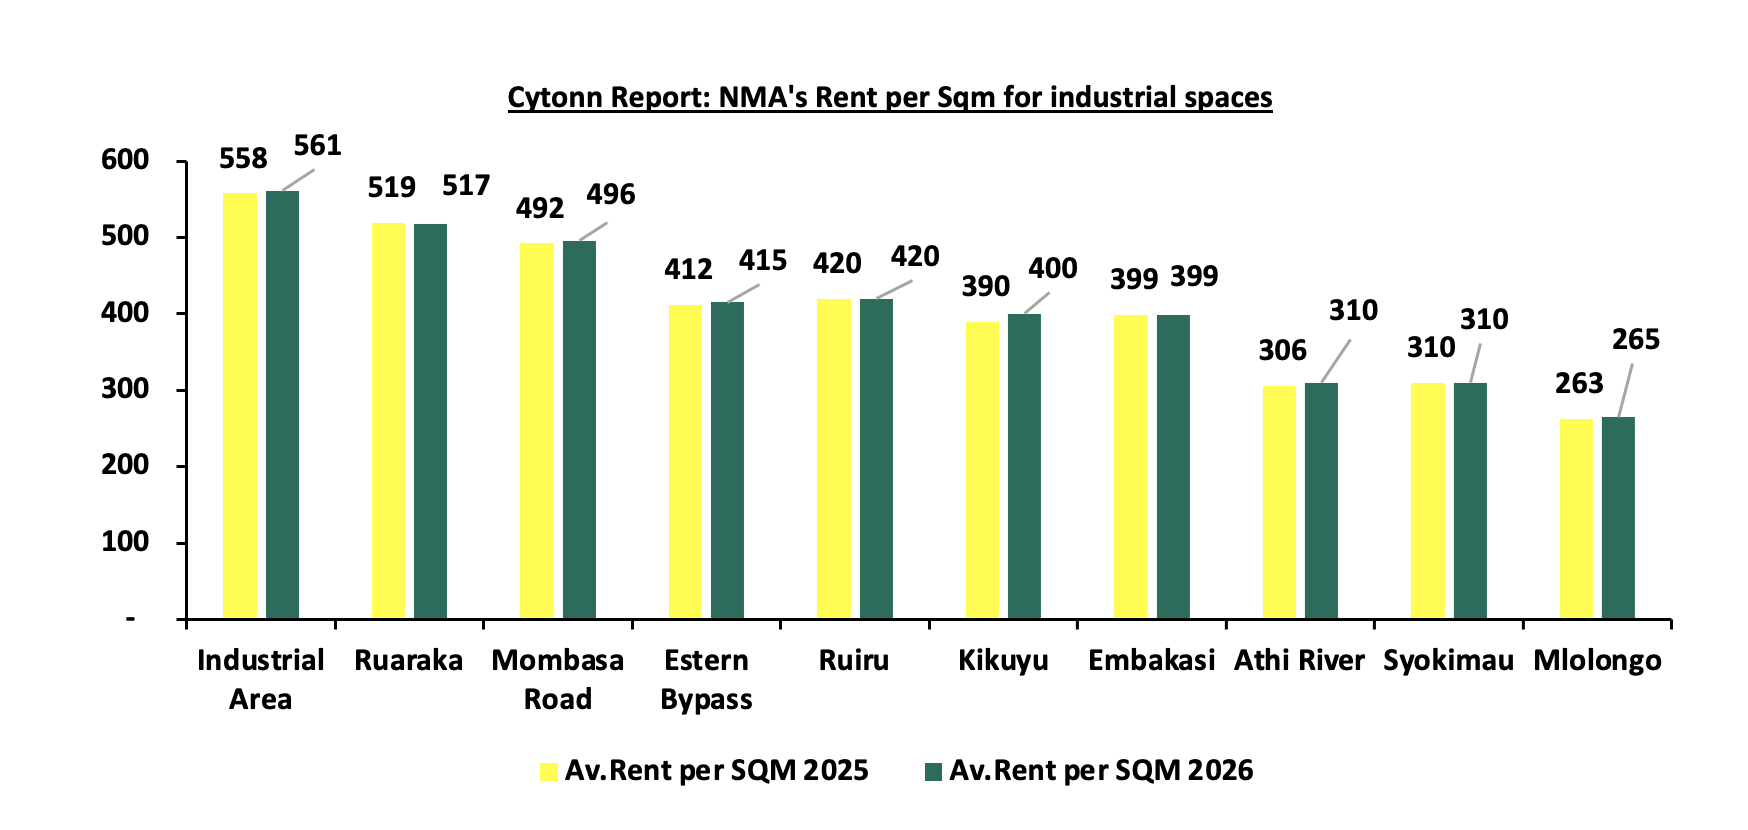
Source: Cytonn Research
The graph below compares various nodes performance in terms of selling prices within Nairobi Metropolitan Area (NMA).

Source: Cytonn Research
The table below compares average monthly rents and selling prices per sqm across the main industrial nodes in the NMA in 2025 and 2026. Average rents rose by 0.6% to Kshs 409 per sqm from Kshs 407 per sqm in 2025, while average selling prices declined by 0.6% to Kshs 56,642 per sqm from Kshs 56,966 per sqm in 2025, reflecting uneven performance across nodes. Kikuyu recorded the strongest rental growth at 2.6% but the sharpest fall in selling prices at 3.8%, while Ruiru and Ruaraka also saw selling prices decline. Athi River was the only node to record 1.4% and 1.8% increases in both rents and selling prices respectively.
|
Cytonn Report: Nairobi Metropolitan Area Nodes Rent and Prices per sqm |
||||||
|
Location |
Av.Rent per SQM 2025 |
Av.Sale price Per SQM 2025 |
Av.Rent per SQM 2026 |
Av.Sale price Per SQM 2026 |
Y/Y Rental Prices Change |
Y/Y Sales Price Change |
|
Industrial Area |
558 |
90,458 |
561 |
90,568 |
0.5% |
0.1% |
|
Ruaraka |
519 |
75,625 |
517 |
75,000 |
(0.4%) |
(0.8%) |
|
Mombasa Road |
492 |
74,625 |
496 |
74,630 |
0.7% |
0.0% |
|
Eastern Bypass |
412 |
49,583 |
415 |
49,783 |
0.7% |
0.4% |
|
Ruiru |
420 |
51,558 |
420 |
49,896 |
0.0% |
(3.2%) |
|
Kikuyu |
390 |
51,666 |
400 |
49,700 |
2.6% |
(3.8%) |
|
Embakasi |
399 |
51,983 |
399 |
51,985 |
0.0% |
0.0% |
|
Athi River |
306 |
39,657 |
310 |
40,355 |
1.4% |
1.8% |
|
Syokimau |
310 |
42,750 |
310 |
42,750 |
0.0% |
0.0% |
|
Mlolongo |
263 |
41,750 |
265 |
41,750 |
0.8% |
0.0% |
|
Average |
407 |
56,966 |
409 |
56,642 |
0.6% |
(0.6%) |
Source: Cytonn Research
Section V: Conclusion and Recommendations
Industrial real estate in the Nairobi Metropolitan Area (NMA) presents investment opportunities, although performance varies across nodes. Core nodes such as Industrial Area, Ruaraka and Mombasa Road command the highest rents and selling prices, with Industrial Area leading at Kshs 561 per sqm per month and Kshs 90,568 per sqm, respectively. Established occupier demand and strong transport connectivity support rental income, although high entry costs and limited land availability constrain investment opportunities.
Emerging nodes offer alternative investment opportunities. Athi River benefits from access to Mombasa Road, the Inland Container Depot and land for large-scale developments, while Ruiru and the Eastern Bypass offer potential for light manufacturing and warehousing. Tatu City in Ruiru attracts investors seeking modern industrial facilities, while Kikuyu, Syokimau and Mlolongo offer opportunities in industrial development and logistics. However, Mlolongo records the lowest rent, at Kshs 265 per sqm per month, making returns more dependent on tenant demand, infrastructure improvements and disciplined entry pricing.
We recommend that investors balance the established demand and relatively higher entry costs of core nodes against the growth potential and infrastructure risks of emerging nodes. Developers should prioritize reliable utilities, transport connectivity and facilities suited to occupier needs, while modernizing existing properties and adopting energy-efficient systems to manage costs. Investment decisions should be guided by location-specific demand, occupancy prospects, development costs and achievable rental yields rather than assumed capital appreciation alone.
Section VI: Outlook for the NMA Industrial Real Estate sector
We maintain a NEUTRAL outlook for the industrial real estate sector in the NMA, reflecting the balance between growing demand for modern industrial facilities and persistent challenges, including high development costs, infrastructure gaps and power reliability concerns. Going forward, we expect demand to be supported by: i) increasing investment in data centres, driven by the expansion of digital services; ii) rising demand for cold-chain facilities to support food distribution, pharmaceuticals and horticultural exports; iii) continued growth in e-commerce, which is increasing demand for quality warehouses and distribution centres; iv) government support for industrialization through Special Economic Zones (SEZs) and Export Processing Zones (EPZs); v) continued investment in industrial and logistics property by players such as Africa Logistics Properties (ALP); vi) Kenya’s position as a regional commercial and logistics hub, which supports its attractiveness to investors; and vii) initiatives to strengthen agricultural value chains and expand access to international markets for Kenyan produce.
However, the extent to which these drivers translate into stronger occupancy, rental growth and investment returns will depend on the resolution of infrastructure constraints, the reliability of utilities and the delivery of facilities that meet occupier requirements at competitive costs. These factors will remain central to the sector’s performance over the medium term.
Disclaimer: The views expressed in this publication are those of the writers where particulars are not warranted. This publication, which is in compliance with Section 2 of the Capital Markets Authority Act Cap 485A, is meant for general information only and is not a warranty, representation, advice, or solicitation of any nature. Readers are advised in all circumstances to seek the advice of a registered investment advisor.

- Talk to us
- Kenya
- P.O Box 20695 - 00200, Nairobi, Kenya
- Cell +254709101200
- Tel +254709101200
- WhatsApp +254741676635
- United States
- +254709101200
- DOWNLOAD OUR APP
-


- Kenya
- 8th Floor, Pinetree Plaza, Kaburu Drive, Ngong Road, Nairobi, Kenya
- USA
- Suite 1150, 1775 Eye Street NW, USA, Washington DC 20006, USA
- Investments
- High Yield
- Private Equity
- Real Estate
- Real Estate
- RiverRun Estates
- Cytonn Towers
- The Ridge
- Taraji Heights
- The Alma