Nairobi Metropolitan Area (NMA) Land Report 2024, & Cytonn Weekly #33/2024
By Research team, Aug 18, 2024
Executive Summary
Fixed Income
During the week, T-bills were oversubscribed for the fourth consecutive week, with the overall oversubscription rate coming in at 107.3%, albeit lower than the oversubscription rate of 163.7% recorded the previous week. Investors’ preference for the shorter 91-day paper persisted, with the paper receiving bids worth Kshs 10.5 bn against the offered Kshs 4.0 bn, translating to an oversubscription rate of 262.9%, albeit lower than the oversubscription rate of 313.7% recorded the previous week. The subscription rates for the 182-day and 364-day papers decreased to 110.4% and 41.8% respectively from the 193.1% and 74.4% respectively recorded the previous week. The government accepted a total of Kshs 25.6 bn worth of bids out of Kshs 25.7 bn bids received, translating to an acceptance rate of 99.5%. The yields on the government papers were on a downward trajectory, with the yields on the 364-day, 182-day, and 91-day papers decreasing by 4.8 bps, 0.7 bps, and 0.8 bps to 16.87%, 16.71%, and 15.81% respectively from 16.91%, 16.71% and 15.82% respectively recorded the previous week;
Also, during the week, the Central Bank of Kenya released the auction results for the re-opened bonds, IFB1/2023/6.5 with a tenor to maturity of 5.8 years, and a fixed coupon rate of 17.9% and IFB1/2023/17 with a tenor to maturity of 15.7 years, and a fixed coupon rate of 14.4%. The bonds were oversubscribed with the overall subscription rate coming in at 252.6%, receiving bids worth Kshs 126.3 bn against the offered Kshs 50.0 bn. The government accepted bids worth Kshs 88.7 bn, translating to an acceptance rate of 70.2%. The weighted average yield of accepted bids for the IFB1/2023/6.5 and the IFB1/2023/17 came in at 18.3% and 17.7% respectively. Notably, the average yield of 17.7% for the IFB1/2023/17 is 3.3% points higher than the average yield of 14.4% recorded the last time the bond was issued in April last year, while the average yield of 18.3% for the IFB1/2023/6.5 is 0.4% points higher than the average yield of 17.9% recorded the last time the bond was issued in November last year. With the Inflation rate at 4.3% as of July 2024, the real return of the IFB1/2023/6.5 and the IFB1/2023/17 is 14.0% and 13.4% respectively; Further, on a tax effected basis, the bonds are offering 21.5% and 20.8%, respectively;
During the week, The Energy and Petroleum Regulatory Authority (EPRA) released their monthly statement on the maximum retail fuel prices in Kenya, effective from 15th August 2024 to 14th September 2024. Notably, the maximum allowed price for Super Petrol, Diesel and Kerosene remained unchanged from the prices announced for the previous period. Consequently, Super Petrol, Diesel, and Kerosene will continue to retail at Kshs 188.8, Kshs 171.6, and Kshs 161.8 per litre respectively;
Additionally, during the week, the National Treasury gazetted the revenue and net expenditures for the first month of FY’2024/2025, ending 31st July 2024, highlighting that the total revenue collected as at the end of July 2024 amounted to Kshs 174.4 bn, equivalent to 6.6% of the revised estimates of Kshs 2,631.4 bn for FY’2024/2025 and is 79.5% of the prorated estimates of Kshs 219.3 bn;
Equities
During the week, the equities market recorded mixed performance, with NSE 20 gaining the most by 0.6%; NSE 25 and NASI gained by 0.4% and 0.2% each respectively, while NSE 10, declined marginally by 0.01%, taking the YTD performance to gains of 16.6%, 14.8%, 11.4% and 8.9% for NSE 10, NSE 25, NASI, and NSE 20 respectively. The equities market performance was driven by gains recorded by large-cap stocks such as COOP Bank, BAT, and DTB-K of 11.1%, 1.9%, and 1.3% respectively. The performance was however weighed down by losses recorded by large-cap stocks such as NCBA, EABL, and KCB Group of 1.1%, 0.7%, and 0.5% respectively;
During the week, Equity Group released its H1’2024 financial results, with its Core Earnings per Share (EPS) increasing by 12.5% to Kshs 7.8 from Kshs 7.0 in H1’2024, mainly driven by the 17.2% growth in total operating income to Kshs 97.1 bn, from Kshs 82.9 bn in H1’2023. Cooperative Bank of Kenya released its H1’2024 financial results, with its Core Earnings per Share (EPS) increasing by 7.0% to Kshs 2.2, from Kshs 2.1 in H1’2023, driven by the 10.9% increase in total operating income to Kshs 39.2 bn, from Kshs 35.4 bn in H1’2023;
Also, during the week, Sanlam Kenya Holdings released their H1’2024 results, recording a significant 264.1% increase in Profit After Tax to Kshs 0.3 bn, from the Kshs 0.2 bn loss recorded in H1’2023. The performance was mainly driven by a significant 316.9% increase in insurance investment revenue to Kshs 2.3 bn, from Kshs 0.6 bn in H1’2023, and supported by a 57.5% decrease in Net expenses from reinsurance contracts held to Kshs 0.1 bn in H1’2024, from Kshs 0.5 bn in H1’2023;
Real Estate
During the week, Knight Frank, an international Real Estate consultancy and management firm, released the Kenya Market Update H1’2024 Report highlighting the performance of key Real Estate sectors in the country. The report highlighted a rise in occupancy rates within the commercial office sector and an increased demand for industrial space in Kenya;
During the week, President William Ruto presided over the ground-breaking ceremony of Nyaribari Masaba Affordable Housing project in Nyaribari Masaba Constituency, Kisii County. The 244-housing unit project shall integrate social housing, affordable housing, and market housing units and will comprise 5 blocks of apartments. As well, the president Launched construction of Ogembo affordable housing project in Bomachoge Chache Constituency in Kisii County. The 200-unit housing project will employ more than 92 youths per day during the period of construction. The entire project is estimated to cost Kshs 616.4 mn;
During the week, President William Ruto oversaw ground breaking for the tarmacking of 65-Kilometre-long link roads in the area in Sombogo, Kitutu Chache and tarmacking of Metembe-Ngenyi/Bobaracho-Ititi/Rioma-Nyaore/Marani-Nyakoe Roads, Marani, Kisii County;
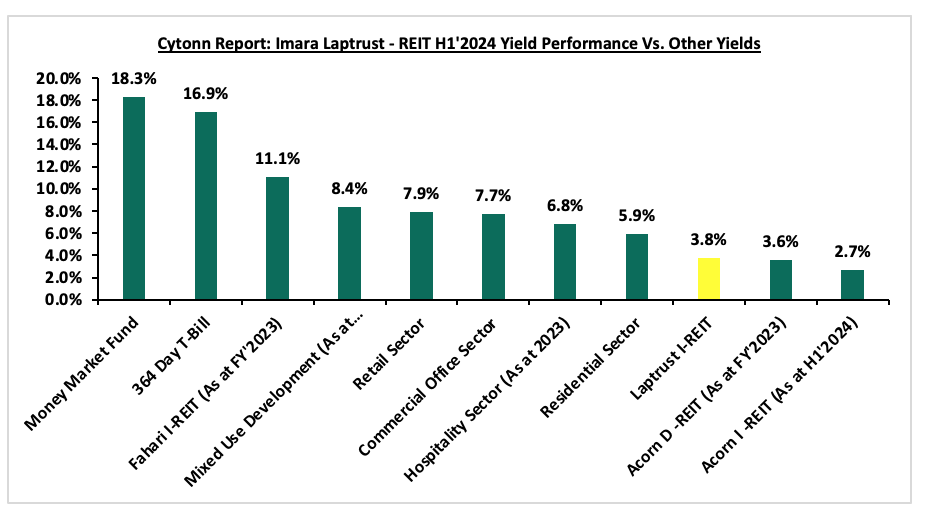
Under the Real Estate Investment Trusts during the week Laptrust Imara I-REIT released their H1’2024 financial performance,the REIT trustee approved an interim dividend of Kshs 0.4 per unit from the Kshs 129.9 Mn distributable earning which translated to an annualised yield rate of 3.8%. The REIT recorded a basic earnings per unit of Kshs 0.5 in H1’2024, a 63.0 % increase from 0.3 recorded in H1’2023. The performance was driven by a 63.0% increase in net earnings to Kshs 162.4 mn in H1’2024 from Kshs 99.6 mn recorded in H1’2023;
Additionally, on the Unquoted Securities Platform, Acorn D-REIT and I-REIT traded at Kshs 25.4 and Kshs 22.2 per unit, respectively, as per the last updated data on 9th August 2024. The performance represented a 27.0% and 11.0% gain for the D-REIT and I-REIT, respectively, from the Kshs 20.0 inception price. The volumes traded for the D-REIT and I-REIT came in at Kshs 12.3 mn and Kshs 31.6 mn shares, respectively, with a turnover of Kshs 311.5 mn and Kshs 702.7 mn, respectively, since inception in February 2021. Additionally, ILAM Fahari I-REIT traded at Kshs 11.0 per share as of 9th August, 2024, representing a 45.0% loss from the Kshs 20.0 inception price;
Focus of the Week
In July 2023, we released the Nairobi Metropolitan Area Land Report 2023, which highlighted that the Nairobi Metropolitan Area (NMA) land sector recorded an improvement in performance with the average annual price appreciation coming in at 4.5% in FY’2022/23, 1.3% points higher than the 3.2% appreciation recorded in FY’2021/22. This week, we update our report by analysing the overall performance of the NMA land sector over time, exploring the various factors that impact its performance, with a focus on selling prices and annual capital appreciation, and a look at the investment opportunities. Then we shall have a general outlook for the sector. During FY’2023/2024, the NMA land sector continued to show resilience in performance with the average Year-on-Year (y/y) price appreciation coming in at 3.9% in FY’2023/24, 0.6% slower than the 4.5% appreciation recorded in FY’2022/23. The average asking prices came in at Kshs 132.7 mn in FY’2023/24 from Kshs 128.6 mn in FY’2022/23. The performance also represented a 13-year average price appreciation CAGR of 8.2%, with the average selling price for land coming in at Kshs 132.7 mn in FY’2023/24, from Kshs 47.9 mn in 2011. This underscores the sustained and growing demand for land in the region;
Investment Updates:
- Weekly Rates:
- Cytonn Money Market Fund closed the week at a yield of 18.27% p.a., while Cytonn Money Market fund USD closed at 7.63%. To invest, dial *809# or download the Cytonn App from Google Play store here or from the Appstore here;
- We continue to offer Wealth Management Training every Monday, from 10:00 am to 12:00 pm. The training aims to grow financial literacy among the general public. To register for any of our Wealth Management Trainings, click here;
- If interested in our Private Wealth Management Training for your employees or investment group, please get in touch with us through wmt@cytonn.com;
- Cytonn Insurance Agency acts as an intermediary for those looking to secure their assets and loved ones’ future through insurance namely; Motor, Medical, Life, Property, WIBA, Credit and Fire and Burglary insurance covers. For assistance, get in touch with us through insuranceagency@cytonn.com;
- Cytonn Asset Managers Limited (CAML) continues to offer pension products to meet the needs of both individual clients who want to save for their retirement during their working years and Institutional clients that want to contribute on behalf of their employees to help them build their retirement pot. To more about our pension schemes, kindly get in touch with us through pensions@cytonn.com;
Real Estate Updates:
- For more information on Cytonn’s real estate developments, email us at sales@cytonn.com;
- Phase 3 of The Alma is now ready for occupation and the show house is open daily. To join the waiting list to rent, please email properties@cytonn.com;
- For Third Party Real Estate Consultancy Services, email us at rdo@cytonn.com;
- For recent news about the group, see our news section here;
Hospitality Updates:
- We currently have promotions for Staycations. Visit cysuites.com/offers for details or email us at sales@cysuites.com;
Money Markets, T-Bills Primary Auction:
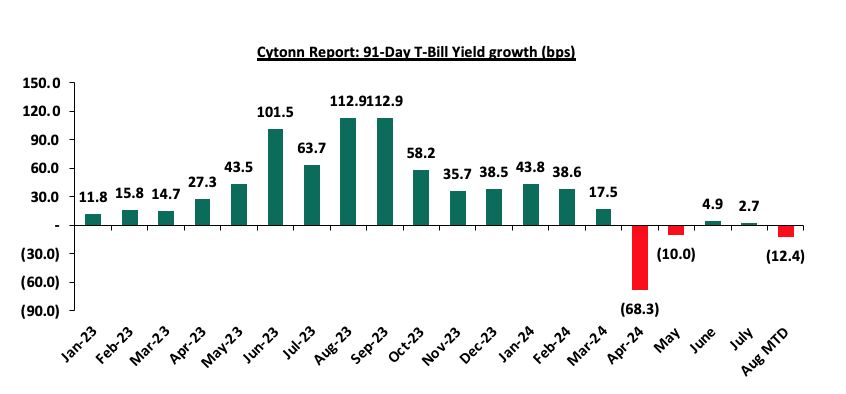
During the week, T-bills were oversubscribed for the fourth consecutive week, with the overall oversubscription rate coming in at 107.3%, albeit lower than the oversubscription rate of 163.7% recorded the previous week. Investors’ preference for the shorter 91-day paper persisted, with the paper receiving bids worth Kshs 10.5 bn against the offered Kshs 4.0 bn, translating to an oversubscription rate of 262.9%, albeit lower than the oversubscription rate of 313.7% recorded the previous week. The subscription rates for the 182-day and 364-day papers decreased to 110.4% and 41.8% respectively from the 193.1% and 74.4% respectively, recorded the previous week. The government accepted a total of Kshs 25.6 bn worth of bids out of Kshs 25.7 bn bids received, translating to an acceptance rate of 99.5%. The yields on the government papers were on a downward trajectory, with the yields on the 364-day, 182-day, and 91-day papers decreasing by 4.8 bps, 0.7 bps, and 0.8 bps to 16.87%, 16.71%, and 15.81% respectively from 16.91%, 16.71% and 15.82% respectively recorded the previous week. The chart below shows the yield growth rate for the 91-day paper over the period:
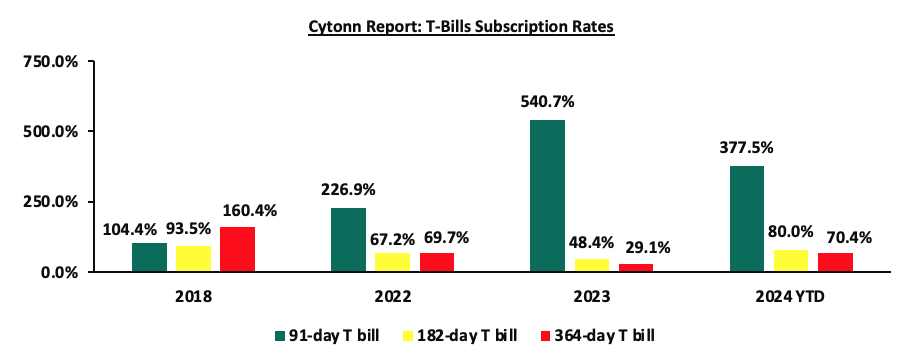
The chart below compares the overall average T-bill subscription rates obtained in 2018, 2022, 2023, and 2024 Year-to-date (YTD):
During the week, The Central Bank of Kenya released the auction results for the re-opened bonds, IFB1/2023/6.5 with a tenor to maturity of 5.8 years, and a fixed coupon rate of 17.9% and IFB1/2023/17 with a tenor to maturity of 15.7 years, and a fixed coupon rate of 14.4%. The bonds were oversubscribed with the overall subscription rate coming in at 252.6%, receiving bids worth Kshs 126.3 bn against the offered Kshs 50.0 bn. The government accepted bids worth Kshs 88.7 bn, translating to an acceptance rate of 70.2%. The weighted average yield of accepted bids for the IFB1/2023/6.5 and the IFB1/2023/17 came in at 18.3% and 17.7% respectively. Notably, the average yield of 17.7% for the IFB1/2023/17 is 3.3% points higher than the average yield of 14.4% recorded the last time the bond was issued in April last year, while the average yield of 18.3% for the IFB1/2023/6.5 is 0.4% points higher than the average yield of 17.9% recorded the last time the bond was issued in November last year. With the Inflation rate at 4.3% as of July 2024, the real return of the IFB1/2023/6.5 and the IFB1/2023/17 is 14.0% and 13.4% respectively. Further, on a tax effected basis, the bonds are offering 21.5% and 20.8%, respectively
Money Market Performance:
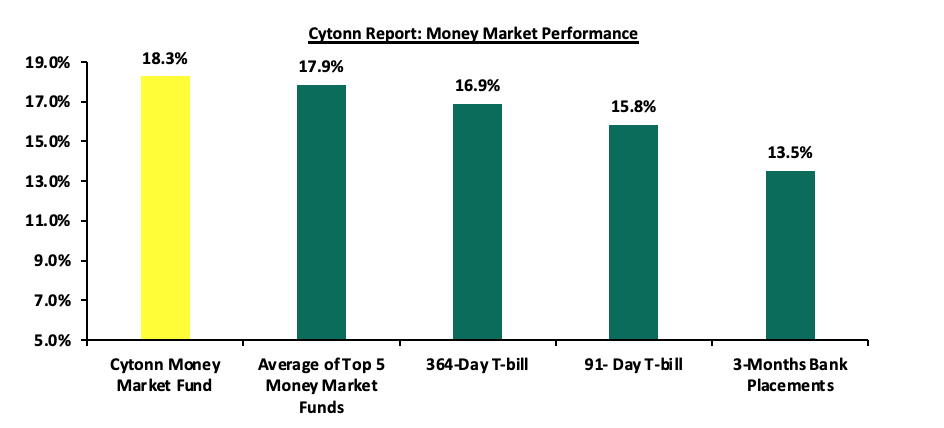
In the money markets, 3-month bank placements ended the week at 13.5% (based on what we have been offered by various banks), and the yields on the government papers were on a downward trajectory, with the yields on the 364-day and 91-day papers decreasing by 4.8 bps and 0.8 bps to remain relatively unchanged at 16.9% and 15.8% respectively, recorded the previous week. The yields on the Cytonn Money Market Fund increased marginally by 2.0 bps to close the week at 18.3% remaining relatively unchanged from last week, while the average yields on the Top 5 Money Market Funds increased by 5.6 bps to 17.9% from the 17.8% recorded the previous week.
The table below shows the Money Market Fund Yields for Kenyan Fund Managers as published on 16th August 2024:
|
Cytonn Report: Money Market Fund Yield for Fund Managers as published on 16th August 2024 |
||
|
Rank |
Fund Manager |
Effective Annual Rate |
|
1 |
Cytonn Money Market Fund (Dial *809# or download the Cytonn App) |
18.3% |
|
2 |
Lofty-Corban Money Market Fund |
18.2% |
|
3 |
Etica Money Market Fund |
18.2% |
|
4 |
Arvocap Money Market Fund |
17.4% |
|
5 |
Kuza Money Market fund |
17.2% |
|
6 |
GenAfrica Money Market Fund |
16.6% |
|
7 |
GenCap Hela Imara Money Market Fund |
16.2% |
|
8 |
Nabo Africa Money Market Fund |
16.2% |
|
9 |
Jubilee Money Market Fund |
16.1% |
|
10 |
Enwealth Money Market Fund |
16.0% |
|
11 |
KCB Money Market Fund |
15.9% |
|
12 |
Madison Money Market Fund |
15.7% |
|
13 |
Co-op Money Market Fund |
15.6% |
|
14 |
Absa Shilling Money Market Fund |
15.5% |
|
15 |
Apollo Money Market Fund |
15.5% |
|
16 |
Mayfair Money Market Fund |
15.4% |
|
17 |
Sanlam Money Market Fund |
15.3% |
|
18 |
Mali Money Market Fund |
15.2% |
|
19 |
AA Kenya Shillings Fund |
15.1% |
|
20 |
Dry Associates Money Market Fund |
13.9% |
|
21 |
ICEA Lion Money Market Fund |
13.7% |
|
22 |
CIC Money Market Fund |
13.7% |
|
23 |
Old Mutual Money Market Fund |
13.5% |
|
24 |
British-American Money Market Fund |
13.4% |
|
25 |
Orient Kasha Money Market Fund |
13.1% |
|
26 |
Equity Money Market Fund |
9.4% |
Source: Business Daily
Liquidity:
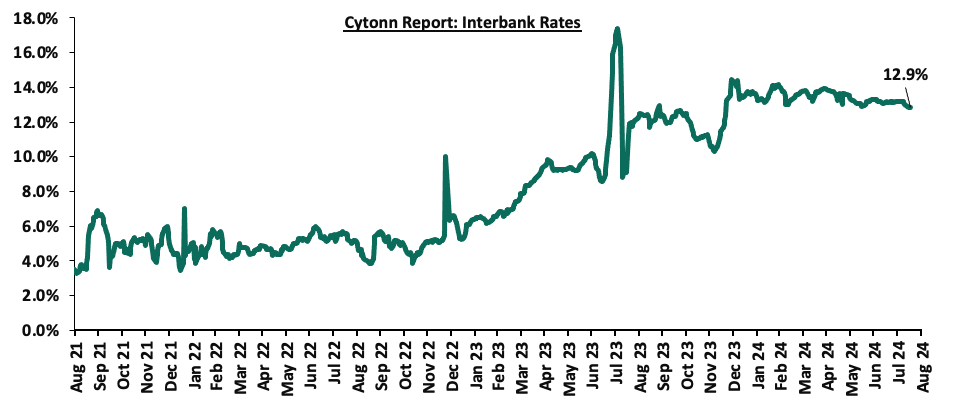
During the week, liquidity in the money markets eased, with the average interbank rate decreasing by 27.5 bps, to 12.9% from the 13.1% recorded the previous week, partly attributable to government payments that offset tax remittances. The average interbank volumes traded decreased by 23.1% to Kshs 25.9 bn from Kshs 33.7 bn recorded the previous week. The chart below shows the interbank rates in the market over the years:
Kenya Eurobonds:
During the week, the yields on Eurobonds were on a downward trajectory, with the yields on the 7-year Eurobond issued in 2019 decreasing the most by 80.9 bps to 10.6% from 11.4% recorded the previous week, attributable to improved investor sentiment following the recent quiet after the anti-finance bill protests. The table below shows the summary of the performance of the Kenyan Eurobonds as of 15th August 2024;
|
Cytonn Report: Kenya Eurobonds Performance |
||||||
|
|
2018 |
2019 |
2021 |
2024 |
||
|
Tenor |
10-year issue |
30-year issue |
7-year issue |
12-year issue |
13-year issue |
7-year issue |
|
Amount Issued (USD) |
1.0 bn |
1.0 bn |
0.9 bn |
1.2 bn |
1.0 bn |
1.5 bn |
|
Years to Maturity |
3.6 |
23.6 |
2.8 |
7.8 |
9.9 |
6.5 |
|
Yields at Issue |
7.3% |
8.3% |
7.0% |
7.9% |
6.2% |
10.4% |
|
01-Jan-24 |
9.8% |
10.2% |
10.1% |
9.9% |
9.5% |
|
|
01-Aug-24 |
10.7% |
11.1% |
10.6% |
11.0% |
10.9% |
11.1% |
|
8-Aug-24 |
11.5% |
11.6% |
11.4% |
11.6% |
11.3% |
11.5% |
|
12-Aug-24 |
11.3% |
11.4% |
11.0% |
11.3% |
11.3% |
11.5% |
|
13-Aug-24 |
11.1% |
11.3% |
10.9% |
11.3% |
11.2% |
11.4% |
|
14-Aug-24 |
10.9% |
11.1% |
10.6% |
11.0% |
10.9% |
11.1% |
|
15-Aug-24 |
10.8% |
11.1% |
10.6% |
10.9% |
10.8% |
11.1% |
|
Weekly Change |
(0.7%) |
(0.5%) |
(0.8%) |
(0.7%) |
(0.5%) |
(0.4%) |
|
MTD Change |
0.1% |
(0.0%) |
(0.0%) |
(0.1%) |
(0.1%) |
(0.0%) |
|
YTD Change |
1.0% |
0.9% |
0.5% |
1.0% |
1.3% |
11.1% |
Source: Central Bank of Kenya (CBK) and National Treasury
Kenya Shilling:
During the week, the Kenya Shilling appreciated against the US Dollar by 0.1%, to close at Kshs 129.1, from Kshs 129.3 recorded the previous week. On a year-to-date basis, the shilling has appreciated by 17.7% against the dollar, a contrast to the 26.8% depreciation recorded in 2023.
We expect the shilling to be supported by:
- Diaspora remittances standing at a cumulative USD 4,572.0 mn in the 12 months to July 2024, 12.2% higher than the USD 4,076.0 mn recorded over the same period in 2023, which has continued to cushion the shilling against further depreciation. In the July 2024 diaspora remittances figures, the US remained the largest source of remittances to Kenya accounting for 52.0% in the period, and,
- The tourism inflow receipts which came in at USD 352.5 bn in 2023, a 31.5% increase from USD 268.1 bn inflow receipts recorded in 2022, and owing to tourist arrivals that improved by 27.2% in the 12 months to June 2024, from the arrivals recorded during a similar period in 2023.
The shilling is however expected to remain under pressure in 2024 as a result of:
- An ever-present current account deficit which came at 3.2% of GDP in Q1’2024 from 3.0% recorded in Q1’2023,
- The need for government debt servicing, continues to put pressure on forex reserves given that 67.9% of Kenya’s external debt is US Dollar-denominated as of March 2024, and,
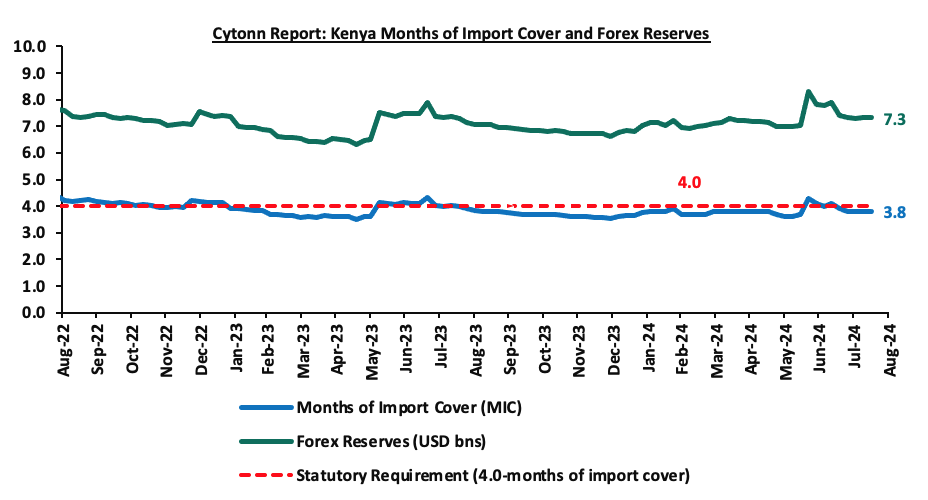
- Dwindling forex reserves currently at USD 7.3 bn (equivalent to 3.8-months of import cover), which is below the statutory requirement of maintaining at least 4.0-months of import cover, and also lower than EAC region’s convergence criteria of 4.5-months of import cover.
Key to note, Kenya’s forex reserves decreased marginally by 0.3% during the week to remain relatively unchanged at USD 7.3 bn recorded the previous week, equivalent to 3.8 months of import cover, remaining unchanged from last week, and below the statutory requirement of maintaining at least 4.0-months of import cover. The chart below summarizes the evolution of Kenya's months of import cover over the years:
Weekly Highlights
- EPRA Fuel Prices 14th August – 14th September 2024
During the week, The Energy and Petroleum Regulatory Authority (EPRA) released their monthly statement on the maximum retail fuel prices in Kenya, effective from 15th August 2024 to 14th September 2024. Notably, the maximum allowed price for Super Petrol, Diesel and Kerosene remained unchanged from the prices announced for the previous period. Consequently, Super Petrol, Diesel and Kerosene will continue to retail at Kshs 188.8, Kshs 171.6 and Kshs 161.8 per litre respectively.
Other key take-outs from the performance include;
- The average landing costs per cubic meter for Super Petrol decreased by 1.1% to USD 708.5 in July from USD 716.0 in June 2024, while landing costs for diesel and Kerosene increased by 1.6% and 1.9% respectively to USD 693.8 and USD 705.7 respectively from USD 682.7 and USD 692.8 recorded in June 2024,
- The Kenyan shilling depreciated against the US Dollar by 1.4% to Kshs 130.8 in July 2024, compared to the mean monthly exchange rate of Kshs 129.1 recorded in June 2024.
We note that fuel prices in the country have decreased in recent months largely due to the government's efforts to stabilize pump prices through the petroleum pump price stabilization mechanism which expended Kshs 9.9 bn in the FY2023/24 to cushion the increases applied to the petroleum pump prices, coupled with the ongoing appreciation of the Kenyan Shilling against the dollar and other major currencies, as well as a decrease in international fuel prices. Nevertheless, fuel prices in the country still remain under pressure from the high taxation of petroleum products as provided in the Finance Act 2023. Despite the act being declared unconstitutional by the Court of Appeal, the Energy & Regulatory Authority still charged the 16% VAT on fuel for this month’s prices. We expect that fuel prices will drop in the coming months if this ruling is obeyed, and also as a result of the government's efforts to mitigate the cost of petroleum through the pump price stabilization mechanism and strengthening of the Kenyan Shilling against the United States Dollar, having gained by 17.7% against the dollar on a year-to-date basis. As such, we expect the business environment in the country to improve as fuel is a major input cost, as well as further ease in inflationary pressures, with the inflation rate expected to remain within the CBK’s preferred target range of 2.5-7.5%.
- Exchequer Highlight
The National Treasury gazetted the revenue and net expenditures for the first month of FY’2024/2025, ending 31st July 2024. Below is a summary of the performance:
|
Cytonn Report: FY'2024/2025 Budget Outturn - As at 31st July 2024 |
||||||
|
Amounts in Kshs billions unless stated otherwise |
||||||
|
Item |
12-months Original Estimates |
Revised Estimates |
Actual Receipts/Release |
Percentage Achieved of the Revised Estimates |
Prorated |
% achieved of the Prorated |
|
Opening Balance |
|
|
1.2 |
|
|
|
|
Tax Revenue |
2,745.2 |
2,475.1 |
159.5 |
6.4% |
206.3 |
77.3% |
|
Non-Tax Revenue |
172.0 |
156.4 |
13.7 |
8.8% |
13.0 |
105.2% |
|
Total Revenue |
2,917.2 |
2,631.4 |
174.4 |
6.6% |
219.3 |
79.5% |
|
External Loans & Grants |
571.2 |
593.5 |
0.0 |
0.0% |
49.5 |
0.0% |
|
Domestic Borrowings |
828.4 |
978.3 |
10.4 |
1.1% |
81.5 |
12.8% |
|
Other Domestic Financing |
4.7 |
4.7 |
2.7 |
58.2% |
0.4 |
698.5% |
|
Total Financing |
1,404.3 |
1,576.5 |
13.1 |
0.8% |
131.4 |
10.0% |
|
Recurrent Exchequer issues |
1,348.4 |
1,307.9 |
53.0 |
4.1% |
109.0 |
48.6% |
|
CFS Exchequer Issues |
2,114.1 |
2,137.8 |
96.7 |
4.5% |
178.2 |
54.3% |
|
Development Expenditure & Net Lending |
458.9 |
351.3 |
1.0 |
0.3% |
29.3 |
3.5% |
|
County Governments + Contingencies |
400.1 |
410.8 |
30.8 |
7.5% |
34.2 |
90.1% |
|
Total Expenditure |
4,321.5 |
4,207.9 |
181.5 |
4.3% |
350.7 |
51.8% |
|
Fiscal Deficit excluding Grants |
1,404.3 |
1,576.5 |
7.1 |
0.5% |
131.4 |
5.4% |
|
Total Borrowing |
1,399.6 |
1,571.8 |
10.4 |
0.7% |
131.0 |
8.0% |
Amounts in Kshs bns unless stated otherwise
The Key take-outs from the release include;
- Total revenue collected as at the end of July 2024 amounted to Kshs 174.4 bn, equivalent to 6.6% of the revised estimates of Kshs 2,631.4 bn for FY’2024/2025 and is 79.5% of the prorated estimates of Kshs 219.3 bn. Cumulatively, tax revenues amounted to Kshs 159.5 bn, equivalent to 6.4% of the revised estimates of Kshs 2,475.1 bn and 77.3% of the prorated estimates of Kshs 206.3 bn,
- Total financing amounted to Kshs 13.1 bn, equivalent to 0.8% of the revised estimates of Kshs 1,576.5 bn and is equivalent to 10.0% of the prorated estimates of Kshs 131.4 bn. Additionally, domestic borrowing amounted to Kshs 10.4 bn, equivalent to 1.1% of the revised estimates of Kshs 978.3 bn and is 12.8% of the prorated estimates of Kshs 81.5 bn,
- The total expenditure amounted to Kshs 181.5 bn, equivalent to 4.3% of the revised estimates of Kshs 4207.9 bn, and is 51.8% of the prorated target expenditure estimates of Kshs 350.7 bn. Additionally, the net disbursements to recurrent expenditures came in at Kshs 53.0 bn, equivalent to 4.1% of the revised estimates of Kshs 1,307.9 and 48.6% of the prorated estimates of Kshs 109.0 bn,
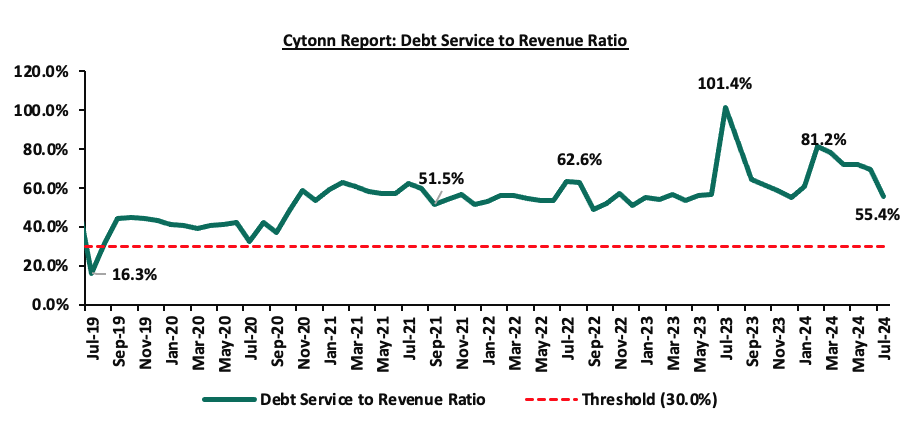
- Consolidated Fund Services (CFS) Exchequer issues came in at Kshs 96.7 bn, equivalent to 4.5% of the revised estimates of Kshs 2,137.8 bn, and are 54.3% of the prorated amount of Kshs 178.2 bn. The cumulative public debt servicing cost amounted to Kshs 96.7 bn which is 5.1% of the revised estimates of Kshs 1,910.5 bn, and is 60.7% of the prorated estimates of Kshs 159.2 bn. Additionally, the Kshs 96.7 bn debt servicing cost is equivalent to 55.4% of the actual revenues collected as at the end of July 2024. The chart below shows the debt serving to revenue ratio;
- Total Borrowings as at the end of July 2024 amounted to Kshs 10.4 bn, equivalent to 0.7% of the revised estimates of Kshs 1,571.8 bn for FY’2024/2025, and are 8.0% of the prorated estimates of Kshs 131.0 bn. The cumulative domestic borrowing of Kshs 978.3 bn comprises of Net Domestic Borrowing of Kshs 408.4 bn and Internal Debt Redemptions (Rollovers) of Kshs 569.9 bn.
The government was unable to meet its prorated revenue targets for the first month of the FY’2024/2025, attaining 79.5% of the revenue targets in July 2024, mainly on the back of the tough economic situation intensified by the anti-finance bill protests that rocked the country though the month, interrupting supply chains and disrupting normal business activities in the country. During the month, business environment deteriorated as evidenced by the PMI coming in at 43.1, below the 50.0 neutral, down from 47.2 in June 2024. Consequently, the government dropped the infamous finance bill of 2024 that sought to introduce additional revenue-raising measures, forcing it to look into major expenditure cuts. The government is, therefore, yet to streamline new strategies put in place to improve revenue collection such as expanding the revenue base and sealing tax leakages, and suspension of tax relief payments and reduction of tax expenditure. The coming months' revenue collection performance will largely depend on how quickly the country's business climate stabilizes, and the measures the government will put in place to cover for the revenue collection measures lost in both the Finance Bill of 2024 and Finance Act of 2023, which was declared unconstitutional by the courts. This stabilization is expected to be aided by the ongoing appreciation of the Shilling, which despite depreciating by 0.3% against the dollar in the month of July, has recorded a 17.7% appreciation on Year-to-date basis, coupled with a further ease in inflationary pressures in the country.
Rates in the Fixed Income market have been on an upward trend given the continued high demand for cash by the government and the occasional liquidity tightness in the money market. The government is 150.3% ahead of its prorated net domestic borrowing target of Kshs 57.7 bn, having a net borrowing position of Kshs 144.5 bn. However, we expect a downward readjustment of the yield curve in the short and medium term, with the government looking to increase its external borrowing to maintain the fiscal surplus, hence alleviating pressure in the domestic market. As such, we expect the yield curve to normalize in the medium to long-term and hence investors are expected to shift towards the long-term papers to lock in the high returns.
Market Performance:
During the week, the equities market recorded mixed performance, with NSE 20 gaining the most by 0.6%; NSE 25 and NASI gained by 0.4% and 0.2% each respectively, while NSE 10, declined marginally by 0.01%, taking the YTD performance to gains of 16.6%, 14.8%, 11.4% and 8.9% for NSE 10, NSE 25, NASI, and NSE 20 respectively. The equities market performance was driven by gains recorded by large-cap stocks such as COOP Bank, BAT, and DTB-K of 11.1%, 1.9%, and 1.3% respectively. The performance was however weighed down by losses recorded by large-cap stocks such as NCBA, EABL, and KCB Group of 1.1%, 0.7%, and 0.5% respectively.
During the week, equities turnover decreased by 59.0% to USD 6.1 mn from USD 14.8 mn recorded the previous week, taking the YTD total turnover to USD 416.6 mn. Foreign investors remained net buyers for the second consecutive week, with a net buying position of USD 0.4 mn, from a net buying position of USD 3.1 mn recorded the previous week, taking the YTD foreign net buying position to USD 4.4 mn.
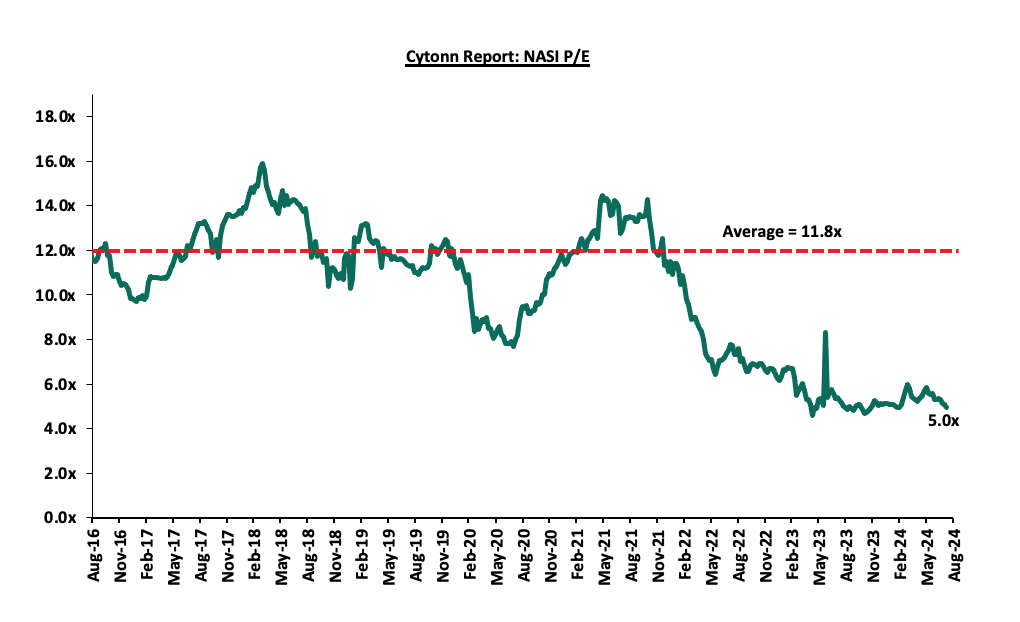
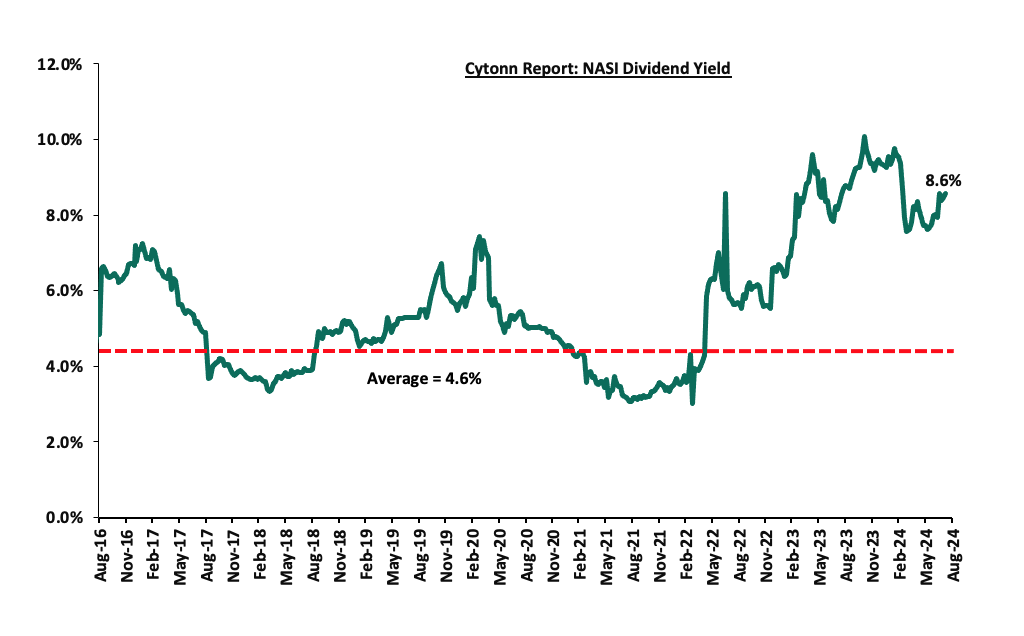
The market is currently trading at a price-to-earnings ratio (P/E) of 5.0x, 57.6% below the historical average of 11.8x. The dividend yield stands at 8.6%, 4.0% points above the historical average of 4.6%. Key to note, NASI’s PEG ratio currently stands at 0.6x, an indication that the market is undervalued relative to its future growth. A PEG ratio greater than 1.0x indicates the market is overvalued while a PEG ratio less than 1.0x indicates that the market is undervalued. The charts below indicate the historical P/E and dividend yields of the market;
Universe of Coverage:
|
Cytonn Report: Equities Universe of Coverage |
||||||||||
|
Company |
Price as at 09/08/2024 |
Price as at 16/08/2024 |
w/w change |
YTD Change |
Year Open 2024 |
Target Price* |
Dividend Yield |
Upside/ Downside** |
P/TBv Multiple |
Recommendation |
|
Jubilee Holdings |
152.5 |
164.0 |
7.5% |
(11.4%) |
185.0 |
260.7 |
8.7% |
67.7% |
0.3x |
Buy |
|
Equity Group*** |
40.0 |
40.0 |
0.1% |
17.0% |
34.2 |
60.2 |
10.0% |
60.5% |
0.8x |
Buy |
|
KCB Group*** |
30.0 |
29.9 |
(0.5%) |
36.0% |
22.0 |
46.7 |
0.0% |
56.3% |
0.5x |
Buy |
|
Diamond Trust Bank*** |
45.0 |
45.6 |
1.3% |
1.9% |
44.8 |
65.2 |
11.0% |
53.9% |
0.2x |
Buy |
|
NCBA*** |
39.5 |
39.0 |
(1.1%) |
0.4% |
38.9 |
55.2 |
12.2% |
53.7% |
0.7x |
Buy |
|
Co-op Bank*** |
12.7 |
12.8 |
1.2% |
12.8% |
11.4 |
17.2 |
11.7% |
46.1% |
0.6x |
Buy |
|
Stanbic Holdings |
117.0 |
116.8 |
(0.2%) |
10.1% |
106.0 |
145.3 |
13.1% |
37.6% |
0.8x |
Buy |
|
CIC Group |
2.0 |
2.2 |
7.0% |
(6.1%) |
2.3 |
2.8 |
6.0% |
36.3% |
0.7x |
Buy |
|
I&M Group*** |
20.4 |
20.6 |
1.2% |
18.1% |
17.5 |
25.5 |
12.4% |
36.2% |
0.4x |
Buy |
|
ABSA Bank*** |
14.0 |
14.1 |
0.4% |
21.6% |
11.6 |
17.3 |
11.0% |
34.2% |
1.1x |
Buy |
|
Britam |
5.5 |
5.6 |
2.5% |
9.7% |
5.1 |
7.5 |
0.0% |
33.0% |
0.8x |
Buy |
|
Target Price as per Cytonn Analyst estimates **Upside/ (Downside) is adjusted for Dividend Yield ***For Disclosure, these are stocks in which Cytonn and/or its affiliates are invested in |
||||||||||
Weekly Highlights
Earnings Release
- Equity Group Kenya H1’2024 Financial Performance
During the week, Equity Group released their H1’2024 financial results. Below is a summary of the performance:
|
Balance Sheet Items |
H1’2023 |
H1’2024 |
y/y change |
|
Government Securities |
278.5 |
264.3 |
(5.1%) |
|
Net Loans and Advances |
817.2 |
791.1 |
(3.2%) |
|
Total Assets |
1,644.8 |
1,746.0 |
6.2% |
|
Customer Deposits |
1,175.3 |
1,299.5 |
10.6% |
|
Deposits per branch |
3.5 |
3.7 |
5.3% |
|
Total Liabilities |
1,450.5 |
1,525.5 |
5.2% |
|
Shareholders’ Funds |
186.1 |
211.1 |
13.4% |
|
Balance Sheet Ratios |
H1’2023 |
H1’2024 |
% points change |
|
Loan to Deposit Ratio |
69.5% |
60.9% |
(8.7%) |
|
Dovernment Securities to Deposits |
34.1% |
33.4% |
(0.7%) |
|
Return on average equity |
29.1% |
23.7% |
(5.4%) |
|
Return on average assets |
3.2% |
2.8% |
(0.4%) |
|
Income Statement |
H1’2023 |
H1’2024 |
y/y change |
|
Net Interest Income |
46.4 |
54.4 |
17.2% |
|
Net non-Interest Income |
36.5 |
42.8 |
17.2% |
|
Total Operating income |
82.9 |
97.1 |
17.2% |
|
Loan Loss provision |
(7.1) |
(10.5) |
48.3% |
|
Total Operating expenses |
(47.7) |
(60.0) |
25.7% |
|
Profit before tax |
35.2 |
37.2 |
5.7% |
|
Profit after tax |
26.3 |
29.6 |
12.5% |
|
Core EPS |
7.0 |
7.8 |
12.5% |
|
Income Statement Ratios |
H1’2023 |
H1’2024 |
% points change |
|
Yield from interest-earning assets |
10.4% |
10.5% |
0.1% |
|
Cost of funding |
3.4% |
4.2% |
0.9% |
|
Cost of risk |
8.6% |
10.8% |
2.3% |
|
Net Interest Margin |
7.2% |
3.7% |
(3.4%) |
|
Net Interest Income as % of operating income |
56.0% |
56.0% |
(0.0%) |
|
Non-Funded Income as a % of operating income |
44.0% |
44.0% |
0.0% |
|
Cost to Income Ratio |
57.6% |
61.7% |
4.2% |
|
CIR without LLP |
49.0% |
50.9% |
1.9% |
|
Cost to Assets |
2.7% |
2.9% |
0.2% |
|
Capital Adequacy Ratios |
H1’2023 |
H1’2024 |
% Points Change |
|
Core Capital/Total Liabilities |
17.9% |
17.4% |
(0.5%) |
|
Minimum Statutory ratio |
8.0% |
8.0% |
0.0% |
|
Excess |
9.9% |
9.4% |
(0.5%) |
|
Core Capital/Total Risk Weighted Assets |
15.0% |
15.8% |
0.8% |
|
Minimum Statutory ratio |
10.5% |
10.5% |
0.0% |
|
Excess |
4.5% |
5.3% |
0.8% |
|
Total Capital/Total Risk Weighted Assets |
19.0% |
18.4% |
(0.6%) |
|
Minimum Statutory ratio |
14.5% |
14.5% |
0.0% |
|
Excess |
4.5% |
3.9% |
(0.6%) |
|
Liquidity Ratio |
51.1% |
56.7% |
5.6% |
|
Minimum Statutory ratio |
20.0% |
20.0% |
0.0% |
|
Excess |
31.1% |
36.7% |
5.6% |
Key Take-Outs:
- Increase in Earnings - Core earnings per share increased by 12.5% to Kshs 7.8 from Kshs 7.0 in H1’2024, mainly driven by the 17.2% growth in total operating income to Kshs 97.1 bn, from Kshs 82.9 bn in H1’2023. However, the performance was weighed down by a 25.7% growth in total operating expenses to Kshs 60.0 bn, from Kshs 47.7 bn in H1’2023, and,
- Increased Provisioning – On the back of high credit risk still attached to the country despite the improvement in business environment in H1’2024, the bank increased its provisions holdings to cover for the anticipated losses in the future, with its general provisions increasing significantly by 48.3% to Kshs 10.5 bn from Kshs 7.1 bn recorded in H1’2023.
For a more detailed analysis, please see the Equity Group’s H1’2024 Earnings Note
- Co-operative Bank of Kenya’s H1’2024 Financial Performance
During the week, Co-operative Bank of Kenya released their H1’2024 financial results. Below is a summary of the performance:
|
Balance Sheet |
H1'2023 (Kshs bn) |
H1'2024 (Kshs bn) |
y/y change |
|
Kenya Government Securities |
188.5 |
202.2 |
7.3% |
|
Net Loans and Advances |
365.4 |
375.6 |
2.8% |
|
Total Assets |
664.9 |
716.9 |
7.8% |
|
Customer Deposits |
463.9 |
507.4 |
9.4% |
|
Deposits Per Branch |
2.5 |
2.6 |
7.1% |
|
Total Liabilities |
556.4 |
589.8 |
6.0% |
|
Shareholders' Funds |
108.3 |
126.7 |
17.0% |
|
Key Ratios |
H1'2023 |
H1'2024 |
% point change |
|
Loan to Deposit ratio |
78.8% |
74.0% |
(4.7%) |
|
Government Securities to Deposits ratio |
40.6% |
39.9% |
(0.8%) |
|
Return on Average Equity |
22.2% |
19.5% |
(2.7%) |
|
Return on Average Assets |
3.6% |
3.3% |
(0.3%) |
|
Income Statement |
H1'2023 (Kshs bn) |
H1'2024 (Kshs bn) |
y/y change |
|
Net interest Income |
21.5 |
23.9 |
10.7% |
|
Net non-interest income |
13.8 |
15.4 |
11.2% |
|
Total Operating income |
35.4 |
39.2 |
10.9% |
|
Loan loss provision |
(2.9) |
(3.0) |
4.9% |
|
Total Operating expenses |
(19.1) |
(21.3) |
11.1% |
|
Profit before tax |
16.4 |
18.2 |
10.7% |
|
Profit after tax |
12.1 |
13.0 |
7.0% |
|
Core EPS |
2.1 |
2.2 |
7.0% |
|
Income Statement Ratios |
H1'2023 |
H1'2024 |
y/y change |
|
Yield from interest-earning assets |
11.6% |
12.7% |
1.0% |
|
Cost of funding |
3.8% |
5.4% |
1.6% |
|
Net Interest Spread |
7.8% |
7.3% |
(0.5%) |
|
Net Interest Income as % of operating income |
60.9% |
60.8% |
(0.1%) |
|
Non-Funded Income as a % of operating income |
39.1% |
39.2% |
0.1% |
|
Cost to Income |
54.1% |
54.2% |
0.1% |
|
CIR without provisions |
46.0% |
46.6% |
0.5% |
|
Cost to Assets |
2.4% |
2.5% |
0.1% |
|
Net Interest Margin |
8.2% |
7.8% |
(0.4%) |
|
Capital Adequacy Ratios |
H1'2023 |
H1'2024 |
% points change |
|
Core Capital/Total Liabilities |
21.2% |
23.1% |
1.9% |
|
Minimum Statutory ratio |
8.0% |
8.0% |
|
|
Excess |
13.2% |
15.1% |
1.9% |
|
Core Capital/Total Risk Weighted Assets |
16.5% |
18.1% |
1.6% |
|
Minimum Statutory ratio |
10.5% |
10.5% |
|
|
Excess |
6.0% |
7.6% |
1.6% |
|
Total Capital/Total Risk Weighted Assets |
20.5% |
21.3% |
0.8% |
|
Minimum Statutory ratio |
14.5% |
14.5% |
|
|
Excess |
6.0% |
6.8% |
0.8% |
|
Liquidity Ratio |
52.3% |
54.0% |
1.7% |
|
Minimum Statutory ratio |
20.0% |
20.0% |
|
|
Excess |
32.3% |
34.0% |
1.7% |
Key Take-Outs:
- Increased earnings - Core earnings per share (EPS) grew by 7.0% to Kshs 2.2, from Kshs 2.1 in H1’2023, driven by the 10.9% increase in total operating income to Kshs 39.2 bn, from Kshs 35.4 bn in H1’2023,
- Deteriorated asset quality – The bank’s Asset Quality deteriorated, with Gross NPL ratio increasing to 16.7% in H1’2024, from 14.6% in H1’2023, attributable to a 19.0% increase in Gross non-performing loans to Kshs 69.9 bn, from Kshs 58.4 bn in H1’2023, compared to the 4.0% increase in gross loans to Kshs 417.0 bn, from Kshs 400.9 bn recorded in H1’2023, and,
- Expanded Balanced sheet - The balance sheet recorded an expansion as total assets grew by 7.8% to Kshs 716.9 bn, from Kshs 664.9 bn in H1’2024, driven by a 7.3% increase in government securities to Kshs 202.2 bn, from 188.5 bn in H1’2023, coupled with a 2.8% increase in net loans and advances to customers to Kshs 375.6 bn, from Kshs 365.4 bn in H1’2023.
For a more detailed analysis, please see the Cooperative Bank of Kenya’s H1’2024 Earnings Note
Asset Quality:
The table below shows the asset quality of listed banks that have released their H1’2024 results using several metrics:
|
Cytonn Report: Listed Banks Asset Quality in H1’2024 |
||||||
|
|
H1'2024 NPL Ratio* |
H1'2023 NPL Ratio** |
% point change in NPL Ratio |
H1'2024 NPL Coverage* |
H1'2023 NPL Coverage** |
% point change in NPL Coverage |
|
Stanbic Bank |
9.5% |
9.2% |
0.3% |
75.0% |
57.4% |
17.6% |
|
Equity Group |
13.9% |
11.2% |
2.7% |
58.8% |
54.5% |
4.3% |
|
Co-operative Bank of Kenya |
16.7% |
14.6% |
2.1% |
59.5% |
60.7% |
(1.2%) |
|
Mkt Weighted Average* |
14.0% |
12.7% |
1.3% |
61.3% |
60.1% |
1.2% |
|
*Market cap weighted as at 16/08/2024 |
||||||
|
**Market cap weighted as at 21/09/2023 |
||||||
Key take-outs from the table include;
- Asset quality for the listed banks that have released declined during H1’2024, with market-weighted average NPL ratio increasing by 1.3% points to 14.0% from 12.7% in H1’2023, and,
- Market-weighted average NPL Coverage for the listed banks that have released results increased by 1.2% points to 61.3% in H1’2024 from 60.1% recorded in H1’2023. The increase was attributable to Stanbic Holdings’ coverage ratio increasing by 17.6% to 75.0% from 57.4% in H1’2023, coupled with Equity Group’s NPL coverage ratio increasing by 4.3% points to 58.8% from 54.5% in H1’2023. The performance was however weighed down by Cooperative Bank’s NPL Coverage ratio decreasing by 1.2% points to 59.5% from 60.7% in H1’2023.
Summary Performance
The table below shows the performance of listed banks that have released their H1’2024 results using several metrics:
|
Cytonn Report: Listed Banks Performance in H1’2024 |
|||||||||||||
|
Bank |
Core EPS Growth |
Interest Income Growth |
Interest Expense Growth |
Net Interest Income Growth |
Net Interest Margin |
Non-Funded Income Growth |
NFI to Total Operating Income |
Growth in Total Fees & Commissions |
Deposit Growth |
Growth in Government Securities |
Loan to Deposit Ratio |
Loan Growth |
Return on Average Equity |
|
Stanbic Holdings |
2.3% |
49.1% |
154.3% |
4.2% |
7.9% |
(15.1%) |
37.6% |
(6.3%) |
30.3% |
(21.0%) |
67.0% |
(2.4%) |
18.5% |
|
Equity Group |
12.5% |
21.5% |
30.1% |
17.2% |
7.7% |
17.2% |
44.0% |
15.5% |
10.6% |
(5.1%) |
60.9% |
(3.2%) |
23.7% |
|
Co-operative Bank of Kenya |
7.0% |
24.4% |
52.6% |
10.7% |
7.8% |
11.2% |
39.2% |
4.4% |
9.4% |
7.3% |
74.0% |
2.8% |
20.5% |
|
H1'24 Mkt Weighted Average* |
9.3% |
27.0% |
57.4% |
13.2% |
7.8% |
10.1% |
41.6% |
8.8% |
13.6% |
(4.4%) |
65.5% |
(1.4%) |
21.9% |
|
H1'23 Mkt Weighted Average** |
14.3% |
28.2% |
44.8% |
21.0% |
7.3% |
27.9% |
38.9% |
26.6% |
21.3% |
5.3% |
72.3% |
20.5% |
22.9% |
|
*Market cap weighted as at 16/08/2024 |
|||||||||||||
|
**Market cap weighted as at 21/09/2023 |
|||||||||||||
- Sanlam Kenya Holdings Plc H1’2024 Financial Results.
During the week, Sanlam Kenya Holdings released their H1’2024 results, recording a significant 264.1% increase in Profit After Tax to Kshs 0.3 bn, from the Kshs 0.2 bn loss recorded in H1’2023. The performance was mainly driven by a significant 316.9% increase in insurance investment revenue to Kshs 2.3 bn, from Kshs 0.6 bn in H1’2023, and supported by a 57.5% decrease in Net expenses from reinsurance contracts held to Kshs 0.1 bn in H1’2024, from Kshs 0.5 bn in H1’2023.
|
Cytonn Report: Sanlam Kenya Plc's Income Statement |
|||
|
Income Statement (Kshs bn) |
H1'2023 |
H1'2024 |
y/y change |
|
Insurance Revenue |
3.7 |
3.5 |
(5.4%) |
|
Insurance Service Expense |
(2.6) |
(3.2) |
22.4% |
|
Net Expense from reinsurance contracts held |
(0.7) |
(0.3) |
(57.5%) |
|
Insurance Service Result |
0.5 |
0.1 |
(82.4%) |
|
Insurance Investment Revenue |
0.6 |
2.3 |
316.9% |
|
Net Insurance Finance expenses |
(0.4) |
(0.4) |
(4.0%) |
|
Profit before tax |
(0.1) |
0.5 |
1003.5% |
|
Income tax expense |
(0.1) |
(0.2) |
81.1% |
|
Profit after tax |
(0.2) |
0.3 |
264.1% |
|
Core EPS |
(1.4) |
1.9 |
234.3% |
|
Cytonn Report: Sanlam Kenya Plc's Balance Sheet |
|||
|
Balance Sheet items |
H1'2023 |
H1'2024 |
y/y change |
|
Financial Investments |
28.1 |
29.7 |
5.7% |
|
Insurance and Reinsurance contract assets |
1.2 |
1.3 |
10.8% |
|
Other assets |
6.3 |
6.4 |
1.3% |
|
Total assets |
35.5 |
37.3 |
5.0% |
|
Insurance contract liabilities |
27.9 |
29.4 |
5.4% |
|
Other liabilities |
6.7 |
6.7 |
(0.0%) |
|
Total liabilities |
34.7 |
36.2 |
4.4% |
|
Shareholder funds |
0.8 |
1.1 |
33.4% |
Key take outs from the results:
- Core Earnings Per share increased significantly by 234.3% to Kshs 1.9 from Kshs 1.4 loss per share in H1’2023, driven by a significant 316.9% increase in insurance investment revenue to Kshs 2.3 bn, from Kshs 0.6 bn in H1’2023, and supported by a 57.5% decrease in Net expenses from reinsurance contracts held to Kshs 0.1 bn in H1’2024, from Kshs 0.5 bn in H1’2023
- Net Investment revenue increased significantly by 316.9% to Kshs 2.3 bn in H1’2024, from Kshs 0.6 bn in H1’2023. This was majorly attributable to a significant 192.0% increase in other investment revenue to Kshs 0.9 bn from the Kshs 1.0 bn loss recorded in H1’2023, but was weighed down by a 22.1% decrease in other interest revenue to Kshs 1.1 bn from Kshs 1.4 bn in H1’2023
- Insurance revenue declined by 5.4% to Kshs 3.5 bn in H1’2024 from Kshs 3.7 bn in H1’2023, while insurance expenses increased by 22.4% to Kshs 3.2 bn from Kshs 2.6 bn in H1’2023. In addition, there was a 57.5% reduction in net expenses from reinsurance contracts held to Kshs 0.3 bn from Kshs 0.7 bn registered in H1’2023. This translated to a significant Net insurance service result decrease of 82.4% to Kshs 0.1 bn from Kshs 0.5 bn in H1’2023,
- The balance sheet recorded an expansion as total assets increased by 5.0% to Kshs 37.3 bn in H1’2024 from Kshs 35.5 bn in H1’2023 mainly driven by 10.8% increase in insurance and reinsurance contract assets to Kshs 1.3 bn form Kshs 1.2 bn in H1’2023, coupled with a 5.7% increase in financial investments to Kshs 29.7 bn from Kshs 28.1 bn, and,
- Total liabilities increased by 4.4% to Kshs 36.2 bn from Kshs 34.7 bn in H1’2023, majorly on the back of the 5.4% increase in insurance contract liabilities to Kshs 29.4 bn from Kshs 27.9 bn in H1’2023.
Other highlights from the release include:
- Non-declaration of dividends – The directors of Sanlam Kenya Plc have not recommended a dividend payment for the H1’2024
Going forward, the factors that would drive the company’s growth would be:
- Capital preservation – The directors have implemented strategies to return to profitability through sustainable business growth, effective controls, strategic expense management and effective investment strategies. The Board of Directors has not proposed payment of dividends in the period ending 30th June 2024. This is to enable the business to preserve capital and continue to service its operational and finance costs. Consequently, the Group’s witnessed a return to profitability for the first time in 5 years, recording a significant 264.1% increase in Profit After Tax to Kshs 0.3 bn, from the Kshs 0.2 bn loss recorded in H1’2023.
Valuation Summary:
- We are of the view that Sanlam Kenya Plc is a “Buy” with a target price of Kshs 8.6 representing an upside of 40.5%, from the current price of 6.1 as of 16th August 2024.
We are “Neutral” on the Equities markets in the short term due to the current tough operating environment and huge foreign investor outflows, and, “Bullish” in the long term due to current cheap valuations and expected global and local economic recovery. With the market currently being undervalued for its future growth (PEG Ratio at 0.8x), we believe that investors should reposition towards value stocks with strong earnings growth and that are trading at discounts to their intrinsic value. We expect the current high foreign investors’ sell-offs to continue weighing down the equities outlook in the short term.
- Industry Report
During the week, Knight Frank, an international Real Estate consultancy and management firm, released the Kenya Market Update H1’2024 Report highlighting the performance of key Real Estate sectors in the country. The following were the key take outs from the report:
- In the residential sector, the average selling prices for prime housing units increased by 6.2% points in H1’2024, the performance was higher than the 4.7% surge recorded in H1’2023. The increased appreciation is largely attributable to the gain by the Kenyan shilling, and a calm business environment in the period under review save for June, which experienced anti-government demonstrations. Additionally, during the period under review, the average monthly rents increased by 2.3%. The performance can be attributed to the periodic rental reviews, appreciation of the Kenyan currency, and the increase in demand for housing. There is a growing consumer awareness among buyers, leading them to demand value for their money, which is compelling developers to present high-quality properties in the market to meet consumer needs and expectations,
- The average monthly asking rents for prime commercial office spaces remained relatively unchanged at USD 1.2 per SQFT in H1’2024 from H1’2023. Commercial office space occupancy slightly increased by 6.7% to 77.2% in H1’2024 from 71.5% recorded in H1’2023. The performance was attributable to a limited supply of grade A offices, and, increased uptake of existing A-grade properties. Additionally, the growth of grade-A office continued driven by growing demand from international investors, governments, diplomatic missions, and multinational corporations attracted by Kenya’s appeal as a top investment destination in Africa. Furthermore, many organizations showing preference for physical offices to the working-from-home model. This has facilitated continued expansion of the flexible workspaces market in Nairobi,
- In the retail sector, monthly rents for prime retail spaces ranged from Kshs 600 per SQFT to Kshs 700 per SQFT in Nairobi. Rent increases were attributed to higher demand for strategically located shops in higher income prime retail developments, with prime malls continuing to register occupancy rates exceeding 75.0% in H1’2024, coupled with reduced disposable incomes and the surge in e-commerce, is prompting retailers to recalibrate their customer outreach strategies, and,
- The industrial sector continues to grow, driven by the expansion of Export Processing Zones (EPZs), Special Economic Zones (SEZs), and increasing demand for data centers. During the period under review, the government authorized part of Nairobi Gate Industrial Park to operate as an EPZ, leading to the opening of a 100,000 SQM textile park. The demand for data centers is also growing, fueled by the need for high-quality internet services, driven by a surging middle class and the stability of remote working models. A notable development in the sector include the partnership between G42 Emirati and Olkaria EcoCloud Data Centre for the construction of a one-gigawatt geothermal-powered data center.
The findings of this report are in line with our H1’2024 Markets Review Report which highlighted a rise in occupancy rates within the commercial office sector and an increased demand for industrial space in the region. We maintain our view that the Real Estate sector's performance will mainly be driven by several factors: i) growing foreign investment in the retail segment, ii) strong housing demand driven by favourable demographics, iii) government investments in infrastructure development, iv) the Affordable Housing Program (AHP) initiatives, v) a rise in international arrivals boosting the hospitality sector, vi) aggressive expansion by local and international retailers, and, vii) a growing trend towards coworking office spaces. However, the sector's growth may face challenges such as: i) an oversupply of space in some Real Estate classes, ii) rising construction costs, iii) prolonged building approval processes, and, iv) stricter lending measures imposed on developers due to increased credit risks.
- Residential Sector
During the week, President William Ruto presided over the ground-breaking ceremony of Nyaribari Masaba Affordable Housing project in Nyaribari Masaba Constituency, Kisii County. The 244-housing unit project shall integrate social housing, affordable housing, and market housing units and will comprise blocks of apartments, shop blocks, a kindergarten block, a social hall, and a waste receptacle. Below is a breakdown of the proposed project.
|
Cytonn Report: Detailed Construction Information of the Nyaribari Masaba Affordable Housing Project |
|
|
Category |
Details |
|
Type A Blocks |
3 Blocks composed of Social units (1-bedroom, 2-bedroom, and 3-bedroom) and AHP units (Studio and 2-bedroom) in (G+4) configuration, i.e. ground floor + four storeys per block |
|
Type B Blocks |
3 Blocks composed of AHP units (Studio and 2-Bedroom) and Market units (2-Bedroom and 3-Bedrooms) in (G+4) configuration |
|
Shop Blocks |
2 Blocks of 8 shops each |
|
Gate Houses |
2 Gate Houses |
Also, Ogembo affordable housing project was launched by the president in Bomachoge Chache Constituency in Kisii County. The 200-unit housing project will employ more that 92 youths per day during the period of construction. The entire project is estimated to cost Kshs 616.4 Mn. This project will empower the locals by providing employment and sourcing the required building materials.
|
Cytonn Report: Detailed Construction Information of the Ogembo Affordable Housing Project |
|
|
Category |
Details |
|
Type A Blocks |
1 Block composed of Social units (1-bedroom, 2-bedroom, and 3-bedroom) and AHP units (Studio and 2-bedroom) in (G+4) configuration, i.e. ground floor + four storeys per block |
|
Type B Blocks |
1 Block composed of AHP units (Studio and 2-Bedroom) and Market units (2-Bedroom and 3-Bedrooms) in (G+4) configuration |
|
Shop Blocks |
2 Blocks of 8 shops each |
|
Gate Houses |
2 Gate Houses |
We expect heightened activities in the residential Real Estate sector supported by the government initiatives in the residential sector, especially through the Affordable Housing Agenda and demand for housing driven by the growing population and high urbanization rate currently at 3.7% per annum. The Affordable Housing Program (AHP) in Kenya, part of the Big Four Agenda, targets building 250,000 affordable homes annually. However, homeownership still remains low, with only 21.3% of urban residents owning homes compared to a national average of 61.3%, forcing 78.7% to rely on rentals due to high property prices and limited access to finance.
- Infrastructure Development
During the week, the president, oversaw ground breaking for the tarmacking of 65-Kilometre-long link roads in Sombogo, Kitutu Chache and tarmacking of Metembe-Ngenyi/Bobaracho-Ititi/Rioma-Nyaore/Marani-Nyakoe Roads in Marani, Kisii County. Upon completion, the roads are expected to further Kisii’s agricultural vibrancy, improve livelihoods, and unlock the region’s economic potential.
The State Department for Roads received an allocation of Kshs 199.4 bn in the Appropriation Bill 2024, which is significant but comes with a substantial budget cut of Kshs1 bn taking it to Kshs 184.3 bn. As a result, the department must now prioritize its road projects, potentially delaying or cancelling less critical projects.
We expect the infrastructure sector in Kenya will continue to play a crucial role in promoting economic activities, supported by the government's commitment to construct and rehabilitate essential infrastructure such as roads, bridges, railways, airports, and affordable housing units, and strengthen diplomatic ties and partnerships with neighboring nations to foster mutual development.
- Real Estate Investments Trusts (REITs)
- Laptrust H1’2024 Earnings Note
During the week, Laptrust released the H1’2024 financial results for the Imara I-REIT for the period ended 30th June 2024. It highlighted that the REIT’s net earnings during the period under review improved by 63.0% to Kshs 162.4 mn in H1’2024 from Kshs 99.6 mn recorded in H1’2023.
The table below includes a summary of the REIT’s performance in H1’2024;
|
Figures in Kshs mn unless stated otherwise |
|||
|
Balance Sheet |
H1'2023 |
H1'2024 |
H1'2023/H1'2024 Change |
|
Total Assets |
7.3 |
7.3 |
(0.39%) |
|
Total Equity |
7.0 |
6.9 |
(1.08%) |
|
Total Liabilities |
0.3 |
0.4 |
15.36% |
|
Figures in Kshs mn unless stated otherwise |
|||
|
Income Statement |
H1'2023 |
H1'2024 |
H1'2023/H1'2024 Change |
|
Rental Income |
167.1 |
198.3 |
18.70% |
|
Income from Other Sources |
36.2 |
73.8 |
104.09% |
|
Operating Expenses |
103.6 |
109.8 |
5.95% |
|
Profit/Loss |
99.6 |
162.4 |
62.97% |
|
Basic EPS (Kshs) |
0.3 |
0.5 |
62.97% |
|
Ratios Summary |
H1'2023 |
H1'2024 |
H1'2023/H1'2024 Change |
|
ROA |
2.74% |
4.50% |
1.76% |
|
ROE |
2.86% |
0.05% |
(2.80%) |
|
Debt Ratio |
4.2% |
4.9% |
0.66% |
|
PBT Margin |
59.6% |
81.9% |
22.24% |
|
Rental Yield |
2.4% |
3.0% |
0.53% |
|
Annualized Rental Yield |
4.9% |
6.0% |
1.09% |
The key take-outs include;
- The REIT trustee approved an interim dividend of Kshs 0.4 per unit from the Kshs 129.9 Mn distributable earning which translated to an annualised yield rate of 3.8%,
- The basic earnings per unit came in at Kshs 0.5 in H1’2024, a 63.0 % increase from 0.3 recorded in H1’2023. The performance was driven by a 63.0% increase in net earnings to Kshs 162.4 mn in H1’2024 from Kshs 99.6 mn recorded in H1’2023,
- Rental and related income for the REIT stood at Kshs 198.4 mn in H1’2024, a 18.7% increase from Kshs 167.1 mn in H1’2023, implying a gross rental yield of 3.0% in H1’2024 on interest-earning assets, higher than the 2.4% rental yield recorded during H1’2023. This increase in rental income was driven by upward review in rental prices for several properties within the portfolio. For instance, rental prices at Pension Towers increased from Kshs 78 per SQFT in Q2'2023 to Kshs 100 per SQFT in Q4'2023; a 33.3% increase. Moreover, there was a 14.8% increase in rental prices at CPF House to Kshs 463 per SQFT in 2024 from Kshs 403 per SQFT in 2023. The annual rental yield currently stands at 6.0 %, an increase of 1.09% from 4.9% achieved in H1’2023,
- Total operating expenses for the REIT came in at Kshs 109.8 mn, 6.2% higher than the Kshs 103.6 mn recorded in H1’2023, attributed to a 20.2% increase in fund operating expenses to 41.0mn from 34.1 mn, and a Kshs 35.5 mn incurred in utility expenses,
- Total assets for the REIT stood at Kshs 7.30 bn in H1’2024, a 0.4% decrease from Kshs 7.33 bn recorded in H1’2023 attributable to Kshs 0.4 bn in cash and cash equivalents, and Kshs 0.1 bn in trade and other receivables, Kshs 6.7 bn in investment property saw a 2.6% decrease from Kshs 6.9 bn in H1’2023 attributable to the fair value adjustment applied to the investment property,
- Total liabilities in H1’2024 came in at Kshs 355.4 mn, recording a 15.4 % increase from Kshs 308.1 mn in H1’2023 wholly attributable to an increase in trade and other payables by 15.4% to 355.4 Mn from 308.1 Mn in H1’2023,
The chart below shows the comparison of Laptrust Imara I-REIT yield performance versus other assets.
For a more comprehensive analysis, please see our Laptrust Imara I-REIT H1’2024 Earnings Note.
- REIT Weekly Performance
On the Unquoted Securities Platform, Acorn D-REIT and I-REIT traded at Kshs 25.4 and Kshs 22.2 per unit, respectively, as per the last updated data on 16th August 2024. The performance represented a 27.0% and 11.0% gain for the D-REIT and I-REIT, respectively, from the Kshs 20.0 inception price. The volumes traded for the D-REIT and I-REIT came in at Kshs 12.3 mn and Kshs 31.6 mn shares, respectively, with a turnover of Kshs 311.5 mn and Kshs 702.7 mn, respectively, since inception in February 2021. Additionally, ILAM Fahari I-REIT traded at Kshs 11.0 per share as of 9th August, 2024, representing a 45.0% loss from the Kshs 20.0 inception price. The volume traded to date came in at 138,600 for the I-REIT, with a turnover of Kshs 1.5 mn since inception in November 2015.
REITs offer various benefits, such as tax exemptions, diversified portfolios, and stable long-term profits. However, the ongoing decline in the performance of Kenyan REITs and the restructuring of their business portfolios are hindering significant previous investments. Additional general challenges include: i) insufficient understanding of the investment instrument among investors, ii) lengthy approval processes for REIT creation, iii) high minimum capital requirements of Kshs 100.0 mn for trustees, and iv) minimum investment amounts set at Kshs 5.0 mn for the Investment REITs, all of which continue to limit the performance of the Kenyan REITs market.
We expect the performance of Kenya’s Real Estate sector to be sustained by: i) increased investment from local and international investors, particularly in the residential sectors ii) favorable demographics in the country, leading to higher demand for housing and Real Estate, (iii) government infrastructure development projects e.g. roads, opening up satellite towns for investment, and iv) ongoing residential developments under the Affordable Housing Agenda, aiming to reduce the annual housing deficit in the country which is currently at 80.0%. However, challenges such as rising construction costs, strain on infrastructure development, and high capital demands in REITs sector will continue to impede the sector’s optimal performance by restricting developments and investments.
In July 2023, we released the Nairobi Metropolitan Area Land Report 2023, which highlighted that the Nairobi Metropolitan Area (NMA) land sector recorded an improvement in performance with the average annual price appreciation coming in at 4.5% in FY’2022/23, 1.3% points higher than the 3.2% appreciation recorded in FY’2021/22. The performance represented an 11-year average price appreciation CAGR of 9.1%, with the average selling price for land coming in at Kshs 128.5 mn in FY’2022/23, from Kshs 47.9 mn in 2011.
The performance during this period was mainly driven by the increased demand for Un-serviced land in satellite towns of the Nairobi Metropolitan and serviced land in Satellite Towns which recorded the highest annualized change in capital appreciation both at 9.1% and 8.5% respectively, compared to a market average change of 4.5%. The performance was supported by; i) ample infrastructure such as the various bypasses and the Thika Superhighway, ii) rising demand for residential developments on the back of positive demographics, and, iii) convenient access to the city thereby allowing increased investments. Conversely, Land in the Nairobi commercial zones realized a price correction of 1.4% in their average asking prices which came in at Kshs 397.3 mn in FY’2022/23, from the Kshs 403.4 mn that was recorded in FY’2021/22. This is mainly on the back of declined demand owing to high land prices.
This week, we update our report by discussing the overall performance of the NMA land sector over time, and examining various factors that influence its performance based on selling prices and annual capital appreciation. Additionally, we identify investment opportunities for the sector, using 2024 market research data. As such, in this topic we shall focus on;
- Introduction to the Nairobi Metropolitan Area (NMA) Land Sector,
- NMA Land Sector Performance in 2024 Based on Various Locations, and,
- Summary and investment opportunities in the sector, and,
- Conclusion and Outlook for the Sector.
Section I: Introduction to the Nairobi Metropolitan Area (NMA) Land Sector
The land sector in the Nairobi Metropolitan Area (NMA) has continued to demonstrate resilience, showing consistent improvement in performance despite challenges such as continuous rising of construction costs, constrained access to financing for Real Estate projects, and an oversupply in certain real estate sectors e.g. commercial offices and the retail sectors. These factors have continued to impact demand for land in certain Nairobi areas such as commercial zones and High-end suburbs. Nevertheless, the sector registered improving performance in FY'2023/24, supported by several key factors. These include:
- Demographics: Kenya continues to record positive demographics shown by high population growth and urbanization rates of 9% p.a and 3.7% p.a, respectively against the global averages 0.9% p.a and 1.6% p.a, respectively, as at 2023. Given this, the demand for residential and commercial spaces continues to soar, which in turn boosts demand for development land,
- Government’s Continued Investment in Infrastructural Developments: The Kenyan government has persistently continued to launch and implement various infrastructure projects to boost economic performance and position the country as a preferred regional hub. This has in turn supported the growth of the Real Estate Sector through opening up areas e.g. satellite towns for Real Estate investment. Some of the key notable projects include Makupa Bridge, Nairobi Expressway, Nairobi Western, southern and expansion of the Eastern Bypass among others. These projects enhance connectivity, driving demand for land, particularly in satellite towns e.g. Athi River and making these areas attractive to investors which contributes to rising property prices,
- Government Affordable Housing Initiatives: The Kenyan government in line with its affordable housing agenda has continued to support and launch several projects in an attempt to reduce the housing deficit in the country and subsequently offer job opportunities to the youth. This has increased demand for development land in areas earmarked for development. Some noteworthy projects include; Moke Gardens Athi River, Kings Boma Estate Ruiru, Pangani affordable housing project, and Kings Orchid Thika, and,
- Limited Supply of Land Particularly in Urban Centers: As Nairobi continues to face high rates of urbanization, the demand for housing and commercial spaces increases, and the fixed supply of land becomes increasingly scarce. This scarcity, coupled with factors like population growth and infrastructure improvements leads to an appreciation in land prices.
However, despite the aforementioned supporting elements, the sector's optimal performance in FY’2023/24 was hampered by;
- Increased Construction Costs: In 2023, the cost of construction increased by 0% to an average of Kshs 71,200 per SQM from an average of Kshs 56,075 per SQM recorded in 2022. The sharp increase was mainly due to a hike in prices of key building materials such as cement, steel, paint, and aluminium, on the back of rising inflation and taxation rates. These higher costs are expected to continue impeding development hence reducing the demand for land,
- Oversupply in Select Real Estate Sectors: Nairobi continues to experience an excess supply of commercial office space, with approximately 5.8 mn SQFT available, and retail space both in Nairobi and the rest of Kenya is oversupplied by 3.0 mn SQFT and 1.7 mn SQFT respectively. This surplus has resulted in prolonged vacancy rates across these real estate sectors, and,
- Inadequate infrastructure: Despite the government’s efforts to improve infrastructure across the country, some areas are still lacking essential infrastructure such as water, roads, and sewer. As a result, this lowers land values by deterring development, reducing desirability, and increasing development costs.
Notably, going forward, some of the factors expected to shape the performance of the sector include;
- Continued Efforts in Digitization of Land Records: The Ardhisasa platform developed jointly by the Ministry of Land and Physical Planning (MoLPP) and the National Land Commission (NLC) and key partners in Government allows other stakeholders and interested parties to interact with land information held and processes undertaken by Government. It allows the lodgement of applications for various services offered by the Ministry and the Commission. Digitization will continue assist curb fraud cases and ease land transaction processes by reducing protracted timelines, and,
- Increase in Capital Gains Tax (CGT): Effective 1st January 2023, the CGT rate was increased from previously chargeable 5% of the net gain to 15% of the net gain. We expect the tax to continue to drive mixed performance in the land sector. The tax may prompt investors to continue increasing land prices, which may dampen property transaction volumes. Ultimately this may lead to a decline in land transaction volumes and liquidity gaps in the market.
Section II: NMA Land Sector Performance in 2024 Based on Various Locations
For the analysis, we conducted research on various major towns within the NMA and classified them as follows;
- High Rise Residential Areas: They comprise of areas such as Dagoretti, Embakasi, and Kasarani, and are majorly characterized by the numerous high-rise buildings such as the apartments found within,
- High End Residential Suburbs: These are areas which generally consist of low-rise buildings such as the bungalows, maisonettes and villas and also high-end apartments. They include; Kitisuru, Runda, Ridgeways, Kileleshwa, Karen, and Spring Valley,
- Commercial Zones: They comprise of areas such as Kilimani, Westlands, Riverside, and Upper Hill, and are popular because of the numerous commercial office buildings that they have, and,
- Satellite Towns: Land in the area was categorized into serviced (site and service schemes) and unserviced land. It comprises of areas such as Syokimau, Ruiru, Rongai, Juja, Utawala, Limuru, Athi River, and, Limuru.
The NMA land sector continues to show resilience in performance with the average Year-on-Year (YoY) price appreciation coming in at 3.9% in FY’2023/24, 0.6% slower than the 4.5% appreciation recorded in FY’2022/23. This is as the average asking prices came in at Kshs 132.7 mn in FY’2023/24 from Kshs 128.6 mn in FY’2022/23. The performance also represented a 13-year average price appreciation CAGR of 8.2%, with the average selling price for land coming in at Kshs 132.7 mn in FY’2023/24, from Kshs 47.9 mn in 2011. This signifies the continued rise in the demand for development land mainly driven by; i) government significant investments in infrastructure particularly road networks and utilities which in turn stimulates growth in Satellite towns e.g. the Southern and Eastern Bypass, ii) heightened construction activity, especially in the residential sector, driven by the government’s affordable housing agenda, which in turn boosts demand for land, iii) limited supply of land especially in urban areas which has contributed to rising land prices as demand from buyers outpaces availability, iv) growing demand for housing which is driven by positive demographics such as high population and urbanization, which currently stands at 1.9% and 3.7% respectively, and, v) Growth in popularity of satellite towns by investors and buyers which provide affordable land options in comparison to the suburbs and key commercial zones.
The graph below shows the capital appreciation of land in the NMA from FY’2022/23 to FY’2023/24;
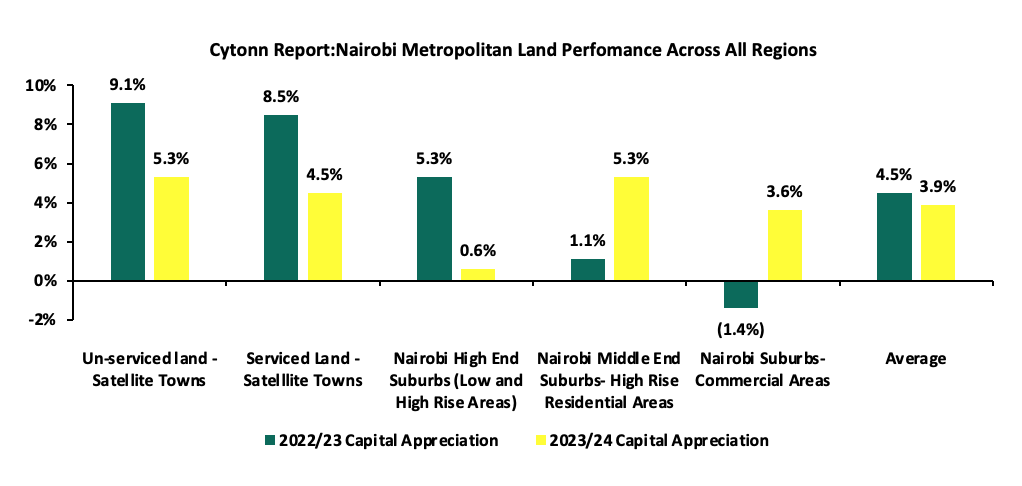
The table below shows the performance summary of the NMA land sector based on the average asking prices, CAGR and capital appreciation;
|
Cytonn Report: NMA Land Sector Performance Summary |
||||||||||||||
|
Location |
*Price in 2011 |
*Price in 2015 |
*Price in 2016 |
*Price in 2017 |
*Price 2018/19 |
*Price 2019/20 |
*Price 2020/21 |
*Price 2021/22 |
*Price 2022/23 |
*Price 2023/24
|
13-Year CAGR |
2022/23 Capital Appr. |
2023/24 Capital App. |
∆ in Capital Appreciation |
|
Unserviced land - Satellite Towns |
3.6 |
8.4 |
11.6 |
12.6 |
12.8 |
13.2 |
13.5 |
14.7 |
15.4 |
16.3 |
12.0% |
9.1% |
5.3% |
(3.7%) |
|
NMA High Rise Residential Areas |
31.0 |
64.3 |
71.7 |
77.7 |
75.7 |
77 |
76.7 |
76.3 |
76.1 |
80.4 |
7.6% |
1.1% |
5.3% |
4.2% |
|
Serviced Land - Satellite Towns |
5.6 |
13.8 |
15.2 |
16 |
16 |
16 |
16.7 |
17 |
18.34 |
19.2 |
10.0% |
8.5% |
4.5% |
(4.0%) |
|
Nairobi Suburbs- Commercial Areas |
145.0 |
359.3 |
421.8 |
433 |
421 |
419 |
404.6 |
403.4 |
397.4 |
411.5 |
8.4% |
(1.4%) |
3.6% |
5.0% |
|
Nairobi High End Suburbs (Low and High Rise Areas) |
54.5 |
94.3 |
113 |
119.7 |
119.3 |
120.7 |
123.8 |
130.5 |
135.5 |
136.2 |
7.0% |
5.3% |
0.6% |
(4.7%) |
|
Average |
47.9 |
108 |
126.6 |
131.8 |
129 |
129.2 |
127.1 |
128.4 |
128.5 |
132.7 |
9.0% |
4.5% |
3.9% |
1.3% |
Source: Cytonn Research
Performance per node:
- Satellite Towns - Unserviced Land
Unserviced land in the satellite towns of Nairobi recorded an average YoY capital appreciation of 5.3%, with average asking prices coming in at Kshs 16.3 mn in FY’2023/24, from the Kshs 15.4 mn recorded in FY’2022/23. Additionally, the performance grew by a 13-year average CAGR of 12.0%, to average asking prices of Kshs 16.3 mn in FY’2023/24 from the Kshs 3.6 mn recorded in 2011. The performance was supported by; i) Ongoing and planned infrastructure improvements, such as the Eastern bypass, and other utilities have made satellite towns more accessible and appealing for investment, and, ii) Investors looking for capital gains have been buying land in these towns, anticipating future appreciation as the areas develop and urbanize.
In terms of performance per node, Juja was the best performing with a Year-on-Year (YoY) capital appreciation of 7.2% attributed to; i) proximity to the Thika Superhighway significantly improves accessibility from Nairobi and other regions making the area more attractive for residential and commercial developments, ii) presence of higher learning institution such as Jomo Kenyatta University of Agriculture and Technology (JKUAT) contributes to population growth which in turn creates a steady demand for land for the development of residential housing and rental properties, iii) positive demographics fuelling demand for land. The table below shows the performance of unserviced land in satellite towns within the NMA;
|
All values are Kshs mn per Acre unless stated otherwise |
|||||||||||||||
|
Cytonn Report: NMA Satellite Towns - Unserviced Land Performance |
|||||||||||||||
|
Location |
*Price in 2011 |
*Price in 2015 |
*Price in 2016 |
*Price in 2017 |
*Price 2018/19 |
*Price 2019/20 |
*Price 2020/21 |
*Price 2021/22 |
*Price 2022/23 |
*Price 2023/24 |
13-Year CAGR |
2022/23 Capital Appreciation |
2023/24 Capital Appreciation |
∆ in Capital appreciation |
|
|
Juja |
3 |
7 |
9 |
10 |
10 |
10 |
10.6 |
12.2 |
14.5 |
15.5 |
13.5% |
14.8% |
7.2% |
(7.6%) |
|
|
Rongai |
2 |
10 |
18 |
18 |
18 |
19 |
19.0 |
18.9 |
17.3 |
18.3 |
18.6% |
(0.7%) |
5.6% |
6.3% |
|
|
Limuru |
5 |
13 |
17 |
20 |
20 |
21 |
21.2 |
24.1 |
23.5 |
24.8 |
13.1% |
13.8% |
5.4% |
(8.4%) |
|
|
Utawala |
6 |
9 |
10 |
11 |
12 |
12 |
12.4 |
14.1 |
16.7 |
17.4 |
8.5% |
13.8% |
4.3% |
(9.5%) |
|
|
Athi River |
2 |
3 |
4 |
4 |
4 |
4 |
4.5 |
4.4 |
5.2 |
5.3 |
7.8% |
(2.7%) |
1.8% |
4.5% |
|
|
Average |
4 |
8 |
12 |
13 |
13 |
13 |
13.5 |
14.7 |
15.4 |
16.3 |
12.3% |
7.8% |
5.3% |
(2.5%) |
|
Source: Cytonn Research
- Nairobi Suburbs – High End (Low and High Rise) Residential Areas
High end residential areas of Nairobi suburbs registered an average YoY capital appreciation of 0.6%, with the average asking prices coming at Kshs 136.2 mn in FY’2023/24, from Kshs 135.5 mn in FY’2022/23. Additionally, the performance represented a 13-year average CAGR of 8.0%, with average asking prices coming in at Kshs 136.2 mn in FY’2023/24 from the Kshs 54.5 mn recorded in 2011. These areas continue to remain attractive to investors due to; i) their serene and green environments, combined with larger plots offering a tranquil environment away from the bustling city center, ii) their proximity to the Central Business District(CBD) making them ideal for professionals who want to live in a serene area while still being close to their workplace, iii) relatively affordable prices at Kshs 136.2 mn per acre compared to the commercial zones averaging at Kshs 411.5 mn per acre.
In terms of performance per node, Kileleshwa was the best performing with an average YoY price appreciation of 4.9%, 4.3% points higher than the market average of 0.6.% due to; i) strategic location near Nairobi Central Business District (CBD) and other key areas, like Westlands, Kilimani, and Lavington hence desirable for both commercial and residential purposes, ii) availability of development land due to low population, iii) benefits from improved infrastructure including well-maintained roads, better drainage systems, and access to essential services like water and electricity making the area more accessible and livable, iv) proximity to adequate amenities malls such the Hub, and Waterfront, schools such as St Christopher’s International School among others.
The table below shows the performance of land in high end (low and high rise) suburbs within the NMA;
|
All values are Kshs mn per Acre unless stated otherwise |
|||||||||||||||
|
Cytonn Report: NMA High End Suburbs (Low- and High-Rise Areas) Land Performance |
|||||||||||||||
|
Location |
*Price in 2011 |
*Price in 2015 |
*Price in 2016 |
*Price in 2017 |
*Price 2018/19 |
*Price 2019/20 |
*Price 2020/21 |
*Price 2021/22 |
*Price 2022/23 |
*Price 2023/24 |
13-Year CAGR |
2022/23 Capital Appreciation |
2023/24 Capital Appreciation |
∆ in Capital appreciation |
|
|
Kileleshwa |
149 |
227 |
286 |
306 |
311 |
303 |
300.9 |
305.8 |
301.9 |
316.8 |
6.0% |
(1.3%) |
4.9% |
6.2% |
|
|
Runda |
33 |
58 |
67 |
68 |
68 |
70 |
74.3 |
81.7 |
87.9 |
89.7 |
8.0% |
7.6% |
2.0% |
(5.6%) |
|
|
Ridgeways |
24 |
51 |
62 |
68 |
65 |
66 |
68.8 |
81.4 |
87 |
86.4 |
10.4% |
6.8% |
(0.7%) |
(7.5%) |
|
|
Karen |
25 |
40 |
46 |
52 |
53 |
56 |
59.6 |
62 |
64.5 |
63.6 |
7.4% |
4.2% |
(1.4%) |
(5.6%) |
|
|
Kitisuru |
32 |
59 |
70 |
70 |
71 |
73 |
77.9 |
90.3 |
95 |
92.5 |
8.5% |
5.2% |
(2.6%) |
(7.8%) |
|
|
Spring Valley |
64 |
131 |
147 |
154 |
148 |
156 |
161 |
161.7 |
176.5 |
168.3 |
7.7% |
9.2% |
(4.7%) |
(13.9%) |
|
|
Average |
55 |
94 |
113 |
120 |
120 |
120 |
123.8 |
130.5 |
135.5 |
136.2 |
8.0% |
5.3% |
0.6% |
(4.7%) |
|
Source: Cytonn Research
- Satellite Towns - Serviced Land
Serviced land in the satellite towns of Nairobi recorded an average YoY capital appreciation of 4.5%, with the average asking prices coming in at Kshs 19.2 mn in FY’2023/24, from Kshs 18.4 mn in FY’2022/23. Additionally, the performance represented a 13-year average CAGR of 11.0%, with average asking prices coming in at Kshs 19.2 mn in FY’2023/24 from the Kshs 5.6 mn recorded in 2011. The performance was supported by; i) Continuous improvement of infrastructure such as the Eastern bypass and Thika Superhighway, ii) relatively quick access to the city, increasing investor appeal for development of residential and commercial units, and, iii) rapid urbanization and population growth increasing the demand for housing.
In terms of performance per node, Athi River was the best performing with a relatively high average YoY price appreciation of 21.1%. This was mainly driven by; i) its strategic location along the recently completed Nairobi Expressway easing access to the city and the planned expansion of Mombasa road, ii) presence of amenities such as Kitengela, Crystall Rivers and Signature malls, iii) growth of industries around the area has led to job creation which is increasing demand for housing and commercial properties, and, iv) relatively affordable land price at Kshs 17.4 mn which is lower than the market average of Kshs 19.2 mn. On the other hand, Rongai recorded a price correction of 4.8% attributed to reduced land transactions within the period under review. The table below shows the performance of serviced land in satellite towns within the NMA;
|
All values is Kshs mn per Acre unless stated otherwise |
||||||||||||||
|
Cytonn Report: NMA Satellite Towns - Serviced Land Performance |
||||||||||||||
|
Location |
*Price in 2011 |
*Price in 2015 |
*Price in 2016 |
*Price in 2017 |
*Price 2018/19 |
*Price 2019/20 |
*Price 2020/21 |
*Price 2021/22 |
*Price 2022/23 |
*Price 2023/24 |
13-Year CAGR |
2022/23 Capital Appreciation |
2023/24 Capital App. |
∆ in Capital appreciation |
|
Athi River |
2 |
11 |
13 |
13 |
12 |
12 |
13.1 |
13.3 |
14.4 |
17.4 |
18.1% |
8.2% |
21.1% |
13.0% |
|
Syokimau |
3 |
12 |
12 |
12 |
12 |
12 |
11.8 |
13.9 |
17.2 |
18.5 |
15.0% |
23.9% |
7.6% |
(16.0%) |
|
Ruiru & Juja |
8 |
18 |
19 |
21 |
23 |
24 |
25.3 |
25.9 |
28.1 |
29 |
10.4% |
8.6% |
3.0% |
(6.0%) |
|
Ruai |
8 |
12 |
13 |
15 |
14 |
14 |
13.5 |
11.6 |
12.5 |
12.4 |
3.4% |
7.7% |
(0.7%) |
(8.0%) |
|
Rongai |
7 |
16 |
19 |
19 |
19 |
18 |
20.0 |
20.4 |
19.1 |
18.9 |
7.9% |
(6.1%) |
(4.8%) |
1.0% |
|
Average |
6 |
14 |
15 |
16 |
16 |
16 |
16.7 |
17 |
18.3 |
19.2 |
11% |
8.5% |
4.5% |
(4.0%) |
Source: Cytonn Research
- Nairobi Suburbs - Commercial Zones
Land in Nairobi suburbs recorded an average YoY capital appreciation of 3.6%, with the average asking prices coming in at Kshs 411.5 mn in FY’2023/24, from Kshs 397.3 mn in FY’2022/23. Additionally, the performance represented a 13-year average CAGR of 8.5%, with average asking prices coming in at Kshs 411.5 mn in FY’2023/24 from the Kshs 145.0 mn recorded in 2011. This is mainly due to: i) availability of desirable amenities such as hospitals, schools, supermarkets and fitness centers making the area ideal for residential development, ii) good road network improving the connectivity to the Central Business District and other parts of NMA, and iii) availability of individuals who are willing to pay premium prices for land in these areas.
In terms of performance per node, Kilimani was the best performing with a relatively high average YoY price appreciation of 10.2% owing to: i) availability of ample amenities ideal for residential development, ii) proximity to the city centre and connectivity to other Nairobi surburbs e.g. Westland’s and a surging middle class in the area. Conversely, Riverside recorded the highest price correction at 4.4%, resulting from a stiff competition from neighboring areas such as Westlands
The table below shows the performance of land in commercial zones within the NMA;
|
All values in Kshs mn per Acre unless stated otherwise |
|
|
|
|||||||||||
|
Cytonn Report: NMA Suburbs - Commercial Zones Land Performance |
|
|
|
|||||||||||
|
Location |
*Price in 2011 |
*Price in 2015 |
*Price in 2016 |
*Price in 2017 |
*Price 2018/19 |
*Price 2019/20 |
*Price 2020/21 |
*Price 2021/22 |
*Price 2022/23 |
*Price 2023/24 |
13-Year CAGR |
2022/23 Capital App. |
2023/24 Capital App. |
∆ in Capital appreciation |
|
Kilimani |
114 |
294 |
360 |
387 |
403 |
398 |
381.7 |
380.4 |
375.9 |
414.3 |
10.4% |
(1.2%) |
10.2% |
11.4% |
|
Westlands |
150 |
350 |
453 |
474 |
430 |
421 |
413.6 |
418.3 |
413.2 |
433.2 |
8.5% |
(1.2%) |
4.8% |
6.0% |
|
Upper Hill |
200 |
450 |
512 |
510 |
488 |
506 |
487.3 |
471.9 |
458.1 |
471.4 |
6.8% |
(2.9%) |
2.9% |
5.8% |
|
Riverside |
116 |
343 |
362 |
361 |
363 |
351 |
335.7 |
343.1 |
342.1 |
327.1 |
8.3% |
(0.3%) |
(4.4%) |
(4.1%) |
|
Average |
145 |
359 |
422 |
433 |
421 |
419 |
404.6 |
403.4 |
397.3 |
411.5 |
8.5% |
(1.4%) |
3.6% |
5.0% |
Source: Cytonn Research
- Nairobi Suburbs – High Rise Residential Areas
High rise residential areas of Nairobi realized an average YoY capital appreciation of 5.3%, with the average asking prices coming in at Kshs 80.4 mn in FY’2023/24 from Kshs 76.3 mn recorded in FY’2022/23. Additionally, the performance represented a 13-year average CAGR of 7.6%, with average asking prices coming in at Kshs 80.4 mn in FY’2023/24 from the Kshs 31.0 mn recorded in 2011. The performance was supported by; i) Rising population and urbanization in Nairobi increasing demand for housing in the subject areas, ii) unrestricted zoning regulations offering flexibility and growth potential to investors, and, iii) relatively affordable land prices compared to other investment areas.
In terms of performance per node, Dagoretti was the best performing, with an average YoY price appreciation of 6.0%, 0.7% points higher than the 5.3% market average. This was mainly driven by; i) Nairobi’s rapid urbanization and population growth pushing residents to seek affordable housing options, leading to increased demand in Nairobi peripheral areas, ii) availability of infrastructure with the area being served by the Waiyaki way Road, Lang’ata road and Southern Bypass hence easily accessible, and iii) an increasing middle class in the area. The table below shows the performance of land in high rise residential areas within the NMA;
|
All values is Kshs mn per Acre unless stated otherwise |
|
|
||||||||||||
|
Cytonn Report: NMA Middle End Suburbs – High Rise Residential Areas Land Performance |
|
|
||||||||||||
|
Location |
*Price in 2011 |
*Price in 2015 |
*Price in 2016 |
*Price in 2017 |
*Price 2018/19 |
*Price 2019/20 |
*Price 2020/21 |
*Price 2021/22 |
*Price 2022/23 |
*Price 2023/24 |
13-Year CAGR |
2022/23 Capital Appreciation |
2023/24 Capital Appreciation |
∆ in Capital appreciation |
|
Dagoretti |
28 |
81 |
95 |
99 |
100 |
103 |
95.2 |
95.2 |
85.6 |
91.1 |
9.5% |
(10.1%) |
6.0% |
16.1% |
|
Embakasi |
33 |
61 |
60 |
70 |
61 |
63 |
67.2 |
66.9 |
71.5 |
75.8 |
6.6% |
6.9% |
5.6% |
(1.3%) |
|
Kasarani |
32 |
51 |
60 |
64 |
66 |
65 |
67.7 |
66.9 |
71.3 |
74.4 |
6.7% |
6.6% |
4.2% |
(2.4%) |
|
Average |
31 |
64.3 |
71.7 |
77.7 |
75.7 |
77 |
76.7 |
76.1 |
76.3 |
80.4 |
7.6% |
1.1% |
5.3% |
4.2% |
Source: Cytonn Research
Section III: Summary and Investment Opportunity in the Sector
The table below summarizes the performance in capital appreciation of the various areas:
|
Summary and Conclusions - y/y Capital Appreciation Nairobi Metropolitan Area |
|
|
Land Capital Appreciation |
|
|
FY’2023/24 |
Areas |
|
>5.0% |
Dagoretti, Embakasi, Syokimau, Athi River, Limuru, Kilimani |
|
1.0%- 4.9% |
Kileleshwa, Westlands, Kasarani, Upper Hill |
|
<1.0% |
Ruai, Rongai, Riverside, Ridgeways, Kitusuru, Karen, Spring Valley |
|
Un-serviced Land Capital Appreciation |
|
|
FY’2023/24 |
Areas |
|
1.0% -4.9% |
Utawala, Athi River |
Source: Cytonn Research
Investment Opportunity
- Satellite Towns (Unserviced land) - The investment opportunity in this segment lies in Juja, Rongai, and Limuru submarkets which registered the highest YoY capital returns at 7.2%, 5.6%, and 5.4%, respectively, against a market average of 5.3% owing to relative affordability of land and good access to the city center thereby drawing investments,
- High End Residential Suburbs - The investment opportunity in this segment lies in Kileleshwa and Runda which recorded the highest YoY capital appreciations of 4.9% and 2.0%, respectively, against the market average of 0.6%. The impressive performance was driven by the relatively high demand resulting from their serene environment, prime locations attracting high net worth investments, availability of adequate infrastructure and various amenities,
- Satellite Towns (Serviced Land) - The investment opportunity in the segment lies in Athi River and Syokimau which recorded the highest YoY capital appreciations of 21.1% and 7.6%, respectively, against the market average of 4.5%. The performance was supported by; rapid demand driven by the existing growing middle income class earners, availability of infrastructure networks such as the commuter train station in Syokimau and Expressway to Athi River area relatively affordable prices,
- Commercial Zones – The investment opportunity in the segment lies in Westlands and Kilimani which recorded the highest YoY capital appreciations of 10.2% and 4.8%, respectively, against the market average of 3.6%. driven close proximity to Nairobi’s Central Business District (CBD) and availability of essential amenities, and
- High Rise Residential Areas - The investment opportunity in the segment lies in Embakasi and Dagoretti which recorded the highest YoY capital appreciations of 5.6% and 6.0%, respectively, against the market average of 5.3%, driven by increased demand for development land to cater for the rapidly dense population in the areas.
Section IV: Conclusion and Outlook for the Sector
|
Cytonn Report: Nairobi Metropolitan Area (NMA) 2024 Land Sector Outlook |
||||
|
Indicator |
2023 Projections |
2024 Projections |
2023 Outlook |
2024 Outlook |
|
Infrastructure Development |
We expect the infrastructure sector in Kenya to continue to play a crucial role in promoting economic activities, which in turn will drive the growth and performance of the Real Estate sector, with better and improved road, railway and air transport networks, and other support facilities that make it easier for delivery of people, goods, and services efficiently, thereby increasing demand for Real Estate properties. Additionally, the government has increased budget allocation to the infrastructure sector by 16.9%, to Kshs 286.6 bn in FY’2023/2024 from Kshs 245.1 bn in FY’2022/2023, with key focus in development and expansion, rehabilitation, and maintenance of major roads and bridges across the country, extension of the Standard Gauge Railway (SGR) Phase 2B from Naivasha to Kisumu and Phase 2c to Malaba, development of Dongo Kundu Special Economic Zone, development of Nairobi Railway City, and construction of airports, airstrips and a Kshs 1.3 bn modern cruise ship terminal in Mombasa.
Additionally, the government is actively pursuing the completion of major infrastructure projects that were previously halted by the current regime and execution of newer plans in existing projects, signaling a renewed commitment to infrastructural developments. Such projects include the dualling of Rironi- Mau Summit Highway at a cost of Kshs 180.0 bn, Kenol-Sagana-Marua highway Phase 3 and 4 at a cost of Kshs 8.0 bn, and the Eastern Bypass Highway Phase 2, Limuru and UN Avenue roads Phase 1, extension of the SGR from Mariakani to Lamu to Isiolo and further connect to the border town of Moyale. From Isiolo, the government will extend the SGR to Nairobi, connecting the country’s capital city and commercial hub to northern Kenya and finally to Ethiopia. The updated SGR plan is part of the Kshs 3.4 tn Lamu Port South Sudan-Ethiopia Transport (Lapsset) aimed at opening up northern Kenya and revamping the northern corridor by spurring movement within Kenya, South Sudan and Ethiopia. However, the bulk of financing these additional major projects will be from external financiers such as the African Develop Bank (AfDB), EXIM Bank of China and many more As a result, we expect boost in development of more habitable areas for settlements, increased developments of Real Estate in the new upcoming regions, and rising up property prices across the country. |
We expect the government continued efforts to launch infrastructural projects such as tarmac roads, sewer lines, water supply, and electricity connectivity will stimulate the economic growth. These factors will in turn lead to growth in Real Estate market and drive up land values Goods and services move to new areas. Additionally, the government increased infrastructure budget allocation by 16.9%, to Kshs 286.6bn in FY’ 2023/2024 from Kshs 245.1 bn in FY’2022/2023. The allocation will be distributed as follows Kshs 113.9 bn to Construction of Roads and Bridges, Kshs 50.9 bn to Maintenance of Roads, and Kshs 80.1 bn for rehabilitation of Roads. However, we foresee the pace of infrastructure development slowing down, considering that the funding for road construction was reduced by Kshs 55.6 bn in the recent mini-budget. The budget for roads in the financial year 2023/24 has been decreased to Kshs 177.1 bn from the initially allocated Kshs 232.7 bn for the State Department for Roads.
Some of the notable projects in focus include development of Nairobi railway city, rehabilitation of locomotives, extension of standard gauge railway (SGR) and expansion of airports and airstrips. Additionally, the government plans to complete various infrastructural projects in the country including Riruta – Lenana – Ngong Railway Line, phase I of Nairobi Railway City, the Meter Gauge Railway (MGR) Link from Mombasa SGR Terminus to Mombasa MGR Station, and the Railway Bridge across Makupa Causeway.
As a result of this projects we expect the opening up of satellite towns to Real Estate development and a subsequent rise in property prices.
|
Positive |
Neutral |
|
Credit Supply |
Lenders continue to tighten their lending requirements as they demand more collateral from developers due to the high credit risk in the Real Estate sector on the back of the tough economic environment. This is evidenced by 12.2% increase in Gross Non-Performing Loans (NPLs) in the Real Estate sector to Kshs 88.1 bn in Q1’2023, from Kshs 78.5 bn in Q1’2022. In addition, on a q/q basis, the increase in NPLs represented a 9.7% increase from Kshs 80.3 bn realized in Q4’2022,
Additionally, the economic recovery from the pandemic and the rising global interest rates caused by inflation which has forced widespread adoption of credit risk-based pricing models on loans by local lenders and the recent hike of the Central Bank Rate (CBR) by 100 basis points from 9.5% to 10.5% by the Monetary Policy Committee (MPC) will push more lenders to increase their interest rates on loans borrowed by Real Estate investors
As a result, we expect these factors will continue raising the cost of credit for most developers seeking to invest in land purchases and property developments through debt. This is even when the government through the Kenya Mortgage Refinance Company (KMRC), which is the only refinancing company in the country and just formed in 2018, strains to support the credit supply among the local banks and SACCOs by providing affordable mortgages to the ever-rising demand of Kenyans seeking to cheaper loans to finance their homeownership projects on land. It is important to note that the capital markets in Kenya, which could serve as an alternative means to source funds, are already undermined. |
The government has continued to promote access to affordable credit through the Kenya Mortgage Refinance Company (KMRC) which has been crucial in providing Kenyans with low cost loans increasing home ownership. However, lenders continue to tighten their lending requirements and demand more collateral from developers as a result of elevated credit risk in the Real Estate sector as evidenced by the gross Non-Performing Loans (NPLs) in the Real Estate sector realized a q/q increase of 15.0% to Kshs 117.1 bn in Q1’2024, from Kshs 101.7.0 bn in Q4’2023. As a result, we expect these factors to slow down developers seeking to invest in land purchases and property developments |
Negative |
Negative |
|
Legal Reforms |
We anticipate that both the national and county governments will continue to make adjustments to their legal policies and introduce new regulations to enhance transparency, efficiency, compliance, and increased land transactions in the Real Estate sector. Furthermore, the recently assented Finance Act 2023 to law in 26 June 2023, with introduction of the Housing Levy and reduced Monthly Rental Income Tax, and, the Finance Act 2022, which became effective as of 1 January 2023, with the Capital Gains Tax (CGT) chargeable on net gains upon transfer of property tripling to 15.0% from the 5.0% previously chargeable are expected to stimulate activities in the Real Estate sector such as; i) the government having the much-needed capital to finance affordable housing projects across the country, ii) incentives outlined in the Legislation supporting the private sector's efforts to construct affordable housing units and price them within reach of Kenyan homeowners, and, iii) encouraging collaborations and partnerships between the government and private developers, further boosting the supply of affordable housing in the country.
Consequently, there will be an increase in land transactions as the government's direct involvement and partnerships with the private sector in the residential sector will encourage streamlining of more reforms that benefit its projects’ execution. These efforts also aim to enhance Kenya's competitive advantage in the region for Real Estate investments.
|
We expect continued streamlining of the Real Estate Sector through new legal policies and regulations to ensure transparency and efficiency in the land sector.
The high court declined to issue orders stopping the imposition of the affordable housing levy that is currently at the rate of 1.5% of gross salary.Additionally as of 1stJanuary 2023 the government tripled the Capital Gains Tax (CGT) upon transfer of property to 15.0% from the 5.0% previously chargeable. This is expected to provide the government with much needed capital
|
Neutral |
Neutral |
|
Real Estate Activities |
We expect the Real Estate sector to record an improvement in performance driven by factors such as; rapid expansion in the retail sector, increased infrastructure and housing developments by the government, increased investor confidence in the housing and hospitality market, and, KMRC efforts to provide affordable home loans to potential buyers
However, setbacks such as oversupply in the retail and office sectors, increasing construction costs, and, limited investor knowledge on Real Estate Investment Trusts is expected to weigh down the overall performance of the sector |
We expect the Real Estate sector to record increased and continuous performance on the back of support from; i) government infrastructural development initiatives and focus on affordable housing, ii) continuous focus on mortgage financing through the KMRC, iii) aggressive expansion by both local and international retailers, and, iv) Kenya's positive demographics driving housing demand However, factors such as increased construction costs on the back of inflation, constrained financing to developers with increased underdeveloped capital markets, oversupply in select sectors and low of investor appetite in Real Estate Investments Trusts (REITs) are expected to continue impeding performance of the sector |
Neutral |
Neutral |
|
Land Sector Performance |
Land sector in the NMA has proven to be resilient and a viable investment hence we expect it to continue recording impressive performance mainly attributed to rapid infrastructure developments opening areas for investments, and positive demographics driving demand for development land |
Land sector in the NMA continued to record improved performance as a reliable investment opportunity. We expect that the sector's performance to be supported by; i) infrastructural developments opening up satellite towns to real estate investment and development. ii) rising demand for development land facilitated by positive population demographics, ii) ongoing efforts by the government to streamline land transactions creating a more efficient and accessible market, iii) notable increase in the initiation and completion of affordable housing projects owing to both government and private sector involvement, and, iv) rapid expansion of satellite towns, accompanied by substantial infrastructural developments resulting in elevated property prices |
positive |
positive |
|
We have three Neutral outlooks; for infrastructure development, legal reforms and Real Estate activities and one negative outlook for credit supply and one positive for the land sector performance thereby bringing our overall outlook for the sector to NEUTRAL. We expect the performance to be further boosted by factors driving demand for development land such as; i) Increased infrastructure developments which has improved and opened up areas for investment, ii) Roll out of numerous affordable housing projects by both the public and private sectors, iii) Affordability of land in the satellite towns, iv) Limited supply of land especially in urban areas which has contributed to exorbitant prices, and, v) Positive demographics driving demand for land upwards, facilitated by high population growth and urbanization rates of 1.9% p.a and 3.7% p.a, respectively against the global averages 0.9% p.a and 1.6% p.a, respectively. |
||||
Disclaimer: The views expressed in this publication are those of the writers where particulars are not warranted. This publication, which is in compliance with Section 2 of the Capital Markets Authority Act Cap 485A, is meant for general information only and is not a warranty, representation, advice or solicitation of any nature. Readers are advised in all circumstances to seek the advice of a registered investment advisor

- Talk to us
- Kenya
- P.O Box 20695 - 00200, Nairobi, Kenya
- Cell +254709101200
- Tel +254709101200
- WhatsApp +254741676635
- United States
- +254709101200
- DOWNLOAD OUR APP
-


- Kenya
- 8th Floor, Pinetree Plaza, Kaburu Drive, Ngong Road, Nairobi, Kenya
- USA
- Suite 1150, 1775 Eye Street NW, USA, Washington DC 20006, USA
- Investments
- High Yield
- Private Equity
- Real Estate
- Real Estate
- RiverRun Estates
- Cytonn Towers
- The Ridge
- Taraji Heights
- The Alma