Nairobi Metropolitan Area (NMA) Residential Report 2021, & Cytonn Weekly #27/2021
By Research Team, Jul 11, 2021
Executive Summary
Fixed Income
During the week, T-bills remained oversubscribed, with the overall subscription rate coming in at 146.0%, an increase from the 130.6% recorded the previous week. The 91-day paper recorded the highest subscription rate, receiving bids worth Kshs 11.3 bn against the offered Kshs 4.0 bn, translating to a subscription rate of 282.7%, an increase from the 252.0% recorded the previous week. The oversubscription of the 91-day paper is attributable to the higher risk adjusted return offered by the paper given the decline in the rates of the other papers. The subscription rate for the 364-day paper declined to 43.2%, from 73.2% recorded the previous week, while the subscription rate for the 182-day paper increased to 194.1%, from 139.5% recorded the previous week. The yields on all the three papers declined; with the 91-day, 182-day and 364-day paper declining by 11.4 bps, 12.7 bps and 8.5 bps, to 6.6%, 7.1% and 7.6%, respectively.
Earlier in the week, Stanbic Bank released its monthly Purchasing Managers’ Index (PMI) highlighting that the index decreased to 51.0 in June 2021 from the 52.5 recorded in May 2021, indicating that the business conditions, in the Kenyan private sector, recorded an expansion but at a slower rate than that seen in May 2021. Additionally, during the week, the Kenya Revenue Authority (KRA) released the annual revenue performance FY’2020/2021 highlighting that the revenue collected totaled Kshs 1.67 tn against the revised target of Kshs 1.65 tn, representing an outperformance rate of 101.0%;
Equities
During the week, the equities market was on an upward trajectory, with NASI, NSE 25 and NSE 20 gaining by 2.3%, 2.2% and 1.2%, respectively, taking their YTD performance to gains of 15.2%, 13.3% and 4.2% for NASI, NSE 25 and NSE 20, respectively. The equities market performance was mainly driven by gains recorded by banking stocks such as KCB Bank, ABSA and Equity Group of 7.1%, 6.9% and 4.9%, respectively. The gains were however weighed down by losses recorded by Bamburi, Standard Chartered Bank and BAT Kenya which declined by 3.6%, 0.4% and 0.3%;
Real Estate
During the week, Kenya joined 24 other African countries in signing the Yaoundé Declaration, a joint declaration that seeks to offer mass production of decent and affordable housing on the African continent for the next 40 years. Additionally, Co-operative Bank of Kenya, launched a pension backed mortgage facility in partnership with Enwealth Financial Services Limited, a retirement services provider, which will allow clients to own homes through mixed financing of their pension contributions, and a long term loan. In the Statutory Reviews, President Uhuru Kenyatta signed into law the Finance Bill, 2021, aimed at increasing the government’s revenue collection base;
Focus of the Week
This week we update our research on the Nairobi Metropolitan Area (NMA) residential sector by showcasing the sector’s performance. We shall review the price performance, rental yields and space uptake, based on the coverage of 32 areas;
Investment Updates:
- Weekly Rates:
- Cytonn Money Market Fund closed the week at a yield of 10.17%. To invest, just dial *809#;
- Cytonn High Yield Fund closed the week at a yield of 15.73% p.a. To invest, email us at sales@cytonn.com and to withdraw the interest you just dial *809#;
- We continue to offer Wealth Management Training daily, from 9:00 am to 11:00 am, through our Cytonn Foundation. The training aims to grow financial literacy among the general public. To register for any of our Wealth Management Trainings, click here;
- If interested in our Private Wealth Management Training for your employees or investment group, please get in touch with us through wmt@cytonn.com;
- Cytonn Insurance Agency acts as an intermediary for those looking to secure their assets and loved ones’ future through insurance namely; Motor, Medical, Life, Property, WIBA, Credit and Fire and Burglary insurance covers. For assistance, get in touch with us through insuranceagency@cytonn.com;
- Cytonnaire Savings and Credit Co-operative Society Limited (SACCO) provides a savings and investments avenue to help you in your financial planning journey. To enjoy competitive investment returns, kindly get in touch with us through clientservices@cytonn.com;
Real Estate Updates:
- For an exclusive tour of Cytonn’s real estate developments, visit: Sharp Investor's Tour, and for more information, email us at sales@cytonn.com;
- Phase 3 of The Alma is now ready for occupation. To rent please email properties@cytonn.com;
- We have 10 investment-ready projects, offering attractive development and buyer targeted returns. See further details here: Summary of Investment-ready Projects;
- For recent news about the group, see our news section here.
Hospitality Updates:
- We currently have promotions for Staycations, visit cysuites.com/offers for details or email us at sales@cysuites.com;
Money Markets, T-Bills & T-Bonds Primary Auction:
During the week, T-bills remained oversubscribed, with the overall subscription rate coming in at 146.0%, an increase from the 130.6% recorded the previous week. The 91-day paper recorded the highest subscription rate, receiving bids worth Kshs 11.3 bn against the offered Kshs 4.0 bn, translating to a subscription rate of 282.7%, an increase from the 252.0% recorded the previous week. The oversubscription of the 91-day paper is attributable to the higher risk adjusted return offered by the paper given the decline in the rates of the other papers. The subscription rate for the 364-day paper declined to 43.2%, from 73.2% recorded the previous week, while the subscription rate for the 182-day paper increased to 194.1%, from 139.5% recorded the previous week. The yields on all the three papers declined; with the 91-day, 182-day and 364-day paper declining by 11.4 bps, 12.7 bps and 8.5 bps, to 6.6%, 7.1% and 7.6%, respectively. The government continued to reject expensive bids, accepting Kshs 27.3 bn out of the Kshs 35.0 bn worth of bids received, translating to an acceptance rate of 77.8%.
In the primary bonds auction, the government reopened three previously issued bonds, FXD1/2012/15, FXD1/2018/15 and FXD1/2021/25 with effective tenors of 6.2 years, 11.9 years and 24.9 years, respectively. The period of the sale runs between 28th June 2021 and 13th July 2021. The bonds are currently trading at a yield of 11.5%, 12.5% and 13.5% in the secondary market, respectively. We recommend the following bidding ranges; (i) FXD1/2012/15 – 11.4%-11.8%, (ii) FXD1/2018/15 – 12.4%-12.7%, and, (iii) 13.4%-13.8%. We anticipate an oversubscription on the three bonds, due to ample liquidity in the money markets coupled with the fact that the yields on the short term papers have been continually declining in the past weeks.
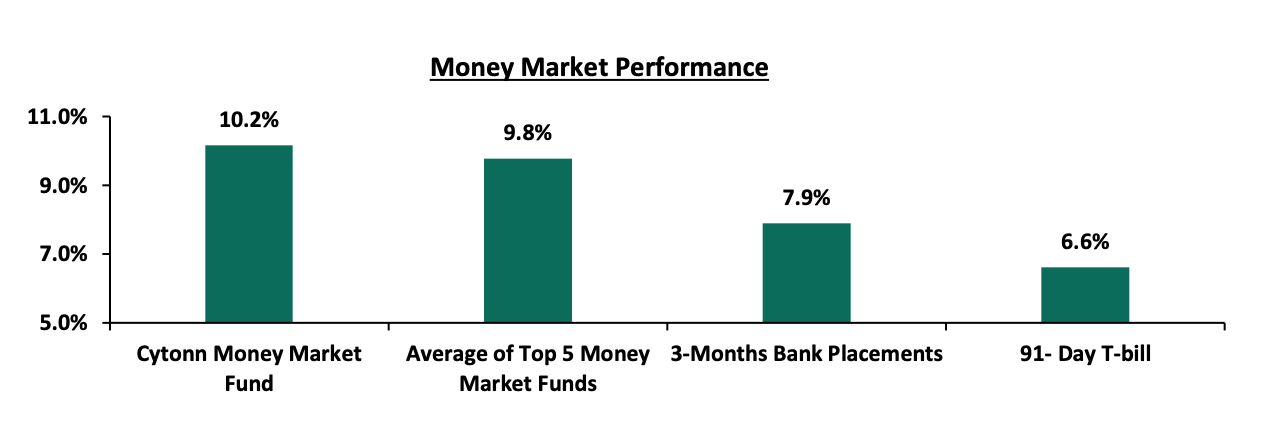
In the money markets, 3-month bank placements ended at 7.9% (based on what we have been offered by various banks), while the 91-day T-bill declined by 11.4 bps to 6.6% from 6.7%, recorded the previous week. The average yield of the Top 5 Money Market Funds remained unchanged at 9.8%, similar to what was recorded the previous week, while the yield on the Cytonn Money Market (CMMF) increased by 0.1% points to 10.2% from 10.1%, recorded the previous week.
The table below shows the Money Market Fund Yields for Kenyan Fund Managers as published on 9th July 2021:
|
Money Market Fund Yield for Fund Managers as published on 9th July 2021 |
|||
|
Rank |
Fund Manager |
Daily Yield |
Effective Annual Rate |
|
1 |
Cytonn Money Market Fund |
9.68% |
10.17% |
|
2 |
Nabo Africa Money Market Fund |
9.52% |
9.95% |
|
3 |
Zimele Money Market Fund |
9.56% |
9.91% |
|
4 |
Orient Kasha Money Market Fund |
9.06% |
9.45% |
|
5 |
Sanlam Money Market Fund |
9.01% |
9.43% |
|
6 |
CIC Money Market Fund |
9.08% |
9.41% |
|
7 |
Madison Money Market Fund |
8.98% |
9.40% |
|
8 |
Co-op Money Market Fund |
8.60% |
8.98% |
|
9 |
GenCap Hela Imara Money Market Fund |
8.46% |
8.83% |
|
10 |
Dry Associates Money Market Fund |
8.30% |
8.62% |
|
11 |
British-American Money Market Fund |
8.18% |
8.50% |
|
12 |
ICEA Lion Money Market Fund |
8.02% |
8.35% |
|
13 |
NCBA Money Market Fund |
8.03% |
8.33% |
|
14 |
Apollo Money Market Fund |
8.40% |
8.27% |
|
15 |
Old Mutual Money Market Fund |
6.74% |
6.95% |
|
16 |
AA Kenya Shillings Fund |
6.72% |
6.94% |
Liquidity:
During the week, liquidity in the money market eased, with the average interbank rate decreasing to 4.8% from 4.9% recorded the previous week, partly attributable to government payments, including term auction deposits maturities of Kshs 39.7 bn which offset the settlements of government securities and tax remittances. The average interbank volumes traded increased by 46.5% to Kshs 11.0 bn, from Kshs 7.5 bn recorded the previous week.
Kenya Eurobonds:
During the week, the yields on Eurobonds remained relatively unchanged, with the yields on the 10-year bond issued in 2014, 10-year bond issued in 2018, 30-year bond issued in 2018, 12-year bond issued in 2019 and 12-year bond issued in 2021 remaining unchanged at 3.3%, 5.4%, 7.4%, 6.3%, and 6.3%, respectively. On the other hand, the yield on the 7-year bond issued in 2019 increased marginally by 0.1% points to 4.9%, from 4.8% recorded the previous week. Below is a summary of the performance:
|
Kenya Eurobond Performance |
||||||
|
|
2014 |
2018 |
2019 |
2021 |
||
|
Date |
10-year issue |
10-year issue |
30-year issue |
7-year issue |
12-year issue |
12-year issue |
|
31-Dec-20 |
3.9% |
5.2% |
7.0% |
4.9% |
5.9% |
- |
|
30-Jun-21 |
3.3% |
5.4% |
7.4% |
4.8% |
6.3% |
6.3% |
|
01-Jul-21 |
3.3% |
5.4% |
7.4% |
4.8% |
6.3% |
6.3% |
|
02-Jul-21 |
3.3% |
5.4% |
7.4% |
4.8% |
6.3% |
6.3% |
|
05-Jul-21 |
3.3% |
5.4% |
7.4% |
4.8% |
6.3% |
6.3% |
|
06-Jul-21 |
3.3% |
5.4% |
7.4% |
4.8% |
6.3% |
6.3% |
|
07-Jul-21 |
3.4% |
5.4% |
7.4% |
4.8% |
6.3% |
6.3% |
|
08-Jul-21 |
3.3% |
5.5% |
7.4% |
4.9% |
6.3% |
6.3% |
|
09-Jul-21 |
3.3% |
5.4% |
7.4% |
4.9% |
6.3% |
6.3% |
|
Weekly Change |
0.0% |
0.0% |
0.0% |
0.1% |
0.0% |
0.0% |
|
MTD Change |
0.0% |
0.0% |
0.1% |
0.1% |
0.0% |
0.0% |
|
YTD Change |
(0.6%) |
0.2% |
0.4% |
0.0% |
0.4% |
- |
Source: Reuters
Kenya Shilling:
During the week, the Kenyan shilling remained stable against the US dollar closing at Kshs 108.0, same as was recorded the previous week, as the demand for the dollar matched its supply in the local currency market. On a YTD basis, the shilling has appreciated by 1.1% against the dollar, in comparison to the 7.7% depreciation recorded in 2020. Despite the recent appreciation of the shilling, we expect the shilling to remain under pressure in 2021 as a result of:
- Rising uncertainties in the global market due to the Coronavirus pandemic, which has seen investors continue to prefer holding their investments in dollars and other hard currencies and commodities, and,
- Demand from merchandise traders as they beef up their hard currency positions in anticipation for more trading partners reopening their economies globally,
The shilling is however expected to be supported by:
- The Forex reserves, currently at USD 9.6 bn (equivalent to 5.9 months of import cover), which is above the statutory requirement of maintaining at least 4.0-months of import cover, and the EAC region’s convergence criteria of 4.5-months of import cover,
- The stable current account position which is estimated to remain at a deficit of 5.2% of GDP in 2021, and,
- Improving diaspora remittances evidenced by a 22.3% y/y increase to USD 315.8 mn in May 2021, from USD 258.2 mn recorded over the same period in 2020, which has continued to cushion the shilling against further depreciation.
Weekly Highlights:
- Stanbic PMI Index June 2021
The headline Purchasing Managers’ Index (PMI) for the month of June 2021 decreased to 51.0 from the 52.5 recorded in May 2021, indicating that the business conditions in the Kenyan private sector recorded an expansion but at a slower rate than that seen in May 2021. The expansion in the business conditions is attributable to an improvement in consumer demand, both locally and globally, coupled with greater cash flow levels which supported growth in new orders and output. Additionally, the rise in demand led to an increase in the number of jobs created and an increase in the stocks of purchases in June 2021. See below a chart summarizing the evolution of the PMI over the last 24 months:
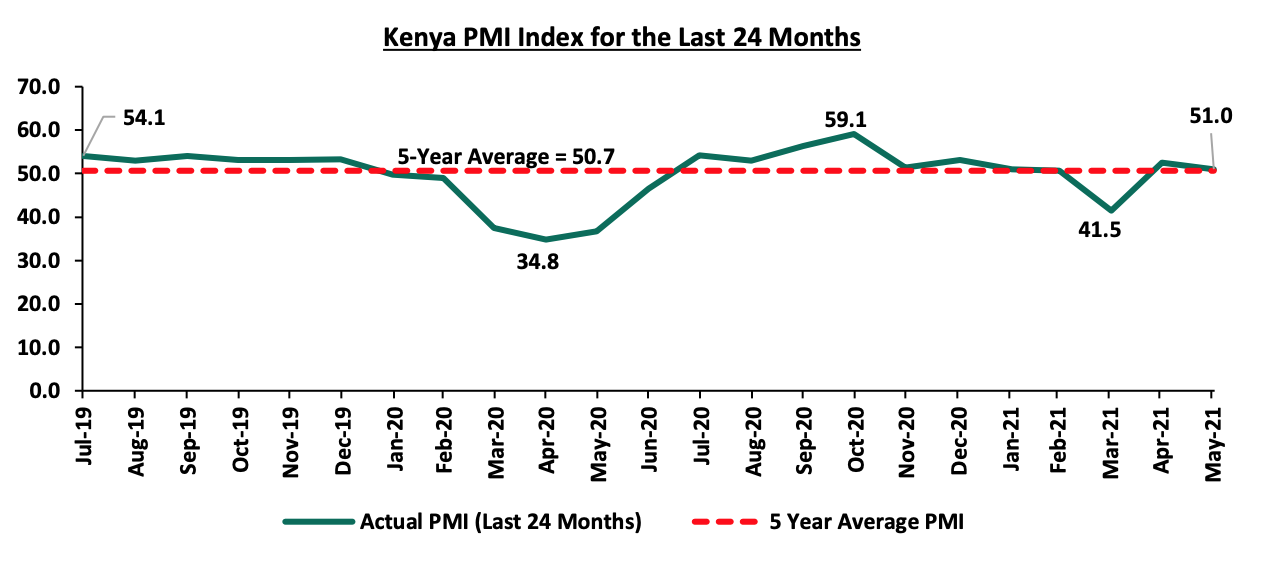
*** Key to note, a reading above 50.0 signals an improvement in business conditions, while readings below 50.0 indicate a deterioration
In line with decline of the PMI index reading for the month of June 2021, we maintain a cautious outlook in the short term owing to the lag in procurement and more worryingly, concerns of further Covid-19 restrictions. The discovery of new variants, especially the Delta variant, that are more easily transmissible might lead to another wave of infections and more restrictions that will affect the business environment. The last announcement of Covid-19 restrictions in April 2021 saw the PMI index decline to 41.5 – the country’s lowest PMI index since May 2020.
- Annual Revenue Performance FY’2020/2021
During the week, the Kenya Revenue Authority (KRA) released the annual revenue performance FY’2020/2021 highlighting that the total revenue collected was Kshs 1.67 tn, against the revised target of Kshs 1.65 tn, representing an out-performance rate of 101.0%. This is despite the challenges posed by the COVID-19 pandemic on business conditions and people’s income. Key to note, this marks the first time in 8 years that the KRA has outperformed its revenue collection target. The outperformance is mainly attributable to (i) enhanced compliance enforcement efforts and the implementation of new tax measures, focused on ensuring that that non-compliant taxpayers pay their due taxes, (ii) introduction of new taxes such as digital services tax, minimum tax and voluntary tax disclosure as KRA bid to expand sources of revenue, and, (iii) the reopening of the economy which led to a 12.0% growth in Domestic Excise tax in FY’2020/21, compared to a decline of 6.4% recorded in the last financial year. Overall, the revenue grew by 3.9% in FY’2020/2021 to Kshs 1.7 tn from Kshs 1.6 tn in FY’2019/2020.
The graph below shows a summary of Kenya’s revenue performance over the last 5 years, as per data by the Kenya Revenue Authority (KRA):
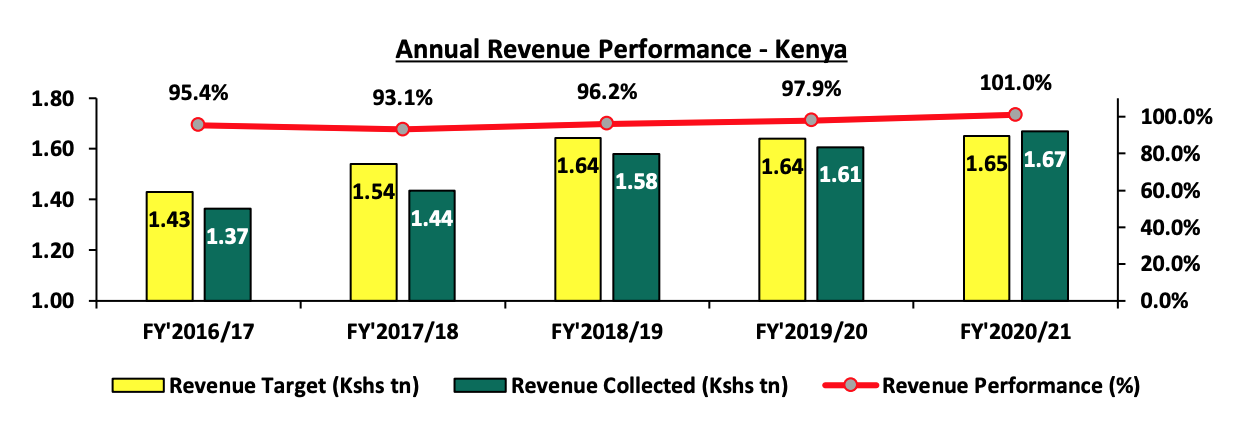
It is worth noting that, despite FY’2020/2021’s performance, the government has in the past struggled to raise the taxes, and we think that with the ongoing pandemic this could be repeated in FY’2021/2022. In our view, the Government should; (i) rely on an expanded tax base and increase in some taxes in order to meet its revenue target, and, (ii) intensify its efforts in minimizing the recurrent expenditure growth in order to achieve its target fiscal deficit of 3.6% in FY’2024/25.
Rates in the fixed income market have remained relatively stable due sufficient levels of liquidity in the money markets, coupled with the discipline by the Central Bank to reject expensive bids. The government is 116.0% behind its prorated borrowing target of Kshs 658.5 bn having borrowed Kshs 52.7 bn and made repayments of Kshs 56.7 bn in FY’2021/2022. We expect the government to fall short of its revenue collection target in FY’2021/2022 leading to a higher budget deficit as a percentage of the GDP, than the projected 7.5%. However, despite the projected high budget deficit and the lower credit rating from S&P Global to 'B' from 'B+', we believe that the monetary support from the IMF and World Bank will mean that the interest rate environment may stabilize since the government will not be desperate for cash.
Markets Performance
During the week, the equities market was on an upward trajectory, with NASI, NSE 25 and NSE 20 gaining by 2.3%, 2.2% and 1.2%, respectively, taking their YTD performance to gains of 15.2%, 13.3% and 4.2% for NASI, NSE 25 and NSE 20, respectively. The equities market performance was mainly driven by gains recorded by banking stocks such as KCB Bank, ABSA and Equity Group of 7.1%, 6.9% and 4.9%, respectively. The gains were however weighted down by losses recorded by Bamburi, Standard Chartered Bank and BAT Kenya which declined by 3.6%, 0.4% and 0.3%.
During the week, equities turnover increased by 5.9% to USD 25.1 mn, from USD 23.7 mn recorded the previous week, taking the YTD turnover to USD 677.5 mn. Foreign investors turned net sellers, with a net selling position of USD 0.6 mn, from a net buying position of USD 2.5 mn recorded the previous week, taking the YTD net selling position to USD 26.2 mn.
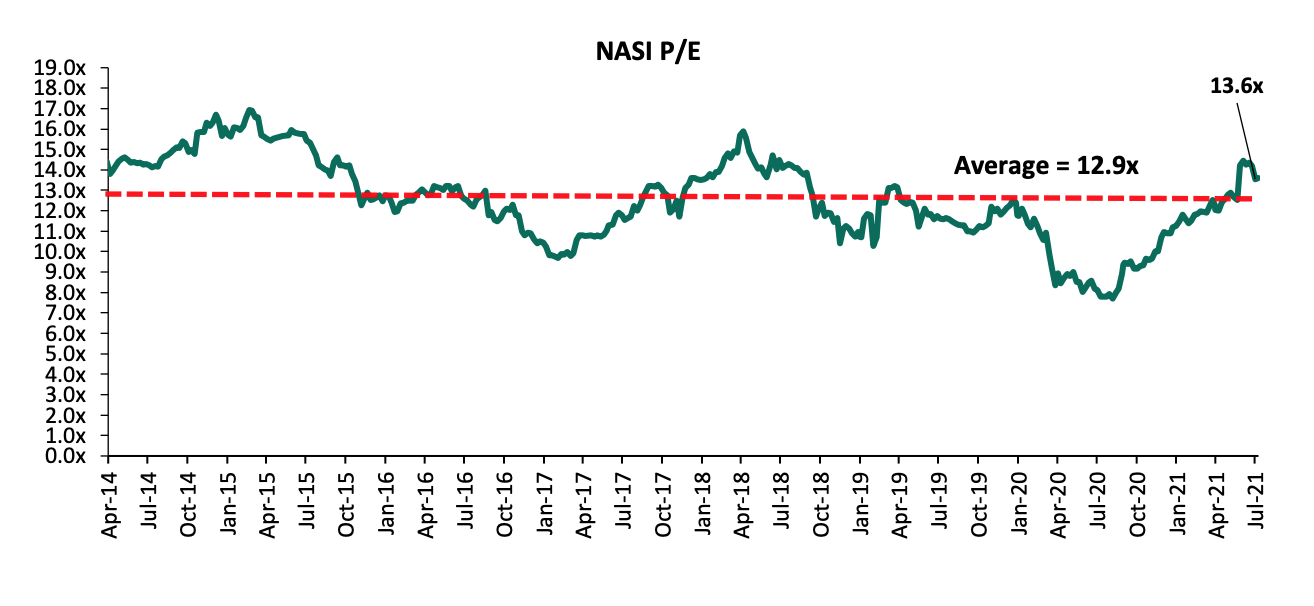
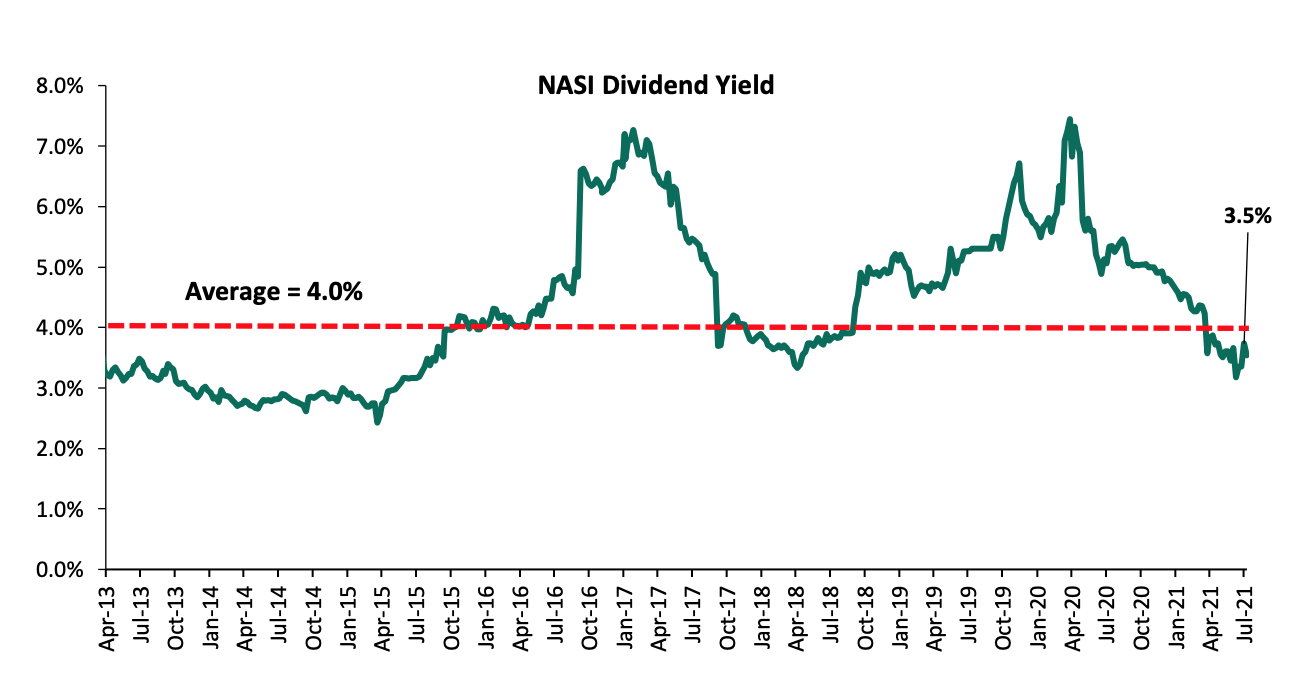
The market is currently trading at a price to earnings ratio (P/E) of 13.6x, 5.4% above the historical average of 12.9x, and a dividend yield of 3.5%, 0.5% points below the historical average of 4.0%. Key to note, NASI’s PEG ratio currently stands at 1.5x, an indication that the market is trading at a premium to its future earnings growth. Basically, a PEG ratio greater than 1.0x indicates the market may be overvalued while a PEG ratio less than 1.0x indicates that the market is undervalued. Excluding Safaricom, the market is trading at a P/E ratio of 12.7x and a PEG ratio of 1.4x. The current P/E valuation of 13.6x is 76.8% above the most recent trough valuation of 7.7x experienced in the first week of August 2020. The charts below indicate the historical P/E and dividend yields of the market.
Universe of Coverage:
Below is a summary of our universe of coverage and the recommendations:
|
Company |
Price as at 02/07/2021 |
Price as at 09/07/2021 |
w/w change |
YTD Change |
Year Open 2021 |
Target Price* |
Dividend Yield |
Upside/ Downside** |
P/TBv Multiple |
Recommendation |
|
I&M Group*** |
21.6 |
21.6 |
0.0% |
(52.0%) |
44.9 |
29.8 |
10.4% |
48.7% |
0.3x |
Buy |
|
Kenya Reinsurance |
2.4 |
2.4 |
0.4% |
5.2% |
2.3 |
3.1 |
4.1% |
31.7% |
0.3x |
Buy |
|
Sanlam |
10.2 |
10.2 |
(0.5%) |
(21.9%) |
13.0 |
12.4 |
0.0% |
22.2% |
0.9x |
Buy |
|
NCBA*** |
25.0 |
26.0 |
4.0% |
(2.3%) |
26.6 |
29.5 |
5.8% |
19.2% |
0.6x |
Accumulate |
|
Diamond Trust Bank*** |
59.0 |
59.0 |
0.0% |
(23.1%) |
76.8 |
70.0 |
0.0% |
18.6% |
0.3x |
Accumulate |
|
Stanbic Holdings |
83.0 |
80.0 |
(3.6%) |
(5.9%) |
85.0 |
90.5 |
4.8% |
17.9% |
0.8x |
Accumulate |
|
Standard Chartered*** |
130.0 |
129.5 |
(0.4%) |
(10.4%) |
144.5 |
134.5 |
8.1% |
12.0% |
0.9x |
Accumulate |
|
Co-op Bank*** |
13.4 |
13.5 |
0.7% |
7.6% |
12.6 |
13.8 |
7.4% |
9.6% |
0.9x |
Hold |
|
KCB Group*** |
42.5 |
45.5 |
7.1% |
18.5% |
38.4 |
48.6 |
2.2% |
9.0% |
1.1x |
Hold |
|
ABSA Bank*** |
9.4 |
10.1 |
6.9% |
5.6% |
9.5 |
10.7 |
0.0% |
6.5% |
1.1x |
Hold |
|
Liberty Holdings |
7.7 |
8.0 |
3.9% |
3.9% |
7.7 |
8.4 |
0.0% |
5.0% |
0.6x |
Lighten |
|
Equity Group*** |
46.7 |
49.0 |
4.9% |
35.2% |
36.3 |
51.2 |
0.0% |
4.5% |
1.4x |
Lighten |
|
Britam |
7.2 |
7.5 |
4.5% |
7.1% |
7.0 |
6.7 |
0.0% |
(10.7%) |
1.4x |
Sell |
|
Jubilee Holdings |
375.5 |
390.0 |
3.9% |
41.4% |
275.8 |
330.9 |
2.3% |
(12.8%) |
0.8x |
Sell |
|
HF Group |
3.9 |
3.9 |
0.0% |
24.2% |
3.1 |
3.2 |
0.0% |
(17.9%) |
0.2x |
Sell |
|
CIC Group |
2.4 |
3.4 |
41.3% |
60.7% |
2.1 |
1.8 |
0.0% |
(46.9%) |
1.2x |
Sell |
|
Target Price as per Cytonn Analyst estimates **Upside/ (Downside) is adjusted for Dividend Yield ***For Disclosure, these are stocks in which Cytonn and/or its affiliates are invested in Key to note, I&M Holdings YTD share price change is mainly attributable to counter trading ex-bonus issue. |
||||||||||
We are “Neutral” on the Equities markets in the short term. With the market currently trading at a premium to its future growth (PEG Ratio at 1.5x), we believe that investors should reposition towards companies with a strong earnings growth and are trading at discounts to their intrinsic value. Additionally, we expect the recent discovery of new strains of COVID-19 coupled with the introduction of strict lockdown measures in major economies to continue dampening the economic outlook.
- Residential sector
During the week, Kenya joined 24 other African countries in signing the Yaoundé Declaration, a joint declaration that seeks to offer mass production of decent and affordable housing on the African continent for the next 40 years. The declaration issued at Pan-African affordable housing firm Shelter Afrique’s 40th Annual General Meeting (AGM) in Yaoundé Cameroon, is centered at addressing issues of leadership and governance as well as policies and legislations to build capacity and the adoption of new building technologies. According to Shelter Afrique, Africa has a shortage of about 56.0 mn housing units attributable to i) high population and urbanization growth rates, ii) poor urban planning, iii) rising construction costs, iv) proliferation of informal settlements, and, v) dysfunctional and challenged markets in the continent.
In a bid to further strength its holding in the Pan African organization, the government of Kenya acquired additional 3.9% stake in Shelter Afrique for Kshs 995.6 mn, deepening its position as the top shareholder currently holding 18.7%. Shelter Afrique has financed 114 projects in Kenya since inception, including the Greville Groove project and Oak Park apartments, and approved financing worth Kshs 24.3 bn with Kshs 215.8 mn going to the Kenya Mortgage Refinance Company (KMRC) in a bid to bring down cost of mortgages.
The move by the Kenyan government to participate in the mass production of affordable homes is expected to increase home ownership in Kenya which has been relatively low at 21.3% compared to 53.0% in South Africa according to the Centre for Affordable Housing Finance (CAHF). Some of the reasons for the low housing include; i) unaffordability of mortgages from the high interest rates and amounts, ii) low income from the tough economic times leading to high amounts of non-performing loans, causing loan limits by lenders, iii) data deficiency especially for clients in the informal sector for proper risk assessments to warrant loan provisions, iv) sluggishness in the government’s affordable housing program, and v) lack of sufficient development finance to increase housing supply.
The graph below shows the percentage of home ownership in different countries compared to Kenya;
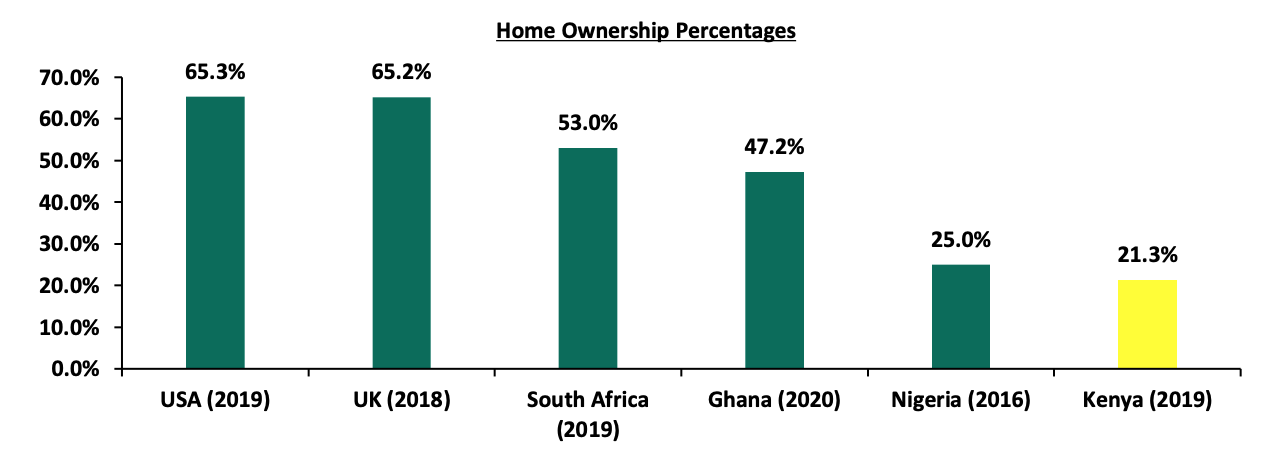
Source: Centre for Affordable Housing Finance in Africa
Additionally, during the week, Co-operative Bank of Kenya launched a pension backed mortgage facility in partnership with Enwealth Financial Services Limited, a retirement services provider, which will allow clients to own homes through mixed financing of their pension contributions, and a long term loan. This is in line with the budget changes where the pension scheme members can access up to 40.0% of their accrued benefits for residential house purchase with up to a maximum of Kshs 7.0 mn. This partnership covers pension scheme members whose maximum allowed pension benefits cannot cover the full asking price of the targeted house, and the bank will lend the difference, with house acting as the collateral under a repayment period of up to 20 years but subject to the retirement age of the borrower. The partnership will allow about 3 mn pension contributors in the country, and especially within the targeted middle income bracket, to own houses and bridge the gap in the demand for affordable housing which grows by 200,000 units annually.
This comes after Absa Bank Kenya introduced housing solutions to their middle income clients in Nairobi in June 2021, at discounted rates and with flexible repayments showing the private sector’s efforts towards affordable housing solutions to supplement government’s efforts. The increased mortgage uptake is expected to boost the number of mortgage accounts, and increase the mortgage to GDP ratio in the country, which remains very low at 2.2% as at 2020, compared to other African countries such as Namibia and South Africa with mortgage to GDP ratio of 25.4% and 19.6%, respectively.
The graph below shows the mortgage to GDP percentages for Kenya compared to other countries;
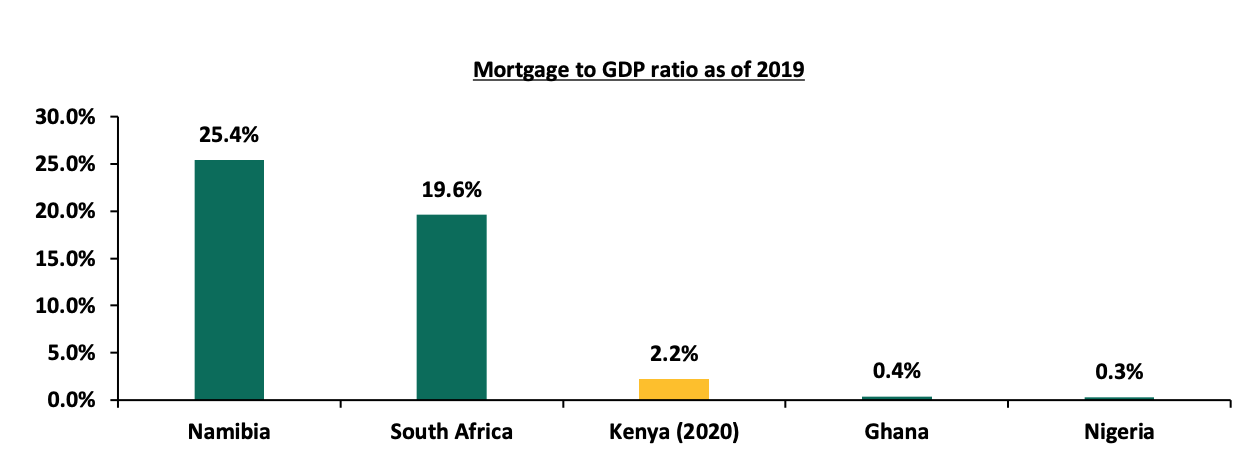
Source: Centre for Affordable Housing Finance in Africa
The residential sector is expected to record increased activities supported by the government’s effort to avail affordable housing through international conventions and the private sectors’ commitment to offer affordable mortgages with flexible terms to clients.
- Statutory Reviews
During the week, President Uhuru Kenyatta signed into law the Finance Bill, 2021, which was tabled in parliament on May 11th 2021 for debate with the aim to increase the government’s revenue collection base. Some of the key take-outs from the bill related to the real estate sector include;
- A re-introduction of a 20.0% excise duty on fees and other commissions earned on loans by financial institutions. The move risks making credit costly for home owners and developers as lenders will transfer the burden to borrowers,
- Clarification to the definition of infrastructure bond to include road, hospital, port, sporting facility, water and sewerage system or a communication network in an aim to clarify that, only interest income received from infrastructure bonds for a maturity of at least 3 years is exempt from income tax. This will clarify the interest taxable and the timelines with the taxing body,
- Expansion of the meaning of Permanent Establishment (PE) to include a building site, construction, assembly or installation project or any supervisory activity connected to the site or project but only if it continues for a period of more than 183 days. This definition seeks to align domestic legislation with international best practices, and,
- Reintroduction of the definition of civil works under the terms ‘building used for manufacture and commercial building’ to include roads, railways and others. The reintroduction will provide clarity on additional works that qualify for investment allowance especially in the real estate sector.
The expected rise in the cost of borrowing will hemorrhage real estate sector the more, despite current challenges such as the i) high number of non-performing loans recording a 6.4% q/q increase in Q4’2020, ii) high interest rates for mortgages current at 13.0%, iii) the lack of enough information especially for those in the informal sector to warrant loan provisions, and, iv) tough economic times in the midst of COVID-19. We therefore foresee an increase in non-performing loans and low mortgage uptakes, depressing affordable housing efforts already in place. Other legislations will provide clarity to ensure that the real estate sector is streamlined for the growth of the country’s economy.
The performance of the real estate sector is expected to be supported by continued efforts to offer decent affordable housing in the country through international conventions, and private sector aggressiveness to offer mortgage rates with bespoke financing and repayments period terms. However, the sector remains constrained by statutory regulations such as 20.0% excise duty reintroduced on loan fees with financial institutions expected to transfer the burden to loan clients.
Last year, we released our Nairobi Metropolitan Area (NMA) Residential Report 2020, themed “A Buyer’s Market Amidst a Global Crisis” where we analyzed the performance of 31 residential nodes. This week we update our research on the Nairobi Metropolitan Area (NMA) residential sector by showcasing the sector’s performance in the region in terms of price appreciation, rental yields and market uptake, based on coverage of 32 areas located within the Nairobi Metropolis. We also discuss factors affecting residential supply and demand, the recent developments impacting the sector and conclude with a look at the investment opportunities as well as the sector’s overall outlook for the next financial year. As such, we shall discuss the following:
- Overview of the Residential Sector,
- Recent Developments,
- Residential Market Performance, and,
- Conclusion, Outlook and Investment Opportunity
Section I: Overview of the Residential Sector
In FY’2020/21, the residential sector recorded increased activities supported by the reopening of the economy in August 2020 leading to a more favourable operating environment which encouraged construction activities and property transactions. As at Q3’2020 real estate and construction’s contribution to GDP stood at 16.0%, a 0.9% points increase compared to 15.1% recorded in Q2’2020 according to Kenya National Bureau of Statistics Quarterly Gross Domestic Product Report, with the improvement attributed to increased liquidity after a boost in investor confidence, when the government relaxed measures imposed to curb the spread of the pandemic. The residential sector continued to boost performance of the real estate sector with house prices and rents having recorded an uptick. We expect the sector’s contribution to improve more for the rest of the year despite the pandemic effects supported by;
- Government and private sector aggressiveness in implementing housing initiative programs,
- Anticipated increase in the number of building approvals complemented by the planned Kshs 30.0 mn Nairobi County e-Development Permit System upgrade expected to be done by June 2022, aiming to offer faster and efficient construction approvals in Nairobi, and,
- Allocation of Kshs 3.5 bn to the Kenya Mortgage Refinance Company (KMRC) in the FY’2021/22 Budget Statement, to boost mortgage uptake thus encourage buying, building and housing construction activities.
We expect the following factors to shape the performance of the residential sector;
- Housing Deficit: There still exists a housing deficit of more than 2.0 mn units with the government’s initiative of delivering approximately 50,000 units every year still yet to be realized. With the current tough economic time, affordable housing continues to attract demand as people seek to own homes at a time when the country has seen increased unemployment and the subsequent drop in disposable incomes,
- Demographics: According to the 2019 census data, Kenya currently has a population of 47.6 mn, with higher population and urbanization growth rates than the rest of the world; currently at 2.2% and 4.0% against the global averages of 1.1% and 1.9% respectively, and,
- Access to Credit: The high mortgage interest rate currently at 12.0% and high transaction costs, has made it difficult for low and middle income earners to afford mortgages. However, with the government having allocated Kshs 3.5 bn for FY’2021/22 to Kenya Mortgage Refinance Company (KMRC) to enhance its capital and provide affordable loans, we expect improvement in performance in the mortgage lending and uptake rate.
In terms of supply, the residential sector was largely constrained by insufficient access to affordable funding by developers, and bureaucracies and delays in approval processes. In 2021, new supply is also expected to slow down owing to:
- Insufficient Access to Credit: With the increase in non-performing loans, the resultant impact is that most of the lenders will pull back or cease new lending to real estate backed loans due to the risk of default in payment, therefore we expect developers to seek alternative sources of financing such as Real Estate Investment Trusts and bonds,
- Infrastructure: Inadequate and poor infrastructure in different regions of the country limit development activities due to lack of accessibility hence supply limited as well. The insufficient drainage and sewerage systems in some areas also discourage developers due to the expected high development costs of projects, and,
- High Development Costs: Development costs remain high subject to high land and financing costs. According to Cytonn Land Report 2020, average land price per acre within Nairobi Suburbs is currently at Kshs 419.0 mn, in comparison to the Satellite Town’s average of Kshs 25.0 mn, thus makes it hard for developers to undertake projects without sufficient financial resources.
However, to improve profit margins and supply, developers have embraced joint venture deals and public-private partnerships (PPP) with institutions like foreign investment institutions seeking to enter the market.
Section II: Recent Developments
In terms of regulation, the government announced a couple of policies and measures affecting the residential sector namely:
- Finance Bill, 2021: H.E President Uhuru Kenyatta signed the Bill into law, and some of its provisions include; i) re-introduction of a 20.0% excise duty on fees and other commissions earned on loans by financial institutions, ii) definition of infrastructure bond to include road, hospital, port, sporting facility, water and sewerage system or a communication network with interest income received from infrastructure bonds for a maturity of at least 3 years exempt from income tax, and, iii) a Permanent Establishment (PE) to include a building site, construction, assembly or installation project or any supervisory activity connected to the site or project but only if it continues for a period of more than 183 days,
- The Landlord and Tenant Bill of 2021: The Bill was tabled in Parliament with the aim of consolidating the laws relating to the renting of business and residential premises and regulating the relationship between the landlord and tenant in order to promote stability in the rental sector, in March 2021,
- New Draft Valuation Roll: Nairobi’s City Hall announced plans to conduct public participation into the New Draft Valuation Roll, on 16th June 2021 in the 17 sub-counties in Nairobi, to pave way for its roll-out, since being tabled before the Nairobi County Assembly February 2021, and,
- National Property Rating Legislation: The Kenya’s National Treasury announced plans to draft a national property rating legislation to replace the outdated Valuation for Rating Act of 1956 and the Rating Act of 1963 in January 2021. The agency sought to overhaul the 1956 property valuation laws in a bid to determine new land rates and ensure inclusion of more property owners into the tax bracket.
On the affordable housing front, we continued to see both the government and private sector launching projects with low-cost housing being the main focus, and a few notable projects launched or ongoing during FY’2020/21 include:
|
Various Launched/Ongoing Affordable Housing Projects in FY’2020/21 |
|||||
|
Project |
Organization |
No. of Units |
Project Start Date |
Project Status |
Expected Date of Completion |
|
River Estate, Ngara |
National Government and Edderman Property Limited |
2,720 |
March 2019 |
Ongoing |
December 2021 |
|
Pangani Housing Project |
National Government and Tecnofin Kenya Limited |
1,562 |
May 2020 |
Ongoing |
May 2022 |
|
Buxton Estate |
County Government of Mombasa and Buxton Developers |
1,860 |
May 2021 |
Ongoing |
May 2022 |
|
Nakuru Affordable Housing Units |
National Government and World Bank |
600 |
May 2021 |
Ongoing |
November 2022 |
|
Kakmega Affordable Housing Project |
County Government of Kakamega |
4,000 |
July 2021 |
Initial stages |
March 2022 |
|
Kongowea Village Mombasa |
International Finance Corporation and Belco Realty |
1,379 |
- |
Initial Stages |
2024 |
|
British-Funded Affordable Housing Initiative |
Acorn Holdings |
10,000 |
- |
- |
- |
Source: Online research
Section III: Residential Market Performance
In terms of performance, average total returns improved in FY’21 to 5.5%, a 0.5% points increase from 5.0% recorded in FY’20, and can be attributed to residential average y/y price appreciation, which came in at 0.6%, 0.7% points higher compared to a price correction of 0.1% recorded in FY’20. Market uptake remained subdued coming in at 15.1% on average, 3.2% points lower than 18.3% recorded last year, indicating reduced demand for residential units attributed to constrained purchasing power. However, the average price per SQM came in at Kshs 117,865, 3.4% higher than FY’20 average of Kshs 113,972, due to an uptick of house prices as sellers aimed to cash in on the improving business environment when the economy reopened.
(All Values in Kshs Unless Stated Otherwise)
|
Residential Performance Summary FY’21 |
||||||||
|
Segment |
Typology |
Average Price Per SQM |
Average Rent Per SQM |
Average Occupancy |
Average Annual Uptake |
Average Rental Yield |
Average Y/Y Price Appreciation |
Average Total Returns |
|
High-End |
Detached |
193,010 |
656 |
86.6% |
13.6% |
3.7% |
1.1% |
4.8% |
|
Upper Mid-End |
Detached |
142,934 |
610 |
87.8% |
12.9% |
4.6% |
1.2% |
5.8% |
|
Lower Mid-End |
Detached |
73,803 |
308 |
83.2% |
16.3% |
4.3% |
1.1% |
5.5% |
|
Upper Mid-End |
Apartments |
124,559 |
684 |
84.9% |
15.3% |
5.3% |
0.3% |
5.7% |
|
Lower Mid-End |
Apartments |
95,611 |
489 |
82.3% |
16.0% |
5.3% |
0.9% |
6.2% |
|
Satellite Towns |
Apartments |
77,272 |
411 |
82.7% |
16.5% |
5.6% |
(0.9%) |
4.7% |
|
Residential Market Average |
|
117,865 |
526 |
84.6% |
15.1% |
4.8% |
0.6% |
5.5% |
Source: Cytonn Research
The average rental yields recorded a 0.2% points decline to 4.8% from 5.0% last year, due to reduced rental rates as landlords hoped to attract and retain amidst a tough financial environment.
|
Residential Market Performance Summary: FY’21/FY’20 Comparison |
||||||||||
|
Segment |
Average Rental Yield FY'21 |
Average Y/Y Price Appreciation FY'21 |
Average Total Returns FY'21 |
Average Rental Yield FY'20 |
Average Y/Y Price Appreciation FY'20 |
Average Total Returns FY'20 |
Change in Rental Yield |
Change in Y/Y Price Appreciation |
Change in Total Returns (% Points) |
|
|
High End |
3.7% |
1.1% |
4.8% |
4.2% |
0.0% |
4.2% |
0.5% |
1.1% |
0.6% |
|
|
Upper Mid-End |
4.6% |
1.2% |
5.8% |
4.6% |
0.9% |
5.6% |
0.0% |
0.3% |
0.2% |
|
|
Lower Mid-End |
4.3% |
1.1% |
5.5% |
4.6% |
(0.5%) |
4.1% |
(0.3%) |
1.6% |
1.4% |
|
|
Detached Average |
4.2% |
1.1% |
5.4% |
4.5% |
0.1% |
4.6% |
(0.3%) |
(0.1%) |
0.8% |
|
|
Upper Mid-End |
5.3% |
0.3% |
5.7% |
5.4% |
(0.7%) |
4.6% |
(0.1%) |
1.0% |
1.1% |
|
|
Lower Mid-End |
5.3% |
0.9% |
6.2% |
5.8% |
0.1% |
5.9% |
(0.5%) |
0.8% |
0.3% |
|
|
Satellite Towns |
5.6% |
(0.9%) |
4.7% |
5.4% |
(0.1%) |
5.3% |
0.2% |
(0.8%) |
(0.6%) |
|
|
Apartments Average |
5.4% |
0.1% |
5.5% |
5.5% |
(0.2%) |
5.3% |
(0.1%) |
0.3% |
0.2% |
|
|
Residential Market Average |
4.8% |
0.6% |
5.5% |
5.0% |
(0.1%) |
5.0% |
(0.2%) |
0.7% |
0.5% |
|
|
||||||||||
Source: Cytonn Research
Sub-Market Analysis
In our submarket analysis, we classified the various suburbs in the Nairobi Metropolitan Area into three segments
- High End Segment – Consists of prime suburbs in Nairobi, such as Karen, Runda and Kitisuru. Most of these zones have been zones for low rise residential developments only and are characterized by palatial villas and bungalows on half acre parcels,
- Upper Middle Income Segment – Consists of suburbs such as Kilimani, Lavington, Kileleshwa, Loresho and Ridgeways among others. The population in these zones are middle class but with higher incomes than the average characterization of middle class. They are zones for both high rise and low density houses, and,
- Lower Middle Income Segment – Consists of suburbs in Nairobi habited by middle class such as Kikuyu, Ruaka, Dagoretti, Upper Kabete (Uthiru and parts of Mountain View), and Ngong Road (Race Course, Lenana, Corner), among others.
- Detached Units
The detached market registered improved performance in returns, coming in at 5.4% in FY’21 thus representing a 0.8% points y/y increase from 4.6% recorded in FY’20. The average rental yields came in at 4.2%, 0.3% points lower than 4.6% recorded in FY’20 attributed to reduced rental rates while house prices registered a 1.0% points y/y price appreciation, coming in at 1.1% in FY’21 from 0.1% in FY’20.
In the high-end segment, Runda was the only node that recorded an average y/y price correction of 1.6% attributed to the relatively low uptake which came in at 10.4%, 3.2% points lower than the high-end market average of 13.6%. Notably, all nodes in the high-end segment recorded declines in average rental yields in FY’21 compared to FY’20 with the market’s average rental yield coming in at 3.7%, 0.5% lower than 4.2% recorded in the last financial year indicating low demand for rental units. Kitisuru was the best performing node in the segment with an average total return of 6.5% and the highest price appreciation in the detached market at 2.7% compared to market’s average of 1.1%.
The upper mid-end segment was the best performing segment with an average total return of 5.8% compared to the high-end and lower mid-end segments whose average total returns came in at 4.8% and 5.5%, respectively, attributed to the high rental yield of 4.6% and 1.2% y/y price appreciation. Redhill was the best performing node in the segment with an average total return of 6.5% attributed to the relatively high average rental yield which came in at 5.2%.
In the lower mid-end segment, Ruiru recorded the highest returns at 6.6%, compared to the detached market average of 5.4%, attributed to its relatively high rental yield averaging 5.0% and y/y price appreciation which came in at 1.6%, 0.5% points higher than the segment’s market average of 1.1%. Ruiru’s performance is attributed to being one of the fastest growing satellite towns due to increased commercial and business activities in the area hence attracting residents.
|
Detached Units Performance 2020/21 |
||||||||||||
|
Area |
Average of Occupancy FY'2021 |
Average of Annual Uptake FY'2021 |
Average of Rental Yield FY'2021 |
Average of Price Appreciation FY'2021 |
Total Returns FY'2021 |
Average of Rental Yield FY'2020 |
Average of Price Appreciation FY'2020 |
Total Returns FY'2020 |
Change in Rental Yield (% Points) |
Change in Price Appreciation (% Points) |
Change in Total Returns (% Points) |
|
|
High - End |
||||||||||||
|
Kitisuru |
92.5% |
15.0% |
3.8% |
2.7% |
6.5% |
4.4% |
0.0% |
4.4% |
(0.6%) |
2.7% |
2.1% |
|
|
Rosslyn |
85.9% |
12.1% |
4.4% |
1.1% |
5.5% |
4.7% |
(0.1%) |
4.7% |
(0.3%) |
1.2% |
0.8% |
|
|
Lower Kabete |
81.3% |
16.0% |
2.8% |
2.5% |
5.2% |
3.7% |
(1.2%) |
2.5% |
(0.9%) |
3.7% |
2.7% |
|
|
Karen |
82.8% |
14.4% |
3.8% |
0.8% |
4.5% |
4.1% |
0.3% |
4.4% |
(0.3%) |
0.5% |
0.1% |
|
|
Runda |
90.5% |
10.4% |
3.7% |
(1.6%) |
2.1% |
4.3% |
0.7% |
5.0% |
(0.6%) |
(2.3%) |
(2.9%) |
|
|
Average |
86.6% |
13.6% |
3.7% |
1.1% |
4.8% |
4.2% |
0.0% |
4.2% |
(0.5%) |
1.1% |
0.6% |
|
|
Upper Mid - End |
||||||||||||
|
Redhill & Sigona |
90.9% |
15.4% |
5.2% |
1.3% |
6.5% |
3.4% |
0.1% |
3.5% |
1.8% |
1.2% |
3.0% |
|
|
Loresho |
87.8% |
10.7% |
4.8% |
1.5% |
6.3% |
4.5% |
(0.3%) |
4.2% |
0.3% |
1.8% |
2.1% |
|
|
Ridgeways |
84.5% |
13.4% |
5.2% |
1.2% |
6.3% |
5.5% |
3.0% |
8.5% |
(0.3%) |
(1.8%) |
(2.2%) |
|
|
Runda Mumwe |
85.2% |
14.1% |
4.3% |
2.0% |
6.3% |
4.8% |
0.7% |
5.5% |
(0.5%) |
1.3% |
0.8% |
|
|
South B/C |
94.4% |
14.0% |
4.8% |
1.2% |
6.0% |
5.2% |
0.6% |
5.8% |
(0.4%) |
0.6% |
0.2% |
|
|
Langata |
85.9% |
10.0% |
3.9% |
0.8% |
4.8% |
5.2% |
0.6% |
5.8% |
(1.3%) |
0.2% |
(1.0%) |
|
|
Lavington |
86.1% |
12.9% |
4.4% |
0.3% |
4.7% |
4.0% |
1.6% |
5.6% |
0.4% |
(1.3%) |
(0.9%) |
|
|
Average |
87.8% |
12.9% |
4.6% |
1.2% |
5.8% |
4.6% |
0.9% |
5.6% |
0.0% |
0.3% |
0.2% |
|
|
Lower Mid - End |
||||||||||||
|
Ruiru |
83.9% |
24.9% |
5.0% |
1.6% |
6.6% |
5.5% |
0.3% |
5.8% |
(0.5%) |
1.3% |
0.8% |
|
|
Syokimau/Mlolongo |
75.7% |
16.8% |
4.4% |
2.1% |
6.5% |
4.8% |
(1.1%) |
3.7% |
(0.4%) |
3.2% |
2.8% |
|
|
Juja |
79.6% |
14.9% |
4.6% |
1.0% |
5.6% |
3.8% |
0.0% |
3.8% |
0.8% |
1.0% |
1.8% |
|
|
Kitengela |
92.0% |
15.5% |
4.7% |
0.4% |
5.1% |
5.2% |
0.0% |
5.2% |
(0.5%) |
0.4% |
(0.1%) |
|
|
Rongai |
83.1% |
13.4% |
2.9% |
2.2% |
5.1% |
|
|
|
|
|
|
|
|
Ngong |
84.5% |
12.7% |
5.0% |
(0.2%) |
4.9% |
3.9% |
(1.1%) |
2.7% |
1.1% |
0.9% |
2.2% |
|
|
Athi River |
83.4% |
15.7% |
3.8% |
0.7% |
4.4% |
4.7% |
(1.2%) |
3.5% |
(0.9%) |
1.9% |
0.9% |
|
|
Average |
83.2% |
16.3% |
4.3% |
1.1% |
5.5% |
4.6% |
(0.5%) |
4.1% |
(0.3%) |
1.6% |
1.4% |
|
|
Detached Units Average |
85.9% |
14.2% |
4.2% |
1.1% |
5.4% |
4.5% |
0.1% |
4.6% |
(0.3%) |
1.0% |
0.8% |
|
Source: Cytonn Research
- Apartments
Apartments recorded improved performance with average returns to investors coming in at 5.5% in FY’21, a 0.2% points increase from 5.3% recorded in FY’20. The average y/y price appreciation registered a 0.4% y/y increase to 0.1% in FY’21, up from the price correction of 0.3% in FY’20. However, the rental yields recorded a 0.1% points decline to 5.4% in FY’21 compared to 5.5% last year, attributable to rental rates remaining flat in a bid to attract tenants in the wake of the recovering economy.
The upper mid-end segment recorded a mixed performance with an average price appreciation of 0.7% as markets like Kileleshwa, Kilimani and Loresho experienced price corrections. This is attributable to continued increased supply in the markets thus leading to downward pressure on prices amidst heightened competition among developers.
Apartments in lower mid-end suburbs recorded the highest y/y average price appreciation at 0.9% driven by demand from the growing middle class in Nairobi. Waiyaki way apartments recorded the highest price appreciation at 2.5% attributed to the construction of Nairobi Expressway which boosted property prices in the area. Dagoretti offered the best average rental yield at 6.3% in this segment, indicating the areas demand for renting especially by Nairobi’s working in surrounding commercial nodes such as Kilimani, Upperhill, and Westlands.
In Satellite Towns, apartments recorded the highest average rental yield at 5.6% driven by demand for renting units in satellite towns due to their affordability. This had a downturn on apartment prices which recorded a 0.8% points decline in average y/y price appreciation which posted a price correction of 0.9% attributed to residents opting to rent than to buy hence sellers had to adjust their prices downwards to attract buyers. Ruaka recorded the highest annual total returns at 7.5% supported by a relatively high price appreciation which came in at 2.0%. This is due to continued demand in the area driven by the area’s proximity to upper markets such as Runda and proximity to social amenities.
Waiyaki way recorded the highest returns at 8.1%, compared to the apartment’s market average of 5.5% as well as the highest price appreciation at 2.5% compared to the market’s average of 0.1%. The area’s performance is boosted by the improving infrastructure especially construction of the Nairobi Expressway that will boost property prices even further when complete
|
Apartments Performance 2020/21 |
|||||||||||
|
Area |
Average of Occupancy FY'2021 |
Average of Annual Uptake FY'2021 |
Average of Rental Yield FY'2021 |
Average of Y/Y Price Appreciation FY'2021 |
Total Returns FY'2021 |
Average of Rental Yield FY'2020 |
Average of Price Appreciation FY'2020 |
Total Returns FY'2020 |
Change in Rental Yield (% Points) |
Change in Price Appreciation (% Points) |
Change in Total Returns (% Points) |
|
Upper Mid-End |
|||||||||||
|
Parklands |
84.8% |
14.7% |
5.6% |
2.0% |
7.6% |
5.8% |
0.3% |
6.1% |
(0.2%) |
1.7% |
1.5% |
|
Westlands |
80.6% |
17.7% |
4.9% |
2.0% |
6.9% |
5.2% |
1.6% |
6.8% |
(0.3%) |
0.4% |
0.1% |
|
Kilimani |
87.6% |
23.0% |
5.9% |
(0.2%) |
5.7% |
5.8% |
(2.7%) |
3.1% |
0.1% |
2.5% |
2.6% |
|
Upperhill |
80.3% |
10.1% |
5.3% |
0.4% |
5.7% |
|
|
|
|
|
|
|
Kileleshwa |
86.4% |
16.3% |
5.4% |
(0.6%) |
4.7% |
5.0% |
(3.0%) |
2.0% |
0.4% |
2.4% |
2.7% |
|
Loresho |
89.4% |
10.0% |
4.9% |
(1.6%) |
3.3% |
5.2% |
0.0% |
5.2% |
(0.3%) |
(1.6%) |
(1.9%) |
|
Average |
84.9% |
15.3% |
5.3% |
0.3% |
5.7% |
5.4% |
(0.7%) |
4.6% |
(0.1%) |
1.0% |
1.1% |
|
Lower Mid-End: Suburbs |
|||||||||||
|
Waiyaki Way |
78.8% |
21.7% |
5.6% |
2.5% |
8.1% |
|
|
|
|
|
|
|
Dagoretti |
86.7% |
17.4% |
6.3% |
1.1% |
7.4% |
6.2% |
3.1% |
9.3% |
0.1% |
(2.0%) |
(1.9%) |
|
South C |
86.3% |
14.1% |
5.9% |
1.2% |
7.1% |
6.0% |
0.1% |
6.1% |
(0.1%) |
1.1% |
1.0% |
|
Kahawa West |
78.2% |
10.6% |
5.0% |
1.7% |
6.7% |
5.9% |
(1.4%) |
4.5% |
(0.9%) |
3.1% |
2.2% |
|
Donholm & Komarock |
85.2% |
13.3% |
5.3% |
1.1% |
6.4% |
5.3% |
0.0% |
5.3% |
(0.0%) |
1.1% |
1.1% |
|
South B |
74.3% |
17.5% |
4.0% |
2.3% |
6.3% |
|
|
|
|
|
|
|
Race Course/Lenana |
79.3% |
22.0% |
5.8% |
(0.3%) |
5.6% |
5.3% |
(0.6%) |
4.7% |
0.5% |
0.3% |
0.9% |
|
Imara Daima |
83.9% |
13.0% |
5.2% |
(0.1%) |
5.0% |
|
|
|
5.2% |
(0.1%) |
5.0% |
|
Langata |
88.2% |
14.2% |
4.7% |
(1.3%) |
3.4% |
5.6% |
0.5% |
6.1% |
(0.9%) |
(1.8%) |
(2.7%) |
|
Average |
82.3% |
16.0% |
5.3% |
0.9% |
6.2% |
5.8% |
0.0% |
5.8% |
(0.5%) |
0.9% |
0.4% |
|
Lower Mid-End: Satellite Towns |
|||||||||||
|
Ruaka |
63.7% |
19.0% |
5.5% |
2.0% |
7.5% |
5.5% |
0.1% |
5.6% |
0.0% |
1.9% |
1.9% |
|
Kikuyu |
79.6% |
17.6% |
6.4% |
0.3% |
6.7% |
5.0% |
(1.7%) |
3.3% |
1.4% |
2.0% |
3.4% |
|
Syokimau |
79.0% |
12.0% |
5.2% |
(2.2%) |
6.0% |
5.7% |
(0.8%) |
5.0% |
(0.5%) |
(1.4%) |
1.0% |
|
Thindigua |
79.3% |
12.8% |
4.9% |
1.2% |
6.0% |
5.9% |
2.0% |
7.9% |
(1.0%) |
(0.8%) |
(1.9%) |
|
Ngong |
81.4% |
11.8% |
5.3% |
0.7% |
5.9% |
|
|
|
|
|
|
|
Kitengela |
90.0% |
10.0% |
5.1% |
(2.8%) |
5.5% |
5.1% |
0.0% |
5.1% |
0.0% |
(2.8%) |
0.4% |
|
Athi River |
97.2% |
12.6% |
5.7% |
(1.2%) |
4.5% |
6.1% |
0.0% |
6.1% |
(0.4%) |
(1.2%) |
(1.6%) |
|
Ruiru |
86.4% |
23.8% |
6.1% |
(1.8%) |
4.3% |
4.6% |
0.0% |
4.6% |
1.5% |
(1.8%) |
(0.3%) |
|
Rongai |
87.3% |
28.6% |
6.3% |
(3.9%) |
2.4% |
|
|
|
|
|
|
|
Average |
82.7% |
16.5% |
5.6% |
(0.9%) |
4.7% |
5.4% |
(0.1%) |
5.4% |
0.2% |
(0.8%) |
(0.7%) |
|
Apartments Average |
83.3% |
15.9% |
5.4% |
0.1% |
5.5% |
5.5% |
(0.3%) |
5.3% |
(0.1%) |
0.4% |
0.2% |
Source: Cytonn Research
Section IV: Conclusion, Outlook and Investment Opportunity
We use demand, access to credit, infrastructure and performance, as the key metrics to gauge our sentiment for the sector going forward.
|
Residential Market Outlook |
|||
|
Measure |
FY’21 Experience and Outlook Going Forward |
2020 Outlook |
2021 Outlook |
|
Demand |
|
Positive |
Positive |
|
Access to funding |
|
Neutral |
Neutral |
|
Infrastructure |
|
Neutral |
Positive |
|
Performance |
|
Neutral |
Neutral |
For the key metrics that have been used to determine the performance of the sector, two are positive, that is, demand and infrastructure, and two are neutral that is, access to credit and performance. Thus, our outlook for the sector is NEUTRAL. For apartments, the best opportunity is investment in areas such as Waiyaki Way, Parklands, Ruaka and Westlands driven by returns, appreciation as well as state of infrastructure and amenities; for detached units, the best opportunity is in areas such as Ruiru, Kitisuru and Redhill, driven by uptake and the current performance in terms of returns to investors. For more information, see the full report.
Disclaimer: The views expressed in this publication are those of the writers where particulars are not warranted. This publication, which is in compliance with Section 2 of the Capital Markets Authority Act Cap 485A, is meant for general information only and is not a warranty, representation, advice or solicitation of any nature. Readers are advised in all circumstances to seek the advice of a registered investment advisor.

- Talk to us
- Kenya
- P.O Box 20695 - 00200, Nairobi, Kenya
- Cell +254709101200
- Tel +254709101200
- WhatsApp +254741676635
- United States
- +254709101200
- DOWNLOAD OUR APP
-


- Kenya
- 8th Floor, Pinetree Plaza, Kaburu Drive, Ngong Road, Nairobi, Kenya
- USA
- Suite 1150, 1775 Eye Street NW, USA, Washington DC 20006, USA
- Investments
- High Yield
- Private Equity
- Real Estate
- Real Estate
- RiverRun Estates
- Cytonn Towers
- The Ridge
- Taraji Heights
- The Alma