Nairobi Metropolitan Area (NMA) Retail Sector H1’2021 Markets Review Note
By Cytonn Research, Jul 28, 2021
Westlands and Karen were the best performing nodes recording average rental yields of 9.7% and 9.5% respectively compared to the overall market average of 7.6%
The retail sector performance in H1’2021 recorded a slight improvement of 0.1% rental yield to 7.6% from 7.5% in FY’2020 attributed to increased market activities in the retail front. The average occupancies and asking rents also recorded improvement in performance by 0.7% points and 0.3% points from 75.2% and Kshs 168.6 per SQFT in FY’2020 to 75.7% and Kshs 169.1 per SQFT respectively in H1’2021. The general improvement in the performance of the sector was attributed to; i) aggressive expansion of local and international retailers such as Naivas and Carrefour taking up space previously occupied by troubled retailers such as Tuskys and Nakumatt with the retailers having opened more than 13 stores in 2021 in different locations county wide, ii) improved infrastructure which is opening up areas for investment opportunities and boosting property prices, iii) positive demographics with urbanization and population growth rates of 4.0% p.a and 2.3% p.a respectively, compared to the global average of 1.9% p.a and 1.1% p.a, respectively according to World Bank, and, v) the gradual reopening of the economy.
The performance of the retail sector in Nairobi over time is shown below:
(All values in Kshs Unless Stated Otherwise)
|
Summary of Retail Sector Performance Over Time |
|||||||||||
|
Item |
Q1' 2019 |
H1' 2019 |
Q3' 2019 |
FY' 2019 |
Q1'2020 |
H1'2020 |
Q3'2020 |
FY'2020 |
Q1'2021 |
H1'2021 |
∆ FY’2020 |
|
Average Asking Rents (Kshs/SQFT) |
174 |
170 |
167 |
176 |
173 |
170 |
169 |
169 |
166 |
169 |
0.3% |
|
Average Occupancy (%) |
76.8% |
75.6% |
74.5% |
75.9% |
76.3% |
74.0% |
74.2% |
75.2% |
75.0% |
75.7% |
0.7% |
|
Average Rental Yields |
8.5% |
8.2% |
8.0% |
7.8% |
7.7% |
7.4% |
7.4% |
7.5% |
7.4% |
7.6% |
0.1 % |
Source: Cytonn Research 2021
The table below shows a four-year performance summary for the retail sector average rental yields;
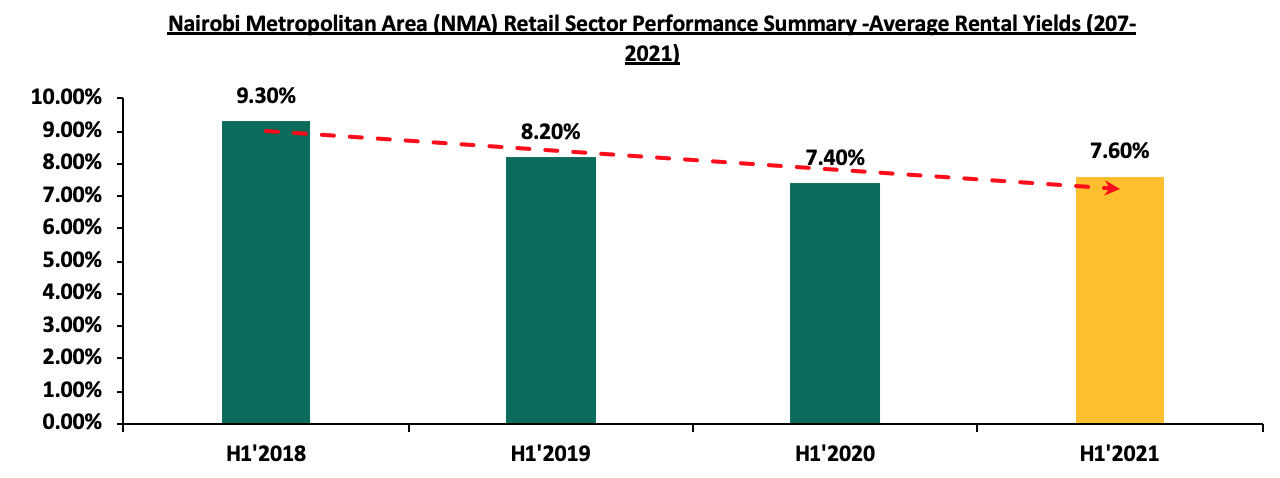
Source: Cytonn Research
In terms of the sub markets performance, Westlands and Karen were the best performing nodes recording average rental yields of 9.7% and 9.5%, respectively compared to the overall market average of 7.6% in H1’2021. The performance is attributed to presence of affluent residents who have a high consumer purchasing power with the areas hosting high-end income earners, relatively good infrastructure, and, relatively high occupancy rates of above 80.0% against the market average of 75.7%.
Eastlands recorded the lowest yields of 5.8% against the average market rates of 7.6%, attributed to low rental charges of Kshs 136 per SQFT against a market average of Kshs 169 per SQFT, competition from informal retail spaces, and constrained consumer purchasing power.
The table below shows the submarket performance in the Nairobi Metropolitan Area (NMA):
(All values in Kshs Unless Stated Otherwise)
|
Nairobi Metropolitan Area Retail Market Performance H1’2021 |
|||||||||
|
Area |
Rent/SQFT H1'2021 |
Occupancy % H1'2021 |
Rental Yield H1'2021 |
Rent Kshs/SQFT FY’ 2020 |
Occupancy FY’ 2020 |
Rental Yield FY’ 2020 |
H1 2021 ∆ in Rental Rates |
H1'2021 ∆ in Occupancy (% points) |
H1’ 2021 ∆ in Rental Yield (% points) |
|
Westlands |
209 |
80.0% |
9.7% |
209 |
81.5% |
9.9% |
0.0% |
(1.5%) |
(0.1%) |
|
Karen |
217 |
80.6% |
9.5% |
217 |
81.0% |
9.8% |
0.2% |
(0.4%) |
(0.2%) |
|
Kilimani |
173 |
82.8% |
8.9% |
171 |
82.5% |
8.5% |
0.9% |
0.3% |
0.4% |
|
Ngong Road |
178 |
78.8% |
8.0% |
178 |
80.3% |
8.2% |
0.0% |
(1.5%) |
(0.2%) |
|
Kiambu road |
178 |
68.8% |
7.1% |
176 |
67.5% |
6.9% |
1.2% |
1.3% |
0.2% |
|
Thika Road |
159 |
73.3% |
6.7% |
158 |
70.5% |
6.3% |
1.0% |
2.8% |
0.4% |
|
Mombasa road |
139 |
73.0% |
6.3% |
140 |
70.0% |
5.9% |
(0.8%) |
3.0% |
0.4% |
|
Satellite towns |
134 |
74.0% |
6.2% |
133 |
73.0% |
5.8% |
0.7% |
1.0% |
0.3% |
|
Eastlands |
136 |
70.0% |
5.8% |
137 |
70.2% |
6.1% |
(0.9%) |
(0.2%) |
(0.3%) |
|
Average |
169 |
75.7% |
7.6% |
169 |
75.2% |
7.5% |
0.3% |
0.5% |
0.1% |
Source: Cytonn Research 2021
Our outlook for the retail sector is NEUTRAL. Despite the numerous expansion activities by local and international retailers witnessed during the quarter which have continued to support the growth of the retail sector, there are still various factors impending its performance such as the shift to online shopping causing occupancy rates decline, the existing oversupply at 2.0mn SQFT in the Kenyan retail market and 3.1mn SQFT in NMA, as well as the tough economic condition causing space uptake decline.
For more information, please see our Cytonn H1’2021 Markets Review.

- Talk to us
- Kenya
- P.O Box 20695 - 00200, Nairobi, Kenya
- Cell +254709101200
- Tel +254709101200
- WhatsApp +254741676635
- United States
- +254709101200
- DOWNLOAD OUR APP
-


- Kenya
- 8th Floor, Pinetree Plaza, Kaburu Drive, Ngong Road, Nairobi, Kenya
- USA
- Suite 1150, 1775 Eye Street NW, USA, Washington DC 20006, USA
- Investments
- High Yield
- Private Equity
- Real Estate
- Real Estate
- RiverRun Estates
- Cytonn Towers
- The Ridge
- Taraji Heights
- The Alma