Off Plan Real Estate Investing, & Cytonn Weekly #02/2022
By Research Team, Jan 16, 2022
Executive Summary
Fixed Income
During the week, T-bills were oversubscribed, with the overall subscription rate coming in at 156.4%, up from the 96.6% recorded the previous week, partly attributable to the eased liquidity in the money market. The 364-day paper recorded the highest subscription rate, receiving bids worth Kshs 19.4 bn against the offered Kshs 10.0 bn, translating to a subscription rate of 194.0%, an increase from the 112.0% recorded the previous week. Similarly, the subscription rate for the 182-day paper increased to 137.2% from 63.3% recorded the previous week while that of the 91-day paper declined to 110.1% from 141.3% recorded the previous week. The yields on the government papers recorded mixed performance, with the yields on the 182-day and 364-day papers increasing by 4.0 bps and 3.0 bps to 8.1% and 9.5%, respectively, while the yield on the 91-day paper declined by 3.6 bps to 7.3%;
Also during the week, the World Bank released the Global Economic Prospects and the Sub–Saharan Africa outlook highlighting that the Kenyan economy is expected to grow by 5.0% in 2021 and 4.7% in 2022. Additionally, the Energy and Petroleum Regulatory Authority (EPRA) released their monthly statement on the maximum retail prices in Kenya effective 15th January 2022 to 14th February 2022 highlighting that fuel prices remained unchanged at Kshs 129.7 per litre for Super Petrol, Kshs 110.6 per litre for Diesel and Kshs 103.5 per litre for Kerosene. Also, the National Treasury gazetted the revenue and net expenditures for the first six months of FY’2021/2022, ending 31st December 2021, highlighting that the total revenue collected as at the end of December 2021 amounted to Kshs 926.3 bn, equivalent to 52.2% of the original estimates of Kshs 1.8 tn and is 104.3% of the prorated estimates of Kshs 887.8 bn;
Equities
During the week, the equities market was on a downward trajectory, with NASI, NSE 20 and NSE 25 declining by 3.9%, 1.1% and 3.5%, respectively, taking their YTD performance to losses of 1.2%, 0.8% and 1.9% for NASI, NSE 20 and NSE 25, respectively. The equities market performance was driven by losses recorded by large cap stocks such as Equity, Safaricom, EABL, KCB and Diamond Trust Bank (DTB-K) of 6.6%, 5.1%, 3.9%, 1.8% and 1.7%, respectively. The losses were however mitigated by marginal gains recorded by ABSA, Stanbic Bank and NCBA of 0.4%, 0.3% and 0.2%, respectively;
Also during the week, Equity Group Holdings (EGH), announced the completion of the incorporation of a subsidiary, Equity Group Insurance Holdings Limited, a non-operating insurance holding company and issuance of a life insurance license to Equity Life Assurance Kenya (ELAK) Limited. ELAK, which is fully owned by Equity Group Insurance Holdings Limited, will conduct and undertake long-term insurance business in Kenya. This came after EGH obtained the prerequisite approvals from its shareholders and the Central Bank of Kenya (CBK), before subsequent registration and licensing from the Insurance Regulatory Authority (IRA) on 10th January 2022;
Real Estate
During the week, the Kenya Mortgage Refinance Company, a treasury backed lender, got approval from the Capital Markets Authority (CMA) to roll out a medium-term note programme seeking to raise Kshs 10.5bn. For Mixed-Use Developments, CCI Group of companies, a business process outsourcing (BPO) provider, and, nutrition supplements distributor Max International took up approximately 60.0% of the 270,000 SQFT space at Garden City Business Park along Thika Road. In the Hospitality Sector, the Kenyan government suspended all inbound and transit passenger flights from the United Arabs Emirates (UAE) for seven days effective 10th January. Additionally, the United States of America (USA), raised Kenya’s travel advisory alert from Level One to Level Three, amidst concerns of the increasing Covid-19 infections following emergence of the Omicron variant. In Listed Real Estate Fahari I-REIT closed the week trading at Kshs 6.5 per share, an increase of 1.6% compared to Kshs 6.4 per share recorded the previous week;
Focus of the Week
Off plan investing is defined as the process through which an investor buys into a new Real Estate development before it is completed. The selling or buying of the property is done before the property is built, when there are only plans outlining the development concept alongside the relevant project approvals. Off plan investments have emerged as an alternative financing source for developers since it presents them with an opportunity to generate funds from the end-buyers in the proposed developments.
Investment Updates:
- Weekly Rates:
- Cytonn Money Market Fund closed the week at a yield of 10.44%. To invest, just dial *809#;
- Cytonn High Yield Fund closed the week at a yield of 13.98% p.a. To invest, email us at sales@cytonn.com and to withdraw the interest you just dial *809#;
- Ann Wacera, Senior Investments Analyst at Cytonn Investments, was on KBC to talk about Kenya’s 2022 Economic Outlook. Watch Ann here;
- We continue to offer Wealth Management Training on Wednesday and Saturday, from 9:00 am to 11:00 am, through our Cytonn Foundation. The training aims to grow financial literacy among the general public. To register for any of our Wealth Management Trainings, click here;
- If interested in our Private Wealth Management Training for your employees or investment group, please get in touch with us through wmt@cytonn.com;
- Any CHYS and CPN investors still looking to convert are welcome to consider one of the five projects currently available for conversion, click here for the latest conversion term sheet;
- Cytonn Insurance Agency acts as an intermediary for those looking to secure their assets and loved ones’ future through insurance namely; Motor, Medical, Life, Property, WIBA, Credit and Fire and Burglary insurance covers. For assistance, get in touch with us through insuranceagency@cytonn.com;
- Cytonnaire Savings and Credit Co-operative Society Limited (SACCO) provides a savings and investments avenue to help you in your financial planning journey. To enjoy competitive investment returns, kindly get in touch with us through clientservices@cytonn.com;
Real Estate Updates:
- For an exclusive tour of Cytonn’s real estate developments, visit: Sharp Investor's Tour, and for more information, email us at sales@cytonn.com;
- Phase 3 of The Alma is now ready for occupation. To rent please email properties@cytonn.com;
- We have 8 investment-ready projects, offering attractive development and buyer targeted returns; See further details here: Summary of Investment-ready Projects;
- For recent news about the group, see our news section here;
Hospitality Updates:
- We currently have promotions for Staycations. Visit cysuites.com/offers for details or email us at sales@cysuites.com;
- Share a meal with a friend during the Sunday Brunch at The Hive Restaurant at Cysuites Hotel and Apartment. Every Sunday from 11.00 am to 4.00 pm at a price of Kshs 2,500 for Adults and Kshs 1,500 for children under 12 years;
Money Markets, T-Bills Primary Auction:
During the week, T-bills were oversubscribed, with the overall subscription rate coming in at 156.4%, up from the 96.6% recorded the previous week, partly attributable to the eased liquidity in the money market. The 364-day paper recorded the highest subscription rate, receiving bids worth Kshs 19.4 bn against the offered Kshs 10.0 bn, translating to a subscription rate of 194.0%, an increase from the 112.0% recorded the previous week. The subscription rate for the 182-day paper increased as well to 137.2% from 63.3% while that of the 91-day paper declined to 110.1%, from 141.3% recorded the previous week. The yields on the government papers recorded mixed performance, with the yields on the 182-day and 364-day papers increasing by 4.0 bps and 3.0 bps to 8.1% and 9.5%, respectively, while the yield on the 91-day paper declined by 3.6 bps to 7.3%. The government continued to reject expensive bids, accepting Kshs 31.1 bn bids out of the Kshs 37.5 bn worth of bids received, translating to an acceptance rate of 82.8%.
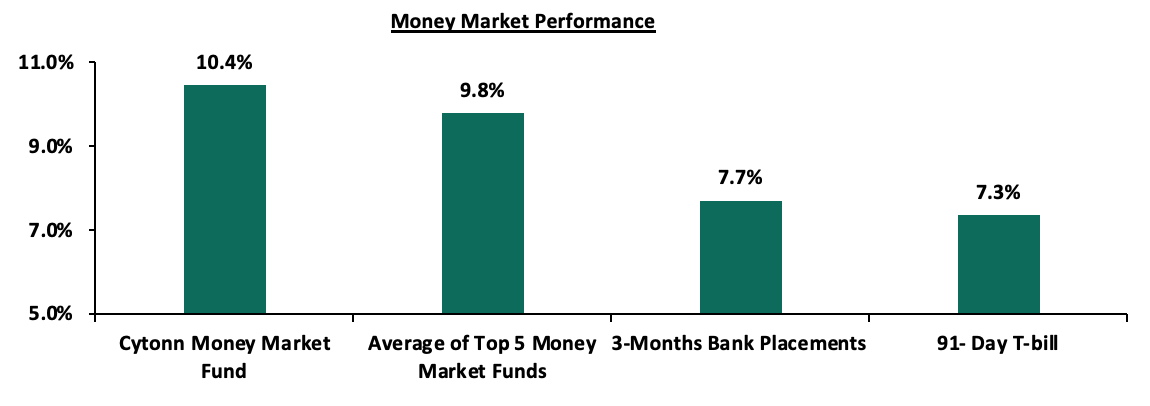
In the money markets, 3-month bank placements ended the week at 7.7% (based on what we have been offered by various banks), while the yield on the 91-day T-bill declined by 3.6 bps to 7.3%. The average yield of the Top 5 Money Market Funds remained relatively unchanged at 9.8% as was recorded the previous week while the yield on the Cytonn Money Market Fund declined marginally by 0.1% point to 10.4% from 10.5%, recorded the previous week.
The table below shows the Money Market Fund Yields for Kenyan Fund Managers as published on 14th January 2022:
|
|
Money Market Fund Yield for Fund Managers as published on 14th January 2022 |
|
|
Rank |
Fund Manager |
Effective Annual Rate |
|
1 |
Cytonn Money Market Fund |
10.4% |
|
2 |
Zimele Money Market Fund |
9.9% |
|
3 |
Nabo Africa Money Market Fund |
9.7% |
|
4 |
Sanlam Money Market Fund |
9.5% |
|
5 |
Madison Money Market Fund |
9.4% |
|
6 |
CIC Money Market Fund |
9.3% |
|
7 |
Apollo Money Market Fund |
9.0% |
|
8 |
GenCapHela Imara Money Market Fund |
8.8% |
|
9 |
Dry Associates Money Market Fund |
8.7% |
|
10 |
British-American Money Market Fund |
8.5% |
|
11 |
Co-op Money Market Fund |
8.5% |
|
12 |
Orient Kasha Money Market Fund |
8.4% |
|
13 |
NCBA Money Market Fund |
8.4% |
|
14 |
ICEA Lion Money Market Fund |
8.3% |
|
15 |
AA Kenya Shillings Fund |
7.5% |
|
16 |
Old Mutual Money Market Fund |
7.5% |
Source: Business Daily
Liquidity:
During the week, liquidity in the money markets eased, with the average interbank rate declining to 4.0% from the 4.5% recorded the previous week, partly attributable to government payments inclusive of Term Auction Deposits (TADs) worth Kshs 38.8 bn, which partly offset tax remittances. The average interbank volumes traded increased by 12.6% to Kshs 15.8 bn, from Kshs 13.9 bn recorded the previous week.
Kenya Eurobonds:
During the week, the yields on Eurobonds recorded mixed performance, with yields on the 10-year bond issued in 2014 remaining unchanged at 4.4% as was recorded the previous week. Yields on the 10-year and 30-year bonds issued in 2018, the 7-year and 12-year bonds issued in 2019 and the yield on the 12-year bond issued in 2021 all increased by 0.1% points to 6.1%, 8.3%, 5.8%, 6.9% and 6.8%, from 6.0%, 8.2%, 5.7%, 6.8%, and, 6.7%, respectively, recorded the previous week. Below is a summary of the performance:
|
Kenya Eurobond Performance |
||||||
|
|
2014 |
2018 |
2019 |
2021 |
||
|
Date |
10-year issue |
10-year issue |
30-year issue |
7-year issue |
12-year issue |
12-year issue |
|
3-Jan-22 |
4.4% |
5.7% |
8.1% |
5.6% |
6.7% |
6.6% |
|
7-Jan-22 |
4.4% |
6.0% |
8.2% |
5.7% |
6.8% |
6.7% |
|
10-Jan-22 |
4.4% |
6.0% |
8.3% |
5.8% |
6.8% |
6.7% |
|
11-Jan-22 |
4.5% |
6.1% |
8.3% |
5.8% |
6.9% |
6.8% |
|
12-Jan-22 |
4.4% |
6.1% |
8.3% |
5.9% |
6.9% |
6.8% |
|
13-Jan-22 |
4.4% |
6.1% |
8.3% |
5.8% |
6.9% |
6.8% |
|
Weekly Change |
0.0% |
0.1% |
0.1% |
0.1% |
0.1% |
0.1% |
|
MTD Change |
0.0% |
0.4% |
0.2% |
0.2% |
0.2% |
0.2% |
|
YTD Change |
0.0% |
0.4% |
0.2% |
0.2% |
0.2% |
0.2% |
Source: Central Bank of Kenya
Kenya Shilling:
During the week, the Kenyan shilling depreciated by 0.1% against the US dollar to close the week at Kshs 113.4, from Kshs 113.2 recorded the previous week, partly attributable to increased dollar demand from the oil and energy sectors. Key to note, this is the lowest the Kenyan shilling has ever depreciated against the dollar. On a YTD basis, the shilling has depreciated by 0.2% against the dollar, in comparison to the 3.6% depreciation recorded in 2021. We expect the shilling to remain under pressure in 2022 as a result of:
- Increased demand from merchandise traders as they beef up their hard currency positions in anticipation for more trading partners reopening their economies globally,
- Ever present current account deficit due to an imbalance between imports and exports with Kenya’s current account deficit having expanded by 27.4% in Q3’2021 to Kshs 184.6 bn, from Kshs 145.0 bn recorded in Q3’2020. This was attributed to a robust increase in merchandise imports by 39.6% to Kshs 321.8 bn in Q3’2021, from Kshs 230.5 bn in Q3’2020,
- The aggressively growing government debt, with Kenya’s public debt having increased at a 10-year CAGR of 17.7% to Kshs 7.8 tn in July 2021, from Kshs 1.5 tn in July 2011 thus putting pressure on forex reserves to repay some of the public debt, and,
- Rising global crude oil prices on the back of supply constraints at a time when demand is picking up with the easing of COVID-19 restrictions and as economies reopen. Key to note, risks abound this global recovery following the emergence of the new COVID-19 Omicron variant. We are of the view that should the variant continue to spread; most nations will respond swiftly by adopting stringent containment measures to curb the spread.
The shilling is however expected to be supported by:
- High Forex reserves, currently at USD 8.8 bn (equivalent to 5.4-months of import cover), which is above the statutory requirement of maintaining at least 4.0-months of import cover, and the EAC region’s convergence criteria of 4.5-months of import cover. In addition, the reserves were boosted by the USD 1.0 bn proceeds from the Eurobond issued in July 2021 coupled with the USD 972.6 mn IMF disbursement and the USD 130.0 mn World Bank loan financing received in June 2021, and,
- Improving diaspora remittances evidenced by a 17.0% y/y increase to USD 350.6 mn in December 2021, from USD 299.6 mn recorded over the same period in 2020, which has continued to cushion the shilling against further depreciation.
Weekly Highlights:
- Fuel Prices
During the week, the Energy and Petroleum Regulatory Authority (EPRA) released their monthly statement on the maximum retail prices in Kenya effective 15th January 2022 to 14th February 2022. Notably, fuel prices remained unchanged at Kshs 129.7 per litre for Super Petrol, Kshs 110.6 per litre for Diesel and Kshs 103.5 per litre for Kerosene. Below are the key take-outs from the statement:
The performance in fuel prices was attributable to:
- The fuel subsidy program under the Petroleum Development Fund which resulted in subsidies of Kshs 14.8 on Super Petrol, Kshs 17.8 on Diesel and Kshs 20.2 on Kerosene,
- Removal of suppliers margins of Kshs 6.3 on Super Petrol, Kshs 5.5 on Diesel and Kshs 7.7 on Kerosene,
- The decline in the Free on Board (FOB) price of Murban crude oil in December 2021 by 12.7% to USD 82.7 per barrel, from USD 73.4 per barrel in November 2021,
- A decrease in the average landed costs of Super Petrol by 4.1% to USD 602.0 per cubic meter in December 2021, from USD 627.8 per cubic meter in November 2021,
- A decrease in the average landed costs of diesel by 5.7% to USD 565.9 per cubic meter in December 2021, from USD 600.2 per cubic meter in November 2021, and,
- A decrease in the average landed costs of Kerosene by 4.9% to USD 574.9 per cubic meter in December 2021, from USD 604.4 per cubic meter in November 2021. However, the Kenyan shilling depreciated during the period by 0.7% to Kshs 113.3 in December 2021, from Kshs 112.3 in November 2021.
Global fuel prices increased by 8.6% in the first two weeks of January 2022 to USD 84.7, from USD 78.0 recorded at the end of 2021 largely attributable to increased demand coupled with supply constraints amidst economic uncertainty on the back of emerging COVID-19 variants. Notably this is the highest it has been since October, 2018 when the price stood at USD 84.1 and as such, we expect the cost of production for net importers to rise in tandem. Going forward, we expect muted pressure on the inflation basket as fuel prices which are among the major contributors to Kenya’s headline inflation remain constant following the Fuel Subsidy program. Despite the decrease in landed costs of fuel, we believe the stabilization under the fuel subsidy program by the National Treasury will be unsustainable given that the National Treasury will have to compensate the Oil Marketing companies and suppliers whose margins have been cut to zero from Kshs 6.3 per litre for super petrol, Kshs 5.5 per litre for diesel and Kshs 1.7 per litre for kerosene since November 2021 putting further strain on the program's viability. Key to note the total subsidy for the past four months starting October 2021 is Kshs 53.5 per litre for super petrol, Kshs 65.2 per litre for diesel and Kshs 60.3 per litre for kerosene.
- Revenue and Net Exchequer for FY’2021/2022
The National Treasury gazetted the revenue and net expenditures for the first six months of FY’2021/2022, ending 31st December 2021. Below is a summary of the performance:
|
FY'2021/2022 Budget Outturn - As at 31st December 2021 |
|||||
|
Amounts in Kshs billions unless stated otherwise |
|||||
|
Item |
12-months Original Estimates |
Actual Receipts/Release |
Percentage Achieved |
Prorated Estimates |
% achieved of prorated |
|
Opening Balance |
21.3 |
||||
|
Tax Revenue |
1,707.4 |
868.8 |
50.9% |
853.7 |
101.8% |
|
Non-Tax Revenue |
68.2 |
36.2 |
53.0% |
34.1 |
106.1% |
|
Total Revenue |
1,775.6 |
926.3 |
52.2% |
887.8 |
104.3% |
|
External Loans & Grants |
379.7 |
44.3 |
11.7% |
189.8 |
23.4% |
|
Domestic Borrowings |
1,008.4 |
468.5 |
46.5% |
504.2 |
92.9% |
|
Other Domestic Financing |
29.3 |
4.2 |
14.2% |
14.6 |
28.4% |
|
Total Financing |
1,417.4 |
517.0 |
36.5% |
708.7 |
72.9% |
|
Recurrent Exchequer issues |
1,106.6 |
528.0 |
47.7% |
553.3 |
95.4% |
|
CFS Exchequer Issues |
1,327.2 |
546.3 |
41.2% |
663.6 |
82.3% |
|
Development Expenditure & Net Lending |
389.2 |
144.0 |
37.0% |
194.6 |
74.0% |
|
County Governments + Contingencies |
370.0 |
145.0 |
39.2% |
185.0 |
78.4% |
|
Total Expenditure |
3,193.0 |
1,363.3 |
42.7% |
1,596.5 |
85.4% |
|
Fiscal Deficit excluding Grants |
(1,417.4) |
(437.0) |
30.8% |
(708.7) |
61.7% |
|
Fiscal Deficit as a % of GDP |
11.4%* |
3.5% |
|
|
|
|
Total Borrowing |
1,388.1 |
512.8 |
36.9% |
694.0 |
73.9% |
|
*Projected Fiscal Deficit as a % of GDP |
|||||
The key take-outs from the report include:
- Total revenue collected as at the end of December 2021 amounted to Kshs 926.3 bn, equivalent to 52.2% of the original estimates of Kshs 1.8 tn and is 104.3% of the prorated estimates of Kshs 887.8 bn. Cumulatively, Tax revenues amounted to Kshs 868.8 bn, equivalent to 50.9% of the target of Kshs 1,707.4 bn and are 101.8% of the prorated estimates of Kshs 853.7 bn,
- Total financing amounted to Kshs 517.0 bn, equivalent to 36.5% of the original estimates of Kshs 1,417.4 bn and is equivalent to 72.9% of the prorated estimates of Kshs 708.7 bn. Additionally, domestic borrowing amounted to Kshs 468.5 bn, equivalent to 46.5% of the original estimates of Kshs 1.0 tn and is 92.9% of the prorated estimates of Kshs 504.2 bn,
- The total expenditure amounted to Kshs 1.4 tn, equivalent to 42.7% of the original estimates of Kshs 3.2 tn, and is 85.4% of the prorated expenditure estimates of Kshs 1.6 tn. Additionally, the net disbursements to recurrent expenditures came in at Kshs 528.0 bn, equivalent to 47.7% of the original estimates and 95.4% of the prorated estimates of Kshs 553.3 bn, and development expenditure amounted to Kshs 144.0 bn, equivalent to 37.0% of the original estimates of Kshs 389.2 bn and is 74.0% of the prorated estimates of Kshs 194.6 bn,
- Consolidated Fund Services (CFS) Exchequer issues lagged behind their target of Kshs 1,327.2 bn after amounting to Kshs 546.3 bn, equivalent to 41.2% of the target, and are 82.3% of the prorated amount of Kshs 663.6 bn. The cumulative public debt servicing cost amounted to Kshs 475.6 bn which is 40.7% of the original estimates of Kshs 1,169.2 bn, and is 81.4% of the prorated estimates of Kshs 584.6 bn, and,
- Total Borrowings as at the end of December 2021 amounted to Kshs 512.8 bn, equivalent to 36.9% of the Kshs 1,388.1 bn target and are 73.9% of the prorated estimates of Kshs 694.0 bn. The cumulative domestic borrowing target of Kshs 1.0 tn comprises of adjusted Net domestic borrowings of Kshs 661.6 bn and Internal Debt Redemptions (Roll-overs) of Kshs 346.8 bn.
The revenue performance in the first six months of the current fiscal year point towards continued economic recovery following the ease of COVID-19 containment measures and the effectiveness of the KRA in revenue collection. Additionally, we believe that the current measures such as the implementation of the Finance Act 2021 which led to the upward readjustment of the Excise Duty Tax, Income Tax as well as the Value Added Tax will continue playing a big role in expanding the tax base and consequently enhance revenue collection. However, risks abound the outlook owing to the emergence of the Corona Virus Omicron variant which is expected to disrupt economic activities and increase supply bottlenecks and consequently lead to a slowdown in economic recovery. On the upside, we have not seen any major domestic disruptions and as such, we do not expect adverse effects from the variant.
- World Bank Global Economic Prospects
During the week, the World Bank released the Global Economic Prospects and the Sub–Saharan Africa outlook highlighting that the Kenyan economy is expected to grow by 5.0% in 2021 and 4.7% in 2022. Below are the key take-outs from the report:
- Global Economic Growth – The global economy is expected to grow by 4.1% in 2022 following an estimated 5.5% growth in 2021. The growth estimates are lower than the earlier projections estimated at 5.6% and 4.3% growth for 2021 and 2022, respectively. The slower growth is mainly attributable to the emergence of new COVID-19 variants, less budgetary support, existing supply bottlenecks and higher prices of food and energy,
- Regional Economic Growth - The Sub-Saharan Africa’s economic growth is projected to expand by 3.1% in 2021 and 3.6% in 2022 supported by rising commodity prices as the region’s economic trading partners continue to reopen. Growth in the three largest economies in the region; Angola, Nigeria and South Africa is estimated to stand at 3.1% supported by higher oil prices, a gradual relaxing of OPEC's output curbs, and, domestic regulatory improvements. The Kenyan economy is expected to grow by 5.0% in 2021 and 4.7% in 2022, supported by improving exports and the positive vaccine rollout. However, the erratic weather conditions in the country is expected to weigh down the economic growth as Agriculture is the largest contributor to Kenya’s GDP growth at 20.5% in Q3’2021, and,
- Commodity Prices - Commodity prices increased in 2021, largely as a result of a significant recovery in aggregate global demand, favorable monetary policies, and fiscal expansions in advanced nations, following sharp reductions in 2020. Consequently, the high commodity prices, coupled with pandemic related supply bottlenecks, led to a surge in headline inflation rates in most economies. Inflationary pressures are expected to persist in the medium term in the emerging markets on the back of elevated food prices, delayed effects of higher oil prices, and higher import prices resulting from currency depreciations reflecting further the susceptibility of developing economies to large fluctuations in commodity prices.
In 2021, the Kenyan economy is projected to grow at an average of 5.9% and 5.1% in 2022 as the economy opens up but the largest challenge remains how fast the vaccination rollout shall be done and how fast business shall take to recover. Additionally, concerns remain elevated given the rising political temperatures ahead of the upcoming August 2022 elections which may cause economic disruption. The table below shows the projections by various organizations:
|
No. |
Organization |
2021e |
2022f |
|
1. |
International Monetary Fund |
7.6% |
6.0% |
|
2. |
National Treasury |
6.0% |
5.8% |
|
3. |
World Bank |
5.0% |
4.7% |
|
4. |
Cytonn Investments Management PLC |
6.3% |
4.5% |
|
5. |
S&P Global |
4.5% |
4.3% |
|
Average |
5.9% |
5.1% |
|
Despite the political environment, we do not expect to see much disruptions in the economy given that the Kenyan economy has already felt full effects from the COVID-19 pandemic. As such, we expect continued recovery on the back of a positive vaccine rollout and as the economy continues to reopen.
Rates in the fixed income market have remained relatively stable due to the high liquidity in the money market. The government is 5.7% ahead of its prorated borrowing target of Kshs 367.2 bn having borrowed Kshs 388.3 bn of the Kshs 658.5 bn borrowing target for the FY’2021/2022. We expect a gradual economic recovery as evidenced by the revenue collections of Kshs 926.3 bn in revenues during the first six months of the current fiscal year, which is equivalent to 104.3% of the prorated revenue collection target. However, despite the projected high budget deficit of 11.4% and the lower credit rating from S&P Global to 'B' from 'B+', we believe that the support from the IMF and World Bank will mean that the interest rate environment will remain stable since the government is not desperate for cash.
Markets Performance
During the week, the equities market was on a downward trajectory, with NASI, NSE 20 and NSE 25 declining by 3.9%, 1.1% and 3.5%, respectively, taking the YTD performance to losses of 1.2%, 0.8% and 1.9% for NASI, NSE 20 and NSE 25, respectively. The equities market performance was driven by losses recorded by large cap stocks such as Equity, Safaricom, EABL, KCB and Diamond Trust Bank (DTB-K) of 6.6%, 5.1%, 3.9%, 1.8% and 1.7%, respectively. The losses were however mitigated by marginal gains recorded by stocks such as ABSA, Stanbic Bank and NCBA of 0.4%, 0.3% and 0.2%, respectively.
During the week, equities turnover declined by 18.0% to USD 13.9 mn, from USD 16.9 mn recorded the previous week, taking the YTD turnover to USD 30.8 mn. Foreign investors turned net sellers, with a net selling position of USD 3.6 mn, from a net buying position of USD 3.2 mn recorded the previous week, taking the YTD net selling position to USD 0.4 mn.
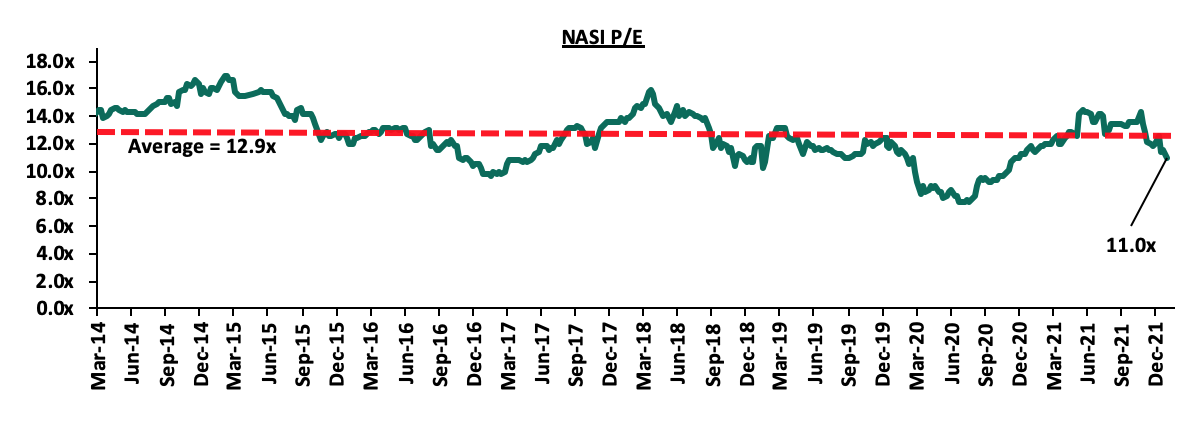
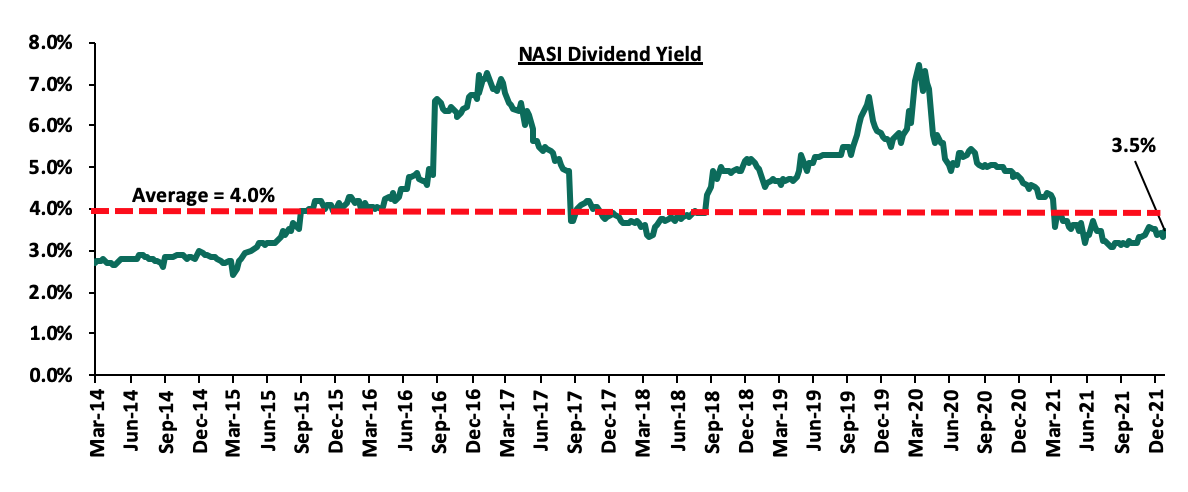
The market is currently trading at a price to earnings ratio (P/E) of 11.0x, 14.7% below the historical average of 12.9x, and a dividend yield of 3.5%, 0.5% points below the historical average of 4.0%. Key to note, NASI’s PEG ratio currently stands at 1.2x, an indication that the market is trading at a premium to its future earnings growth. Basically, a PEG ratio greater than 1.0x indicates the market may be overvalued while a PEG ratio less than 1.0x indicates that the market is undervalued. The current P/E valuation of 11.0x is 43.2% above the most recent trough valuation of 7.7x experienced in the first week of August 2020. The charts below indicate the historical P/E and dividend yields of the market.
Weekly highlight:
Equity Group Holdings announces the incorporation of Equity Group Insurance Holdings Limited
During the week, Equity Group Holdings (EGH), announced the completion of the incorporation of a subsidiary, Equity Group Insurance Holdings Limited, a non-operating insurance holding company and issuance of a life insurance license to Equity Life Assurance Kenya (ELAK) Limited. ELAK, which is fully owned by Equity Group Insurance Holdings Limited, will conduct and undertake long-term insurance business in Kenya. This came after EGH obtained the prerequisite approvals from its shareholders and the Central Bank of Kenya (CBK), before subsequent registration and licensing from the Insurance Regulatory Authority (IRA) on 10th January 2022.
EGH’s decision to invest in the long-term insurance business as compared to general insurance is partly attributable to the weak performance and unprofitability of the general insurance business in Kenya. In Q3’2021, general insurance business in Kenya posted an underwriting loss of Kshs 4.1 bn which was a significant increase of 369.2% from the Kshs 0.9 bn loss posted in Q3’2020. The combined ratio for the general insurance business also remains adverse, coming in at 105.5% in Q3’2021, whereas that of long-term insurance came in at 91.8% pointing to higher profitability in the long-term insurance business. The table below shows a highlight of the performance of general insurance against long-term insurance in Q3’2021;
|
Metric |
General Insurance |
Long-term insurance |
|
Claims ratio |
68.6% |
72.3% |
|
Expense ratio |
36.9% |
19.5% |
|
Combined ratio |
105.5% |
91.8% |
|
Premiums growth (y/y) |
14.2% |
22.5% |
|
Claims growth (y/y) |
18.1% |
27.8% |
Source: Insurance Regulatory Authority
ELAK’s entry in the long-term insurance business is expected to provide competition to the long-term insurance industry that is currently dominated by a few players. According to IRA’s Q3'2021 Insurance Industry Report, the top 6 industry player’s market share amounted to 69.9%, with the remaining 17 players amassing a paltry 30.1%. In our view, we expect ELAK to leverage on the larger EGH’s foothold in the financial services sector, as well as Equity Bank Kenya’s Banc assurance operations. However, the core insurance business in long-term insurance business in Kenya continues to deteriorate, with the claims ratio increasing to 72.3% in Q3’2021, from 69.8% in Q3’2020, attributable to a faster 27.8% increase in claims to Kshs 61.5 bn in Q3’2021, from Kshs 48.4 bn in Q3’2020 as compared to a 22.5% increase in net premiums to Kshs 85.0 bn in Q3’2021, from Kshs 69.4 bn in Q3’2020. The aggressive increase in claims may be attributable to higher pension payouts as a result of the pandemic’s adverse effects on employment and income levels, as well as, higher life claims occasioned by cancellation of policies due to lower affordability.
Universe of coverage:
|
Company |
Price as at 07/01/2022 |
Price as at 14/01/2022 |
w/w change |
YTD Change |
Year Open 2022 |
Target Price* |
Dividend Yield |
Upside/ Downside** |
P/TBv Multiple |
Recommendation |
|
Kenya Reinsurance |
2.3 |
2.3 |
(1.3%) |
(0.9%) |
2.3 |
3.3 |
8.8% |
54.9% |
0.2x |
Buy |
|
I&M Group*** |
21.4 |
21.1 |
(1.6%) |
(1.6%) |
21.4 |
24.4 |
10.7% |
26.5% |
0.6x |
Buy |
|
Jubilee Holdings |
310.0 |
310.0 |
0.0% |
(2.1%) |
316.8 |
371.5 |
2.9% |
22.7% |
0.6x |
Buy |
|
KCB Group*** |
46.0 |
45.2 |
(1.8%) |
(0.9%) |
45.6 |
51.4 |
2.2% |
16.0% |
0.9x |
Accumulate |
|
Sanlam |
11.6 |
10.5 |
(9.1%) |
(9.1%) |
11.6 |
12.1 |
0.0% |
15.3% |
1.1x |
Accumulate |
|
Standard Chartered*** |
130.5 |
129.5 |
(0.8%) |
(0.4%) |
130.0 |
137.7 |
8.1% |
14.4% |
1.0x |
Accumulate |
|
Equity Group*** |
53.0 |
49.5 |
(6.6%) |
(6.2%) |
52.8 |
56.6 |
0.0% |
14.4% |
1.3x |
Accumulate |
|
Stanbic Holdings |
87.0 |
87.3 |
0.3% |
0.3% |
87.0 |
94.7 |
4.4% |
12.9% |
0.8x |
Accumulate |
|
Britam |
7.5 |
7.4 |
(1.6%) |
(2.1%) |
7.6 |
8.3 |
0.0% |
12.7% |
1.2x |
Accumulate |
|
Liberty Holdings |
7.0 |
7.0 |
(1.1%) |
(1.4%) |
7.1 |
7.8 |
0.0% |
11.7% |
0.5x |
Accumulate |
|
Co-op Bank*** |
13.0 |
13.0 |
0.0% |
(0.4%) |
13.0 |
13.1 |
7.7% |
8.6% |
1.0x |
Hold |
|
NCBA*** |
26.0 |
26.0 |
0.2% |
2.2% |
25.5 |
26.4 |
5.8% |
7.3% |
0.6x |
Hold |
|
Diamond Trust Bank*** |
60.0 |
59.0 |
(1.7%) |
(0.8%) |
59.5 |
61.8 |
0.0% |
4.7% |
0.3x |
Lighten |
|
ABSA Bank*** |
11.8 |
11.9 |
0.4% |
0.9% |
11.8 |
11.9 |
0.0% |
0.4% |
1.2x |
Lighten |
|
CIC Group |
2.1 |
2.2 |
3.3% |
1.4% |
2.2 |
2.0 |
0.0% |
(7.1%) |
0.8x |
Sell |
|
HF Group |
3.8 |
3.6 |
(5.2%) |
(5.0%) |
3.8 |
3.0 |
0.0% |
(18.2%) |
0.2x |
Sell |
|
*Target Price as per Cytonn Analyst estimates **Upside/ (Downside) is adjusted for Dividend Yield ***For Disclosure, these are stocks in which Cytonn and/or its affiliates are invested in |
||||||||||
We are “Neutral” on the Equities markets in the short term. With the market currently trading at a premium to its future growth (PEG Ratio at 1.2x), we believe that investors should reposition towards companies with a strong earnings growth and are trading at discounts to their intrinsic value. We expect the discovery of new COVID-19 variants coupled with slow vaccine rollout in developing economies to continue weighing down the economic outlook. On the upside, we believe that the recent relaxation of lockdown measures in the country will lead to improved investor sentiments in the economy.
- Residential Sector
During the week, the Kenya Mortgage Refinance Company, a treasury backed lender, got approval from the Capital Markets Authority (CMA) to roll out a Kshs 10.5 bn medium-term bond programme. The firm aims at raising a total of Kshs 1.4 bn during the first tranche of issuance, which will be disbursed to participating primary mortgage lenders (PMLs), such as banks, microfinance institutions and Savings and Credit Cooperatives (SACCOs) at a 5.0% rate, for onward lending to homebuyers at single digit rates. KMRC also seeks to build its profile as a regular issuer of bonds in the Kenyan capital markets, as they work to raise more long-term capital. The firm has raised about Kshs 37.0 bn since 2020, with the World Bank having extended approximately Kshs 25.0 bn to KMRC in the form of a concessional loan through the National Treasury, while the African Development Bank (AfDB) injected Kshs 10.0 bn, and, the remaining Kshs 2.0 bn was in equity capital. Furthermore, KMRC already acquired a good credit rating of AA- in August 2021, from South African agency GCR, and this is expected to boost the subscription rate of the bond.
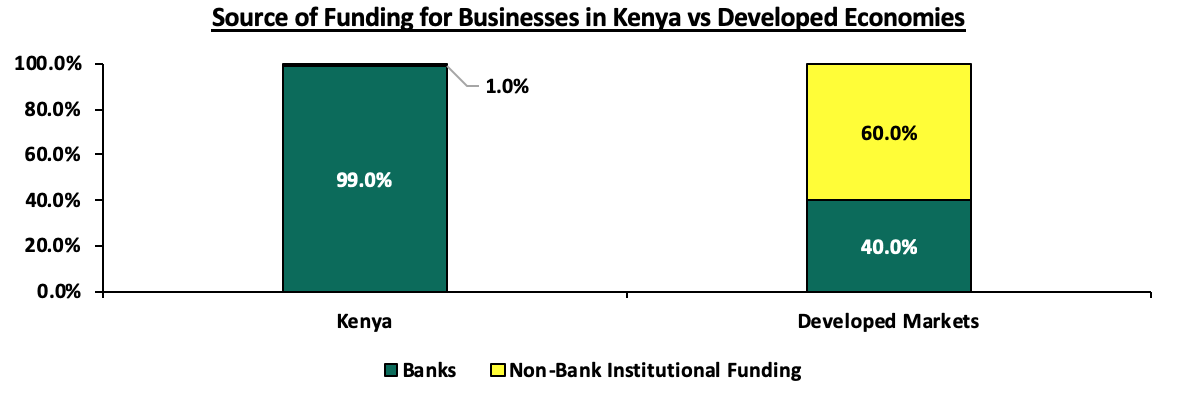
The KMRC bond comes after CMA approved issuance of a Kshs 3.9 bn corporate bond to finance construction of the ongoing Pangani Affordable Housing Project in November 2021. We believe that the bond programme will position the capital markets as a source of funding that supports the affordable housing initiative, which is one of the pillars of the ‘Big Four Agenda. Obstacles in the capital markets in terms of access to financing have limited private sector’s participation in the development of affordable housing in Kenya due to unavailability and the high dominance on banks as a source of funding. This implies that capital markets contribute a mere 5.0% of real estate funding, compared to 60.0% in developed countries. The graph below shows sources of funding businesses in Kenya compared to developed countries;
We are of the view that in order to deepen our capital markets and stimulate its growth, these obstacles can be addressed by; i) bridging regulatory framework to allow unit holders to invest in sector funds dedicated to affordable housing, ii) reduce high minimum investments in REITs to reasonable amounts given that the national median income for employed individuals is estimated at around Kshs 50,000., and, iii) eliminate conflicts of interest in the governance of capitals markets to a structure that is more responsive to market participants and market growth.
Additionally, through the bond, KMRC will be able to refinance more loans, having already processed Kshs 6.2 bn worth of loans by November 2021 to cover 4,000 mortgages from 11 lenders. This will boost home ownership in Kenya which has remained low at 21.3% in urban areas as at 2020, which is low compared to other African countries such as Ghana with a 47.2% urban home ownership rate in the same period. The low home ownership rate is attributed to; i) high property prices, ii) lack of real estate finance to fund large scale developments due to an under developed and non-supportive capital market, and, vi) the high initial deposits required to access mortgages. The graph below shows the home ownership percentages of different countries compared to Kenya;
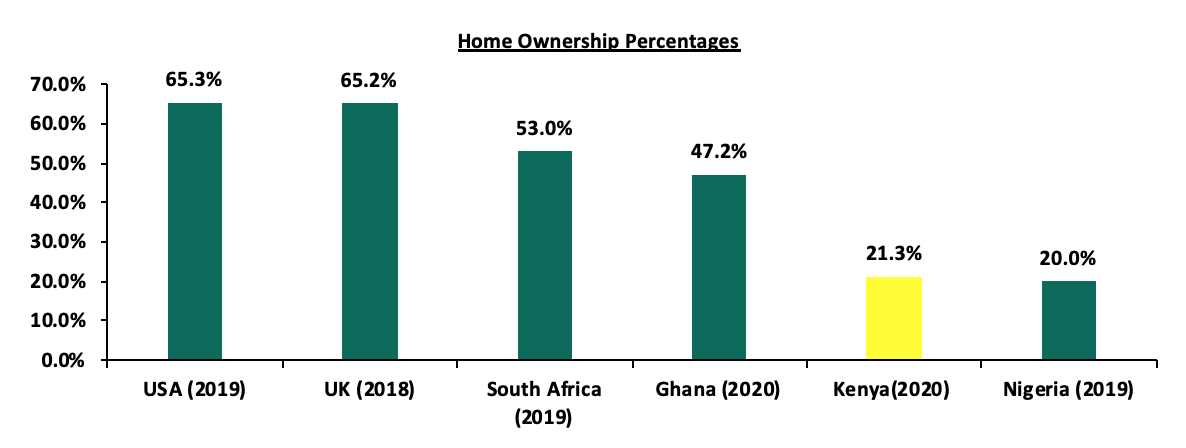
Source: Centre for Affordable Housing Africa, Federal Reserve Bank
From the assumed mortgage loan size of Kshs 3.5 mn, this funding is therefore expected to increase the number of mortgage accounts in Kenya, which recorded a 3.7% decline to 26,971 in December 2020, from 27,993 in December 2019 according to the Central Bank of Kenya- Bank Supervision Annual Report 2020.
The graph below shows the number of mortgage loan accounts in Kenya over the last 10 years;
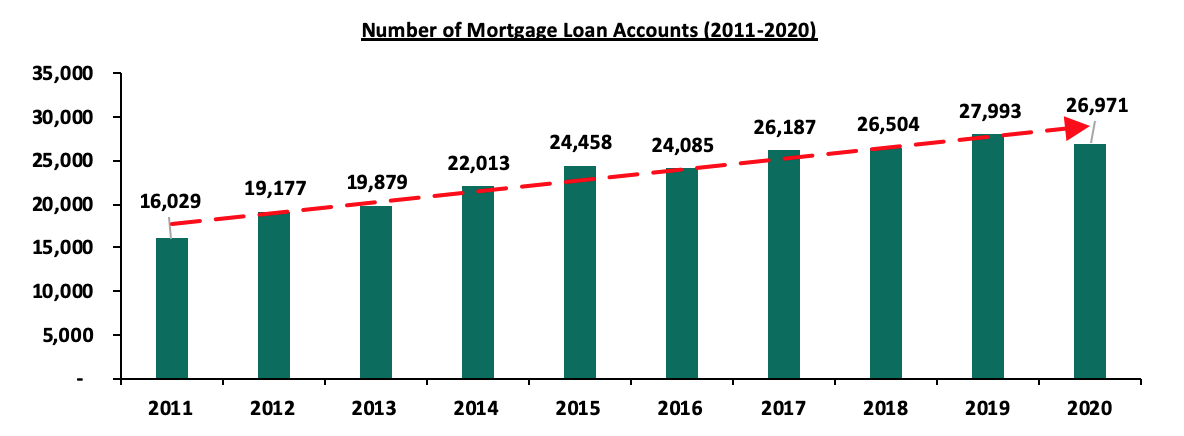
Source: Central Bank of Kenya (CBK)
Additionally, the Kenya mortgage to GDP ratio continues to lag behind at 2.2% as of 2020, compared to countries such as Namibia and South Africa at 18.9% and 16.2%, respectively as shown in the graph below;
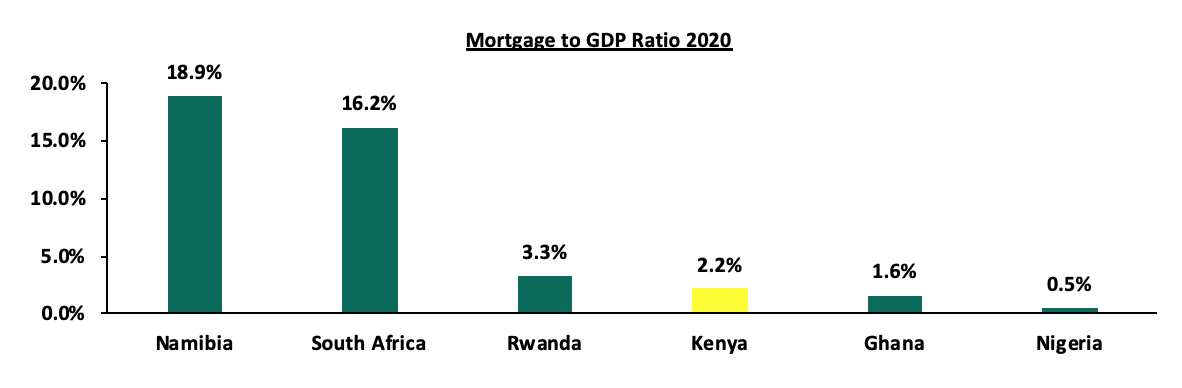
Source: Centre for Affordable Housing Africa
So far, KMRC has performed well by; i) boosting liquidity to Primary Mortgage Lenders through its debut lending of Kshs 2.8 bn in FY’2020/21 and Kshs 7.0 bn budgeted in FY’2021/22, ii) increasing mortgage uptake in the country by so far refinancing 1,427 mortgages as at 2020 with others under review currently, iii) encouraging mortgage market competition for the benefit of borrowers through low rate lending, iv) increasing capital for refinancing with total Kshs 40.0 bn under management by the firm as at June 2021. However, KMRC is likely to face stiff competition from government instruments offering higher rates as the firm seeks to borrow from the market and lend at low rates. With 20-year bonds attracting an average yield of 13.5%, KMRC would have to offer a premium above this in order to attract investors in the fixed income market, which would consequently lead to a negative spread between the lending rate and borrowing rate. It is therefore not clear how the firm will borrow from the market and sustain lending at a 5.0% rate. Despite this, the residential sector is expected to improve supported by efforts being made to offer affordable mortgages to a diverse number of clients at bespoke terms.
- Mixed-Use Developments
During the week, CCI Group of companies, a business process outsourcing (BPO) provider, and, nutrition supplements distributor Max International took up approximately 60.0% of the 270,000 SQFT space at Garden City Business Park along Thika Road. CCI and Max International are taking up six-and-a-half floors, and, half-a-floor, respectively, at the business park with East Africa Breweries limited having being the other corporate giant that took up space at the development in November 2019. This move has seen the development realize a 93.0% occupancy, following the closure of major commercial leases. As a result, its developer, British private equity investor Actis, is expected to collect Kshs 226.0 mn annually in rent.
Garden City Business Park is phase two of Kenya’s first mixed-use project by Actis which once complete will offer lettable Grade A offices, a healthcare facility, hotel and over 400 new Mi Vida, middle income homes within one 47.0-acre integrated plan. The decision to take up space in Garden City Business Park was informed by MUDs along Thika Road recording a relatively high average rental yield of 6.1%, 0.6% points higher that the market average of 6.0%, according to our Cytonn NMA MUDs Report 2021. The area is also served by a good road network, i.e, Thika Road Super Highway hence easily accessible, boasts of high-quality finishes in the development, and, is a commercial hub attracting a high footfall. Overall, Mixed-Use Developments recorded an average rental yield of 7.2% in 2021, 0.3% points higher than the respective single-use themes which recorded an average rental yield of 6.9% in the same period in 2020. The relatively better performance by MUDs compared to single-use developments was attributed to the prime locations mostly serving the high and growing middle income class, coupled with the concept’s convenience that incorporates working, shopping and living spaces. The table below shows the performance of Mixed-Use Developments by node in 2021;
(All Values in Kshs Unless Stated Otherwise)
|
Nairobi’s Mixed-Use Developments Market Performance by Nodes 2021 |
|||||||||||||
|
|
Retail Performance |
Commercial Office Performance |
Residential Performance |
|
|||||||||
|
Location |
Price/SQFT |
Rent/SQFT |
Occup. (%) |
Rental Yield (%) |
Price/ SQFT |
Rent/SQFT |
Occup. %) |
Rental Yield (%) |
Price/ SQM |
Rent/ SQM |
Annual Uptake % |
Rental Yield % |
Average MUD yield |
|
Karen |
23,333 |
196 |
86.7% |
8.8% |
13,233 |
117 |
85.0% |
9.0% |
|
|
|
|
8.7% |
|
Westlands |
15,833 |
173 |
70.8% |
9.5% |
12,892 |
110 |
71.7% |
7.3% |
211,525 |
1,226 |
15.6% |
7.0% |
7.8% |
|
Kilimani |
18,500 |
162 |
79.0% |
8.3% |
13,713 |
106 |
79.0% |
6.7% |
|
|
|
|
7.4% |
|
Mombasa Rd |
20,000 |
185 |
70.0% |
8.4% |
13,000 |
100 |
60.0% |
5.5% |
156,079 |
853 |
13.3% |
6.6% |
7.4% |
|
Thika Rd |
23,750 |
215 |
82.5% |
9.2% |
13,250 |
105 |
72.5% |
6.9% |
128,545 |
612 |
17.9% |
6.1% |
7.0% |
|
Upper Hill |
15,485 |
130 |
62.5% |
6.4% |
12,000 |
102 |
70.0% |
7.0% |
|
|
|
|
6.8% |
|
Eastlands |
20,000 |
124 |
75.0% |
5.5% |
12,000 |
80 |
62.5% |
5.0% |
72,072 |
360 |
10.0% |
4.2% |
5.1% |
|
Average |
18,759 |
170 |
75.9% |
8.4% |
12,924 |
106 |
73.6% |
7.1% |
142,055 |
763 |
15.0% |
6.0% |
7.2% |
|
*The average MUDs performance is based on areas where sampled projects exist |
|||||||||||||
Source: Cytonn Research
We expect an increase in uptake of Mixed-Use Development investments due to the integration benefits which provide a live, work and play environment. The developments also offer better returns compared to single use themes.
- Hospitality Sector
During the week, the Kenyan government suspended all inbound and transit passenger flights from the United Arabs Emirates (UAE) for seven days effective 10th January. This move was in retaliation to the United Arab Emirates (UAE) issuing a ban on all inbound and transit passengers from Kenya in December 2021, citing fake COVID-19 certificates from Kenyan travellers. Additionally, the United States of America (USA), raised Kenya’s travel advisory alert from Level One to Level Three, amidst concerns of the increasing COVID-19 infections following the emergence of the Omicron variant. This decision comes barely less than three months after Kenya had attained the Level One alert in October 2021, which is a much safer classification that only requires citizens to follow standard procedures such as putting on face masks. The move by the US government is expected to weigh down the performance of the tourism and hospitality sectors in general as its citizens will cancel or postpone their travel plans to cushion themselves against the Omicron variant. The United States is a top source tourism market for Kenya ranking at position one with 49,178 visitor arrivals, representing 16.1% of the total visitor arrivals according to the International Tourism Performance Report January to June 2021 by Tourism Research Institute of Kenya.
The graph below shows the number of international arrivals from January 2021 to October 2021;
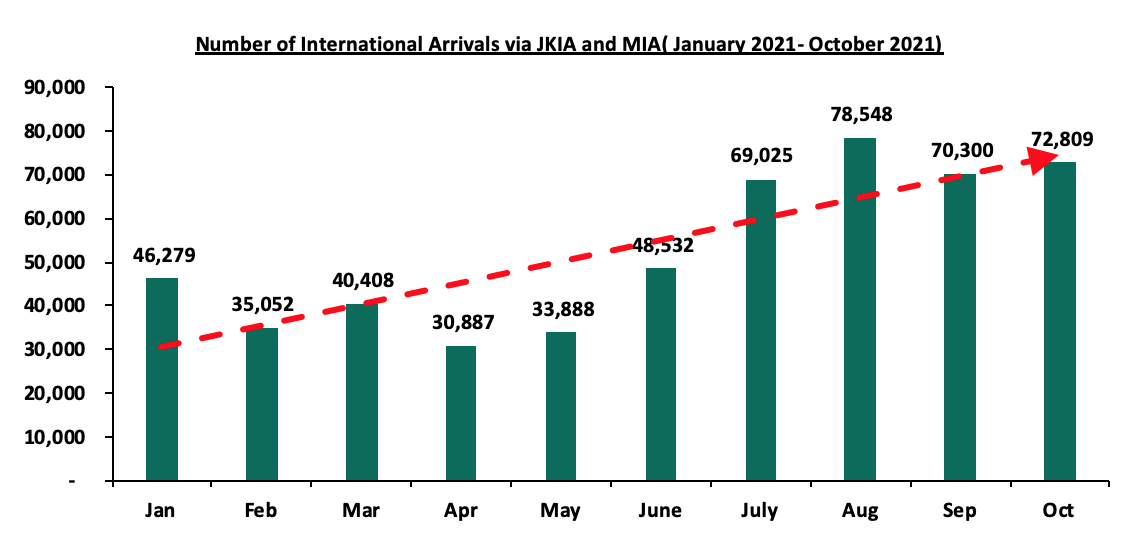
Source: Kenya National Bureau of Statistics
Despite the strategies implemented to promote the performance of the tourism sector such as; i) gradual lifting of travel restrictions and lockdowns, ii) international marketing, iii) positive accolades for Kenya’s tourism market, and, iv) mass vaccinations, the hospitality sector is still expected to be weighed down. This will be mainly attributed to factors constraining tourism sector such as the expected low visitor number arrivals from key source markets like US, and the reduced budget allocation for the tourism sector by 11.3% to Kshs 18.1 bn in FY 2021/22 from Kshs 20.4 bn in FY’2020/21.
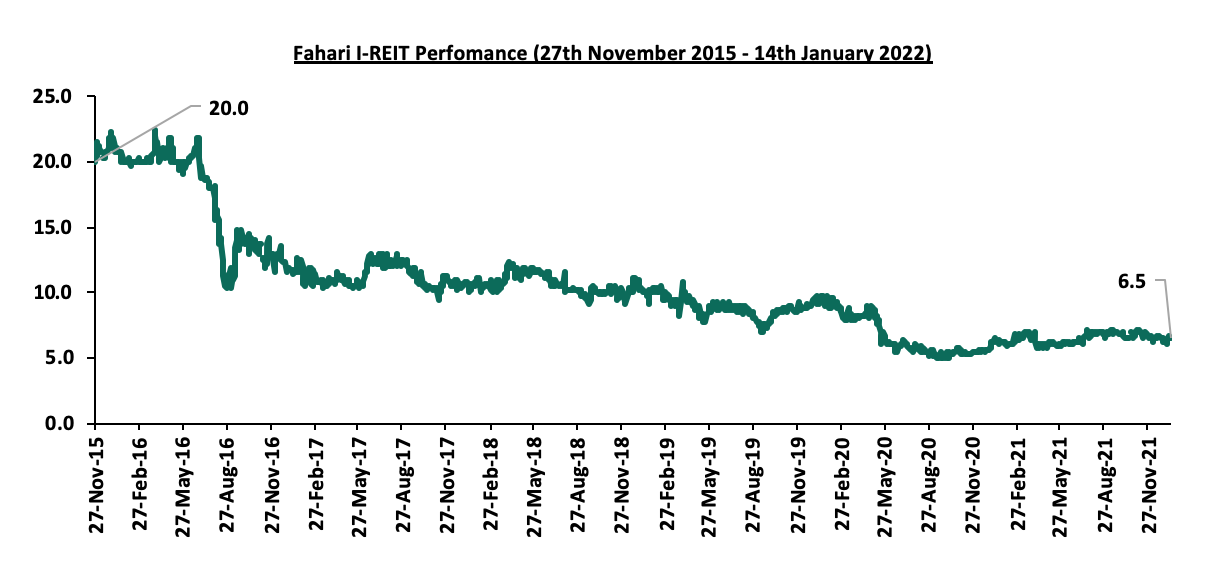
- Listed Real Estate
During the week, Fahari I-REIT closed the week trading at Kshs 6.5 per share, an increase of 1.6% compared to Kshs 6.4 per share recorded the previous week. On a YTD basis, the share price recorded a 1.2% points increase from Kshs 6.42 recorded at the beginning of the year. However, on an Inception to Date (ITD) basis, the share price declined by 67.5% from the listing price of Kshs 20.0 per share. The performance of the REITS market in Kenya continues to be subdued by factors such as inadequate investor knowledge on the instrument, lengthy approval process, high minimum capital requirements for a trustee at Kshs 100 mn and, high minimum investments amount.
The graph below shows the performance of the Fahari I-REIT from 27th November 2015 to 14th January 2022;
Other Highlights;
During the week, Centum Real Estate (Centum RE), a fully owned subsidiary of Centum Investment PLC announced that it had signed an agreement with GEM Global Yield LLC SCS (GEM), a Luxembourg based private alternative investment group to provide Centum Real Estate with a share subscription facility of up to Kshs 17.0 bn for a 36-month term following a public listing. This means that for Centum RE to access the aforementioned funds, they will have to go public.
The share subscription facility, which is an agreement between a company and an investor at a fixed price, will allow Centum Real Estate to draw funds by issuing shares of common stock to GEM. As such, Centum will control the timing and maximum size of drawdowns and has no minimum drawdown obligation which is aimed at ensuring Centum RE does not have to take up the funds in unfavourable market conditions. The plans by Centum to list its Real Estate Subsidiary is a continuation of Centum Investments active strategy to reduce concentration of assets in the Real Estate sector.
In the FY’2021 Annual report, Centum Investments announced plans to partially exit Centum RE to a strategic investor by 2024 in order to achieve the intended rebalancing of its portfolio. Key to note, in the year ended March 2021, Centum held 63.5% of its Kshs 47.5 bn worth of assets in Real Estate which exceeded the target maximum of 55.0% by 8.5% points. Centum RE is currently valued at Kshs 16.6 bn which is a significant 112.8% mark up from the Kshs 7.8 bn that had been invested in acquiring and developing the assets making up Centum RE’s portfolio.
Key to note, in FY’2021, Centum RE was less profitable, recording a significant 71.7% reduction in its Profit after tax (PAT) to Kshs 0.7 bn, from Kshs 2.3 bn in FY’2020, mainly attributable to a 64.3% decline in Investment income to Kshs 1.4 bn from Kshs 3.9 bn in FY’2020. However, in H1’2022, Centum RE posted an improved performance, with the PAT improving by 26.8% to a loss of Kshs 0.3 bn, from Kshs 0.4 bn during a similar period last year. This loss weighed down Centum Investments H1’2022 PAT of Kshs 0.4 bn. We are of the view that the potential listing of Centum RE and the share subscription facility will play an important role in helping Centum Investments to reduce its risk exposure in Centum RE and allow it to invest in other more profitable asset classes.
The Real Estate sector in 2022 is expected to be on an upward trajectory as markets recover. However, the Real Estate sector performance is expected to be constrained by travel bans and restrictions amid rises cases of COVID-19 infections, which are expected to have a down turn on the hospitality industry. Low investor appetite for Real Estate Investments Trusts (REITS) also continues to be a challenge affecting Real Estate investments.
The concept of off plan buying has continued to gain traction over the years driven by the challenging financing environment for both the developers and the end buyer. Buying off-plan is a great way to purchase a property below its actual market value, which makes it a great investment opportunity. For investors, most are attracted to off-plan buying due to the promise of property appreciation. Developers on the other hand prefer off plan investments since they consider it an alternative source of financing mainly because of the capital intensive nature of Real Estate Projects
This week we seek to provide an in-depth assessment of the concept of off plan investments in the Real Estate sector to provide a basis for the justification of the concept. As such, we shall discuss the following:
- Introduction to Off Plan Investing,
- Overview of the Off Plan Buying Process and Investing Tips one should consider,
- Advantages and Disadvantages of Off Plan Investing,
- Off Plan Case Examples in Kenya, and,
- Conclusion
Section 1: Introduction to Off Plan Investing
Off plan investing is defined as the process through which an investor buys into a Real Estate development before it is completed. The selling or buying of property is done before the property is built, when there are only plans outlining the development concept alongside the relevant project approvals. For off plan sales, the payment terms always depend on the arrangement between the buyers and the sellers and at times they can be done in installments as the project progresses. Upon completion, the end buyer may decide whether to sell the unit on profits, to move into the property or rent out the property. Developers on the other hand stand to gain from capital injection since off plan investments have proven to be an effective mode of Real Estate financing. The concept has continued to gain popularity in the Real Estate market over the years driven by:
- Affordability: Units bought on an off plan basis have proved to be affordable compared to the ones purchased upon completion. Real Estate investors may end up paying up to 30.0%-50.0% less (depending on the project duration) for a house brought on an off plan basis. In most cases, buyers are provided with house prices that are valued at a lower price compared to the available market prices so that they get attracted to the investments, and,
- Capital Gains: Houses brought on off plan have the potential of capital gains which are higher compared to appreciations that individuals get when they purchase a property on completion. For instance, an individual who purchased a 1-bedroom unit off-plan at Kshs 5.5 mn in Cytonn’s Alma in Ruaka, stands to gain 55.0% in price appreciation as the unit’s current selling price is Kshs. 8.5 mn in Phase 4.
Section 2: Overview of the Off Plan Buying Process and Investing Tips
When purchasing properties off plan, it is important to exercise precaution and understand the track records of the developers to avoid financial losses. Buyers need to evaluate the legality of the projects and evaluate if developers have a history of delivering their projects by developers to avoid being swindled. As such, it is important to consider the important off plan buying tips and the necessary steps that should be followed when making off pan investments.
Off Plan Buying Tips
Buying a property that is yet to be developed or is in the pipeline poses greater risks to investors such as risk of delays. It is therefore important for an investor to undertake various strategies to minimize future risks and losses resulting from uncertainties such as projects stalling. Some of the important tips that needs to be considered before making off plan investments include;
- Market Research: The buyer needs to conduct a thorough market research and inspection of the preferred location of the development, in order to know the market performance of the area overtime and in turn maximize future returns. This can be well achieved through both desktop research and field data collection and analysis. Whereas it is essential and quicker to do the research through desktop study, it is very important to physically assess the area’s situation i.e. appearance and amenities available, and performance in order to get more accurate information. Effective research will help in determining if a project is worth investing in or not,
- Developer Due Diligence: Buyers need to run a background check on the developer and consulting firm that is implementing the project prior to purchasing a property. This is essential as it helps the buyer identify the developer’s reputation, the previous projects undertaken to completion, whether the developer is a registered company in the county of operation, etc. Additionally, having information of the company directors, their delivery to promise and proof of timelines met is also important in avoiding fraudulent off plan investment cases. This due diligence will help the buyer become aware of who he or she is to deal with before committing to a project,
- Project Due Diligence: This entails checking for the viability of a project through:
- Visiting the project site to ensure that the actual site exists,
- Evaluating the development titles to have proof that the owner of the land is genuine in the transaction,
- Evaluating the project plan approvals to understand if the developers have the legal rights to develop the properties and to prevent delays in project delivery,
- Evaluating the project team, experience, history and capability to gauge if they can deliver the project,
- Getting regular updates from the developer to ensure that timelines set for project delivery will not be compromised,
- Conducting research on Comparables to gauge the possibility of earning potential returns as promised by the developer, and,
- Understanding the project design team to understand the credibility of key individuals in the development process such as contractors and engineers.
- Contracts Due Diligence: Before signing any agreement from the seller such a sale agreement, it is advisable for the buyer to carefully read the terms and conditions in order to avoid risks of malpractices or compromise. Moreover, the buyer should engage a conveyance lawyer to ascertain the effectiveness and legitimacy of the agreement to prevent fraudulent cases in future, and,
- Financial Strategy: The buyer should have a financial plan as to how the property will be purchased, from the options that exist such as mortgages, instalment plans, and, cash at hand among others. Mortgages are regarded as debt instruments and are usually secured against a collateral of a Real Estate nature, on the other hand, instalment payments refer to a payment plan made in agreement by both developers and buyers where the investors make payments in small portions throughout a fixed period of time. With the limited funding options in Kenya, the buyer can consult his or her bank for financial advice and position, to avoid financial losses, i.e. the initial deposit, as result of failure to make subsequent payments.
Off Plan Buying Process:
It is important for buyers to understand the processes involved in off plan investments in order to have an understanding of areas where they need to be actively involved in. The figure below shows the necessary steps that should be considered in the off plan investing process;
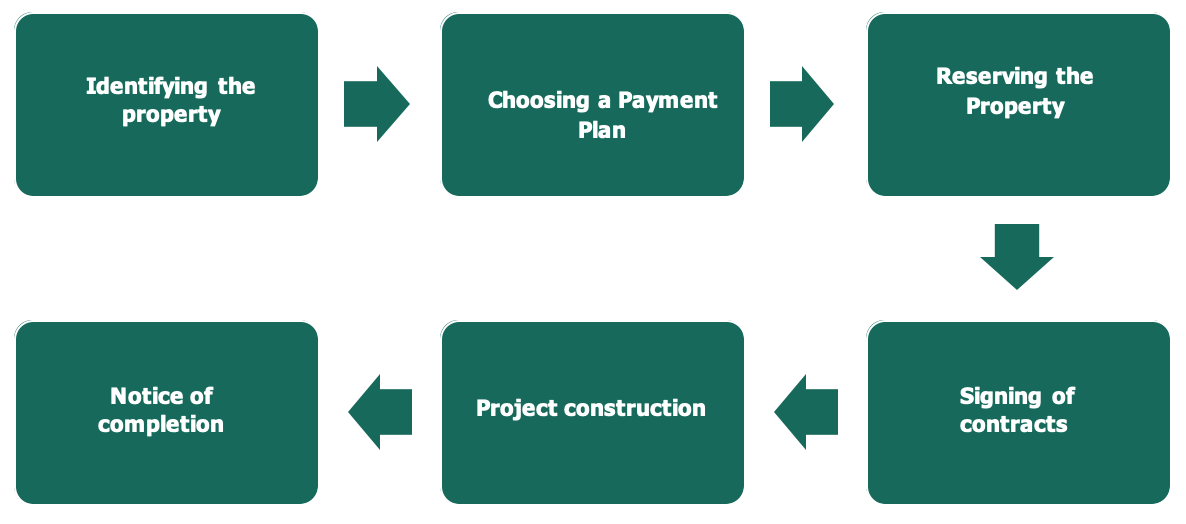
- Identifying the Property: This first step involves an investor identifying the development project that is ongoing or yet to be executed. During this period, the investor has to do proper due diligence on the developer undertaking the project. Doing market research is also an important necessity for this step as it provides the buyer with information of the performance of the development against similar Comparables,
- Choose a Payment Plan: After identifying the property to be purchased, the buyer and seller have to come to terms on the payment plans and schedules for the development. There are various payment plans used to make purchases for off plan developments which include cash payments, installments, and mortgages, among many others. Here, it is important for the buyer to choose from the various payment plans available; the one that best works for him/her,
- Reserve the Property: After identifying a suitable payment plan, the buyer will be able to reserve the desired property awaiting for the project completion. This is achieved by making an initial deposit for the property which is in other terms a reserve or holder for the property,
- Signing of Agreement: This process entails signing of contracts such as the sale agreement contract that will be presented to the buyer by the seller. Prior to signing any binding agreement, it is important for the buyer to read through the document thoroughly to ensure it is not compromised and that they are aware of what they are signing. Here, the buyer should also seek legal advice from a well-qualified lawyer to further ensure smooth and effective conveyance process before settling,
- Project Construction: This is the actual execution of the development project. The period of construction varies depending on the development design, type, and mix. During this period, the buyer should also track the development process i.e. by doing periodic site visits and inspections in order to be well informed on the process. The developer also needs to make frequent updates on the status of the project to the buyer and communicate in any case of anticipated delays, and,
- Notice of Completion and Hand Over: Once the project is fully implemented, the buyer will be notified of the project completion, and the property officially handed over to him/her.
Section 3: Advantages and Disadvantages of Off Plan Investing
In off plan investments, both the developers and the end buyers stand to gain in the process if the projects are well executed. Some of the advantages of off plan investing include;
- Opportunity to Lock in Price: Buying off-plan enables investors and homebuyers to acquire a property at a lower price as opposed to purchasing upon completion. In most cases, the developers offer low prices at the beginning of a project to make sure that they secure buyers and investors as soon as possible. Buyers are able to acquire future asset at today’s prices therefore enabling them to achieve capital gains on completion. A home bought off-plan will likely increase in price over time thus guaranteeing investors returns,
- Flexible Payment Plans: Most developers offer flexible payment plans such as cash, installments, and mortgages being the most popular options available. Some developers also consider zero deposits as an effective plan which is aimed at significantly reducing the initial upfront costs of units. This implies that buyers have the freedom to choose the payment terms that they deem fit for them, plans that would enable them make payments at their comfort without straining,
- Buyer’s Choice: The buyer/investor gets to pick where he/she would want the house located, as such, they are able to get the best location for their developments,
- Design Modification: The buyer has the ability to modify the interior designs of their selected properties including the type of finishes. Depending on the developers/level of completion an individual may have room to make design changes to their units, and,
- High Capital Appreciation: The value of an off plan development increases with level of completion and as development progresses. Some developments have been able to achieve over 50.0% price appreciation, for example the Alma in Ruaka which has achieved more than 30.0% in price appreciation since inception.
Despite the various advantages offered by off plan investing, there are some pitfalls that both developers and investors needs to be aware of. They include:
- Poor Product Quality: Developers cutting the total project costs can lead to a low quality final product, and as such, the products delivered will not meet the expectations of the buyers,
- Possibility of Capital Depreciation: In the event that the market rates go down or flatten, the investor may lose their capital. This usually happens in cases where developers over promises on returns such as yields and appreciations or when market conditions change. Capital depreciations may also be realized in the event of market uncertainties; for example, if the market goes into a Real Estate bubble. A Real Estate bubble is regarded as an increase in property prices in the market due to increased demand against limited supply, and an eventual slump in the demand for the properties in what is called a ‘burst’,
- Risk of Delays: The risk of delays will also be greater than when purchasing a completed property. These will generally be an inconvenience rather than a deal-breaker, as it interferes with the financial plans of the buyers. Moreover, this risk has been further fueled by the presence of the pandemic which saw to it a reduced purchasing power of prospective clients and in turn most development projects stalling,
- Failure to Deliver: Failure to deliver projects may result into financial strain, or fraudulent cases. Some developers over the past few years have swindled off-plan Real Estate buyers therefore affecting plans by buyer’s investments and financial plans,
- Unmet Finishing Requirements: A buyer might end up being disappointed with the quality of finishes presented to him/her, sometimes what is in the plan is not what is delivered especially when developers try to cut the project costs or miss out on particular details of the requirements by the developers,
- Unfavorable Payment Terms: Most payment plans may not be tailored towards the needs of the off plan buyer and this may be a source of dispute between the developers and buyers during the off plan buying process,
- Incomplete Developments: Incomplete developments may scare away potential investors as most people prefer to purchase existing structures that they can see. This may impact the ability of the developer to get finances to complete their projects, and,
- Dependence on Savings: The main form of housing finance in the country is personal savings accounting for 54.0% of all housing financing alternatives while bank loans come in second at 19.0% according to the Kenya Bankers Association-Home Ownership Survey. Dependence on savings to finance home acquisition may limit the number investors who can afford purchasing off plan.
Section 4: Off plan case examples in Kenya
In Kenya, we have continued to witness developers opting for off plan investments as a strategy to increase their funding capabilities. Developers who are focused on delivering to promise have shown that the concept if well executed can be beneficial providing a win-win situation for them and the end buyers. Below are notable case studies of successful projects that have been completed with part of the funding from off plan investments:
|
Capital Appreciations of Successful Off Plan Investments |
||||||||
|
Development Name |
Location |
Developer |
Number of Bedrooms |
Unit Size |
Price before completion (Kshs mn) |
Price after completion (Kshs mn) |
Capital Appreciation |
Summary |
|
Amara Ridge |
Karen |
Cytonn Real Estate |
5 |
470 |
85.0 |
108.6 |
27.8% |
The project was launched in 2015 and completed in 2017, with a 100.0% off plan sales achieved. It is a private gated community located in Karen, comprising of 10 luxurious 5 Bed Room Villas of 470SqM each, and with easy access to Ngong and Lang’ata roads |
|
Loresho Ridge |
Loresho |
Kenya Power Pension Fund |
3(Johari) |
150 |
11.5 |
16.5 |
30.3% |
Loresho Ridge project is a gated community whose construction was initiated in 2012 and completed in 2015. It comprises of a total of 164 units, out of which 29.3% off plan sales were achieved |
|
4(Fahari) |
265 |
28.0 |
38.5 |
27.3% |
||||
|
4(Kilele) |
242 |
25.0 |
35.5 |
29.6% |
||||
|
4(Makao) |
222 |
22.5 |
31.5 |
28.6% |
||||
|
4(Watani) |
238 |
24.0 |
34.5 |
30.4% |
||||
|
Alma (Phase 1, 2 and 3) |
Ruaka |
Cytonn Real Estate |
1 |
51 |
5.5 |
8.5 |
54.5% |
The comprehensive mixed use development project consisting of 477 units broke ground in 2016. Out of which, 201 units were sold as off plan in phase 1, 2 and 3, representing a 42.1% sales realized |
|
2 |
84 |
7.5 |
12.5 |
66.7% |
||||
|
3 |
117 |
9.0 |
15.5 |
72.2% |
||||
|
Pearl Heights |
Kileleshwa |
|
3 |
223 |
19.0 |
26.0 |
26.9% |
This is an 8-storey apartment complex consisting of 32 units. It was launched in 2013 and completed in 2016, with a 31.3% off plan sales achieved during the period |
|
Muthaiga Valley Apartments |
Parklands |
|
3 |
174 |
14.0 |
19.0 |
26.3% |
The development project consisting of 50-3 bedroom apartments broke ground in 2015 and completed in 2017 with an overall 42.0% off plan sales achieved |
|
3 With SQ |
|
15.0 |
20.0 |
25.0% |
||||
|
Ramata Greens Phase I |
Baba Dogo |
|
2 |
|
7.5 |
10.0 |
25.0% |
Construction of the 70-unit project began in 2013 and completed in 2016, with a 32.9% off plan sales made |
|
3 |
|
8.8 |
11.5 |
23.5% |
||||
|
Kings Millenium |
Imaara Daima |
Kings Developers Limited |
3 |
124 |
6.5 |
12.0 |
45.8% |
Construction began in 2013 and completed in 2016. During the period, 25.0% off plan sales were realized out of the 220 unit development project |
Source: Online Research
The above case examples show that off plan investments if well executed can be rewarding to both buyers and developers. Buyers are rewarded in terms of gains from capital appreciation while on the other end the developers gain from having adequate funds to develop their units which is not tied to interest payments.
Section Five: Conclusion
In conclusion, off plan investments have proven to be beneficial to investors due to their affordability, flexible payment plans, high capital appreciations and the ability to make design modifications. Additionally, purchasing off plan is a great way of investing in Real Estate which has continued to perform better than other asset classes such as the Equities market. Developers also stand to gain since they are able to acquire alternative sources of financing from the off plan buyers. Off Plan investing continues to be a lucrative investment opportunity that provides the possibility of earning high returns which may go up to 30.0%-50.0% p.a. However, it is also important for investors to develop an understanding of what they are getting into, the terms of the contract and the expected challenges they may face in the process. This can be further ensured by the buyer engaging a conveyance lawyer to certain the effectiveness and legality of the agreement to development project thus prevent fraudulent cases in future.
Disclaimer: The views expressed in this publication are those of the writers where particulars are not warranted. This publication, which is in compliance with Section 2 of the Capital Markets Authority Act Cap 485A, is meant for general information only and is not a warranty, representation, advice or solicitation of any nature. Readers are advised in all circumstances to seek the advice of a registered investment advisor.

- Talk to us
- Kenya
- P.O Box 20695 - 00200, Nairobi, Kenya
- Cell +254709101200
- Tel +254709101200
- WhatsApp +254741676635
- United States
- +254709101200
- DOWNLOAD OUR APP
-


- Kenya
- 8th Floor, Pinetree Plaza, Kaburu Drive, Ngong Road, Nairobi, Kenya
- USA
- Suite 1150, 1775 Eye Street NW, USA, Washington DC 20006, USA
- Investments
- High Yield
- Private Equity
- Real Estate
- Real Estate
- RiverRun Estates
- Cytonn Towers
- The Ridge
- Taraji Heights
- The Alma