Post Elections Economic Focus, & Cytonn Weekly #33/2022
By Cytonn Research, Aug 21, 2022
Executive Summary
Fixed Income
During the week, T-bills remained undersubscribed, with the overall subscription rate coming in at 82.1%, up from the 72.4% recorded the previous week. The increase in the subscription rate was partly attributable to the relatively eased liquidity in the money market as well as the prevailing high yields on the government securities. Investors’ preference for the shorter 91-day paper persisted, with the paper receiving bids worth Kshs 11.8 bn against the offered Kshs 4.0 bn, translating to a subscription rate of 294.3%, down from the 299.8% recorded the previous week. The subscription rate for the 182-day paper increased to 68.0% from 39.3% while that of the 364-day paper declined to 11.4% from 14.5% recorded the previous week. The yields on the government papers recorded mixed performance with the yields on the 182-day and 91-day papers increasing by 5.9 bps and 10.4 bps to 9.5% and 8.7%, respectively, while the yields on the 364-day paper declined by 1.3 bps to 9.9%. In the Primary Bond Market, the Central Bank of Kenya released results for the recently re-opened bonds; FXD1/2022/03, FXD2/2019/10 and FXD1/2021/20 highlighting that the bonds recorded an undersubscription of 98.3%;
Also during the week, the Energy and Petroleum Regulatory Authority (EPRA) released their monthly statement on the maximum fuel prices in Kenya effective 15th August 2022 to 14th September 2022, highlighting that the fuel prices remained unchanged at Kshs 159.1 per litre for Super Petrol, Kshs 140.0 per litre for Diesel and Kshs 127.9 per litre for Kerosene. Additionally, the National Treasury gazetted the revenue and net expenditures for the first month of FY’2022/2023, ending 31st July 2022 indicating that the total Revenue collected amounted to Kshs 133.2 bn equivalent to 6.2% of the original estimates of Kshs 2,141.6 bn for FY’2022/2023 and is 74.6% of the prorated estimates of Kshs 178.5 bn;
Equities
During the week, the equities market was on a downward trajectory with NASI, NSE 20 and NSE 25 declining by 0.4%, 1.1% and 1.0%, respectively, taking their YTD performance to losses of 12.4%, 7.1% and 9.9%, for NASI, NSE 20 and NSE 25, respectively. The equities market performance was mainly driven by losses recorded by large-cap stocks such as Equity Group, EABL, Co-operative Bank, NCBA Bank and BAT of 5.0%, 2.2%, 1.6%, 1.5% and 1.0%, respectively. The losses were however mitigated by gains recorded by stocks such as ABSA, Bamburi, KCB Group and Safaricom of 2.9%, 2.1%, 0.5% and 0.3% respectively;
During the week, Standard Chartered Bank of Kenya Plc, Stanbic Holdings and I&M Holdings released their H1’2022 financial results, indicating an increase in Earnings per share of 10.9%, 36.9% and 15.9%, respectively;
Real Estate
During the week, EA Limited, a subsidiary of the TransCentury PLC, an African infrastructure investment company based in Nairobi Kenya, announced plans to develop an affordable housing project worth USD 250.0 mn (Kshs 29.8 bn) in the Democratic Republic of Congo (DRC). In the Nairobi Stock Exchange, Fahari I-REIT closed the week trading at an average price of Kshs 7.1 per share;
Focus of the Week
Kenya, like many other countries world over, has faced unprecedented challenges in the recent years which has had a major setback on the economy. One major issue; supply chain bottlenecks remains apparent and continues to worsen with new challenges such as geopolitical pressures and anticipation of increased demand as economies recover. The country is currently dealing with several issues including a high cost of living stemming from the prevailing inflationary pressures and local currency depreciation, rising debt levels currently at 69.1% of GDP as of May 2022 and a deteriorating business environment as consumers continue to cut back on spending. As such, we expect the incoming government to roll up its sleeves, perform a balancing act, and devise ways to stabilize key macroeconomic indicators while also supporting the ongoing economic recovery. This week, we turn our focus to the key economic areas that the incoming government should focus on, given that the electioneering period is over;
Investment Updates:
- Weekly Rates:
- Cytonn Money Market Fund closed the week at a yield of 10.55%. To invest, dial *809# or download the Cytonn App from Google Playstore here or from the Appstore here;
- Cytonn High Yield Fund closed the week at a yield of 13.93% p.a. To invest, email us at sales@cytonn.com and to withdraw the interest, dial *809# or download the Cytonn App from Google Playstore here or from the Appstore here;
- During the week, Kevin Karobia, an Investment Analyst at Cytonn was on Look Up TV for a discussion on the outlook of the NSE after the presidential election. To listen to the conversation, click here;
- We continue to offer Wealth Management Training every Wednesday and every third Saturday of the month, from 9:00 am to 11:00 am, through our Cytonn Foundation. The training aims to grow financial literacy among the general public. To register for any of our Wealth Management Trainings, click here;
- If interested in our Private Wealth Management Training for your employees or investment group, please get in touch with us through wmt@cytonn.com;
- Any CHYS and CPN investors still looking to convert are welcome to consider one of the five projects currently available for assignment, click here for the latest term sheet;
- Cytonn Insurance Agency acts as an intermediary for those looking to secure their assets and loved ones’ future through insurance namely; Motor, Medical, Life, Property, WIBA, Credit and Fire and Burglary insurance covers. For assistance, get in touch with us through insuranceagency@cytonn.com;
- Cytonnaire Savings and Credit Co-operative Society Limited (SACCO) provides a savings and investments avenue to help you in your financial planning journey. To enjoy competitive investment returns, kindly get in touch with us through clientservices@cytonn.com;
Real Estate Updates:
- For an exclusive tour of Cytonn’s real estate developments, visit: Sharp Investor's Tour, and for more information, email us at sales@cytonn.com;
- Phase 3 of The Alma is now ready for occupation and the show house is open daily. To rent please email properties@cytonn.com;
- We have 8 investment-ready projects, offering attractive development and buyer targeted returns; See further details here: Summary of Investment-ready Projects;
- For Third Party Real Estate Consultancy Services, email us at rdo@cytonn.com;
- For recent news about the group, see our news section here;
Hospitality Updates:
- We currently have promotions for Staycations. Visit cysuites.com/offers for details or email us at sales@cysuites.com;
Money Markets, T-Bills Primary Auction:
During the week, T-bills remained undersubscribed, with the overall subscription rate coming in at 82.1%, up from the 72.4% recorded the previous week. The increase in the subscription rate was partly attributable to the relatively eased liquidity in the money market as well as the prevailing high yields on the government securities. Investors’ preference for the shorter 91-day paper persisted, with the paper receiving bids worth Kshs 11.8 bn against the offered Kshs 4.0 bn, translating to a subscription rate of 294.3%, down from the 299.8% recorded the previous week. The subscription rate for the 182-day paper increased to 68.0% from 39.3% while that of the 364-day paper declined to 11.4% from 14.5% recorded the previous week. The yields on the government papers recorded mixed performance with the yields on the 182-day and 91-day papers increasing by 5.9 bps and 10.4 bps to 9.5% and 8.7%, respectively, while the yields on the 364-day paper declined by 1.3 bps to 9.9%. The government accepted a total of Kshs 19.7 bn worth of bids, translating to an acceptance rate of 99.9%.
In the Primary Bond Market, the Central Bank of Kenya released results for the recently re-opened bonds; FXD1/2022/03, FXD2/2019/10 and FXD1/2021/20 with effective tenors of 2.7 years, 6.7 years and 19.1 years and coupon rates of 11.8%, 12.3% and 13.4%, respectively. In line with our expectations, the bonds recorded an undersubscription of 98.3%, partly attributable to investors’ preference for the shorter dated papers as they sought to avoid duration risks and partly due to the tightened liquidity during the period of issue. The government issued the bonds seeking to raise Kshs 50.0 bn for budgetary support, received bids worth Kshs 49.1 bn and accepted bids worth Kshs 38.5 bn, translating to a 78.4% acceptance rate. The weighted average yields for the three bonds were 12.4% for FXD1/2022/03, 13.9% for FXD2/2019/10 and 14.0% for FXD1/2021/20.
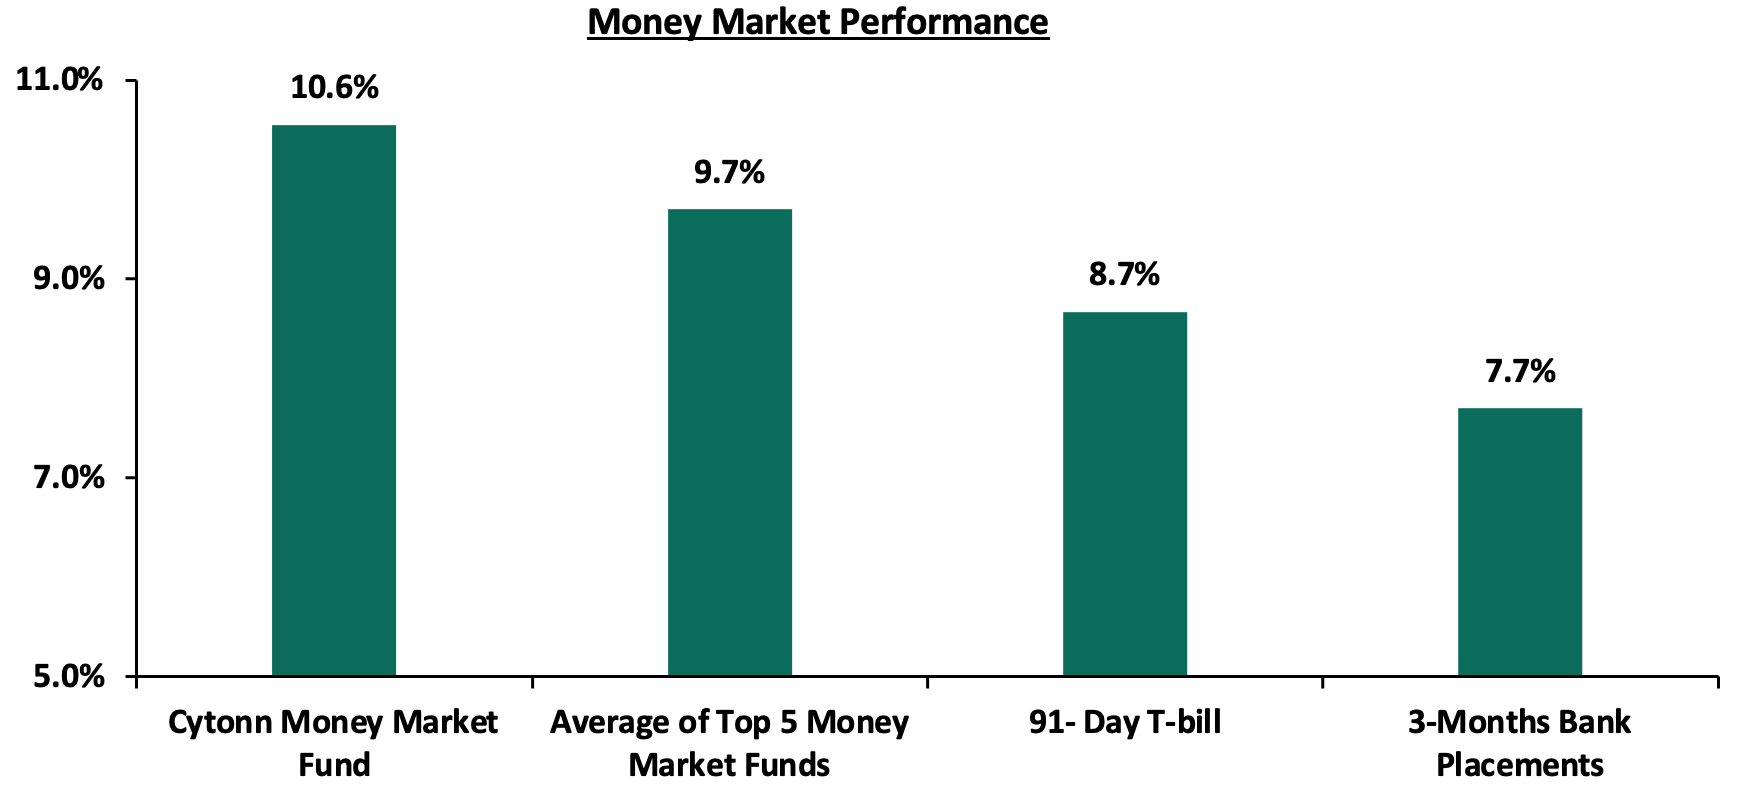
In the money markets, 3-month bank placements ended the week at 7.7% (based on what we have been offered by various banks), while the yield on the 91-day T-bill increased by 10.4 bps to 8.7%. The average yield of the Top 5 Money Market Funds and the Cytonn Money Market Fund remained relatively unchanged at 9.7% and 10.6% respectively, as was recorded last week. The table below shows the Money Market Fund Yields for Kenyan Fund Managers as published on 19th August 2022:
|
Money Market Fund Yield for Fund Managers as published on 19th August 2022 |
||
|
Rank |
Fund Manager |
Effective Annual Rate |
|
1 |
Cytonn Money Market Fund |
10.6% |
|
2 |
Zimele Money Market Fund |
9.9% |
|
3 |
Sanlam Money Market Fund |
9.6% |
|
4 |
Old Mutual Money Market Fund |
9.3% |
|
5 |
Apollo Money Market Fund |
9.2% |
|
6 |
Nabo Africa Money Market Fund |
9.2% |
|
7 |
Dry Associates Money Market Fund |
9.2% |
|
8 |
Madison Money Market Fund |
9.1% |
|
9 |
NCBA Money Market Fund |
9.1% |
|
10 |
CIC Money Market Fund |
9.0% |
|
11 |
Co-op Money Market Fund |
8.9% |
|
12 |
GenCap Hela Imara Money Market Fund |
8.9% |
|
13 |
ICEA Lion Money Market Fund |
8.6% |
|
14 |
Orient Kasha Money Market Fund |
8.4% |
|
15 |
AA Kenya Shillings Fund |
7.7% |
|
16 |
British-American Money Market Fund |
7.4% |
Source: Business Daily
Liquidity:
During the week, liquidity in the money markets relatively eased, with the average interbank rate declining to 5.56% from 5.61% recorded the previous week, partly attributable to government payments that offset tax remittances. The average interbank volumes traded declined by 13.9% to Kshs 22.3 bn from Kshs 25.9 bn recorded the previous week.
Kenya Eurobonds:
During the week, the yields on all Eurobonds were on an upward trajectory, partly attributable to investors heightened perceived risks arising from increasing inflationary pressures and the persistent local currency depreciation. Yields on the 10-year Eurobond issued in 2014 recorded the highest increase of 2.8% points to 14.7% from 11.9%, recorded the previous week. The table below shows the summary of the performance of the Kenyan Eurobonds as of 18th August 2022;
|
Kenya Eurobonds Performance |
||||||
|
|
2014 |
2018 |
2019 |
2021 |
||
|
Date |
10-year issue |
10-year issue |
30-year issue |
7-year issue |
12-year issue |
12-year issue |
|
3-Jan-22 |
4.4% |
8.1% |
8.1% |
5.6% |
6.7% |
6.6% |
|
29-Jul-22 |
16.2% |
14.9% |
13.3% |
16.3% |
14.0% |
13.3% |
|
12-Aug-22 |
11.9% |
11.8% |
11.2% |
12.5% |
11.5% |
10.2% |
|
15-Aug-22 |
12.2% |
12.1% |
11.3% |
12.6% |
11.7% |
10.3% |
|
16-Aug-22 |
14.6% |
12.4% |
11.7% |
13.3% |
12.3% |
10.8% |
|
17-Aug-22 |
14.8% |
12.5% |
11.7% |
13.7% |
12.4% |
10.9% |
|
18-Aug-22 |
14.7% |
12.8% |
11.9% |
14.1% |
12.6% |
10.8% |
|
Weekly Change |
2.8% |
1.0% |
0.7% |
1.6% |
1.1% |
0.6% |
|
MTD Change |
(1.5%) |
(2.1%) |
(1.4%) |
(2.2%) |
(1.4%) |
(2.5%) |
|
YTD Change |
10.3% |
4.7% |
3.8% |
8.5% |
5.9% |
4.2% |
Source: Central Bank of Kenya (CBK)
Kenya Shilling:
During the week, the Kenyan shilling continued to depreciate against the US dollar to close the week at Kshs 119.6, a 0.2% depreciation from Kshs 119.3 recorded the previous week, partly attributable to increased dollar demand from the oil and energy sectors against a slower supply of hard currency. On a year to date basis, the shilling has depreciated by 5.7% against the dollar, higher than the 3.6% depreciation recorded in 2021. We expect the shilling to remain under pressure in 2022 as a result of:
- High global crude oil prices on the back of persistent supply chain bottlenecks coupled with high demand as most economies gradually recover,
- Increased demand from merchandise traders as they beef up their hard currency positions in anticipation for increased demand as economies pick up,
- An ever-present current account deficit due to an imbalance between imports and exports, with Kenya’s current account deficit estimated at 5.3% of GDP in the 12 months to May 2022 compared to the 5.0% within a similar period in 2021. The wider deficit reflects a higher import bill, particularly for petroleum products, with the imports for Q1’2022 increasing by 14.5%, 5.7% points higher than the 8.8% increase in exports, and,
- The aggressively growing government debt, with Kenya’s public debt having increased at a 10-year CAGR of 18.2% to Kshs 8.6 tn in May 2022, from Kshs 1.6 tn in May 2012 thus putting pressure on forex reserves to service some of the public debt. It is worth noting that the average GDP growth over the same period has been 3.9%, indicating that the increase in debt is not translating into GDP growth.
The shilling is however expected to be supported by:
- Sufficient Forex reserves currently at USD 7.6 bn (equivalent to 4.4-months of import cover), which is above the statutory requirement of maintaining at least 4.0-months of import cover, and the EAC region’s convergence criteria of 4.5-months of import cover. In addition, the reserves were boosted by the USD 750.0 mn World Bank loan facility received in March 2022 and are expected to be boosted further by the USD 235.6 mn funding from the International Monetary Fund (IMF), and,
- Sufficient diaspora remittances which stood at USD 319.4 mn as of July 2022, which have continued to cushion the shilling against a faster depreciation. Notably, US remains the largest source of remittances to Kenya accounting for 58.0% in the period as of July 2022.
Weekly Highlights:
- Fuel Prices
During the week, the Energy and Petroleum Regulatory Authority (EPRA) released their monthly statement on the maximum retail fuel prices in Kenya effective 15th August 2022 to 14th September 2022. Notably, fuel prices remained unchanged at Kshs 159.1 per litre for Super Petrol, Kshs 140.0 per litre for Diesel and Kshs 127.9 per litre for Kerosene. The performance was attributable to:
- The fuel subsidy program under the Petroleum Development Levy which resulted in subsidies of Kshs 54.9 on Super Petrol, Kshs 66.2 on Diesel and Kshs 74.2 on Kerosene during the month, and,
- Removal of suppliers margins of Kshs 6.3 on Super Petrol, Kshs 5.5 on Diesel and Kshs 7.7 on Kerosene since October 2021.
The performance was despite;
- The increase in the average landed costs of Super Petrol, Diesel and Kerosene by 3.0%, 8.2% and 14.9% to USD 1074.0 per cubic meter, USD 1103.0 per cubic meter, and USD 1,111.5 in July 2022, from USD 1,042.9 per cubic meter, USD 1019.3 per cubic meter, and USD 967.4 per cubic meter in June 2022,
- The 5.0% increase in the Free on Board (FOB) price of Murban crude oil to USD 109.7 per barrel, from USD 104.5 per barrel in June 2022, and,
- The Kenyan shilling continued depreciation having declined by 1.2% to Kshs 119.9 in July 2022, from Kshs 118.5 in June 2022.
Despite the performance, global fuel prices have remained high since the beginning of the year, having recorded a 26.1% year to date gain to USD 98.2 per barrel as of 18th August 2022, from USD 77.9 per barrel recorded on 3rd January 2022. The increase is mainly driven by persistent supply chain constraints against an increasing demand as economies continue to normalize. However, Kenyans have continued to get cushioned against the elevated fuel price, owing to the National Treasury's fuel subsidy program, which we believe is unsustainable given the continued increase in the landed cost of fuel. As such, we expect the government to gradually eliminate the programme and adjust the domestic fuel prices to ease the pressure on expenditure and consequently reduce the need for excessive borrowing. We also expect the cost of living to remain elevated given that fuel is a major contributor to Kenya’s headline inflation it’s a major input cost in majority of Kenya’s sectors such as manufacturing, transport and energy. Consequently, the business environment is expected to remain unfavourable because of a diminishing consumer purchasing power.
- Revenue and Net Exchequer for FY’2022/2023
The National Treasury gazetted the revenue and net expenditures for the first month of FY’2022/2023, ending 29th July 2022. Below is a summary of the performance:
|
FY'2022/2023 Budget Outturn - As at 29th July 2022 |
|||||
|
Amounts in Kshs billions unless stated otherwise |
|||||
|
Item |
12-months Original Estimates |
Actual Receipts/Release |
Percentage Achieved |
Prorated |
% achieved of prorated |
|
Opening Balance |
0.6 |
||||
|
Tax Revenue |
2,071.9 |
130.6 |
6.3% |
172.7 |
75.6% |
|
Non-Tax Revenue |
69.7 |
1.9 |
2.8% |
5.8 |
33.6% |
|
Total Revenue |
2,141.6 |
133.2 |
6.2% |
178.5 |
74.6% |
|
External Loans & Grants |
349.3 |
27.9 |
8.0% |
29.1 |
95.7% |
|
Domestic Borrowings |
1,040.5 |
15.6 |
1.5% |
86.7 |
18.0% |
|
Other Domestic Financing |
13.2 |
2.8 |
21.0% |
1.1 |
251.5% |
|
Total Financing |
1,403.0 |
46.2 |
3.3% |
116.9 |
39.5% |
|
Recurrent Exchequer issues |
1,178.4 |
66.8 |
5.7% |
98.2 |
68.0% |
|
CFS Exchequer Issues |
1,571.8 |
89.5 |
5.7% |
131.0 |
68.4% |
|
Development Expenditure & Net Lending |
424.4 |
0.0 |
0.0% |
35.4 |
0.0% |
|
County Governments + Contingencies |
370.0 |
23.0 |
6.2% |
30.8 |
74.6% |
|
Total Expenditure |
3,544.6 |
179.3 |
5.1% |
295.4 |
60.7% |
|
Total Borrowing |
1,389.8 |
43.5 |
3.1% |
115.8 |
37.5% |
The Key take-outs from the release include;
- Total revenue collected as at the end of July 2022 amounted to Kshs 133.2 bn, equivalent to 6.2% of the original estimates of Kshs 2,141.6 bn for FY’2022/2023 and is 74.6% of the prorated estimates of Kshs 178.5 bn. The performance is attributable to the deterioration of the business environment seen during the month of July as evidenced by the decline in the purchasing managers index (PMI) to 46.3, from 46.8 that was recorded in July 2022. Cumulatively, tax revenues amounted to Kshs 130.6 bn, equivalent to 6.3% of the original estimates of Kshs 2,071.9 bn and 75.6% of the prorated estimates of Kshs 172.7 bn,
- Total financing amounted to Kshs 46.2 bn, equivalent to 3.3% of the original estimates of Kshs 1,403.0 bn and is equivalent to 39.5% of the prorated estimates of Kshs 116.9 bn. Additionally, domestic borrowing amounted to Kshs 15.6 bn, equivalent to 1.5% of the original estimates of Kshs 1,040.5 bn and is 18.0% of the prorated estimates of Kshs 86.7 bn,
- The total expenditure amounted to Kshs 179.3 bn, equivalent to 5.1% of the original estimates of Kshs 3,544.6 bn, and is 60.7% of the prorated target expenditure estimates of Kshs 295.4 bn. Additionally, the net disbursements to recurrent expenditures came in at Kshs 66.8 bn, equivalent to 5.7% of the original estimates and 68.0% of the prorated estimates of Kshs 98.2 bn. We note that the absorption rate is very slow with the main culprit being the development expenditure which recorded no activity during the period,
- Consolidated Fund Services (CFS) Exchequer issues came in at Kshs 89.5 bn, equivalent to 5.7% of the original estimates of Kshs 1,571.8 bn, and are 68.4% of the prorated amount of Kshs 131.0 bn. The cumulative public debt servicing cost amounted to Kshs 84.0 bn which is 6.0% of the original estimates of Kshs 1,393.1 bn, and is 72.3% of the prorated estimates of Kshs 116.1 bn. Additionally, the Kshs 84.0 bn debt servicing cost is equivalent to 11.2% of the actual revenues collected as at the end of July 2022, and,
- Total Borrowings as at the end of July 2022 amounted to Kshs 43.5 bn, equivalent to 3.1% of the original estimates of Kshs 1,389.8 bn for FY’2022/2023 and are 37.5% of the prorated estimates of Kshs 115.8 bn. The cumulative domestic borrowing target of Kshs 1,040.5 bn comprises of adjusted Net domestic borrowings of Kshs 579.1 bn and Internal Debt Redemptions (Roll-overs) of Kshs 461.4 bn.
As expected, the revenue performance for the first month of the FY’2022/2023 is not plausible mainly due to the economic uncertainties that emanated from the elevated inflationary pressures as well as the heated political environment. The slow-down in economic environment was evidenced by the decline in the July PMI to 46.3, from 46.8 in June 2022 and is expected to remain subdued in the short term as consumers continue to cut on spending. As such, we believe that the performance of revenue collection in the coming months will be largely determined by how soon the country’s business environment stabilizes and how fast the incoming regime implements its economic growth related initiatives. However, risks lie on the downside given the high global commodity prices which continue to weigh on the economy.
Rates in the Fixed Income market have remained relatively high due to the relatively heightened perceived risk by investors. As it is still early in the financial year, the government is 43.1% behind its prorated borrowing target of Kshs 79.9 bn having borrowed Kshs 45.5 bn of the Kshs 581.7 bn borrowing target for the FY’2022/2023. We expect sustained gradual economic recovery as evidenced by the revenue collections of Kshs 2.0 tn in the FY’2021/2022, equivalent to a 2.8% outperformance. Despite the performance, we believe that the projected budget deficit of 6.2% for the FY’2022/2023 is relatively ambitious given the downside risks and deteriorating business environment occasioned by high inflationary pressures. We however expect the support from the IMF and World Bank to finance some of the government projects and thus help maintain a stable interest rate environment since the government is not desperate for cash. Owing to this, our view is that investors should be biased towards short-term fixed-income securities to reduce duration risk.
Markets Performance
During the week, the equities market was on a downward trajectory with NASI, NSE 20 and NSE 25 declining by 0.4%, 1.1% and 1.0%, respectively, taking their YTD performance to losses of 12.4%, 7.1% and 9.9%, for NASI, NSE 20 and NSE 25, respectively. The equities market performance was mainly driven by losses recorded by large-cap stocks such as Equity Group, EABL, Co-operative Bank, NCBA Bank and BAT of 5.0%, 2.2%, 1.6%, 1.5% and 1.0%, respectively. The losses were however mitigated by gains recorded by stocks such as ABSA, Bamburi, KCB Group and Safaricom of 2.9%, 2.1%, 0.5% and 0.3% respectively.
During the week, equities turnover declined by 1.2% to USD 9.0 mn, from USD 9.1 mn recorded the previous week, taking the YTD turnover to USD 565.3 mn. Additionally, foreign investors turned net buyers, with a net buying position of USD 0.2 mn, from a net selling position of USD 4.1 mn recorded the previous week, taking the YTD net selling position to USD 139.2 mn.
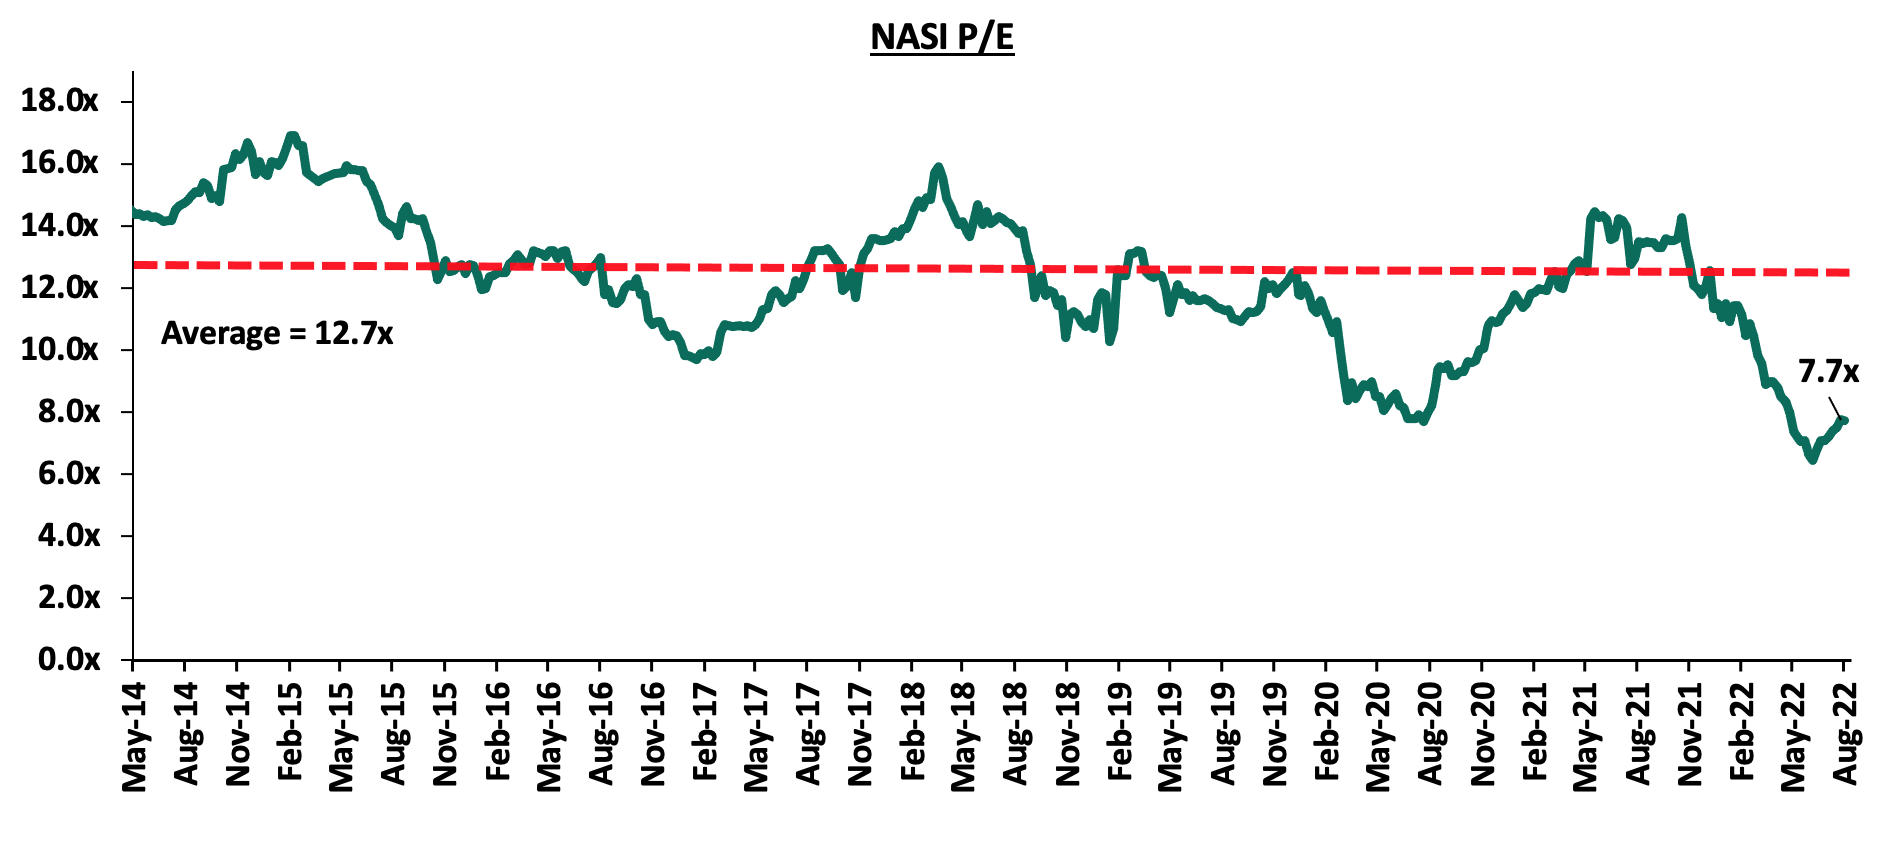
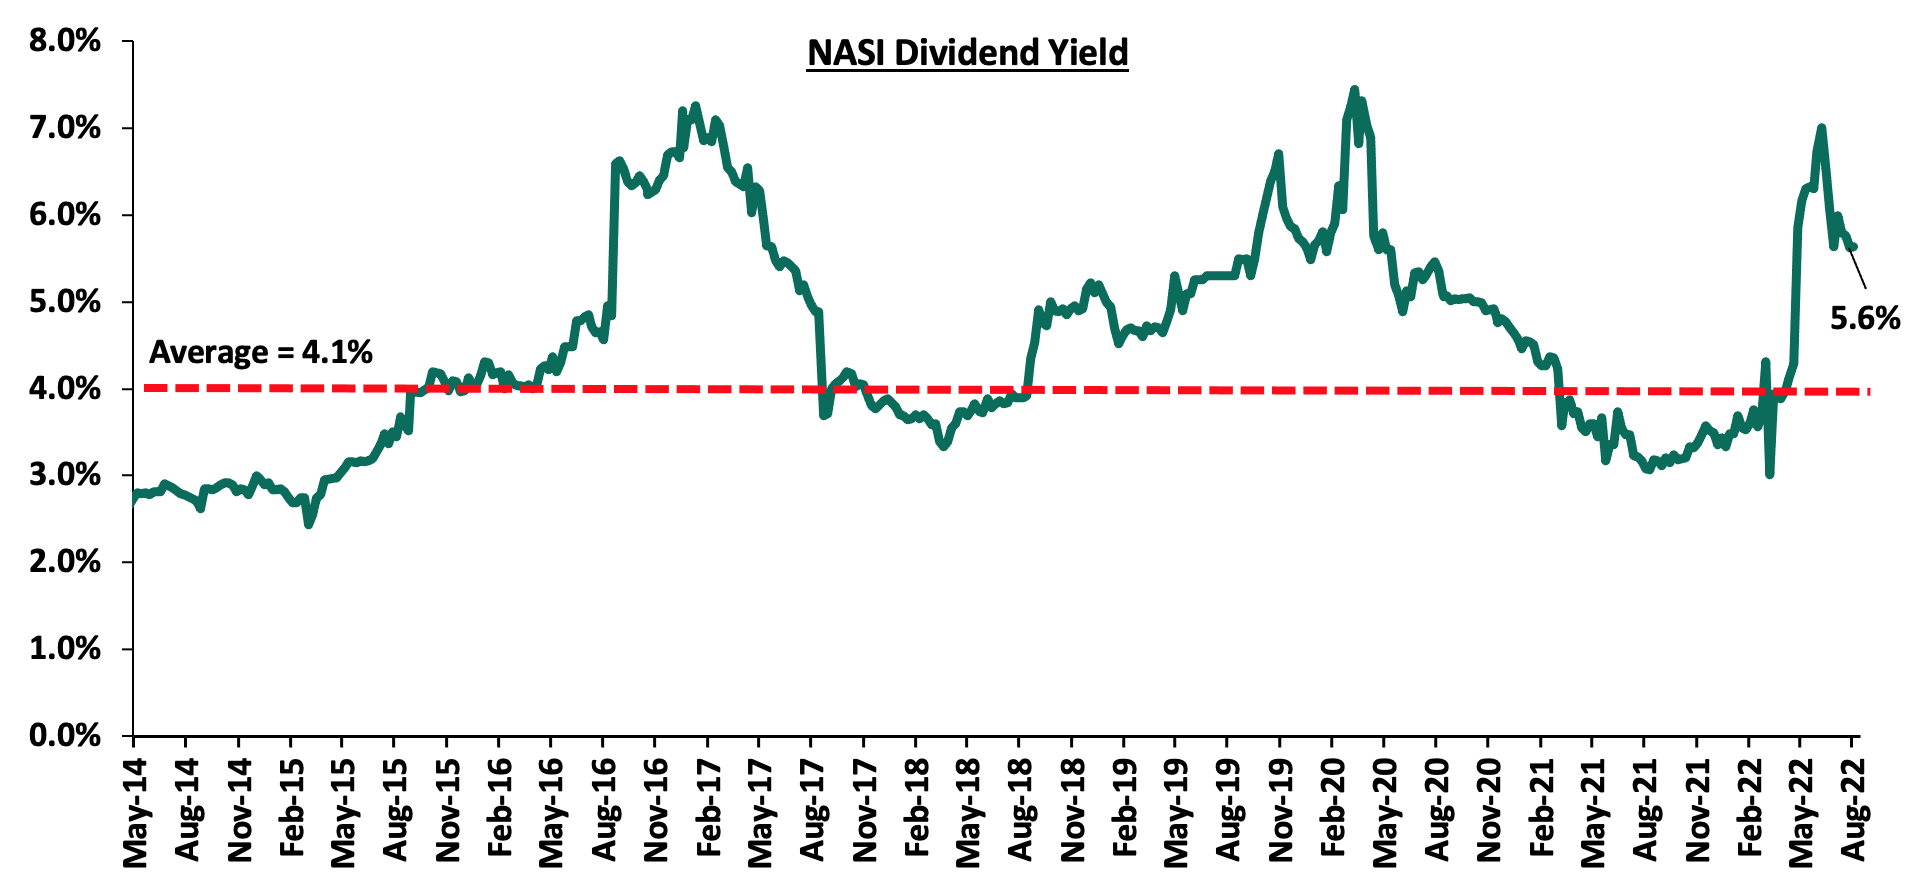
The market is currently trading at a price to earnings ratio (P/E) of 7.7x, 39.2% below the historical average of 12.7x, and a dividend yield of 5.6%, 1.5% points above the historical average of 4.1%. Key to note, NASI’s PEG ratio currently stands at 1.0x, an indication that the market is fairly valued relative to its future growth. A PEG ratio greater than 1.0x indicates the market may be overvalued while a PEG ratio less than 1.0x indicates that the market is undervalued. The charts below indicate the historical P/E and dividend yields of the market:
Weekly Highlight:
Earnings Release
During the week, the Standard Chartered Bank of Kenya Plc, Stanbic Holdings and I&M Holdings released their H1’2022 financial results. Below is a summary of their performance;
- Standard Chartered Bank of Kenya Plc
|
Balance Sheet Items (Kshs bn) |
H1’2021 |
H1’2022 |
y/y change |
|
Net loans |
130.3 |
128.5 |
(1.3%) |
|
Government Securities |
101.4 |
103.6 |
2.1% |
|
Total Assets |
345.6 |
364.3 |
5.4% |
|
Customer Deposits |
278.2 |
286.9 |
3.1% |
|
Deposits per Branch |
11.1 |
13.0 |
17.2% |
|
Total Liabilities |
293.9 |
307.9 |
4.7% |
|
Shareholder's Funds |
51.7 |
56.4 |
9.1% |
|
Balance sheet ratios |
H1'2021 |
H1'2022 |
y/y change |
|
Loan to Deposit Ratio |
46.8% |
44.8% |
(2.0%) |
|
Return on average equity |
13.7% |
17.7% |
4.0% |
|
Return on average assets |
2.1% |
2.7% |
0.6% |
|
Income Statement (Kshs bn) |
H1'2021 |
H1'2022 |
y/y change |
|
Net Interest Income |
9.1 |
10.0 |
9.9% |
|
Net non-Interest Income |
5.0 |
5.5 |
10.9% |
|
Total Operating income |
14.1 |
15.6 |
10.2% |
|
Loan Loss provision |
0.6 |
0.1 |
(83.1%) |
|
Total Operating expenses |
7.3 |
8.0 |
9.2% |
|
Profit before tax |
6.8 |
7.6 |
11.4% |
|
Profit after tax |
4.9 |
5.4 |
10.9% |
|
Core EPS |
12.9 |
14.3 |
10.9% |
|
Income Statement Ratios |
H1'2021 |
H1'2022 |
y/y change |
|
Yield from interest-earning assets |
7.7% |
7.3% |
(0.4%) |
|
Cost of funding |
1.5% |
1.1% |
(0.4%) |
|
Net Interest Spread |
6.3% |
6.3% |
0.0% |
|
Net Interest Margin |
6.4% |
6.4% |
0.0% |
|
Cost of Risk |
4.5% |
0.7% |
(3.8%) |
|
Net Interest Income as % of operating income |
64.6% |
64.4% |
(0.2%) |
|
Non-Funded Income as a % of operating income |
35.0% |
36.0% |
1.0% |
|
Cost to Income Ratio |
51.8% |
51.3% |
(0.5%) |
|
Cost to Income Ratio without LLP |
47.3% |
50.6% |
3.3% |
|
Cost to Assets |
2.0% |
2.2% |
0.2% |
|
Capital Adequacy Ratios |
H1'2021 |
H1'2022 |
% Change |
|
Core Capital/Total Liabilities |
15.1% |
14.6% |
(0.6%) |
|
Minimum Statutory ratio |
8.0% |
8.0% |
0.0% |
|
Excess |
7.1% |
6.6% |
(0.6%) |
|
Core Capital/Total Risk Weighted Assets |
15.9% |
15.4% |
(0.5%) |
|
Minimum Statutory ratio |
10.5% |
10.5% |
0.0% |
|
Excess |
5.4% |
4.9% |
(0.5%) |
|
Total Capital/Total Risk Weighted Assets |
18.3% |
17.7% |
(0.5%) |
|
Minimum Statutory ratio |
14.5% |
14.5% |
0.0% |
|
Excess |
3.8% |
3.2% |
(0.5%) |
|
Liquidity Ratio |
70.1% |
73.6% |
3.6% |
|
Minimum Statutory ratio |
20.0% |
20.0% |
0.0% |
|
Excess |
50.1% |
53.6% |
3.6% |
|
Adjusted Core Capital/Total Liabilities |
15.2% |
14.6% |
(0.6%) |
|
Adjusted Core Capital/Total RWA |
15.9% |
15.5% |
(0.4%) |
|
Adjusted Total Capital/Total RWA |
18.3% |
17.8% |
(0.5%) |
Key take-outs from the earnings release include;
- Core earnings per share increased by 10.9% to Kshs 14.3, from Kshs 12.9 recorded in H1’2021, lower than our projections of a 19.8% increase to Kshs 15.5, with the variance stemming from a faster increase in operating expenses. The performance was driven by a 10.2% increase in total operating income to Kshs 15.6 bn, from Kshs 14.1 bn recorded in H1’2021. However, the increase was weighed down by an 9.2% increase in total operating expenses to Kshs 8.0 bn, from Kshs 7.3 bn recorded in H1’2021,
- Total operating income rose by 10.2% to Kshs 15.6 bn, from Kshs 14.1 bn recorded in H1’2021 driven by a 9.9% growth in Net Interest Income (NII) to Kshs 10.0 bn, from Kshs 9.1 bn in H1’2021 coupled with a 10.9% gain in Non - Funded Income (NFI) to Kshs 5.5 bn, from Kshs 5.0 bn in H1’2021,
- Interest income increased by 4.4% to Kshs 11.5 bn, from Kshs 11.0 bn in H1’2021, driven by a 4.9% increase in interest income from Loans & Advances to Kshs 6.0 bn, from Kshs 5.7 bn in H1’2021, coupled with a 0% increase in interest income from Government Securities to Kshs 4.8 bn in H1’2022, from Kshs 4.6 bn in H1’2021. Interest income from placements in other banks also increased by 3.3% to Kshs 744.0 mn, from 720.5 mn in H1’2021. The Yield on Interest-Earning Assets (YIEA) declined to 7.3%, from 7.7% in H1’2021, attributable to a 0.3% decline in the trailing interest income, coupled with a 5.2% increase in the average interest earning assets. Trailing Interest Income refers to the performance of the interest income for the past 12 consecutive months,
- Interest expense declined by 21.4% to Kshs 1.5 bn, from Kshs 1.9 bn in H1’2021, following a 22.9% decline in interest expense on customer deposits to Kshs 1.3 bn, from Kshs 1.7 bn in H1’2021 coupled with a 5.3% decline in other interest expenses to Kshs 132.9 mn from Kshs 140.3 mn in H1’2021. The bank was able to mobilize cheaper deposits with the Cost of funding declining by 0.4% points to 1.1%, from 1.5% in H1’2021, owing to the 23.3% decline in trailing interest expense coupled with the 5.3% increase in the average interest-bearing liabilities. Trailing interest expense refers to the performance of the interest expense for the past 12 consecutive months. Net Interest Margin (NIM) marginally declined to 6.35%, from 6.39% in H1’2021 attributable to the faster 5.2% growth in average interest-earning assets compared to the 4.6% gain in the trailing Net Interest Income (NII) compared,
- Non-Funded Income (NFI) increased by 10.9% to Kshs 5.5 bn, from Kshs 5.0 bn in H1’2021, mainly driven by a 33.6% rise in Foreign Exchange Trading income to Kshs 2.3 bn in H1’2022, from Kshs 1.7 bn in H1’2021, given the continued depreciation of the Kenyan shilling. However, the performance was weighed down by a 6.1% decrease in income from other Fees and Commissions to Kshs 2.4 bn, from Kshs 2.6 bn in H1’2021. Similarly, the bank’s total fees and commissions declined by 6.2% to Kshs 2.5 bn, from Kshs 2.7 bn in H1’2021. As a result, the revenue mix shifted to 64:36 from 65:35 in H1’2021, funded to non-funded income, owing to the slower 9.9% increase in Net Interest Income (NII), compared to a 10.9% increase in Non - Funded Income (NFI),
- Total operating expenses increased by 9.2% to Kshs 8.0 bn in H1’2022, from Kshs 7.3 bn in H1’2021, mainly attributable to an 11.5% increase in staff costs to Kshs 3.6 bn, from Kshs 3.2 bn recorded in H1’2021 coupled with an 24.1% increase in other operating expenses to Kshs 4.3 bn from Kshs 3.5 bn in H1’2021. However, Loan Loss Provisions(LLPs) have continued to decline having reduced by 83.1% to Kshs 108.2 mn in H1’2022, from Kshs 638.5 mn in H1’2021 as uncertainty in the business environment continues to ease,
- Cost to Income Ratio (CIR) marginally improved to 51.3%, from 51.8% in H1’2021 owing to 10.2% increase in total operating income to Kshs 15.6 bn from Kshs 14.1 bn in H1’2021 which outpaced the 9.2% increase in total operating expenses to Kshs 8.0 bn from Kshs 7.3 bn in H1’2021. Without LLP, Cost to Income ratio deteriorated to 50.6%, from 47.3% in H1’2021, an indication of reduced efficiency levels, and,
- Profit before tax increased by 11.4% to Kshs 7.6 bn, from Kshs 6.8 bn in H1’2021. Profit after tax increased by 10.9% to Kshs 5.4 bn in H1’2022, from Kshs 4.9 bn recorded in H1’2021 with the effective tax rate remaining unchanged at 29.6%.
- The balance sheet recorded an expansion as total assets grew by 5.4% to Kshs 364.3 bn in H1’2022, from Kshs 345.6 bn in H1’2021, largely driven by a 2.1% increase in investments in government and other securities to Kshs 103.6 bn, from Kshs 101.4 bn in H1’2021. Additionally, there was a 20.1% increase in placements to Kshs 85.1 bn, from Kshs 70.9 bn in H1’2022. The loan book however, declined by 1.3% to Kshs 128.5 bn, from Kshs 130.3 bn recorded in H1’2021, partly attributable to the bank’s cautious lending owing to the relatively high non-performing loans,
- Total liabilities increased by 4.7% to Kshs 307.9 bn, from Kshs 293.9 bn in H1’2021 driven by a 3.1% decline in customer deposits to Kshs 286.9 bn, from Kshs 278.2 bn in H1’2021. Deposits per branch rose by 17.2% to Kshs 13.0 bn, from Kshs 11.1 bn in H1’2021 with the number of branches reducing to 22 from 25 in H1’2021. The reduced number of branches was part of the Bank’s strategy in cost cutting as it focuses on digitization,
- The Loan to deposits ratio declined by 2.0% to 44.8% in H1’2022 from 46.8% recorded in H1’2021 attributable to the 1.3% decrease in net loans,
- Gross Non-Performing Loans (NPLs) declined by 0.5% to Kshs 22.7 bn in H1’2022, from Kshs 22.9 bn recorded in H1’2021 owing to the gradual recovery of the economic environment. The NPL ratio however increased marginally to 15.41%, from 15.36% recorded in H1’2021, attributable to the faster decline in Gross loans, as compared to the decline in Gross Non-Performing Loans (NPLs),
- General Loan Loss Provisions increased by 9.7% to Kshs 9.9 bn, from Kshs 9.0 bn in H1’2021. Consequently, the NPL coverage increased to 83.9%, from 81.4% in H1’2021, as the provisions (after adding back interest suspense) increased by 2.5% in H1’2022 compared to the 0.5% decline in the Gross Non-Performing Loans during the same period. The increase in the NPL Coverage indicates sufficient provisioning,
- Shareholders’ funds increased by 9.1% to Kshs 56.4 bn, from Kshs 51.7 bn recorded in H1’2021, mainly attributable to the 4.4% increase in retained earnings to Kshs 36.8 bn, from Kshs 35.2 bn in H1’2021,
- Standard Chartered is currently sufficiently capitalized with a core capital to risk-weighted assets ratio of 15.4%, 4.9% points above the statutory requirement of 10.5%. In addition, the total capital to risk-weighted assets ratio was 17.7%, exceeding the statutory requirement of 14.5% by 3.2% points. Adjusting for IFRS 9, the core capital to risk-weighted assets stood at 15.5% while total capital to risk-weighted assets came in at 17.8%, and,
- The bank currently has a Return on Average Assets (ROaA) of 2.7%, and a Return on Average Equity (ROaE) of 17.7%.
For a comprehensive analysis, please see our Standard Chartered Bank of Kenya Plc’s H1’2022 Earnings Note
- Stanbic Holdings
|
Balance Sheet |
H1'2021 |
H1'2022 |
y/y change |
|
Net Loans |
207.6 |
244.0 |
17.5% |
|
Total Assets |
329.5 |
341.6 |
3.7% |
|
Deposits |
260.0 |
258.2 |
(0.7%) |
|
Liabilities |
276.0 |
283.4 |
2.7% |
|
Shareholders' Funds |
53.5 |
58.2 |
8.8% |
|
Balance sheet ratios |
H1'2021 |
H1'2022 |
% point change |
|
Loan to Deposit ratio |
79.9% |
94.5% |
14.6% |
|
Return on average equity |
17.6% |
20.1% |
2.5% |
|
Return on average assets |
2.8% |
3.3% |
0.5% |
|
Income Statement (Kshs bns) |
H1'2021 |
H1'2022 |
y/y change |
|
Net interest Income |
6.9 |
8.3 |
20.9% |
|
Net non-interest income |
5.5 |
6.9 |
25.1% |
|
Total Operating income |
12.4 |
15.2 |
22.8% |
|
Loan loss provision |
(1.5) |
(1.3) |
(16.1%) |
|
Total Operating expenses |
(7.6) |
(8.6) |
13.7% |
|
Profit before tax |
4.8 |
6.6 |
37.1% |
|
Profit after tax |
3.5 |
4.8 |
36.9% |
|
Income Statement Ratios |
H1'2021 |
H1'2022 |
y/y change |
|
Yield from interest-earning assets |
3.2% |
3.8% |
0.6% |
|
Cost of funding |
2.6% |
2.3% |
(0.3%) |
|
Net Interest Margin |
4.4% |
5.4% |
1.0% |
|
Net Interest Income as % of operating income |
55.7% |
54.9% |
(0.8%) |
|
Non-Funded Income as a % of operating income |
44.3% |
45.1% |
0.8% |
|
Cost to Income Ratio |
48.9% |
48.2% |
(0.7%) |
|
Cost to Income Ratio without LLP |
36.8% |
40.0% |
3.2% |
|
Capital Adequacy Ratios |
H1’2021 |
H1’2022 |
|
Core Capital/Total Liabilities |
18.2% |
18.1% |
|
Minimum Statutory ratio |
8.0% |
8.0% |
|
Excess |
10.2% |
10.1% |
|
Core Capital/Total Risk Weighted Assets |
16.1% |
14.0% |
|
Minimum Statutory ratio |
10.5% |
10.5% |
|
Excess |
5.6% |
3.5% |
|
Total Capital/Total Risk Weighted Assets |
18.1% |
16.2% |
|
Minimum Statutory ratio |
14.5% |
14.5% |
|
Excess |
3.6% |
1.7% |
|
Liquidity Ratio |
53.3% |
35.9% |
|
Minimum Statutory ratio |
20.0% |
20.0% |
|
Excess |
33.3% |
15.9% |
|
Adjusted Core Capital/Total Deposit Liabilities |
18.4% |
18.1% |
|
Adjusted Core Capital/Total Risk Weighted Assets |
15.9% |
14.0% |
|
Adjusted Total Capital/Total Risk Weighted Assets |
18.0% |
16.2% |
Key take-outs from the earnings release include;
- Profit after tax increased by 36.9% to Kshs 4.8 bn in H1’2022, from Kshs 3.5 bn in H1’2021. The performance was driven by a 22.8% increase in total operating income to Kshs 15.2 bn in H1’2022, from Kshs 12.4 bn in H1’2021. The increase was however weighed down by the 13.7% increase in total operating expenses to Kshs 8.6 bn, from Kshs 7.6 bn in H1’2021,
- The 22.8% increase in total operating income to Kshs 15.2 bn in H1’2022 from Kshs 12.4 bn in H1’2021 was mainly driven by a 20.9% increase in Net-Interest Income (NII) to Kshs 8.3 bn, from Kshs 6.9 bn in H1’2021, coupled with a 25.9% increase in Non-Funded Income (NFI) to Kshs 6.9 bn, from Kshs 5.5 bn in H1’2021,
- The bank’s interest income grew by 14.8% to Kshs 11.2 bn, from Kshs 9.8 bn in H1’2021 mainly attributable to a 22.0% increase in interest income from loans and advances to Kshs 8.7 bn, from Kshs 7.1 bn in H1’2021. The growth in interest income was however weighed down by a 6.9% decline in interest income from government securities to Kshs 2.3 bn, from Kshs 2.4 bn in H1’2021. The Yield on Interest-Earning Assets (YIEA) increased to 3.8%, from 3.2% in H1’2021 following the 8.3% growth in the trailing interest income coupled with the 4.3% decline in average interest earning assets. Trailing Interest Income refers to the performance of the interest income for the past 12 consecutive months,
- Stanbic Bank’s interest expenses declined by 2.2% to Kshs 3.18 bn, from Kshs 3.25 bn in H1’2021, with interest expense on customer deposits declining by 4.5% to Kshs 2.7 bn, from Kshs 2.8 bn in H1’2021. Consequently, the cost of funds, declined to 2.3%, from 2.6% in H1’2021, owing to the 14.0% decline in trailing interest expense which outpaced the 5.0% decline in average interest bearing liabilities. Net Interest Margin increased to 5.4%, from 4.4% in H1’2021 on the back of the 18.1% increase in the trailing Net Interest Income to Kshs 15.8 bn from Kshs 13.4 bn in H1’2021 coupled with the 4.3% decline in average interest earning assets to Kshs 293.4 bn in H1’2022 from Kshs 306.7 bn in H1’2021,
- Non-Funded Income (NFI) rose by 25.1% to Kshs 6.9 bn, from Kshs 5.5 bn in H1’2021 driven by a 46.1% increase in foreign exchange trading income to Kshs 4.2 bn in H1’2022 from Kshs 2.9 bn in H1’2021, coupled with a 12.3% increase in other fees and commissions income to Kshs 2.0 bn from Kshs 1.8 bn in H1’2021, coupled with. Total fees and commission increased by 11.1% to Kshs 2.1 bn in H1’2022, from Kshs 1.9 bn in H1’2021. The revenue mix shifted to 55:45, funded to non-funded income, from 56:44 in H1’2021, owing to the faster 25.1% increase in Non-Funded Income (NFI) which outpaced the 20.9% increase in Net interest income (NII) in H1’2022,
- Total Operating Expenses increased by 13.7% to Kshs 8.6 bn in H1’2022, from Kshs 7.6 bn in H1’2021, attributable to an 18.1% increase in the bank’s staff costs to Kshs 3.5 bn in H1’2022, from Kshs 2.9 bn recorded in H1’2021 coupled with a 20.1% increase in other expenses to Kshs 3.6 bn, from Kshs 3.0 bn in H1’2021. The increase in total operating expenses was however mitigated by a 16.1% decline in Loan Loss Provisions (LLP) to Kshs 1.3 bn in H1’2022, from Kshs 1.5 bn in H1’2021, and,
- Cost to income ratio with LLP improved to 48.2%, from 48.9% in H1’2021, attributable to the 22.8% increase in total operating income to Kshs 15.2 bn in H1’2022, from Kshs 12.4 bn in H1’2021 which outpaced the 13.7% increase in total operating expenses to Kshs 8.6 bn, from Kshs 7.6 bn in H1’2021. However, without LLP, the Cost to income ratio deteriorated to 40.0% in H1’2022, from 36.8% in H1’2021, pointing towards deteriorating efficiency in the bank.
- The balance sheet recorded an expansion as total assets grew by 3.7% to Kshs 341.6 bn, from Kshs 329.5 bn in H1’2021. The increase was largely driven by a 17.5% increase in net loans to Kshs 244.0 bn, from Kshs 207.6 bn in H1’2021, as Stanbic focused more on lending in H1’2022 due to an improvement in the business environment as evidenced by the 16.1% reduction in the group’s Loan Loss Provisions (LLPs). The increase was however weighed down by a 36.1% decline in investment securities to Kshs 52.6 bn, from Kshs 82.2 bn in H1’2021,
- Total liabilities increased by 2.7% to Kshs 283.4 bn, from Kshs 276.0 bn in H1’2021, largely driven by a 10.9% increase in borrowings to Kshs 6.0 bn, from Kshs 5.4 bn in H1’2021. However, the bank’s deposits declined by 0.7% to Kshs 258.2 bn from Kshs 260.0 bn in H1’2021. Deposits per branch declined by 0.7% to Kshs 10.3 bn, from Kshs 10.4 bn in H1’2021, as the number of branches remained unchanged at 25,
- The bank’s Gross Non-Performing Loans (NPLs) increased by 16.3% to Kshs 24.1 bn, from Kshs 20.7 bn in H1’2021, taking the NPL ratio to 9.4% in H1’2022, from 9.5% in H1’2021. The improvement in the group’s asset quality is attributable to the 18.0% growth in gross loans which outpaced the 16.3% increase in Gross Non-Performing Loans (NPLs),
- General Loan Loss Provisions increased by 22.2% to Kshs 8.9 bn, from Kshs 7.3 bn in H1’2021. Consequently, the NPL coverage ratio increased to 56.0% in H1’2022, from 51.2% in H1’2021, an indication of increased provisioning levels by the bank,
- Shareholders’ funds increased by 8.8% to Kshs 58.2 bn in H1’2022, from Kshs 53.5 bn in H1’2021, largely due to the 12.8% increase in the retained earnings to Kshs 42.4 bn, from Kshs 37.6 bn in H1’2021,
- Stanbic Bank is currently sufficiently capitalized with a core capital to risk weighted assets ratio of 14.0%, 3.5% points above the statutory requirement of 10.5%. In addition, the total capital to risk weighted assets ratio stood at 16.2%, exceeding the statutory requirement of 14.5% by 1.7% points. Adjusting for IFRS 9, core capital to risk weighted assets ratio was at 14.0% while total capital to risk weighted assets came in at 16.2%, and,
- Stanbic Bank currently has a return on average assets of 3.3% and a return on average equity of 20.1%.
For a comprehensive analysis, please see our Stanbic Holdings’ H1’2022 Earnings Note
- I&M Holdings Plc
|
Balance Sheet Items |
H1'2021 |
H1'2022 |
y/y change |
|
Government Securities |
103.5 |
121.4 |
17.2% |
|
Net Loans and Advances |
204.5 |
231.1 |
13.0% |
|
Total Assets |
382.6 |
439.7 |
14.9% |
|
Customer Deposits |
276.8 |
313.2 |
13.2% |
|
Total Liabilities |
312.5 |
368.2 |
17.8% |
|
Shareholders’ Funds |
65.9 |
66.5 |
1.0% |
|
Balance Sheet Ratios |
H1'2021 |
H1'2022 |
% y/y change |
|
Loan to Deposit Ratio |
73.9% |
73.8% |
(0.1%) |
|
Return on average equity |
14.5% |
13.3% |
(1.3%) |
|
Return on average assets |
2.5% |
2.1% |
(0.4%) |
|
Income Statement |
H1'2021 |
H1'2022 |
y/y change |
|
Net Interest Income |
8.9 |
10.5 |
18.7% |
|
Net non-Interest Income |
3.9 |
5.1 |
28.2% |
|
Total Operating income |
12.8 |
15.6 |
21.6% |
|
Loan Loss provision |
1.1 |
1.3 |
24.4% |
|
Total Operating expenses |
7.2 |
8.6 |
19.3% |
|
Profit before tax |
5.9 |
7.2 |
22.5% |
|
Profit after tax |
4.2 |
4.9 |
15.9% |
|
Core EPS |
2.6 |
3.0 |
15.9% |
|
Income Statement Ratios |
H1'2021 |
H1'2022 |
y/y change |
|
Yield from interest-earning assets |
9.5% |
10.2% |
0.7% |
|
Cost of funding |
4.1% |
4.0% |
(0.1%) |
|
Net Interest Margin |
5.7% |
6.4% |
0.7% |
|
Net Interest Income as % of operating income |
69.2% |
67.5% |
(1.7%) |
|
Non-Funded Income as a % of operating income |
30.8% |
32.5% |
1.7% |
|
Cost to Income Ratio with LLP |
56.3% |
55.2% |
(1.1%) |
|
Cost to Income Ratio without LLP |
48.1% |
46.8% |
(1.3%) |
|
Cost to Assets |
1.6% |
1.7% |
0.1% |
|
Capital Adequacy Ratios |
H1'2021 |
H1'2022 |
% Points Change |
|
Core Capital/Total Liabilities |
20.7% |
19.9% |
(0.8%) |
|
Minimum Statutory ratio |
8.0% |
8.0% |
0.0% |
|
Excess |
12.7% |
11.9% |
(0.8%) |
|
Core Capital/Total Risk Weighted Assets |
15.9% |
15.0% |
(0.9%) |
|
Minimum Statutory ratio |
10.5% |
10.5% |
0.0% |
|
Excess |
5.4% |
4.5% |
(0.9%) |
|
Total Capital/Total Risk Weighted Assets |
20.7% |
19.8% |
(0.9%) |
|
Minimum Statutory ratio |
14.5% |
14.5% |
0.0% |
|
Excess |
6.2% |
5.3% |
(0.9%) |
|
Liquidity Ratio |
48.3% |
48.8% |
0.5% |
|
Minimum Statutory ratio |
20.0% |
20.0% |
0.0% |
|
Excess |
28.3% |
28.8% |
0.5% |
|
Adjusted Core Capital/Total Liabilities |
20.8% |
20.0% |
(0.8%) |
|
Adjusted Core Capital/Total RWA |
15.9% |
15.1% |
(0.9%) |
|
Adjusted Total Capital/Total RWA |
20.8% |
19.8% |
(0.9%) |
Key take-outs from the earnings release include;
- Core earnings per share increased by 15.9% to Kshs 3.0 in H1’2022, from Kshs 2.6 recorded in H1’2021 higher than our expectations of a 13.0% to Kshs 2.9 bn. The performance was mainly attributable to the 21.6% increase in the total operating income to Kshs 15.6 bn in H1’2022 from Kshs 12.8 bn in H1’2021. The performance was however weighed down by a 19.3% increase in total operating expenses to Kshs 8.6 bn, from Kshs 7.2 bn in H1’2021,
- Total operating income increased by 21.6% to Kshs 15.6 bn from Kshs 12.8 bn in H1’2021 owing to an 18.7% increase in the Net Interest Income (NII) to Kshs 10.5 bn in H1’2022 from Kshs 8.9 bn in H1’2021, coupled with a 28.2% increase in the Non-Funded Income (NFI) to Kshs 5.1 bn in H1’2022, from Kshs 3.9 bn that was recorded in H1’2021,
- Interest income grew by 19.3% to Kshs 17.5 bn from Kshs 14.6 bn in H1’2021, driven by a 16.1% increase in interest income from loans and advances to Kshs 12.0 bn, from Kshs 10.4 bn recorded in H1’2021. Additionally, interest income from government securities increased by 26.2% to Kshs 5.2 bn in H1’2022, from Kshs 4.1 bn in H1’2021. Consequently, the Yield on Interest-Earning Assets increased to 10.2% from 9.5% in H1’2021, attributable to a faster 22.2% increase in trailing interest income, as compared to the 13.8% increase in average interest earning assets. Trailing Interest Income refers to the performance of the interest income for the past 12 consecutive months,
- Interest expense increased by 20.2% to Kshs 6.9 bn from Kshs 5.8 bn in H1’2021, attributable to a 16.9% increase in interest expense on deposits to Kshs 5.6 bn, from Kshs 4.8 bn recorded in H1’2021, coupled with a 33.6% growth in interest expense on placements from other institutions to Kshs 0.7 bn from Kshs 0.5 bn in H1’2021. The cost of funds declined by 0.1% points to 4.0% from 4.1% recorded in H1’2022, following a 15.4% increase in average interest bearing liabilities, which outpaced the 13.1% increase in trailing interest expense. The Net Interest Margin (NIM) increased by 0.7% points to 6.4%, from 5.7% in H1’2021, driven by the 28.4% increase in the trailing net Interest Income (NII) which outpaced the 13.8% growth in average interest earning assets,
- Non-Funded Income (NFI) grew by 28.2% to Kshs 5.1 bn from the Kshs 3.9 bn that was recorded in H1’2021, driven by a 147.7% growth in Foreign Exchange Trading income to Kshs 1.9 bn from Kshs 0.8 bn in H1’2021, mainly due to the continued depreciation of the Kenyan shilling. Additionally, other fees and commissions increased by 3% to Kshs 1.9 bn from Kshs 1.3 bn in H1’2021. Fees and commission on loans also increased by 9.9% to Kshs 1.0 bn from Kshs 0.9 bn in H1’2021 taking the total fees and commissions to Kshs 2.9 bn, a 30.1% increase from Kshs 2.2 bn recorded in H1’2021,
- Total operating expenses rose by 19.3% to Kshs 8.6 bn from Kshs 7.2 bn in H1’2021, largely driven by a 10.8% increase in staff costs to Kshs 3.0 bn, from Kshs 2.7 bn in H1’2021, coupled with a 24.4% increase in other operating expenses to Kshs 4.3 bn, from Kshs 3.4 bn in H1’2021. Additionally, Loan Loss Provisions (LLPs) increased by 24.4% to Kshs 1.3 bn, from Kshs 1.1 bn in H1’2021, attributable to the relatively high non-performing loans,
- Cost to Income Ratio (CIR) improved to 55.2%, from 56.3% in H1’2022 attributable to the faster 21.6% increase in total operating income which outpaced the 19.3% increase in the total operating expenses to Kshs 8.6 bn from Kshs 7.2 bn in H1’2021. Also, without LLP, cost to income ratio improved to 46.8% from 48.1% in H1’2021, an indication of improved efficiency,
- Profit before tax increased by 22.5% to Kshs 7.2 bn, up from Kshs 5.9 bn in H1’2021. Profit after tax increased by 15.9% to Kshs 4.9 bn, up from Kshs 4.2 bn in H1’2021, with the effective tax rate increasing to 30.0%, from 29.1% in H1’2021.
- The balance sheet recorded an expansion as total assets grew by 14.9% to Kshs 439.7 bn, from Kshs 382.6 bn in H1’2021, attributable to a 13.0% growth in the loan book to Kshs 231.1 bn, from Kshs 204.5 bn in H1’2021, coupled with a 17.2% increase in government and other securities to Kshs 121.4 bn, from Kshs 103.5 bn in H1’2021,
- Total liabilities rose by 17.8% to Kshs 368.2 bn from Kshs 312.5 bn in H1’2021, driven by a 13.2% rise in customer deposits to Kshs 313.2 bn from Kshs 276.8 bn in H1’2021. Deposits per branch declined by 13.2% to Kshs 3.6 bn from Kshs 4.2 bn in H1’2021, with the number of branches increasing to 86 branches from 66 branches in H1’2021,
- The slower 13.0% growth in loans as compared to the 13.2% growth in deposits led to a marginal decline in the loan to deposits ratio to 73.8% from 73.9% in H1’2021,
- Gross non-performing loans increased by 1.5% to Kshs 23.3 bn in H1’2022, from Kshs 22.9 bn in H1’2021. However, the NPL ratio declined to 9.5% in H1’2022 from 10.4% in H1’2021, attributable to the faster 12.6% increase in gross Loans. The NPL coverage also declined to 59.2% in H1’2022 from 67.2% in H1’2021, as general Loan Loss Provisions increased by 17.0% to Kshs 18.0 bn from Kshs 15.4 bn in H1’2021.
- Shareholders’ funds increased by 1.0% to Kshs 66.5 bn in H1’2022 from Kshs 65.9 bn in H1’2021, supported by a 15.9% increase in retained earnings to Kshs 4.9 bn from Kshs 4.2 bn in H1’2021,
- I&M Holdings Plc remains sufficiently capitalized with a core capital to risk-weighted assets ratio of 15.0%, 4.5% points above the statutory requirement. In addition, the total capital to risk-weighted assets ratio came in at 19.8%, exceeding the statutory requirement by 5.3% points. Adjusting for IFRS 9, the core capital to risk-weighted assets stood at 15.1%, while total capital to risk-weighted assets came in at 19.8%, and,
- The bank currently has a Return on Average Assets (ROaA) of 2.1%, and a Return on Average Equity (ROaE) of 13.3%.
For a comprehensive analysis, please see our I&M Holdings Plc' H1’2022 Earnings Note
Asset Quality
The table below is a summary of the asset quality for the listed banks
|
|
H1'2021 NPL Ratio** |
H1'2022 NPL Ratio* |
H1'2021 NPL Coverage** |
H1'2022 NPL Coverage* |
% point change in NPL Ratio |
% point change in NPL Coverage |
|
I&M Holdings |
10.4% |
9.4% |
67.2% |
59.2% |
(1.0%) |
(8.0%) |
|
Stanbic Bank |
9.5% |
10.4% |
51.2% |
56.0% |
0.9% |
4.8% |
|
Standard Chartered Bank Kenya |
15.4% |
15.4% |
81.4% |
83.9% |
0.0% |
2.5% |
|
Mkt Weighted Average |
12.1% |
12.2% |
67.3% |
68.0% |
0.1% |
0.8% |
|
*Market cap weighted as at 19/8/2022 |
||||||
Key take-outs from the table include;
- Asset quality for the listed banks deteriorated during the period, with the weighted average NPL ratio increasing by 0.1% points to a market cap weighted average of 12.2%, from an average of 12.1% for the listed banking sector in H1’2021, and,
- NPL Coverage for the listed banks increased to a market cap weighted average of 68.0% in H1’2022, from 67.3% recorded in H1’2021, as the banks increased their provisioning levels to proactively manage risks brought about by the emergence of new COVID-19 variants coupled with the slow recovery of some sectors such as tourism, agriculture and manufacturing.
Summary Performance
The table below highlights the performance of the listed banks, showing the performance using several metrics, and the key take-outs of the performance;
|
Bank |
Core EPS Growth |
Interest Income Growth |
Interest Expense Growth |
Net Interest Income Growth |
Net Interest Margin |
Non-Funded Income Growth |
NFI to Total Operating Income |
Growth in Total Fees & Commissions |
Deposit Growth |
Growth in Government Securities |
Loan to Deposit Ratio |
Loan Growth |
Return on Average Equity |
|
Stanbic Holdings |
36.9% |
14.8% |
(2.2%) |
20.9% |
5.4% |
25.1% |
45.1% |
11.1% |
(0.7%) |
(36.1%) |
94.5% |
17.5% |
20.1% |
|
I&M Holdings |
15.9% |
19.3% |
20.2% |
18.7% |
0.7% |
28.2% |
32.5% |
30.1% |
13.2% |
17.2% |
73.8% |
13.0% |
13.3% |
|
Standard Chartered |
10.9% |
4.4% |
(21.4%) |
9.9% |
6.4% |
10.9% |
35.6% |
(6.2%) |
3.1% |
2.1% |
44.8% |
(1.3%) |
17.7% |
|
H1'22 Mkt Weighted Average* |
21.3% |
11.7% |
(4.5%) |
15.9% |
4.7% |
20.1% |
38.2% |
8.7% |
4.2% |
(7.8%) |
69.5% |
8.8% |
17.5% |
|
H1'21 Mkt Weighted Average** |
136.0% |
15.0% |
10.8% |
17.6% |
7.4% |
19.2% |
35.6% |
16.6% |
18.4% |
12.4% |
68.8% |
11.7% |
16.9% |
|
*Market cap weighted as at 19/09/2022 |
|||||||||||||
|
**Market cap weighted as at 09/09/2021 |
|||||||||||||
Key takeaways from the table above include:
- The listed banks recorded a 21.3% weighted average growth in core Earnings per Share (EPS), compared to a weighted average increase of 136.0% in H1’2021 for the listed banking sector,
- The Banks have recorded a weighted average deposit growth of 4.2%, slower than the 18.4% growth recorded in H1’2021, an indication of reduced investment risk in the business environment,
- Interest income grew by 11.7%, compared to a growth of 15.0% recorded in H1’2021 while the weighted average Yield on Interest Earning Assets (YIEA) declined to 6.8%, from the 9.9% recorded in H1’2021 for the listed banking sector. On the other hand, the Net Interest Margin (NIM) now stands at 4.7%, 2.7% points lower than the 7.4% recorded in H1’2021 for the whole listed banking sector, and,
- Non-Funded Income grew by 20.1%, compared to the 19.2% growth recorded in H1’2022.
Universe of coverage:
|
Company |
Price as at 05/08/2022 |
Price as at 12/08/2022 |
w/w change |
YTD Change |
Target Price* |
Dividend Yield |
Upside/ Downside** |
P/TBv Multiple |
Recommendation |
|
Jubilee Holdings |
252.5 |
252.3 |
(0.1%) |
(20.4%) |
379.4 |
5.6% |
56.0% |
0.5x |
Buy |
|
Kenya Reinsurance |
2.1 |
2.2 |
3.3% |
(5.7%) |
3.2 |
4.6% |
51.8% |
0.2x |
Buy |
|
I&M Group*** |
17.0 |
17.0 |
(0.3%) |
(20.8%) |
22.3 |
8.8% |
40.4% |
0.5x |
Buy |
|
Sanlam |
11.7 |
11.7 |
0.0% |
0.9% |
15.9 |
0.0% |
36.5% |
1.2x |
Buy |
|
Diamond Trust Bank*** |
50.8 |
50.3 |
(1.0%) |
(15.5%) |
62.4 |
6.0% |
30.1% |
0.2x |
Buy |
|
KCB Group*** |
43.1 |
43.3 |
0.5% |
(5.0%) |
52.2 |
6.9% |
27.6% |
0.9x |
Buy |
|
Britam |
6.3 |
6.1 |
(2.5%) |
(19.0%) |
7.7 |
0.0% |
25.8% |
1.0x |
Buy |
|
NCBA*** |
26.2 |
25.8 |
(1.5%) |
1.4% |
29.1 |
11.6% |
24.4% |
0.6x |
Buy |
|
Stanbic Holdings |
98.8 |
99.0 |
0.3% |
13.8% |
109.8 |
9.1% |
20.0% |
0.9x |
Buy |
|
Co-op Bank*** |
12.8 |
12.6 |
(1.6%) |
(3.1%) |
14.1 |
7.9% |
19.8% |
0.9x |
Accumulate |
|
Equity Group*** |
50.5 |
48.0 |
(5.0%) |
(9.0%) |
54.4 |
6.3% |
19.6% |
1.2x |
Accumulate |
|
ABSA Bank*** |
12.0 |
12.4 |
2.9% |
5.1% |
13.6 |
8.9% |
19.0% |
1.2x |
Accumulate |
|
Standard Chartered*** |
139.3 |
138.3 |
(0.7%) |
6.3% |
137.0 |
10.1% |
9.2% |
1.1x |
Hold |
|
Liberty Holdings |
6.0 |
7.2 |
20.0% |
2.0% |
7.8 |
0.0% |
8.3% |
0.5x |
Hold |
|
CIC Group |
2.0 |
2.1 |
2.5% |
(5.5%) |
2.1 |
0.0% |
2.4% |
0.7x |
Lighten |
|
HF Group |
3.5 |
3.6 |
2.9% |
(5.3%) |
2.8 |
0.0% |
(22.2%) |
0.2x |
Sell |
|
Target Price as per Cytonn Analyst estimates **Upside/ (Downside) is adjusted for Dividend Yield ***For Disclosure, these are stocks in which Cytonn and/or its affiliates are invested in |
|||||||||
We are “Neutral” on the Equities markets in the short term due to the current adverse operating environment and huge foreign investor outflows, and, “Bullish” in the long term due to current cheap valuations and expected global and local economic recovery.
With the market currently trading at a fair value to its future growth (PEG Ratio at 1.0x), we believe that investors should reposition towards value stocks with strong earnings growth and that are trading at discounts to their intrinsic value. We expect the current high foreign investors sell-offs, the upcoming Kenyan general elections and the slow vaccine rollout to continue weighing down the economic outlook in the short term.
- Residential Sector
During the week, EA Limited, a subsidiary of the TransCentury PLC, an African infrastructure investment company based in Nairobi Kenya, announced plans to develop an affordable housing project worth USD 250.0 mn (Kshs 29.8 bn) in the Democratic Republic of Congo (DRC). The project targets the Office Conglais De Controle (OCC) staff (a quality assurance body) and will consist of 5,000 units to be constructed over a period of five years starting in 2022. Notably, EA limited will be the Engineering, Procurement and Construction (EPC) contractor as per the signed Memorandum of Understanding (MOU) with Symbion Architect, making the treaty the first to be initiated since DRC joined the East African Community bloc in March 2022. EA’s decision to invest in DRC was mainly driven by;
- The positive demographics fueling demand for housing units, with DRC’s current population and urbanization growth rates being 3.1% and 4.4%, respectively, compared to the world’s 0.9% and 1.7%, respectively, as at 2021. Additionally, the population is projected to reach 145 mn by 2050, with 60.0% being urban dwellers and 40.0% being rural dwellers, from the 42% urban dwellers and 58% rural dwellers recorded in 2014, and,
- The growing need for decent and affordable homes as the project targets 5,000 staff members and their families, which in turn may translate to over 20,000 individuals assuming an average of four people per household. Consequently, this is expected to help curb the existing housing deficit in the country which is currently at 4.0 mn housing units and growing by 250,000 p.a as at 2021.
In our view, EA’s expansion move will see the TransCentury group further increase its asset base and footprint in the East African region. EA is expected to benefit from DRC’s viable housing market which is primarily driven by impressive demographics resulting to a rapid demand for dwelling units that surpasses the current supply. Moreover, the move by EA is expected to boost investment confidence in the region which has been witnessing improved activities and developments in various sectors with the most recent focus mainly on the banking sector.
- Real Estate Investment Trusts (REITs)
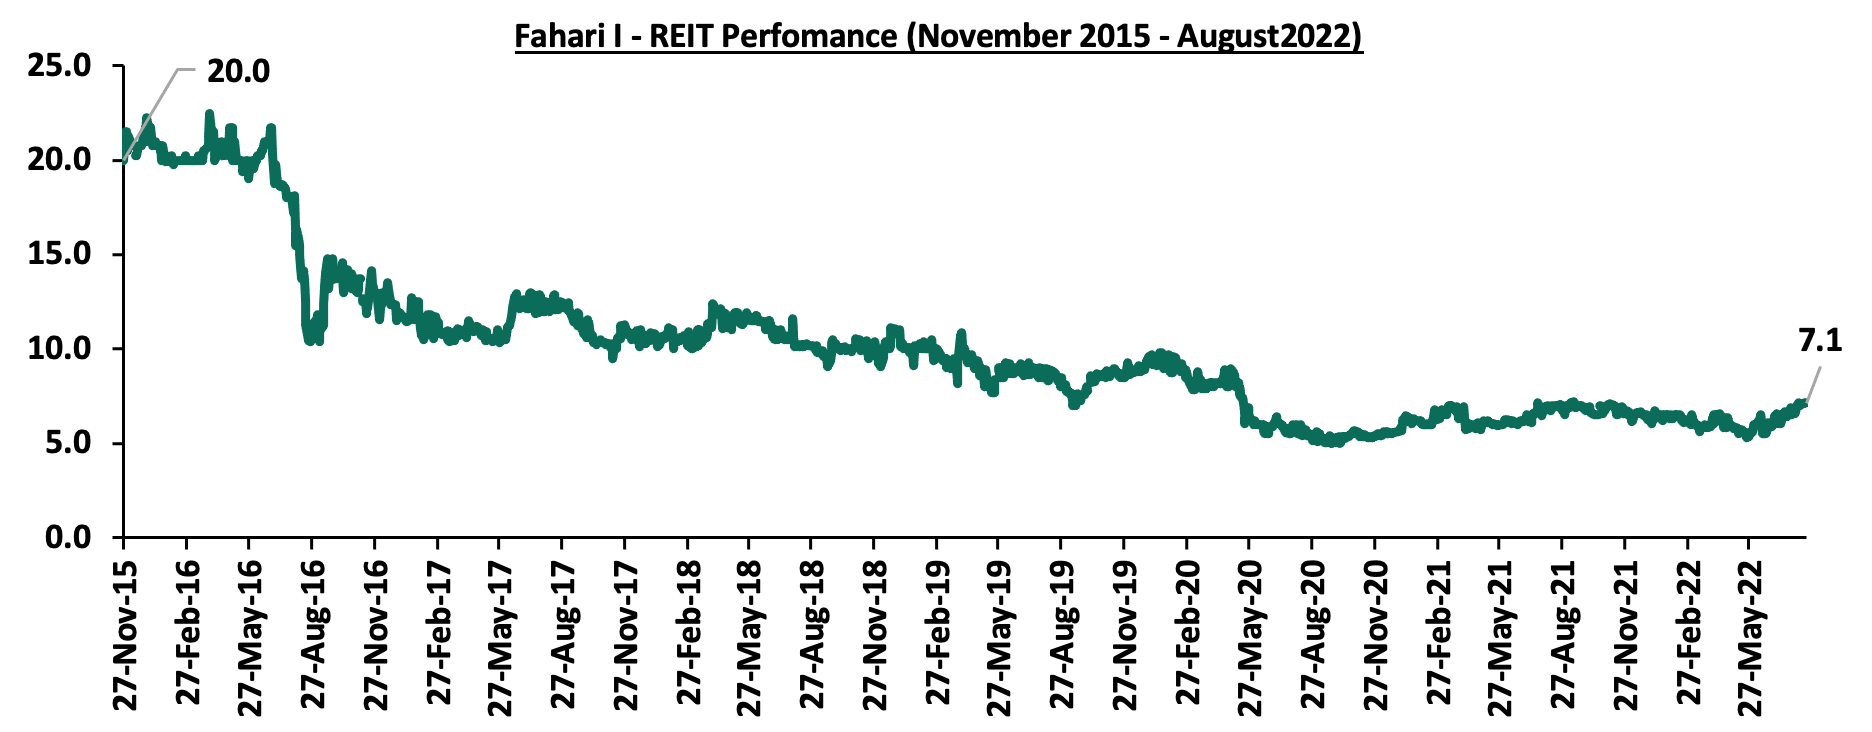
In the Nairobi Stock Exchange, ILAM Fahari I - REIT closed the week trading at an average price of Kshs 7.14 per share. The performance represents a 0.6% and 11.6% Week-to-Date (WTD) and Year-to-Date (YTD) increase, respectively, from Kshs 7.10 and Kshs 6.4 per share, respectively. On an Inception-to-Date (ITD) basis, the REIT’s performance continues to be weighed down having recorded a 64.3% decline from Kshs 20.0. The graph below shows Fahari I-REIT’s performance from November 2015 to August 2022:
The increasing investor confidence in the East African property market is expected to drive the developments and performance of the Real Estate sector. However, investor’s minimal appetite for the Kenyan REIT instrument is expected to continue weighing down the overall investments in REITs.
Kenya, like many other countries world over, has faced unprecedented challenges in the recent years which has had a major setback on the economy. One major issue; supply chain bottlenecks remains apparent and continues to worsen with new challenges such as geopolitical pressures and anticipation of increased demand as economies recover. Where we stand, the country is dealing with several issues including a high cost of living stemming from the prevailing inflationary pressures and local currency depreciation, rising debt levels currently at 69.1% of GDP as of May 2022 and a deteriorating business environment as consumers continue to cut back on spending. As such, we expect the incoming government to roll up its sleeves, perform a balancing act, and devise ways to stabilize key macroeconomic indicators while also supporting the ongoing economic recovery.
We recently covered a topical on the “Effects of Elections on the Investment Environment in Kenya” where we concluded that economic development and investment performance are heavily reliant on continuity and a stable macroeconomic environment, both of which have a significant impact on investor sentiment. We expected the out-going government to ensure a peaceful transition as well as provide the incoming government ample ground to implement its manifesto and improve the country’s economic prospects. This week we look at what has been happening under the outgoing government and discuss some of the economic areas to be focused on by the next government, now that the elections are over. The analysis will be broken down as follows:
- Introduction,
- Background and overview of the topic,
- Key focus areas for the next government, and,
- Conclusion.
Section I: Introduction
The Kenyan economy has continued to record steady recovery, with the GDP having grown by 6.8% in Q1’2022, up from the 2.7% growth recorded in Q1’2021, mainly driven by the resumption of most economic activities following the lifting of all COVID-19 related measures. Despite the recovery, the country’s general business environment has continued to deteriorate majorly due to persistent inflationary pressures, that have led to reduced consumer spending. The Purchasing Manager’s Index (PMI), which measures business activity came in at an average of 48.8 for the first seven months of 2022, indicating a deteriorating business environment in Kenya’s private sector. The chart below summarizes the evolution of the PMI in the last five years;
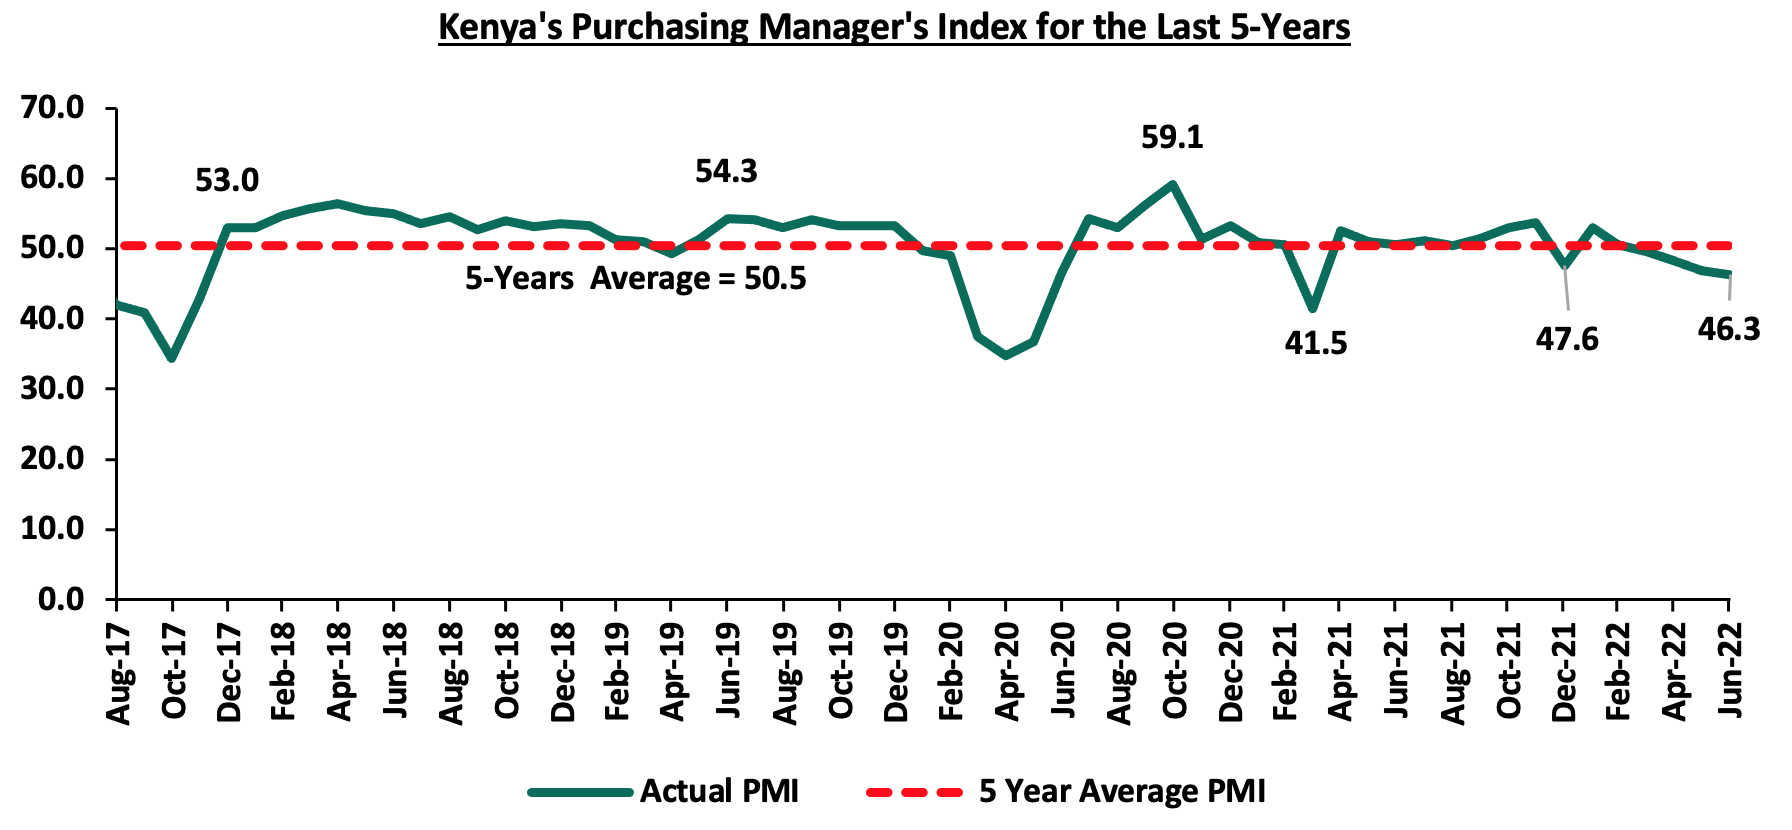
*** Key to note, a reading above 50.0 signals an improvement in business conditions, while readings below 50.0 indicate a deterioration.
Section II: Background and overview of the topic
Every new government seeks to implement its manifesto with the aim of improving the country’s economic conditions as well as address the key economic issues affecting the citizens. In this section, we examine Jubilee's achievements and failures, with a particular emphasis on the major macro-economic indicators that shape a country’s economic prospects, as follows;
- Economic Growth
Over the last ten years, the Kenyan economy has recorded relative growth with the average GDP growth rate coming in at 4.4%, primarily driven by robust domestic demand emanating from private consumption and continuous increase in government investment. However, the growth has been weighed down by external shocks such as elevated inflationary pressures and the Covid-19 pandemic in 2020 which resulted in extreme economic disruptions. The graph below shows the GDP growth rates since 2012:
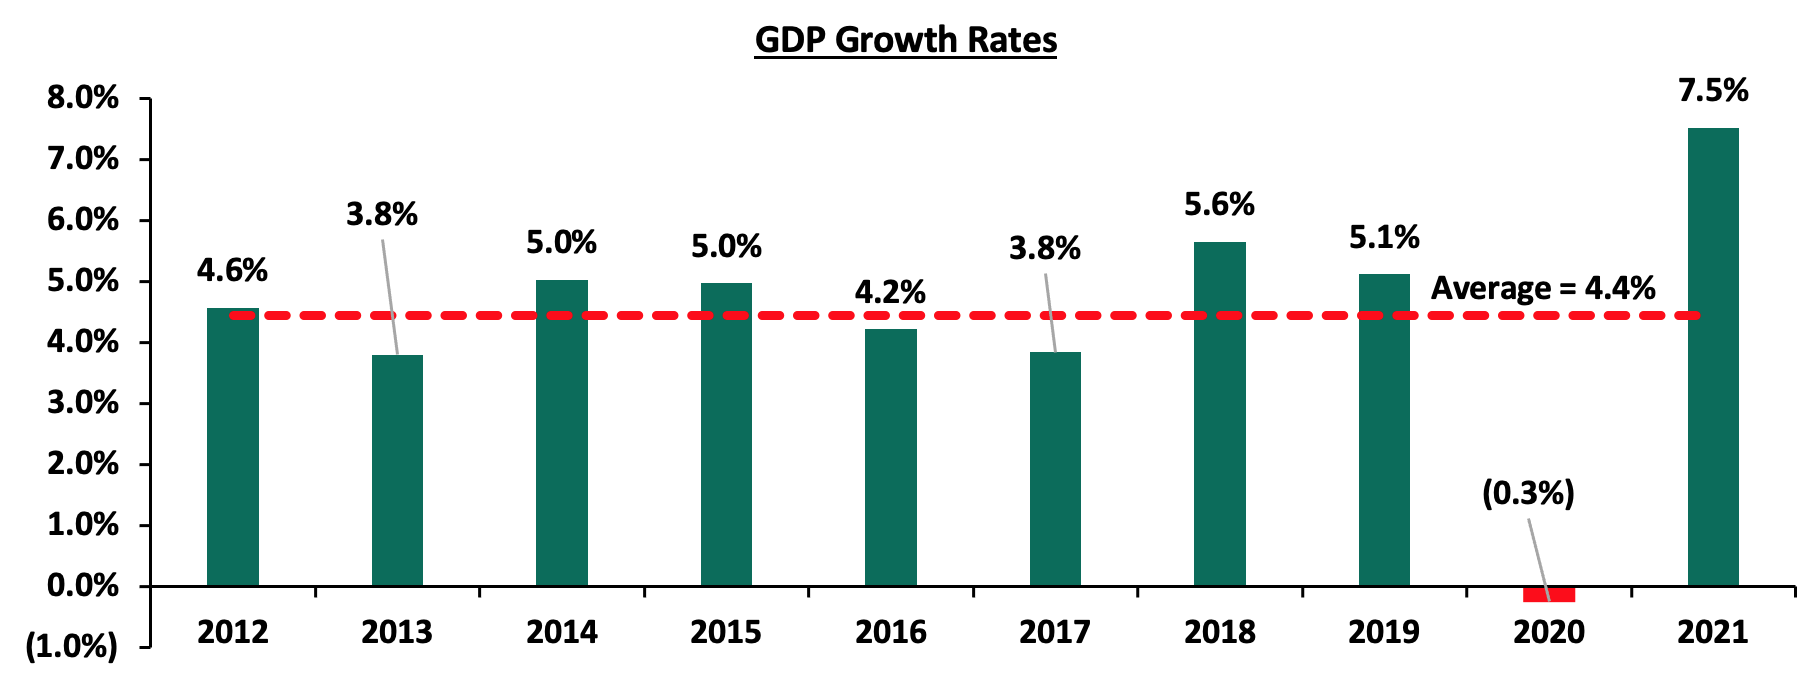
Source: World Bank
The Kenyan economy recorded the highest growth rate in 2021, having expanded by 7.5%, up from the 0.3% contraction recorded in 2020, mainly driven by the resumption of most economic activities following the lifting of most COVID-19 related measures. However, Kenya’s 10-year average GDP growth lags behind most of the African countries as shown in the chart below;
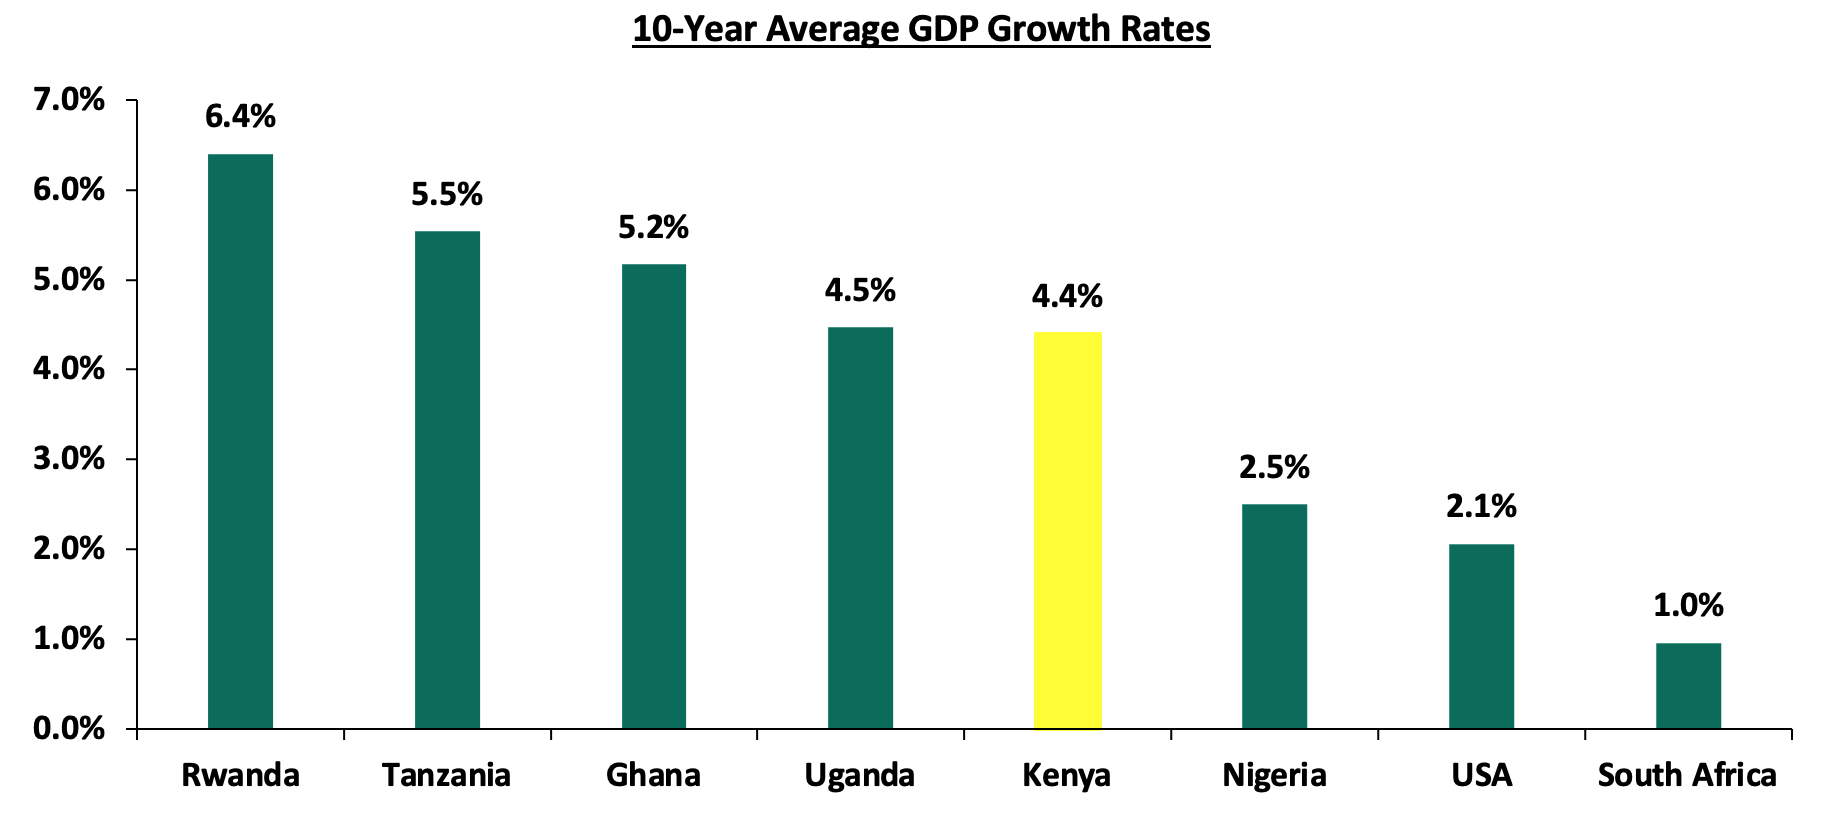
Source: World Bank
- Public Debt
Over the last ten years, Kenya’s public debt has grown at a CAGR of 18.2% to Kshs 8.6 tn in May 2022, from Kshs 1.7 tn in May 2012 in comparison to the 4.4% average GDP growth an indication that the increase in debt is not translating into GDP growth. The increase in debt stock has been partly driven by huge spending on large infrastructure projects as well as widening fiscal deficit which stood at 8.1% of GDP in FY’2021/2022. Over the 10-year period that Jubilee has been in government, Kenya’s debt to GDP ratio increased to 67.5% in 2021, 26.3% points higher than the 41.2% ratio recorded in 2012 and 17.5% points above the IMF’s recommended threshold of 50.0% for developing countries. The chart below highlights the trend in the country’s debt to GDP ratio over the last ten years:
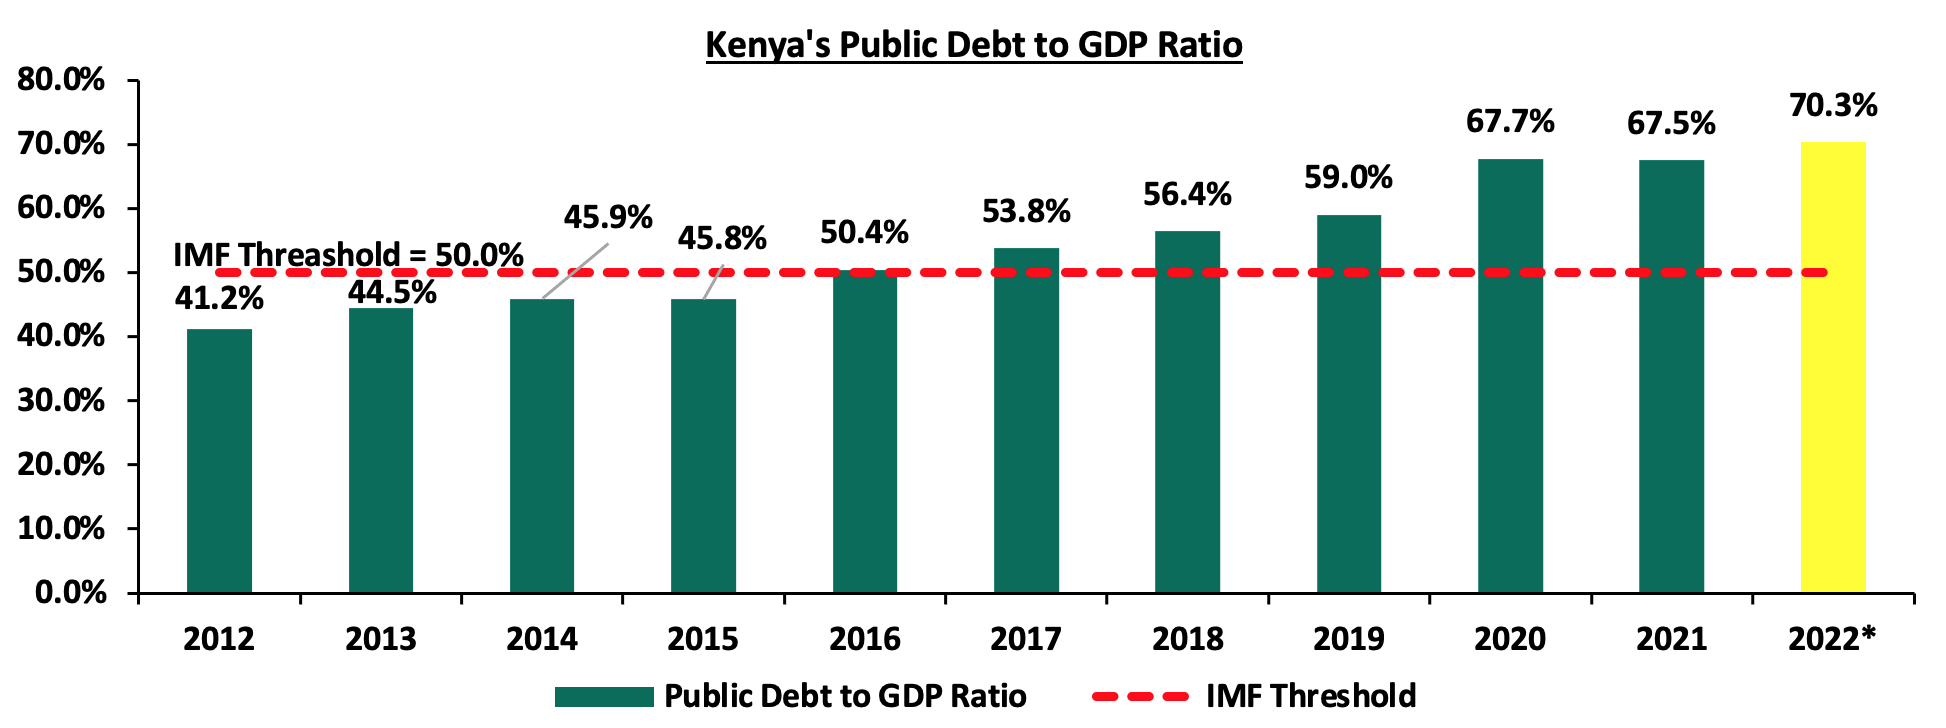
Source: The National Treasury, *Projected figures
It is worth noting that Kenya’s debt servicing costs have continued to increase over time growing at a 10-year CAGR of 23.0% to Kshs 780.6 bn in FY’2020/2021, from Kshs 98.6 bn in FY’2010/2011The debt service to revenue ratio has also increased significantly in the ten years to 50.0%, from 16.2% in FY’2010/2011 posing a refinancing risk given the existing external shocks that further increase the servicing costs. This is also an indication that a larger percentage of the revenues collected will be used to pay back debt as opposed to steering economic development. Below is a chart showing the debt service to revenue ratio for the last ten fiscal years;
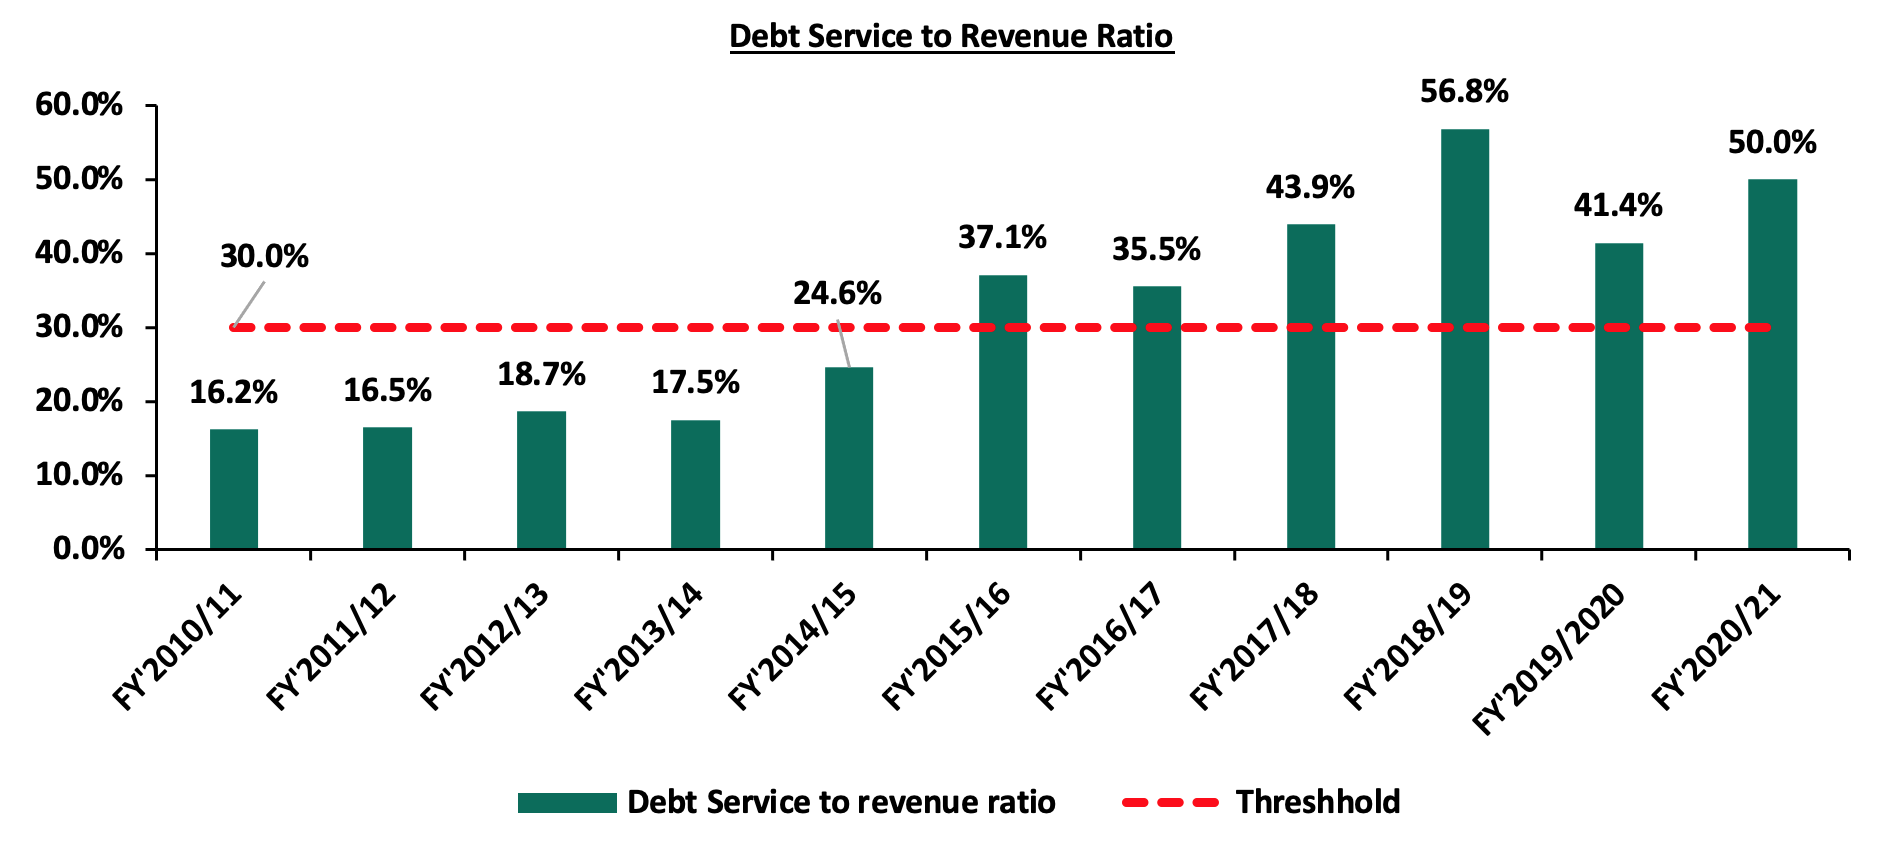
Source: National Treasury
- Currency Performance
Ove the 10-year period, the Kenyan shilling has depreciated by 42.7% to an all-time low of Kshs 119.3 in August 2022 from Kshs 83.6 over the same period in 2012, attributable to various factors such as increasing debt levels, an ever present current account deficit and the rising prices of commodities such as crude oil prices as Kenya remains a net importer. The economic disruptions occasioned by the COVID-19 pandemic in 2020 also caused volatility of the shilling leading to a depreciation of 7.7% in 2020 and a further 3.6% in 2021. On a YTD basis, the shilling has depreciated by 5.7% against the USD, to close at Kshs 119.6, from Kshs 113.1 recorded on 3rd January 2022. The steep depreciation in 2022 is mainly attributable to increased dollar demand from commodity and energy sector importers as a result of the high global crude oil prices occasioned by supply chain constraints worsened by the geopolitical pressures at a time when the economy has continued to witness increasing demand. The chart below illustrates the performance of the Kshs against the USD over the last 10 years:
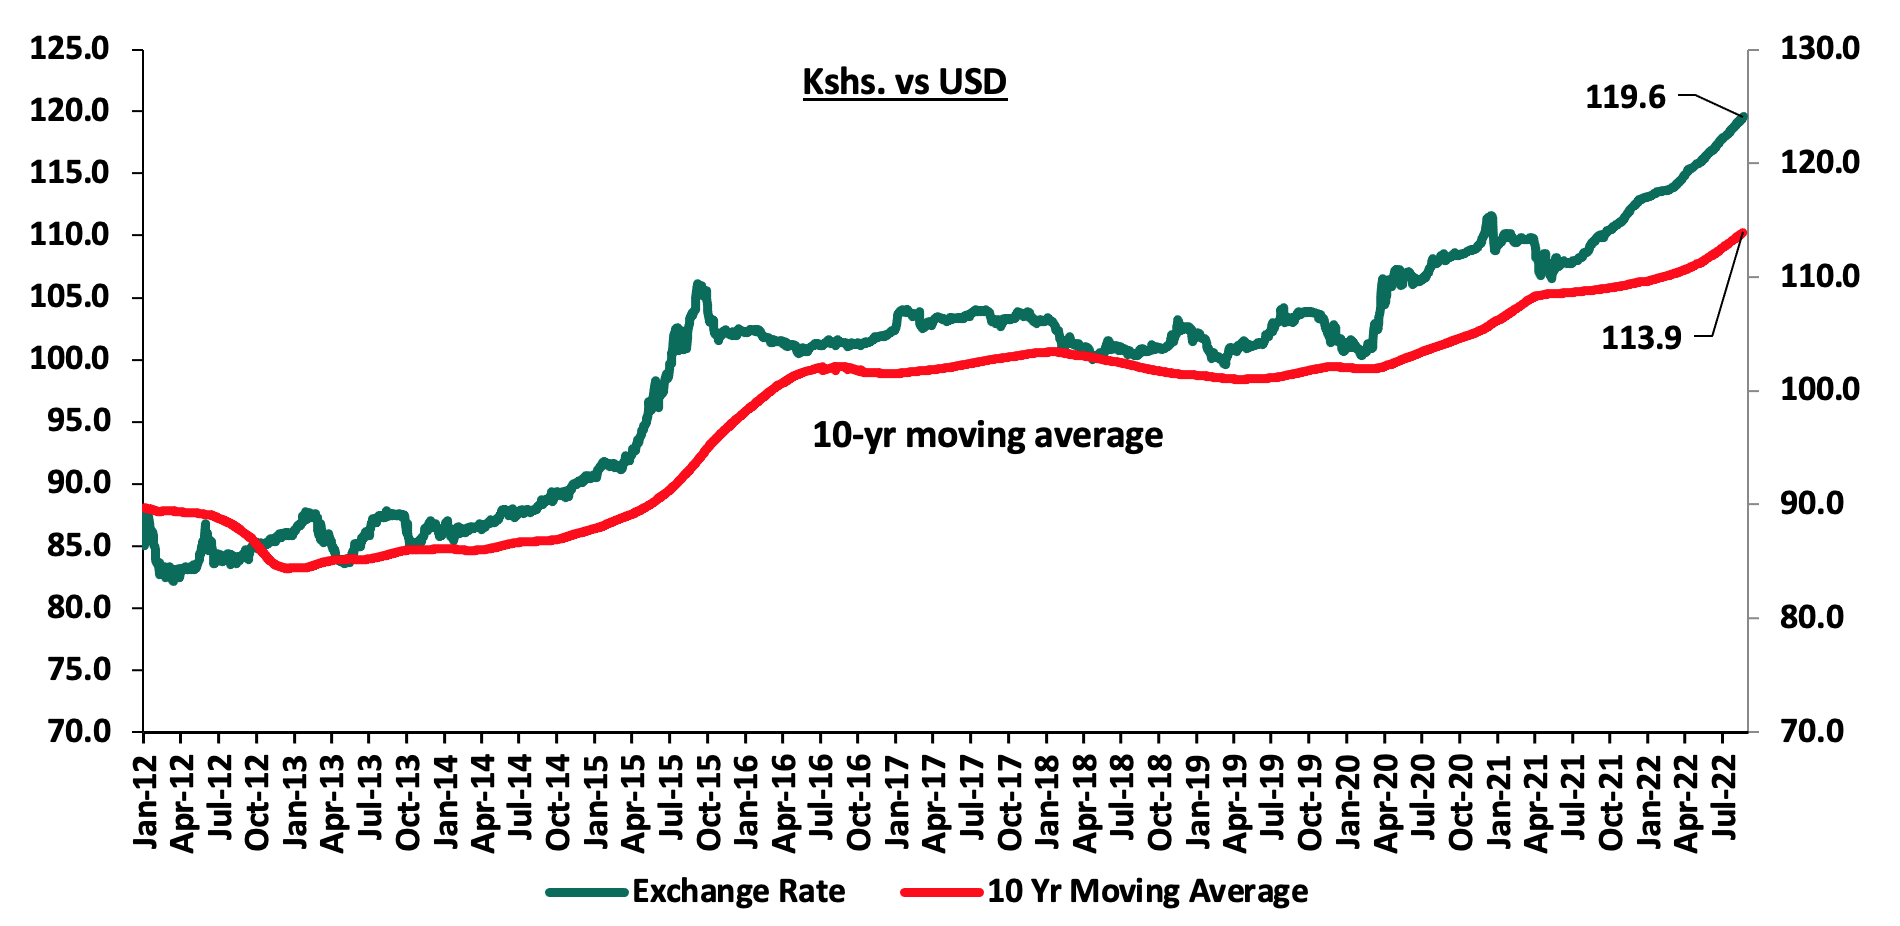
Source: Central Bank of Kenya
- Revenue Collection
Over the 10-year period that Jubilee has been in government, Kenya’s revenue collection more than doubled to grow at a 10-year CAGR of 8.9% to Kshs 2.0 tn in FY’2021/2022, from Kshs 0.9 tn in FY’2012/2013 following expansion of the tax base as well as implementation of tax measures that have aided in efficient collection of tax revenues. However, the government has only surpassed its revenue collection target twice in the ten years under review. The graph below shows a summary of Kenya’s revenue performance over the last 10 years:
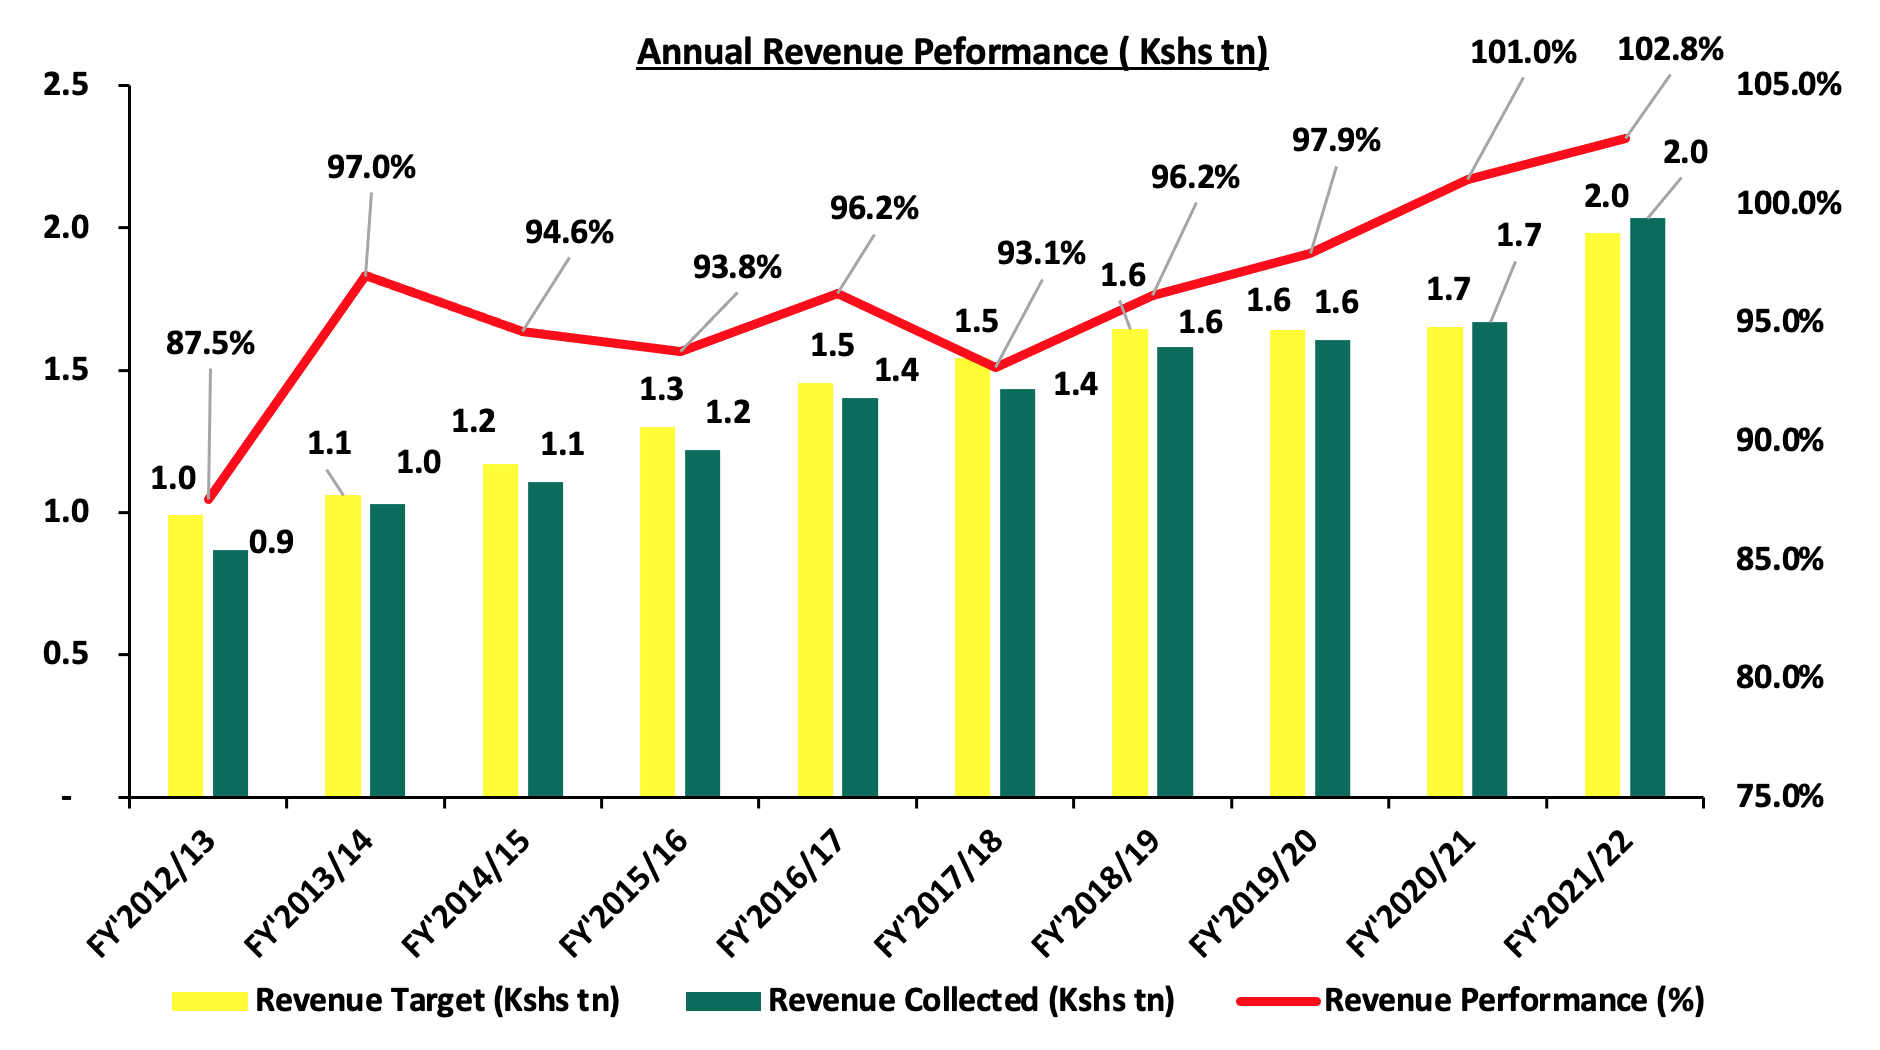
Source: Kenya Revenue Authority
- Unemployment rate
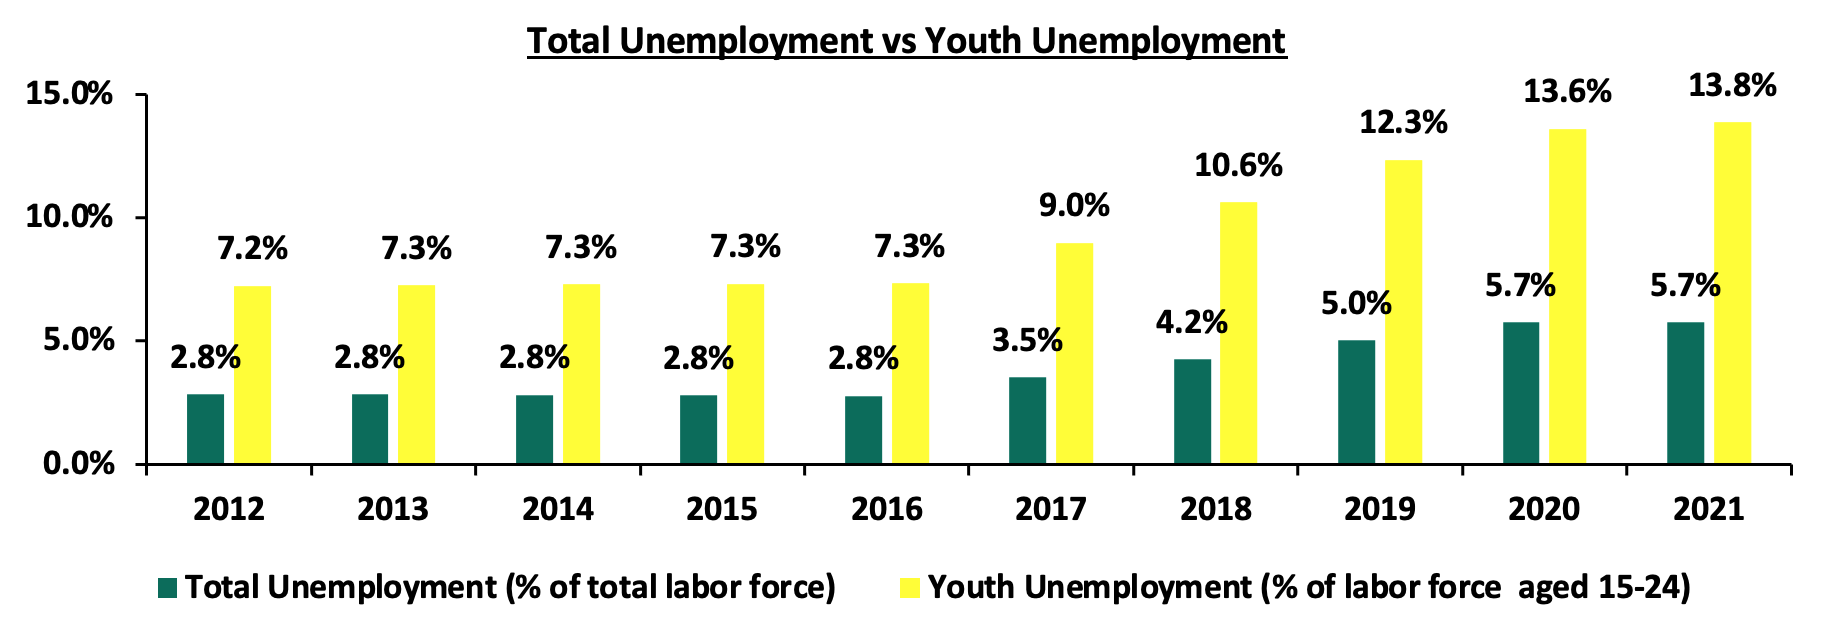
According to the World Bank, unemployment rate in Kenya recorded a 2.9% points increase during the period under review to 5.7% in 2021, from 2.8% in 2012 manly attributable to the challenges facing the county’s economic development coupled the rising youth population in Kenya, whose unemployment rate stood at 13.8% in 2021. The chart below shows a summary of total and youth unemployment over the last 10 years:
Source: World Bank
The total labor force increased by 33.3% to 25.0 mn people in 2021 from 18.7 mn people in 2012 as many people continue to acquire the relevant skills needed in the job market. Additionally, the employment to population ratio declined to 69.0% in 2021 from 71.8% in 2012 as the country continues to recorded rapid population growth to close 2021 at 55.0 mn people, from 44.3 mn in 2012. The graph below shows a summary of total labor force verses employment to population ratio over the last 10 years:
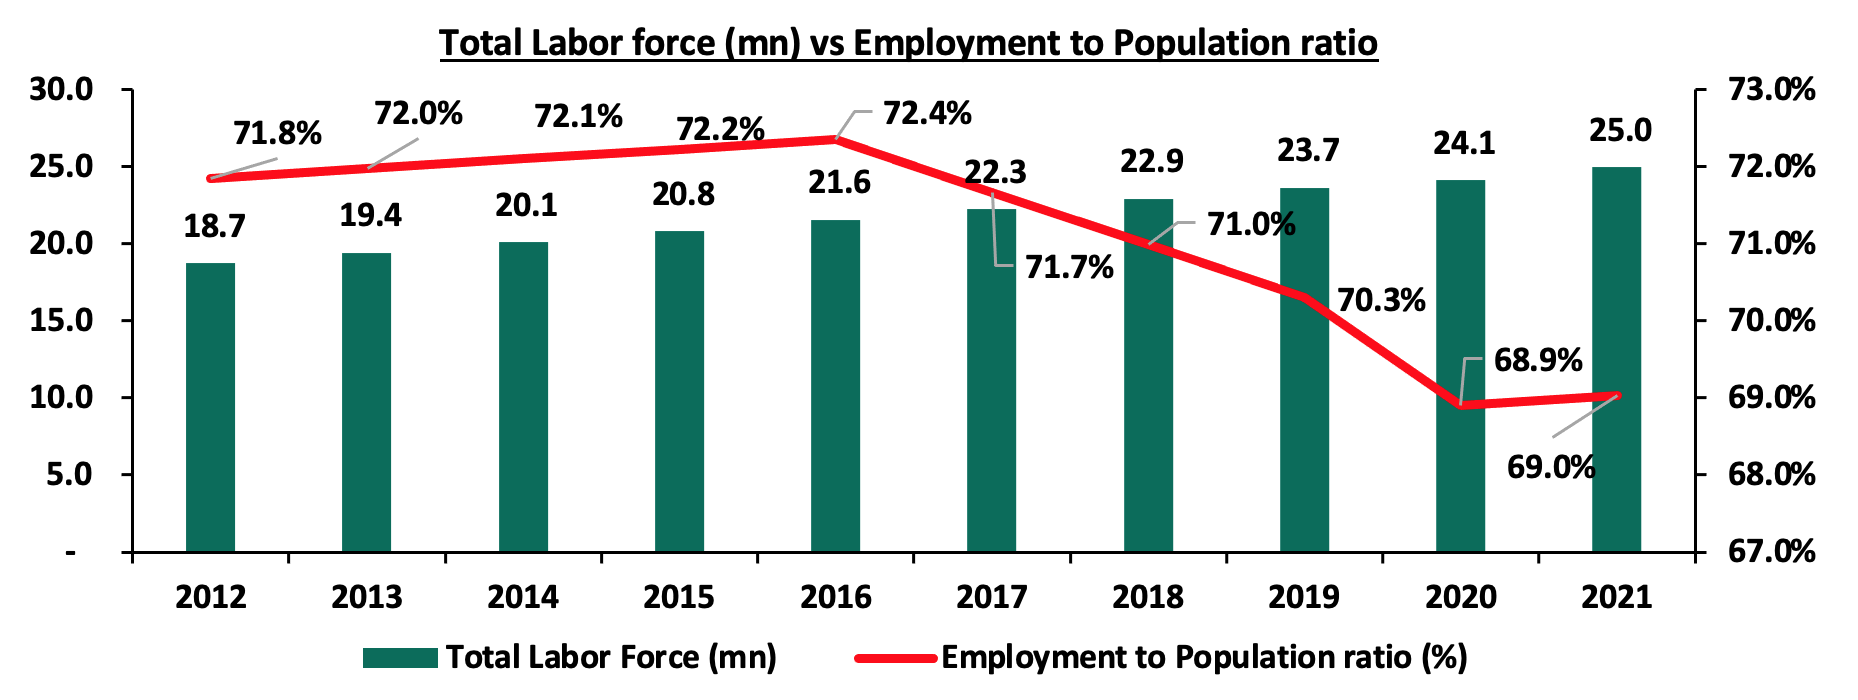
Source: World Bank
- Infrastructural development
Over the last 10 years, the Kenyan infrastructural sector has witnessed rapid developments aimed at improving connectivity and the economic performance. This has been supported by governments’ aggressiveness in implementing projects through various strategies such as; Public-Private Partnerships (PPPs) and Joint Ventures(JVs), floating of infrastructure bonds in order to raise construction funds, and, high priority in the budget allocations. As such, the government allocated to the sector a total of Kshs 3.7 tn in the last ten financial years, representing an average of 16.7% of the total budget with the highest allocation at 29.7% of the total budget in FY’2015/2016. However, the allocation has been on a downward trajectory, an indication that we are not investing much into the future. The graph below shows the budget allocation to the infrastructure sector over last ten financial years:
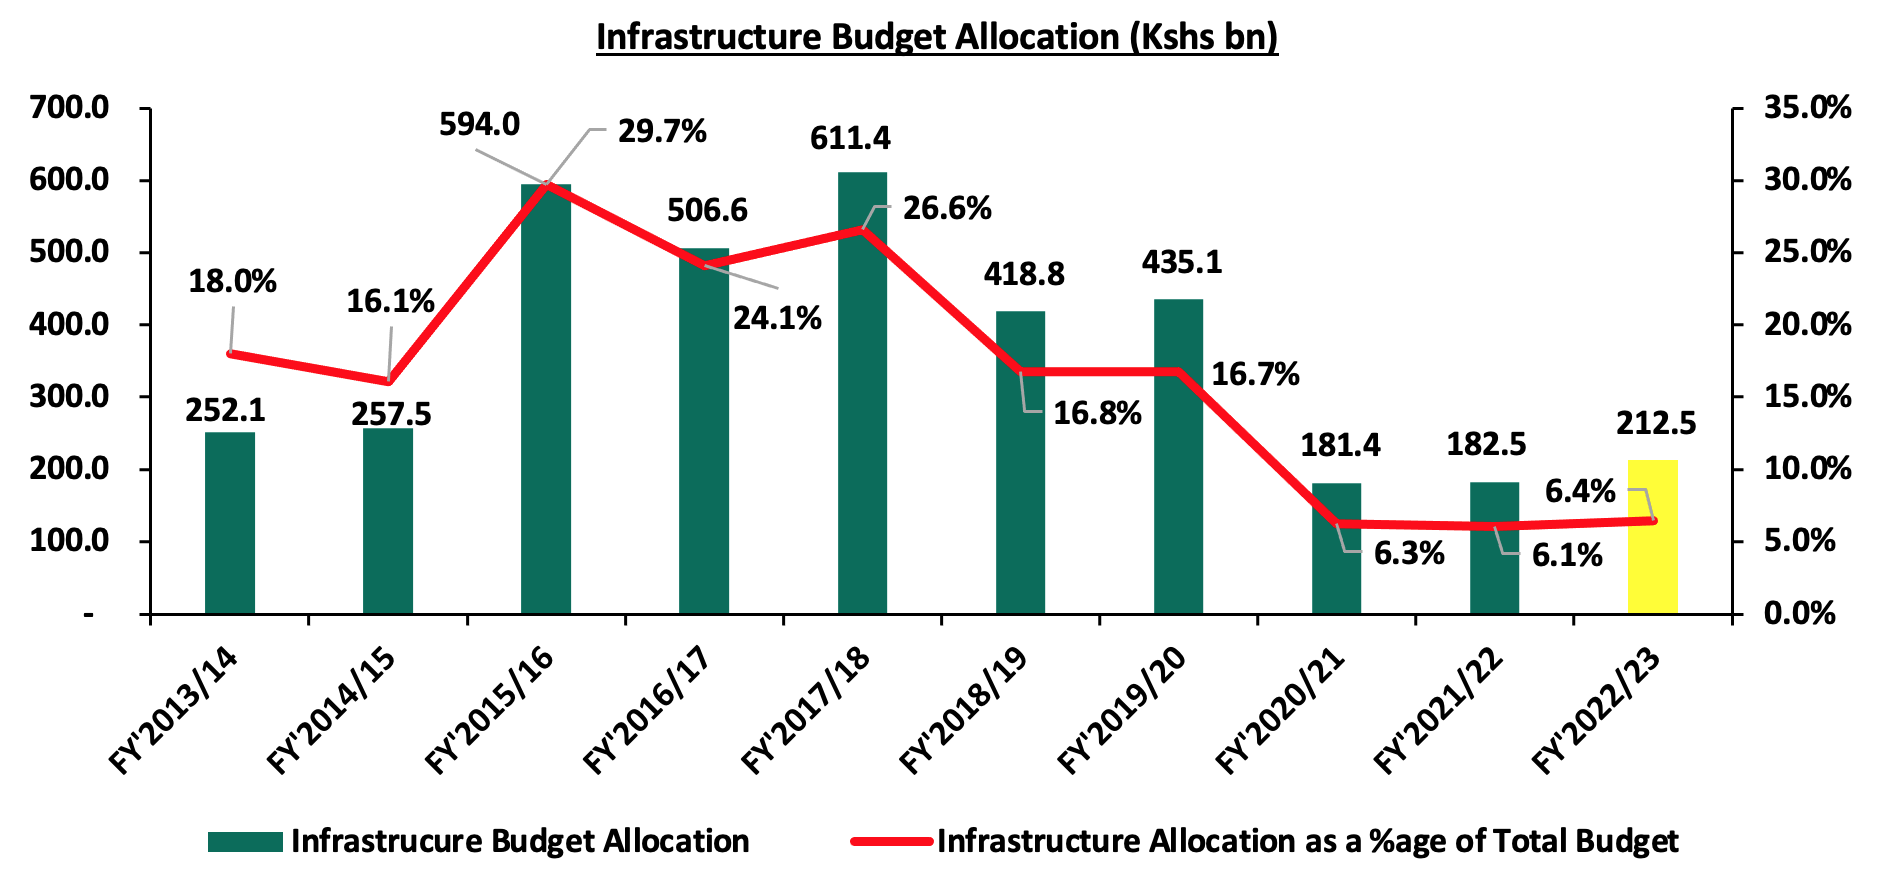
Source: The National Treasury
Section III: Key focus area for the next government
In light of the above, we expect the incoming government to implement its manifesto bearing in mind the key areas that need immediate and full attention to ensure that the country does not lag behind or suffer the consequences of delayed action. The following are the key economic areas we expect the incoming government to focus on, in a bid to steer development:
- Economic growth
The Kenya’s economy is projected to grow at a rate of 5.5% and 5.0% in 2022 and 2023 respectively, which are lower rates than the 7.5% growth recorded in 2021 amid the continued rise in global fuel prices which have adverse effects on input cost for major sectors such as manufacturing, transport and energy. To support the growth, we expect the new government to;
- Put in place measures to support the Agricultural sector, which is Kenya’s largest contributor to GDP, having accounted for an average of 20.2% of the GDP in the last ten years. This can be accomplished by allocating more funds for development of irrigation schemes given the climatic changes that have seen erratic weather patterns leading to drought in most parts of the country. Additionally, we expect the government to support the sector by providing affordable inputs such as fertilizers, quality seeds as well as beneficial and reliable markets to sell the products,
- Formulate policies to enhance a more diversified economy with a key focus on improving the Kenya’s manufacturing sector in order to create an economy that is less dependent on agriculture. Key to note, the manufacturing sector contributes less than 10.0% to the country’s GDP, despite the fact that it could contribute more given the various opportunities available. This will consequently create more job opportunities as well as improve the country’s current account deficit through the increased exports as well as preserve our foreign exchange reserves,
- Increase access to affordable credit by continuous implementation of policy measures such as the Micro Small and Medium Enterprises (MSMEs) Credit Guarantee Scheme aimed at supporting small and medium enterprises,
- Enhance ease of doing business in the country by eliminating unnecessary through incorporating use of technology in registration of businesses as well as tax remittances. We also expect the government to balance effective tax revenue collections and promote a business-friendly environment, and,
- Promote entrepreneurship and innovation aimed at increasing development of new businesses in order to stimulate more output and expand the number of transactions of goods and services in the economy.
- Government borrowing and debt sustainability
The country’s debt stock stood at Kshs 8.6 tn as of May 2022, equivalent to 69.1% of GDP and 19.1% points above the IMF recommended threshold of 50.0% for developing nations. Given the high debt levels as well as the ever present fiscal deficit, we expect the incoming government to work on strategies to reduce the over-reliance on debt by;
- Enhancing fiscal consolidation efforts aimed at addressing the high fiscal deficit arising from the higher government expenditure as compared to the revenue collections which has continued to be the main driver of the high borrowing levels. The incoming government can bridge the deficit gap by instituting austerity measures, reducing amounts extended to recurrent expenditure and focus on developments that will give back to the economy,
- Diversification of funding of projects by removing bottlenecks to Private Public Partnerships (PPPs) and joint ventures in order to attract more private sector involvement in funding development projects such as infrastructure instead of borrowing,
- Continue implementation of tax measures aimed at expanding the tax base as well as compliance in order to increase revenue collection and reduce dependence on debt as high level of debt reduces the prospects of economic growth since large portion of revenues go to servicing of the existing debts, and,
- Strengthening our Capital Markets in order to ease the pooling of funds by investors to undertake development projects given that capital markets remain dormant as banks continue to dominate the market.
- Currency performance
The Kenya shilling has remained under pressure as a result of increased dollar demand from the oil and energy sectors as well as general importers given that Kenya is predominantly a net importer. Despite the fact that the current pressure on the Kenyan shilling is unlikely to abate in the near term, there are actionable steps that can be taken by the incoming Government to mitigate further depreciation of the shilling. These include;
- Reduction of commercial loans which attract high interest rates as compared to concessional borrowing so as to reduce debt servicing costs. Reduced debt service amounts would greatly help to bring down demand for the dollar and stabilize the exchange rate,
- Improve economic self-sufficiency in areas such as agriculture so that we reduce the amount of imports only to goods that we must import,
- Building an export driven economy by formulating and implementing robust export oriented policies and manufacturing to increase exports aimed at reducing the current account while reducing overreliance on imports to preserve our foreign exchange reserves, and,
- Work with the private sector to maximize Kenyans living abroad investments in the countryin a bid to develop, promote and implement an active diaspora investment strategy and engagement.
- Private sector growth
The private sector continues to provide employment opportunities in the country as well as provide more sources for revenue collection. The government can support the sector by making credit more accessible and providing a business-friendly environment. Below are some of the initiatives that the government can adopt to support private sector growth;
- Customer education aimed at educating the public and providing guidelines on financial decisions as well as the available funding sources. This will enable borrowers to acquire knowledge on issues like how to access credit, the use of collateral, and establishing a strong credit history. The move will also increase financial literacy which will help borrowers analyse credit in terms of the costs associated and terms given by the lending institutions. This can be achieved by means such as introducing a website that breaks down the key fundamentals and guidelines on the basic information that consumers need to be able to make informed financial decisions,
- Increase competition to reduce over-reliance on banks given that banks account for 99.0% of all funding, while only 1.0% comes from non-bank institutional funding. The incoming government can balance funding sources by diversifying non-bank funding, allowing borrowers to access more flexible and cost-effective funding options, and,
- Establishment of a strong consumer protection agency and frameworkthat implements and enforces consumer financial law and ensures that markets for consumer financial products are fair, transparent, and competitive. This will promote robust disclosures on credit costs, free and accessible consumer education, and enforcement of disclosures on borrowings and interest rates, as well as the handling of consumer complaints and concerns.
Conclusion
We applaud the Jubilee government for the various accomplishments it has made over the last ten years, with emphasis on infrastructural development, steady economic growth, and increased revenue collection. However, we note that the incoming government has a significant role to play in stabilizing the country’s debt sustainability levels as well as lowering the elevated cost of living. Additionally, the increasing debt levels pose a risk of debt distress as the country continues to face unprecedented external shocks. In our view, the incoming government has limited choices but to focus on ways to boost economic growth, in a bid to reduce the over reliance on debt which stands out as the most critical issue for the country. However, the government will still be faced by various challenges such as the persistent supply chain bottlenecks, high debt servicing costs and the resurgence of COVID-19 infections which continue to disrupt the country’s and its trading partner’s economies.
Disclaimer: The views expressed in this publication are those of the writers where particulars are not warranted. This publication, which is in compliance with Section 2 of the Capital Markets Authority Act Cap 485A, is meant for general information only and is not a warranty, representation, advice or solicitation of any nature. Readers are advised in all circumstances to seek the advice of a registered investment advisor.

- Talk to us
- Kenya
- P.O Box 20695 - 00200, Nairobi, Kenya
- Cell +254709101200
- Tel +254709101200
- WhatsApp +254741676635
- United States
- +254709101200
- DOWNLOAD OUR APP
-


- Kenya
- 8th Floor, Pinetree Plaza, Kaburu Drive, Ngong Road, Nairobi, Kenya
- USA
- Suite 1150, 1775 Eye Street NW, USA, Washington DC 20006, USA
- Investments
- High Yield
- Private Equity
- Real Estate
- Real Estate
- RiverRun Estates
- Cytonn Towers
- The Ridge
- Taraji Heights
- The Alma