Private Placements in Kenya, & Cytonn Weekly #19/2025
By Research Team, May 11, 2025
Executive Summary
Fixed Income
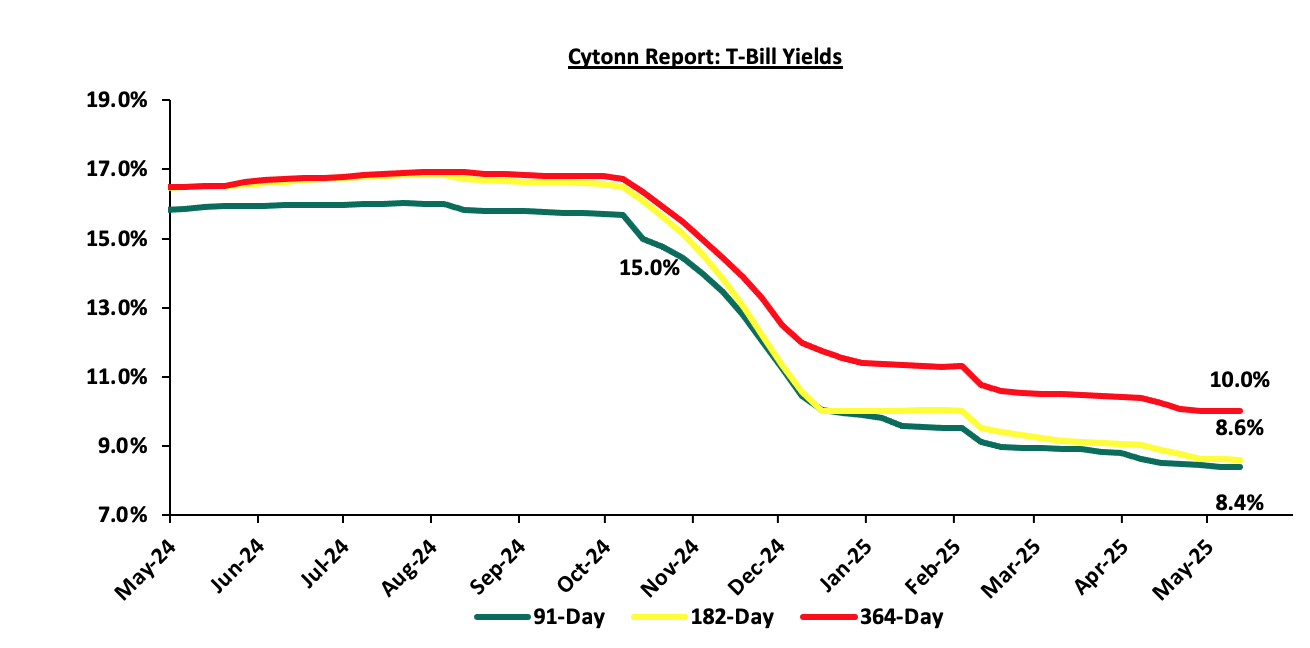
During the week, T-bills were oversubscribed for the first time in one week, with the overall subscription rate coming in at 219.5%, higher than the subscription rate of 76.6% recorded the previous week. Investors’ preference for the shorter 91-day paper persisted, with the paper receiving bids worth Kshs 10.3 bn against the offered Kshs 4.0 bn, translating to an oversubscription rate of 258.4%, significantly higher than the undersubscription rate of 54.6% recorded the previous week. The subscription rates for the 182-day and 364-day papers increased to 208.3% and 215.0% respectively from the 149.1% and 12.8% respectively recorded the previous week. The government accepted a total of Kshs 50.7 bn worth of bids out of Kshs 52.7 bn bids received, translating to an acceptance rate of 96.3%. The yields on the government papers recorded a mixed performance with the yields on the 91-day paper decreasing the most by 2.4 bps to 8.38% from the 8.41% recorded the previous week while the yields on the 182-day paper decreased by 1.8 bps to 8.60% from the 8.62% recorded the previous week. The yields on the 364-day paper increased by 0.4 bps to remain unchanged from the 10.0% recorded the previous week;
During the week the Central Bank of Kenya released the auction results for the re-opened treasury bond FXD1/2012/020 with a tenor to maturity of 7.6 years and a fixed coupon rate of 12.0%. The bond was oversubscribed, with the overall subscription rate coming in at 181.3%, receiving bids worth Kshs 54.4 bn against the offered Kshs 30.0 bn. The government accepted bids worth Kshs 43.5 bn, translating to an acceptance rate of 80.0%. The weighted average yield for the accepted bids for the FXD1/2012/020 came in at 13.6% higher than the 12.6% recorded the last time it was reopened in February 2021. With the Inflation rate at 4.1% as of April 2025, the real returns of the FXD1/2012/020 is 9.5%. Given the 10.0% withholding tax on the bonds, the tax effected yield is 15.2%.
During the week, Stanbic Bank released its monthly Purchasing Manager's Index (PMI) highlighting that the index for the month of April 2025 increased slightly, coming in at 52.0, up from 51.7 in March 2025, signaling another improvement in business conditions. This marked the seventh consecutive month that index fell above the 50.0 neutral mark. Increased output, new orders and increased sales supported the improvement;
During the week the Kenya National Bureau of Statistics (KNBS) released the 2025 Economic Survey Report, highlighting that the Kenyan economy recorded a 4.7% growth in FY’2024, slower than the 5.7% growth recorded in FY’2023. The main contributor to Kenyan GDP remains to be the Agriculture, fishing and forestry sector which grew by 4.6% in FY’2024, lower than the 6.6% expansion recorded in FY’2023. All sectors in FY’2024, except Mining and Quarrying and Construction recorded positive growths, with varying magnitudes across activities. Most sectors recorded declining growth rates compared to FY’2023 with Accommodation and Food Services, Construction and Information and Communication recording the highest declines of 7.9%, 3.7% and 3.3% points, respectively. Other sectors that recorded a contraction in growth rate, from what was recorded in FY’2023 were Professional administration, Mining and Quarrying and Financial and Insurance services of 3.3%, 2.7% and 2.5% points respectively
During the week, the Kenya National Bureau of Statistics released the FY’2024 Economic Survey noting that, Kenya’s balance of payments position improved significantly by 231.0% in FY’2024, with a surplus of Kshs 176.7 bn, from a deficit of Kshs 134.8 bn in FY’2023.
Equities
During the week, the equities market was on an upward trajectory, with NASI gaining the most by 1.0% while NSE 10, NSE 25 and NSE 20 gained by 0.9%, 0.5% and 0.1% respectively, taking the YTD performance to gains of 2.5% and 1.2% for NSE 20 and NASI, and losses of 3.2% and 1.8% for NSE 10 and NSE 25 respectively. The equities market performance was driven by gains recorded by large-cap stocks such as Equity, Safaricom and EABL 2.9%, 2.8%, and 1.5%, respectively. The performance was however weighed down by losses recorded by large cap stocks such as Absa Bank Kenya, Standard Chartered Bank Kenya and Diamond Trust Bank Kenya of 3.2%, 2.9% and 2.4% respectively;
Additionally, in the regional equities market, the East African Exchanges 20 (EAE 20) share index remained relatively unchanged during the week, attributable to losses recorded by large cap stocks such Airtel Uganda, Absa Bank Kenya and CRDB Bank of 5.7%, 3.1% and 3.0% respectively, that were matched by the gains recorded by large cap stocks such as Equity Group, Safaricom and Stanbic Uganda of 3.1%, 2.9% and 2.3% respectively;
During the week Stanbic Bank Kenya released Q1’2025 financial results, Stanbic Holding’s Profit After Tax (PAT) decreased by 16.6% to Kshs 3.3 bn, from Kshs 4.0 bn in Q1’2023. The performance was mainly driven by a 13.6% increase in Total Operating Expense to Kshs 5.5 bn, from Kshs 4.8 bn in Q1’2024, coupled with the decrease in Total Operating Income by 7.1% to Kshs 9.5 bn in Q1’2024, from Kshs 10.3 bn in Q1’2024.The increase in Operating Expense was largely driven by the 9.1% increase in Staff Cost to Kshs 2.1 bn from Kshs 1.9 bn in Q1’2024.
During the week, Safaricom Plc released its FY’2025 financial results for the period ending 31st March 2025, highlighting that the profit after tax (PAT) for the Group increased by 7.3% to Kshs 45.8 bn, from 42.7 bn recorded in FFY’2024, largely attributable to a 11.2% increase in Total Revenue to Kshs 388.7 bn from Kshs 349.4 bn recorded in FY’2024, The performance was however weighed down by aa 16.3% increase in Operating cost to Kshs 216.5 bn from 186.2 bn recorded in FY’2024;
Real Estate
During the week, The Kenya National Bureau of Statistics (KNBS) 2025 Economic Survey provides insights into the performance of various economic sectors in Kenya for 2024 and the performance of various sectors to the GDP
During the week, the National Treasury projected a collection of Kshs 95.8 bn from the housing development levy in financial year starting July, signalling a boost to President’s plan to put up 200,000 subsidised houses annually for middle- and lower-income households.
Additionally, during the week, the government tabled a Kshs 119.6 bn budget for the State Department for Housing and Urban Development for the 2025/26 financial year, including Kshs2.8 bn for research and feasibility studies to support the Affordable Housing Programme.
Also, during the week, the National Treasury proposed an allocation of Kshs 16.5 bn to fund the extension of the Standard Gauge Railway (SGR) from Naivasha to Kisumu and Malaba, bringing closer to fruition the dream of having a smooth rail transport from the Mombasa port to Malaba.
On the Unquoted Securities Platform, Acorn D-REIT and I-REIT traded at Kshs 26.7 and Kshs 22.9 per unit, respectively, as per the last updated data on 2nd May 2025. The performance represented a 33.5% and 14.5% gain for the D-REIT and I-REIT, respectively, from the Kshs 20.0 inception price. Additionally, ILAM Fahari I-REIT traded at Kshs 11.0 per share as of 2nd May 2025, representing a 45.0% loss from the Kshs 20.0 inception price. The volume traded to date came in at 138,600 shares for the I-REIT, with a turnover of Kshs 1.5 mn since inception in November 2015;
Focus of the Week
Private placements or non-public offerings are a method of raising capital by selling securities directly to a chosen or pre-determined number of investors rather than through a public offering. Private placements have emerged as a vital component of capital raising in Kenya’s financial markets, especially in an environment where traditional public offerings face stringent regulatory requirements, prolonged approval timelines, and market volatility. We chose to cover this topic to demystify a financial mechanism that remains under-discussed yet widely used by both private and public sector players, to equip investors, issuers, and other stakeholders with the knowledge required to assess the suitability of private placements as a financing tool, particularly given the Government of Kenya’s USD 500.0 mn amortizing note issued via private placement in April 2025. With the Kenyan economy in a state of recovery and transition, businesses and the government need flexible, accessible, and efficient ways of raising capital;
Investment Updates:
- Weekly Rates: Cytonn Money Market Fund closed the week at a yield of 13.7 % p.a. To invest, dial *809# or download the Cytonn App from Google Play store here or from the Appstore here;
- We continue to offer Wealth Management Training every Tuesday, from 7:00 pm to 8:00 pm. The training aims to grow financial literacy among the general public. To register for any of our Wealth Management Trainings, click here;
- If interested in our Private Wealth Management Training for your employees or investment group, please get in touch with us through wmt@cytonn.com;
- Cytonn Insurance Agency acts as an intermediary for those looking to secure their assets and loved ones’ future through insurance namely; Motor, Medical, Life, Property, WIBA, Credit and Fire and Burglary insurance covers. For assistance, get in touch with us through insuranceagency@cytonn.com;
- Cytonn Asset Managers Limited (CAML) continues to offer pension products to meet the needs of both individual clients who want to save for their retirement during their working years and Institutional clients that want to contribute on behalf of their employees to help them build their retirement pot. To more about our pension schemes, kindly get in touch with us through pensions@cytonn.com;
Hospitality Updates:
- We currently have promotions for Staycations. Visit cysuites.com/offers for details or email us at sales@cysuites.com;
Money Markets, T-Bills Primary Auction:
During the week, T-bills were oversubscribed for the first time in one week, with the overall subscription rate coming in at 219.5%, higher than the subscription rate of 76.6% recorded the previous week. Investors’ preference for the shorter 91-day paper persisted, with the paper receiving bids worth Kshs 10.3 bn against the offered Kshs 4.0 bn, translating to an oversubscription rate of 258.4%, significantly higher than the undersubscription rate of 54.6% recorded the previous week. The subscription rates for the 182-day and 364-day papers increased to 208.3% and 215.0% respectively from the 149.1% and 12.8% respectively recorded the previous week. The government accepted a total of Kshs 50.7 bn worth of bids out of Kshs 52.7 bn bids received, translating to an acceptance rate of 96.3%. The yields on the government papers recorded a mixed performance with the yields on the 91-day paper decreasing the most by 2.4 bps to 8.38% from the 8.41% recorded the previous week while the yields on the 182-day paper decreased by 1.8 bps to 8.60% from the 8.62% recorded the previous week. The yields on the 364-day paper increased by 0.4 bps to remain unchanged from the 10.0% recorded the previous week
The chart below shows the yield performance of the 91-day, 182-day and 364-day papers from January 2024 to May 2025:
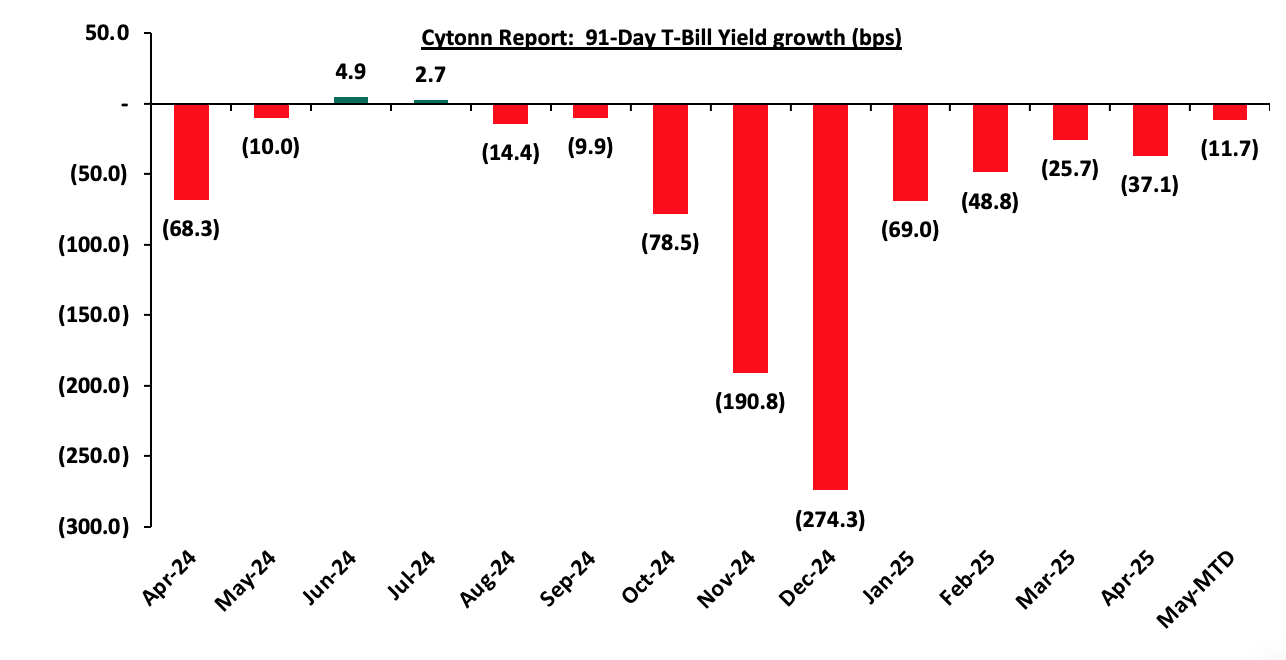
The chart below shows the yield growth for the 91-day T-bill:
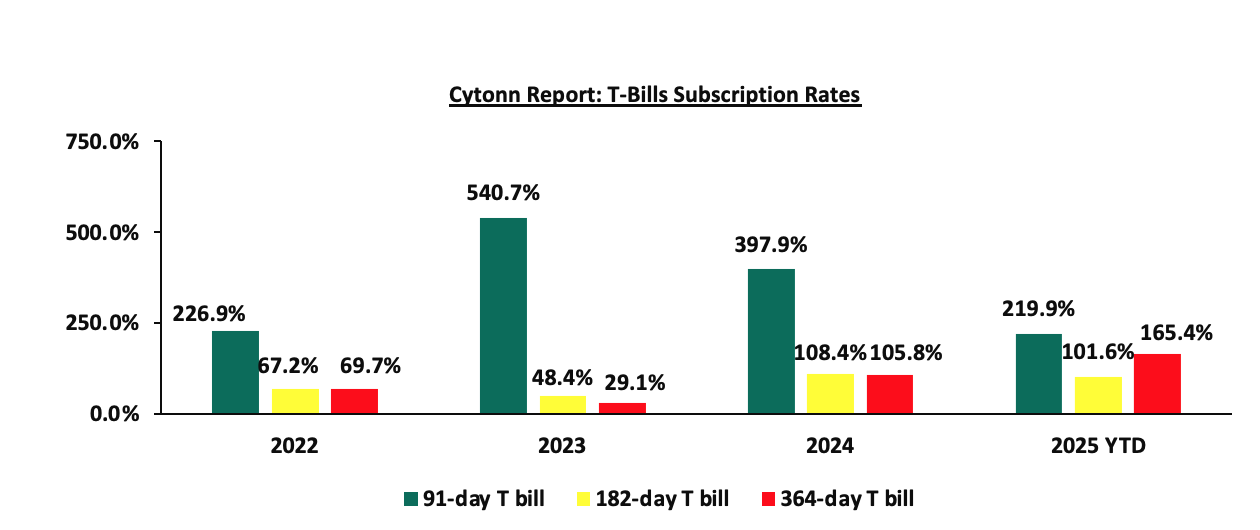
The chart below compares the overall average T-bill subscription rates obtained in 2022,2023, 2024 and 2025 Year-to-date (YTD):
In the primary bond market, The Central Bank of Kenya released the auction results for the re-opened treasury bond FXD1/2012/020 with a tenor to maturity of 7.6 years and a fixed coupon rate of 12.0%. The bond was oversubscribed, with the overall subscription rate coming in at 181.3%, receiving bids worth Kshs 54.4 bn against the offered Kshs 30.0 bn. The government accepted bids worth Kshs 43.5 bn, translating to an acceptance rate of 80.0%. The weighted average yield for the accepted bids for the FXD1/2012/020 came in at 13.6% higher than the 12.6% recorded the last time it was reopened in February 2021. With the Inflation rate at 4.1% as of April 2025, the real returns of the FXD1/2012/020 is 9.5%. Given the 10.0% withholding tax on the bonds, the tax effected yield is 15.2%.
Money Market Performance:
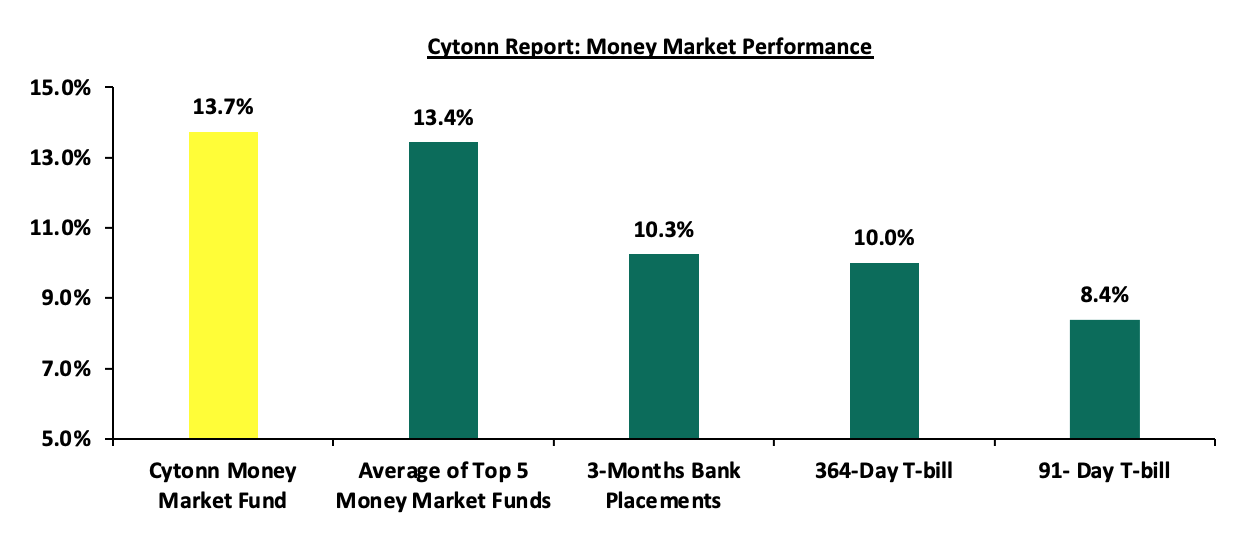
In the money markets, 3-month bank placements ended the week at 10.3% (based on what we have been offered by various banks) and the yields on the government papers recorded a mixed performance with the yields on the 91-day paper decreasing the most by 2.4 bps to 8.38% from the 8.41% recorded the previous week while the yields on the 364-day paper increased by 0.4 bps to remain unchanged from the 10.0% recorded the previous week. The yield on the Cytonn Money Market Fund decreased by 11.0 bps to 13.7% from the 13.9% recorded the previous week, while the average yields on the Top 5 Money Market Funds increased by 5.6 bps to close the week at 13.4%, relatively unchanged from the previous week.
The table below shows the Money Market Fund Yields for Kenyan Fund Managers as published on 9th May 2025:
|
Cytonn Report: Money Market Fund Yield for Fund Managers as published on 9th May 2025 |
||
|
Rank |
Fund Manager |
Effective Annual Rate |
|
1 |
Gulfcap Money Market Fund |
13.9% |
|
2 |
Cytonn Money Market Fund ( Dial *809# or download Cytonn App) |
13.7% |
|
3 |
Kuza Money Market fund |
13.5% |
|
4 |
Orient Kasha Money Market Fund |
13.1% |
|
5 |
Ndovu Money Market Fund |
13.1% |
|
6 |
Etica Money Market Fund |
13.0% |
|
7 |
GenAfrica Money Market Fund |
13.0% |
|
8 |
Lofty-Corban Money Market Fund |
12.9% |
|
9 |
Enwealth Money Market Fund |
12.3% |
|
10 |
British-American Money Market Fund |
12.2% |
|
11 |
Old Mutual Money Market Fund |
12.1% |
|
12 |
Madison Money Market Fund |
11.8% |
|
13 |
Arvocap Money Market Fund |
11.5% |
|
14 |
Jubilee Money Market Fund |
11.4% |
|
15 |
Nabo Africa Money Market Fund |
11.3% |
|
16 |
Faulu Money Market Fund |
11.2% |
|
17 |
Dry Associates Money Market Fund |
11.2% |
|
18 |
Sanlam Money Market Fund |
11.1% |
|
19 |
Apollo Money Market Fund |
10.6% |
|
20 |
CIC Money Market Fund |
10.5% |
|
21 |
KCB Money Market Fund |
10.2% |
|
22 |
Co-op Money Market Fund |
10.2% |
|
23 |
Mali Money Market Fund |
10.0% |
|
24 |
Genghis Money Market Fund |
10.0% |
|
25 |
Absa Shilling Money Market Fund |
9.7% |
|
26 |
Mayfair Money Market Fund |
9.3% |
|
27 |
ICEA Lion Money Market Fund |
9.1% |
|
28 |
AA Kenya Shillings Fund |
8.2% |
|
29 |
Stanbic Money Market Fund |
7.7% |
|
30 |
Ziidi Money Market Fund |
7.1% |
|
31 |
Equity Money Market Fund |
5.5% |
Source: Business Daily
Liquidity:
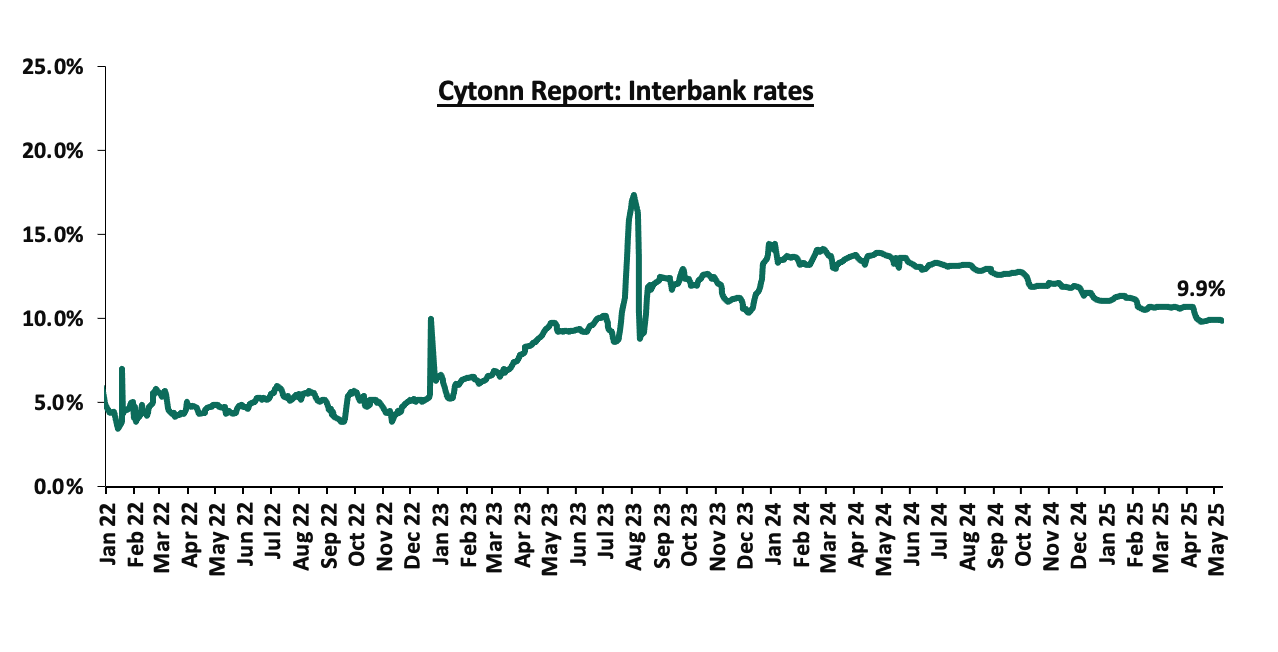
During the week, liquidity in the money markets marginally eased, with the average interbank rate decreasing by 3.6 bps, to remain relatively unchanged from the 9.9% recorded the previous week, partly attributable to tax remittances that were offset by government payments. The average interbank volumes traded decreased by 41.2% to Kshs 9.8 bn from Kshs 16.7 bn recorded the previous week. The chart below shows the interbank rates in the market over the years:
Kenya Eurobonds:
During the week, the yields on Kenya’s Eurobonds were on a downward trajectory with the yield on the 7-year Eurobond issued in 2019 decreasing the most by 37.3 bps to 8.1% from the 8.4% recorded the previous week. The table below shows the summary performance of the Kenyan Eurobonds as o 8th May 2025;
|
Cytonn Report: Kenya Eurobonds Performance |
|
||||||
|
|
2018 |
2019 |
2021 |
2024 |
2025 |
||
|
Tenor |
10-year issue |
30-year issue |
7-year issue |
12-year issue |
13-year issue |
7-year issue |
11-year issue |
|
Amount Issued (USD) |
1.0 bn |
1.0 bn |
0.3 bn |
1.2 bn |
1.0 bn |
1.5 bn |
1.5 bn |
|
Years to Maturity |
2.9 |
22.9 |
2.1 |
7.1 |
9.2 |
5.8 |
11.0 |
|
Yields at Issue |
7.3% |
8.3% |
7.0% |
7.9% |
6.2% |
10.4% |
9.9% |
|
02-Jan-25 |
9.1% |
10.3% |
8.5% |
10.1% |
10.1% |
10.1% |
|
|
01-May-25 |
10.1% |
11.4% |
8.4% |
11.1% |
10.9% |
11.2% |
|
|
02-May-25 |
9.8% |
11.3% |
8.2% |
10.9% |
10.7% |
11.0% |
|
|
05-May-25 |
10.0% |
11.3% |
8.4% |
11.0% |
10.8% |
11.1% |
|
|
06-May-25 |
9.9% |
11.3% |
8.3% |
10.9% |
10.7% |
11.1% |
|
|
07-May-25 |
9.8% |
11.2% |
8.0% |
10.8% |
10.6% |
10.8% |
|
|
08-May-25 |
9.8% |
11.2% |
8.1% |
10.8% |
10.6% |
10.9% |
10.0% |
|
Weekly Change |
(0.3%) |
(0.3%) |
(0.4%) |
(0.3%) |
(0.2%) |
(0.3%) |
- |
|
MTD Change |
(0.3%) |
(0.3%) |
(0.4%) |
(0.3%) |
(0.2%) |
(0.3%) |
- |
|
YTD Change |
(9.1%) |
(10.3%) |
(8.5%) |
(10.1%) |
(10.1%) |
(10.1%) |
- |
Source: Central Bank of Kenya (CBK) and National Treasury
Kenya Shilling:
During the week, the Kenyan Shilling appreciated against the US Dollar by 18.1 bps, to Kshs 129.3 from the Kshs 129.5 recorded the previous week. On a year-to-date basis, the shilling has appreciated by 3.1 bps against the dollar, compared to the 17.4% appreciation recorded in 2024.
We expect the shilling to be supported by:
- Diaspora remittances standing at a cumulative USD 4,972.0 mn in the twelve months to March 2025, 13.5% higher than the USD 4,380.0 mn recorded over the same period in 2024. These has continued to cushion the shilling against further depreciation. In the March 2025 diaspora remittances figures, North America remained the largest source of remittances to Kenya accounting for 53.0% in the period,
- The tourism inflow receipts which came in at Kshs 452.2 bn in 2024, a 19.8% increase from Kshs 377.5 bn inflow receipts recorded in 2023, and owing to tourist arrivals that improved by 14.6% to 2,394,376 in 2024 from 2,089,259 in 2023, and,
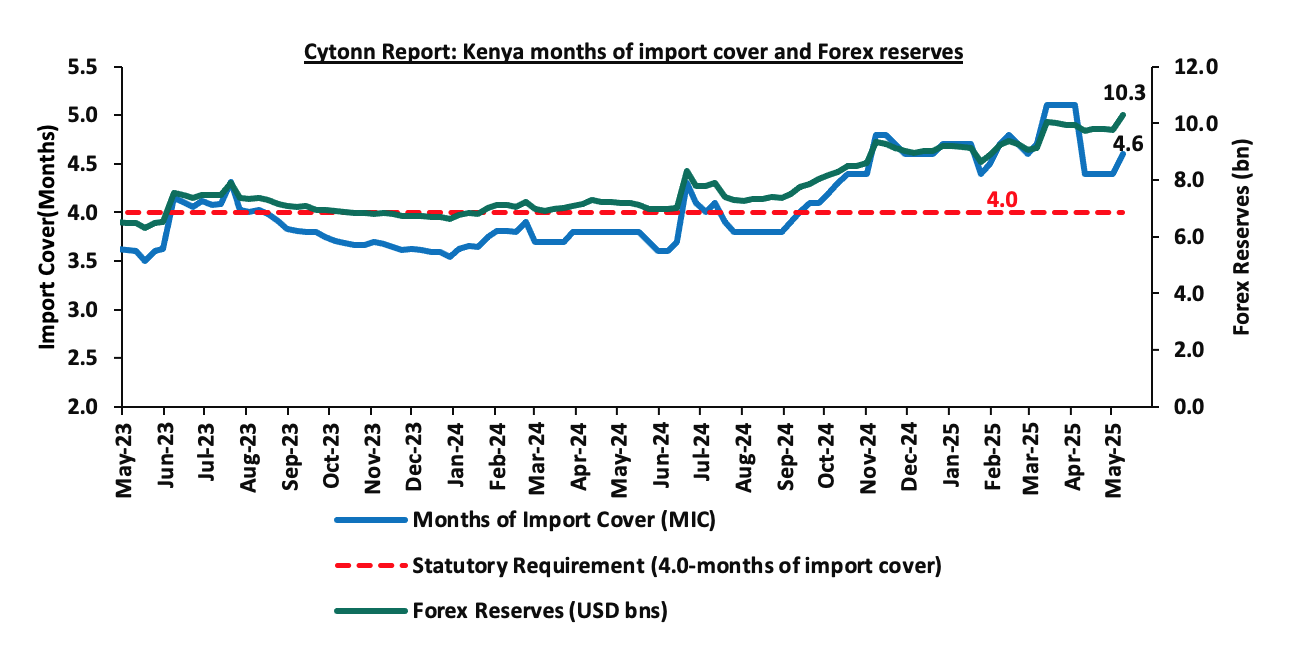
- Improved forex reserves currently at USD 10.3 bn (equivalent to 4.6-months of import cover), which is above the statutory requirement of maintaining at least 4.0-months of import cover and below the EAC region’s convergence criteria of 4.5-months of import cover.
The shilling is however expected to remain under pressure in 2025 as a result of:
- An ever-present current account deficit which came at 3.1% of GDP in the twelve months to February 2025, and,
- The need for government debt servicing, continues to put pressure on forex reserves given that 62.1% of Kenya’s external debt is US Dollar-denominated as of September 2024.
Key to note, Kenya’s forex reserves increased by 5.6% during the week, to USD 10.3 bn from USD 9.7 bn recorded in the previous week, equivalent to 4.6 months of import cover (based on updated import data), to remain also relatively unchanged from the months of import cover recorded last week, and above the statutory requirement of maintaining at least 4.0-months of import cover.
The chart below summarizes the evolution of Kenya's months of import cover over the years:
Weekly Highlights
- Stanbic Bank’s April 2025 Purchasing Manager’s Index (PMI)
In April 2025, the Stanbic Bank Kenya PMI showed an improvement in business conditions, coming in at 52.0, up from 51.7 in March 2025, signaling another improvement in business conditions. This marked the seventh month that index fell above the 50.0 neutral mark. Increased output, new orders and increased sales supported the improvement. On a year-to-year basis, the index recorded 3.8% points increase from the 50.1 recorded in April 2024. The modest improvement of the general business environment is mainly attributable to inflation remaining relatively low in April coming in at 4.1%, remaining within the Central Bank of Kenya (CBK) target range of 2.5% to 7.5% for the twenty second consecutive month. However, this was a slight increase of 0.5% points from 3.6% in March 2025 attributable to increase in prices of commodities in Food & Non-Alcoholic Beverages, Transport sector and Housing, water, electricity, gas and other fuels by 7.1%, 2.3% and 0.8% respectively. The lower Central Bank Rate (CBR) at 10.00% led to reduced borrowing costs, further promoting improved business activity.
In April, input purchases increased sharply due to a surge in sales volumes, prompting firms to stockpile raw materials and key inputs, which led to a modest buildup of inventories, the fastest in six months. This purchasing activity, particularly strong in the services and agriculture sectors, was aimed at meeting higher workloads. The average input charges rose marginally, driven by a slight increase in purchase prices attributed to weaker input supply and higher taxation, although overall input price inflation remained modest and well below the long-term trend. Consequently, output prices also rose, marking the fastest increase in three months, with manufacturers being the most likely to pass on these costs.
Output increased for the sixth consecutive month, with over a third of firms recording growth, largely due to rising sales and improved customer turnout, though some firms still faced challenges due to economic pressures. New orders also expanded for the sixth straight month, at the fastest pace since February 2022, attributed to effective marketing efforts, favorable weather conditions, and acquisition of new customers. Despite overall growth, some businesses lowered their fees in response to inflation and customer cash flow constraints to stimulate demand.
Employment rose for the third month in a row, and although the increase was mild, it was the strongest since May 2024, with firms, especially in construction, services, and retail, mainly hiring temporary staff to handle rising workloads. Staff costs increased fractionally. While most sectors recorded higher output and sales, the manufacturing sector struggled with declines in both production and new orders. Private sector prices rose marginally for the fifth consecutive month, driven by increased purchase costs and taxation, although subdued input price inflation softened the impact. Despite the overall expansion, business sentiment remained among the weakest on record, with only 5.0% of firms expecting growth in the coming year, reflecting continued concerns over the broader economic outlook even as some companies invest in expansion through new outlets and product diversification. The PMI reading rose to 52.0 in April, its highest in 27 months, signaling continued improvement in business conditions
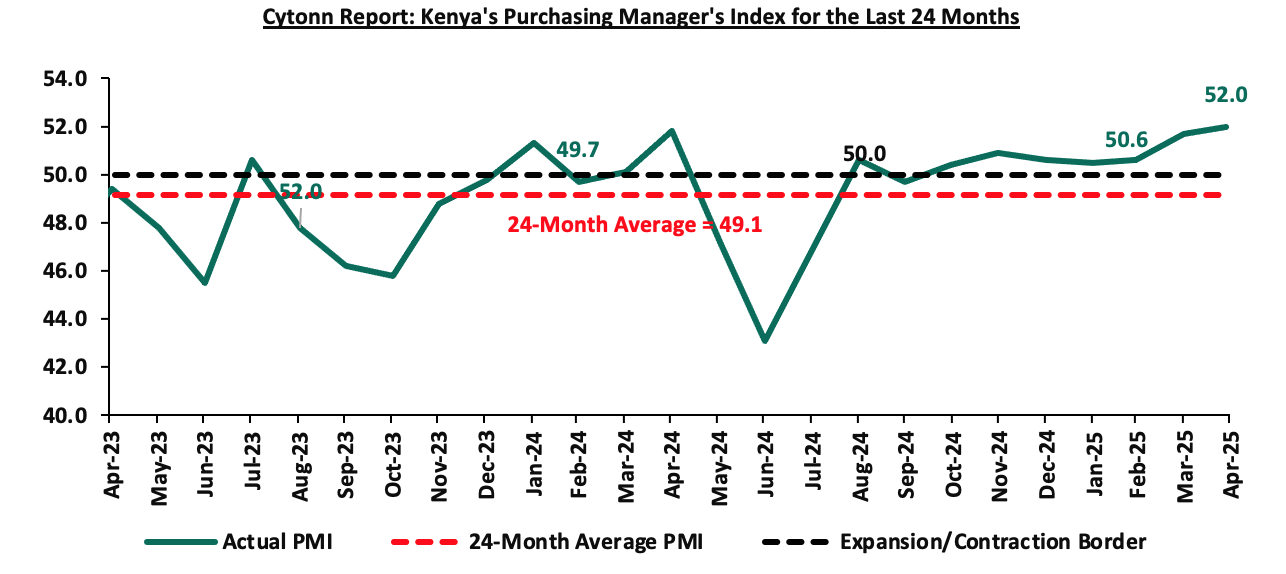
Going forward, we anticipate that the business environment will improve in the short to medium term as a result of the improving economic environment driven by lower interest rates following the easing monetary policy with the CBR decreasing by 75.0 bps to 10.00% in April 2025 from 10.75% in February 2025, the stability of the Kenyan Shilling against the USD, the low inflation rates currently at 4.1% and stable fuel prices. However, we expect businesses to be weighed down by the high cost of living coupled with the high taxation, which are set to increase input costs. Overall the private sector is expected to continue with the recovery albeit with potential headwinds in the coming months.
- FY’2024 GDP Highlight
The Kenya National Bureau of Statistics (KNBS) released the 2025 Economic Survey Report, highlighting that the Kenyan economy recorded a 4.7% growth in FY’2024, slower than the 5.7% growth recorded in FY’2023. The main contributor to Kenyan GDP remains to be the Agriculture, fishing and forestry sector which grew by 4.6% in FY’2024, lower than the 6.6% expansion recorded in FY’2023. All sectors in FY’2024, except Mining and Quarrying and Construction recorded positive growths, with varying magnitudes across activities. Most sectors recorded declining growth rates compared to FY’2023 with Accommodation and Food Services, Construction and Information and Communication recording the highest declines of 7.9%, 3.7% and 3.3% points, respectively. Other sectors that recorded a contraction in growth rate, from what was recorded in FY’2023 were Professional administration, Mining and Quarrying and Financial and Insurance services of 3.3%, 2.7% and 2.5% points respectively.
The key take-outs from the report include;
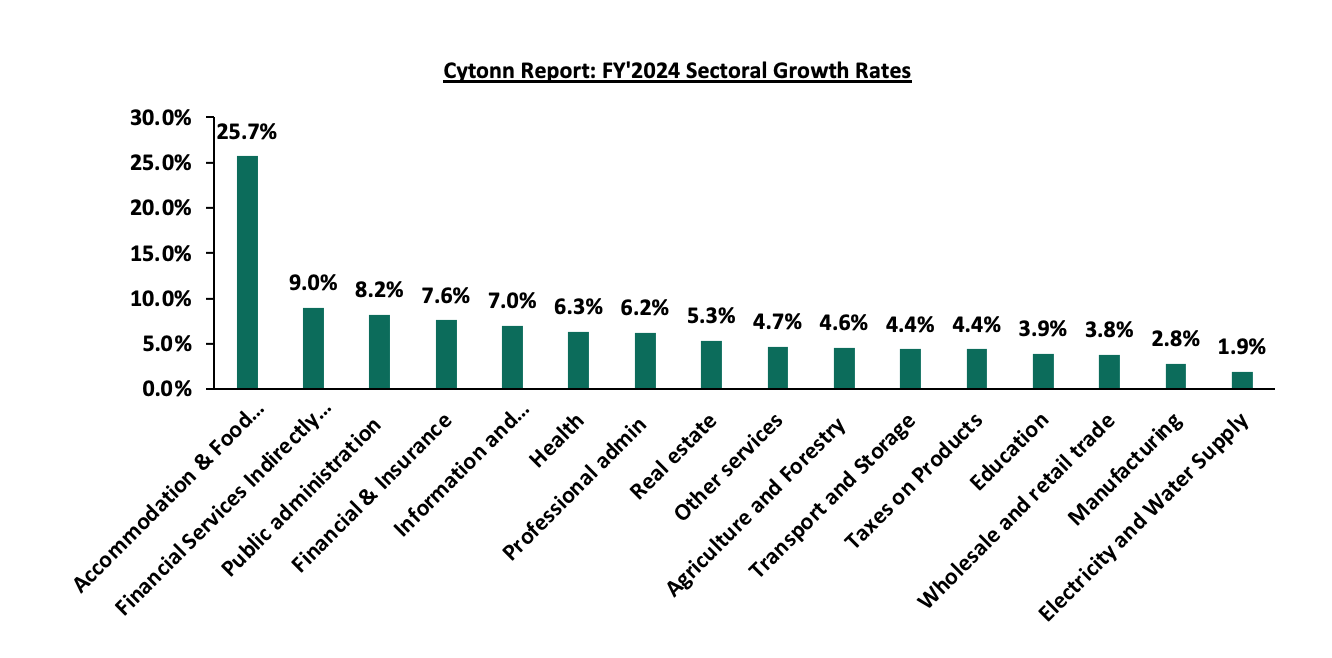
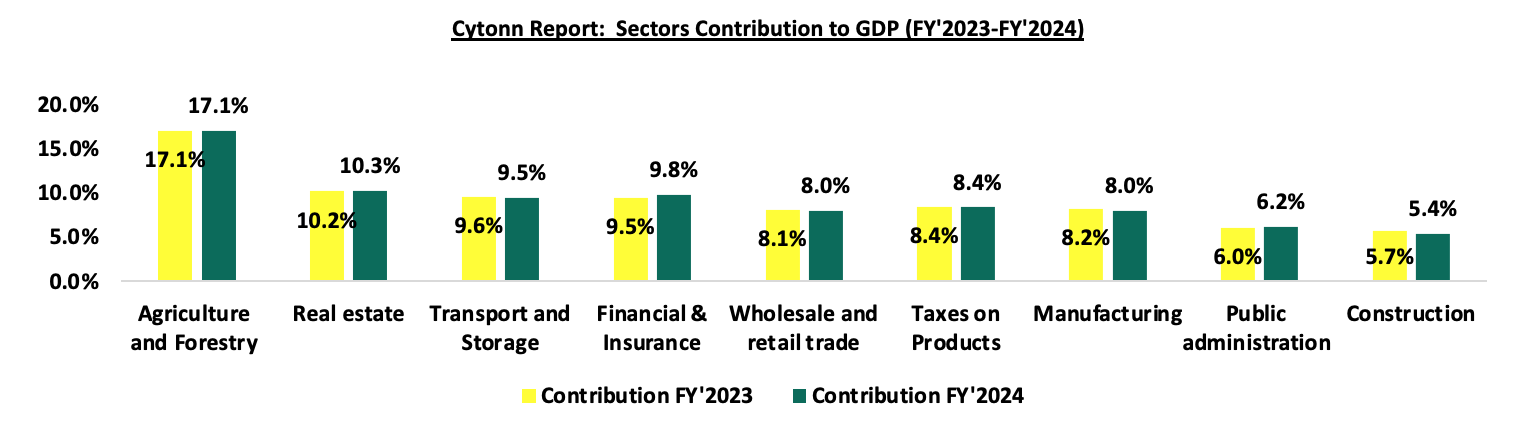
- Sectoral Contribution to Growth - The biggest gainer in terms of sectoral contribution to GDP was the Accommodation and food services sector, increasing by 0.3% points to 1.6% in FY’2024 from 1.3% in FY’2023, while the Construction was the biggest loser, declining by 0.3% points to 5.4% in FY’2024, from 5.7% in FY’2023. Real Estate was the second largest contributor to GDP at 10.3% in FY’2024, up from 10.2% recorded in FY’2023, indicating sustained growth. The Accommodation and Food Services sector recorded the highest growth rate in FY’2024 growing by 25.7%, albeit slower than the 33.6% growth recorded in FY’2023
The chart below shows the top contributors to GDP by sector in FY’2024:
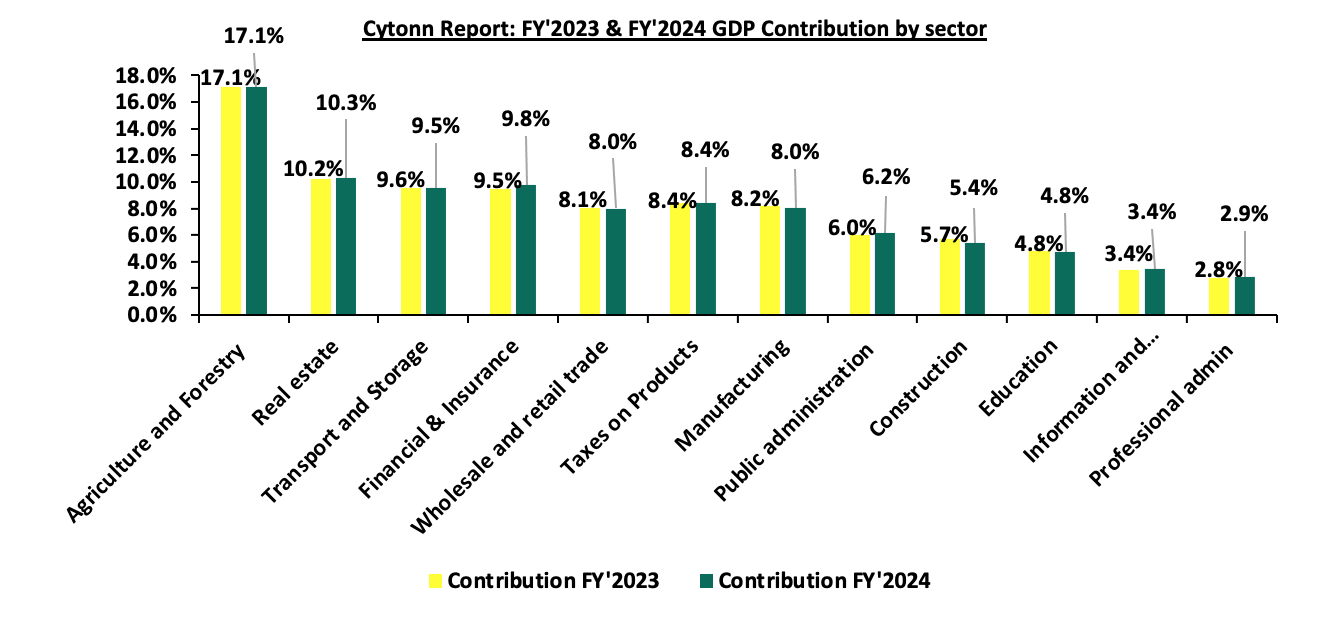
Source: KNBS FY’2023 and FY’2024 GDP Report
- Slowed growth in the Agricultural Sector – Agriculture and Forestry recorded a growth of 4.6% in FY’2024. The performance was a decrease of 2.0% points, from the expansion of 6.6% recorded in FY’2023. Additionally, the sector remains the major contributor to GDP, with the sectoral contribution to GDP marginally increasing by 0.03% to 14.5% in FY’2024, from 14.4% recorded in FY’2023.The positive growth recorded during the quarter was mainly attributable to favorable weather conditions that characterized the first three quarters of 2024. Notably, during the quarter, production of key food crops and cash crops increased with a significant increase in the production of sugarcane and coffee during the period under review. However, the performance was weighed down by decline in exports of fresh horticulture produce.
- Reduced growth in the Financial and Insurance Services Sector: The Financial and Insurance sector growth rate slowed down by 2.5% points to 7.6% in FY’2024 compared to the 10.1% in FY’2023, attributable to the rise in cost of credit during the period. Additionally, the contribution to GDP increased by 0.3% points to 9.8% in FY 2024 from the 9.5% recorded in FY’2023. Some of the notable improvements include:
- Broad money supply (M3) grew by 1.0% to Kshs 6.1 trillion as at end of December 2024, from Kshs 6.0 trillion recorded as at the end of December 2023.
- The NSE 20 Share Index rose by 33.9% to 2,010.7 points in December 2024 from 1,501.2 points in December 2023, signaling improved performance in the equity market.
- The number of shares traded in the Nairobi Securities Exchange increased significantly by 31.8% to 4,937.5 mn in December 2024 from 3745.2 million in December 2023. Similarly, the total value of traded shares increased by 20.2% in December 2024 to 106.0 billion from 88.2 billion in December 2023
- Decelerated growth in the electricity supply sector - The Electricity and Water Supply sector recorded a slowed growth of 1.9% in FY’2024 compared to a 3.2% growth in a similar in 2023, with the sectoral contribution to GDP marginally decreasing to 2.4% to 2.4% in FY’2024, relatively unchanged from FY’2023
- Significant growth in the Accommodation and Food Service sector: Accommodation and Food Services sector is the only sector that recorded double digit growth in FY’2024, having expanded by 25.7%, albeit slower than the 33.6% recorded in FY’2023. Additionally, the contribution to GDP increased by 0.3% points, to 1.6% in FY’2024, from 1.3% recorded in FY’2023.
- Continued growth in the Information and Communication sector: The Information and Communication sector recorded an expansion rate of 7.0% in FY’2024 albeit slower than the 10.3% growth recorded in the same period last year. Similarly, the contribution to GDP increased by 0.1% points, to remain unchanged from the 3.4% registered in FY’2023.
The chart below shows the different sectoral GDP growth rates for FY’2024:
Source: KNBS FY’2024 GDP Report
In 2025, Kenya's economy is projected to grow at a faster pace, estimated between 5.2%-5.4%. This optimistic outlook is attributed to improved business activity, supported by a stronger and more stable Kenyan Shilling, reduced borrowing costs, and the relatively lower inflation rates. However, the growth trajectory faces challenges from a tough business environment characterized by increasing taxes and a high cost of living. Despite these hurdles, recent economic developments provide a more favorable outlook. The Central Bank of Kenya (CBK) made a significant policy move in April 2025 by lowering the Central Bank Rate (CBR) by 75 basis points to 10.00%, marking the fifth consecutive rate cut. This accommodative monetary policy stance aims to stimulate private sector lending and boost economic activity. Inflation, while still within the CBK's target range of 2.5% to 7.5%, has been on an upward trend. In April 2025, the year-on-year inflation rate increased by 0.5% points to 4.1%, from 3.6% in March. This rise is primarily driven by higher food prices, particularly in the food and non-alcoholic beverages category. Despite the gradual rise, inflation remains well within the CBK's target range, providing some assurance for economic stability. The CBK's accommodative monetary policy is expected to alleviate some pressure on the cost of credit, thereby improving access to affordable borrowing. This environment is conducive to increased investment spending by both individuals and businesses, contributing positively to economic activity. The agricultural sector, Kenya's largest contributor to GDP, is anticipated to continue supporting growth due to favorable rainfall. While risks of rising fuel prices persist due to global geopolitical tensions, the overall inflation outlook is more favorable, bolstering optimism for the economic outlook.
- Kenya FY’2024 Balance of Payments
Kenya’s balance of payments position improved significantly by 231.0% in FY’2024, with a surplus of Kshs 176.7 bn, from a deficit of Kshs 134.8 bn in FY’2023. The y/y positive performance in BoP was mainly driven by a significant 722.9% increase in net errors and omissions by 722.9% to Kshs 107.8 bn from a deficit of Kshs 17.3 bn in FY’2023 coupled with an 81.0% improvement in the capital account balance to a surplus of 31.2 bn in FY’2024, from a Kshs 17.3 bn in FY’2023. The performance was however weighed down by a 0.6% deterioration in the financial account balance to a surplus of Kshs 246.5 bn from a surplus of Kshs 247.9 bn in FY’2023. The table below shows the breakdown of the various balance of payments components, comparing FY’2023 and FY’2024:
|
Item |
FY'2023 |
FY'2024 |
Y/Y % Change |
|
Current Account Balance |
(382.7) |
(208.9) |
45.4% |
|
Capital Account Balance |
17.3 |
31.2 |
81.0% |
|
Financial Account Balance |
247.9 |
246.5 |
(0.6%) |
|
Net Errors and Omissions |
(17.3) |
107.8 |
722.9% |
|
Balance of Payments |
(134.8) |
176.7 |
231.0% |
All values in Kshs bns
Key take-outs from the table include;
- The current account deficit (value of goods and services imported exceeds the value of those exported) narrowed by 45.4% to Kshs 208.9 bn from Kshs 382.7 bn in FY’2023. The y/y narrowing of the current account was brought about by the 37.4% improvement in the services trade balance to a surplus of Kshs 324.4 bn from a surplus of Kshs 236.1 bn in FY’2023, coupled with a 4.9% increase in secondary income/transfers to Kshs 1,025.7 bn from Kshs 977.6 bn in FY’2023,
- The capital account balance (shows capital transfers receivable and payable between residents and non-residents, including the acquisition and disposal of non-produced non-financial items), which includes foreign direct investments (FDIs), increased by 81.0% to a surplus of Kshs 31.2 bn in FY’2024 down from a surplus of Kshs 17.3 bn in FY’2023,
- The financial account balance (the difference between the foreign assets purchased by domestic buyers and the domestic assets purchased by foreign buyers) recorded a net inflow of Kshs 246.5 billion in FY’2024, compared to a net inflow of Kshs 247.9 billion in FY’2023, attributable to increased inflows of debt securities and other investments, in spite of the reduced loan disbursements to general government. In 2024, the government received credit and loans from the International Monetary Fund (IMF) worth Kshs 421.2 bn,
- Consequently, the Balance of Payments (BoP) position improved to a surplus of Kshs 176.7 bn in FY’2024, from a deficit of Kshs 134.8 bn recorded in FY’2023.
Current Account Balance
Kenya’s current account deficit narrowed by 45.4% to Kshs 208.9 bn in FY’2024 from the Kshs 382.7 bn deficit recorded in FY’2023. The y/y contraction registered was driven by:
- A 37.4% improvement in the services trade balance to a surplus of Kshs 324.4 bn from a surplus of Kshs 236.1 bn in FY’2023,
- Secondary income/transfers surplus (the transactions recorded in the secondary income account pertain to those current transfers between residents and non-residents that directly affect the level of gross national disposable income and thus influence the economy’s ability to consume goods and services) increased marginally by 4.9% to Kshs 1,025.7 bn from Kshs 977.6 bn in FY’2023 and,
- The narrowing of the primary income deficit (the earnings that residents of a country receive from their investments abroad and the compensation they receive for providing labor to foreign entities) by 2.3% to Kshs 252.3 bn in FY’2024, from Kshs 258.4 bn recorded in FY’2023.
The table below shows the breakdown of the various current account components on a year-on-year basis, comparing FY’2024 and FY’2023:
|
Item |
FY'2023 |
FY2024 |
Y/Y % Change |
|
Merchandise Trade Balance |
(1,338.0) |
(1,306.7) |
2.3% |
|
Services Trade Balance |
236.1 |
324.4 |
37.4% |
|
Primary Income Balance |
(258.4) |
(252.3) |
2.3% |
|
Secondary Income (transfer) Balance |
977.6 |
1,025.7 |
4.9% |
|
Current Account Balance |
(382.7) |
(208.9) |
45.4% |
All values in Kshs bns
Kenya's balance of payments improved in FY’2024, mainly on the back of a significant 722.9% increase in net errors and omissions to Kshs 107.8 bn from a deficit of Kshs 17.3 bn in FY’2023 coupled with an 81.0% improvement in the capital account balance to a surplus of Kshs 31.2 bn in FY’2024, from a surplus of Kshs 17.3 bn in FY’2023 reflecting significant inflows of financing to the country, possibly in government securities. The current account deficit (value of goods and services imported exceeds the value of those exported) narrowed by 45.4% to Kshs 208.9 bn from Kshs 382.7 bn in FY’2023. The y/y narrowing of the current account was brought about by the 2.3% narrowing in Merchandise trade deficit to Kshs 1,306.7 bn in FY’2024, from Kshs 1,338.0 bn in FY’2023 driven by the 9.1% growth in merchandise exports to Kshs 1,684.3 bn, from Kshs 1,544.0 bn in FY’2023 which outpaced the 3.8% increase in merchandise imports to Kshs 2,991.0 bn from Kshs 2,882.0 bn recorded in a similar period in 2023. Additionally, the secondary income balance saw an increase, bolstered by strong growth in diaspora remittances.
Looking ahead, the outlook for Kenya's current account is optimistic, as continued growth in key export sectors and sustained diaspora remittances are expected to further improve the current account balance. Efforts to diversify exports and enhance value addition in agricultural products, along with prudent fiscal and monetary policies, will be crucial in sustaining this positive trajectory. Furthermore, the ongoing stability of Kenyan Shilling against most trading currencies is expected to lower the import bill hence narrowing the current account deficit. We expect that the current administration’s focus on fiscal consolidation will improve the balance of payments performance by minimizing the costs of servicing external debts. Additionally, the favorable weather conditions and government intervention through subsidy programs are set to boost agricultural production in the country, thereby increasing the export of agricultural products, and supporting the current account. We anticipate that the balance of payments will continue being stable with the help of multiple trade agreements, such as the one between Kenya and the EU and the one among the EAC, SADC and COMESA, as the agreements will boost the amount and variety of exports that are needed and offer more opportunities to sell them.
Rates in the Fixed Income market have been on a downward trend due to high liquidity in the money market which allowed the government to front load most of its borrowing. The government is 81.4% ahead of its prorated net domestic borrowing target of Kshs 516.8 bn, and 57.0% ahead of the total FY’2024/25 net domestic borrowing target of Kshs 597.2 bn, having a net borrowing position of Kshs 937.3 bn (inclusive of T-bills). However, we expect a continued downward readjustment of the yield curve in the short and medium term, with the government looking to increase its external borrowing to maintain the fiscal surplus, hence alleviating pressure in the domestic market. As such, we expect the yield curve to stabilize in the short to medium-term and hence investors are expected to shift towards the long-term papers to lock in the high returns
Market Performance
During the week, the equities market was on an upward trajectory, with NASI gaining the most by 1.0% while NSE 10, NSE 25 and NSE 20 gained by 0.9%,0.5% and 0.1% respectively, taking the YTD performance to gains of 2.5% and 1.2% for NSE 20 and NASI, and losses of 3.2% and 1.8% for NSE 10 and NSE 25 respectively. The equities market performance was driven by gains recorded by large-cap stocks such as Equity, Safaricom and EABL 2.9%, 2.8%, and 1.5%, respectively. The performance was however weighed down by losses recorded by large cap stocks such as Absa Bank Kenya, Standard Chartered Bank Kenya and Diamond Trust Bank Kenya of 3.2%, 2.9% and 2.4% respectively.
Additionally, in the regional equities market, the East African Exchanges 20 (EAE 20) share index remained relatively unchanged during the week, attributable to losses recorded by large cap stocks such Airtel Uganda, Absa Bank Kenya and CRDB Bank of 5.7%, 3.1% and 3.0% respectively, that were matched by the gains recorded by large cap stocks such as Equity Group, Safaricom and Stanbic Uganda of 3.1%, 2.9% and 2.3% respectively.
During the week, equities turnover increased by 41.2% to USD 13.8 mn, from USD 9.8 mn recorded the previous week, taking the YTD total turnover to USD 275.2 mn. Foreign investors remained net sellers for the fifth consecutive week, with a net selling position of USD 0.3 mn, from a net selling position of USD 0.02 mn recorded the previous week, taking the YTD foreign net selling position to USD 32.0 mn, compared to a net selling position of USD 16.9 mn in 2024.
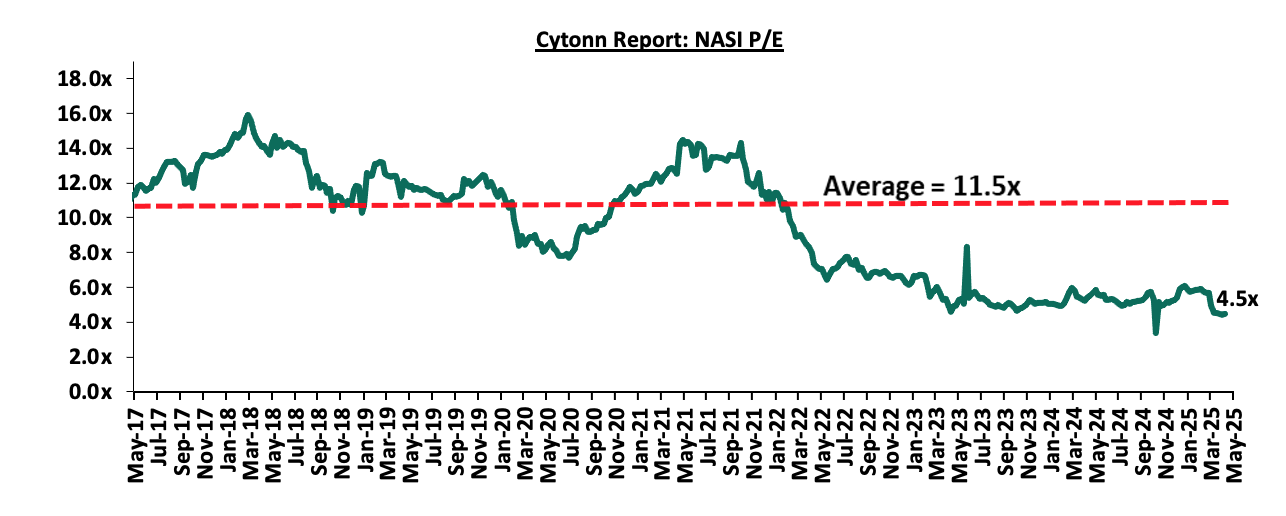
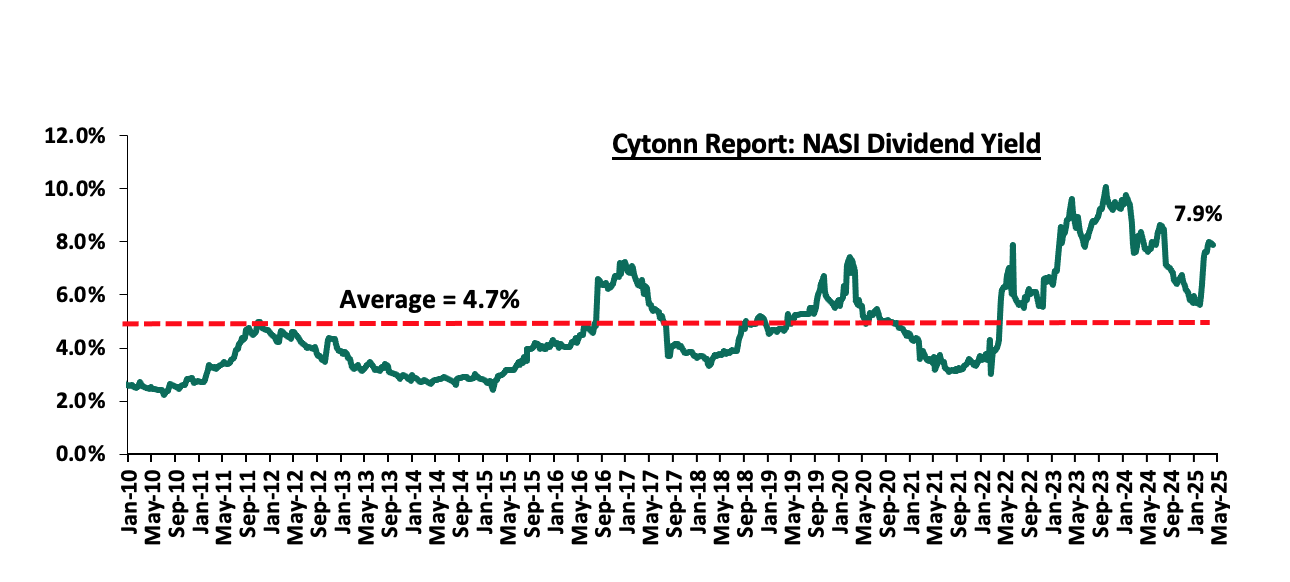
The market is currently trading at a price-to-earnings ratio (P/E) of 4.5x, 61.3% below the historical average of 11.5x. The dividend yield stands at 7.9%, 3.2% points above the historical average of 4.7%. Key to note, NASI’s PEG ratio currently stands at 0.6x, an indication that the market is undervalued relative to its future growth. A PEG ratio greater than 1.0x indicates the market is overvalued while a PEG ratio less than 1.0x indicates that the market is undervalued. The charts below indicate the historical P/E and dividend yields of the market;
Universe of Coverage:
|
Cytonn Report: Equities Universe of Coverage |
||||||||||
|
Company |
Price as at 02/05/2025 |
Price as at 09/05/2026 |
w/w change |
YTD Change |
Year Open 2025 |
Target Price* |
Dividend Yield |
Upside/ Downside** |
P/TBv Multiple |
Recommendation |
|
Co-op Bank |
14.4 |
14.3 |
(1.0%) |
(18.3%) |
17.5 |
18.6 |
10.5% |
41.2% |
0.5x |
Buy |
|
Standard Chartered Bank |
270.0 |
267.8 |
(0.8%) |
(6.1%) |
285.3 |
328.8 |
16.8% |
39.6% |
1.5x |
Buy |
|
KCB Group |
38.6 |
38.5 |
(0.1%) |
(9.2%) |
42.4 |
50.7 |
7.8% |
39.5% |
0.5x |
Buy |
|
ABSA Bank |
17.2 |
16.7 |
(3.2%) |
(11.7%) |
18.9 |
21.0 |
10.5% |
36.6% |
1.1x |
Buy |
|
NCBA |
49.5 |
49.0 |
(0.9%) |
(3.9%) |
51.0 |
60.2 |
11.2% |
34.1% |
0.8x |
Buy |
|
Jubilee Holdings |
200.0 |
205.0 |
2.5% |
17.3% |
174.8 |
260.7 |
6.6% |
33.7% |
0.3x |
Buy |
|
I&M Group |
30.3 |
30.0 |
(1.0%) |
(16.7%) |
36.0 |
36.8 |
10.0% |
32.7% |
0.5x |
Buy |
|
Diamond Trust Bank |
72.8 |
71.0 |
(2.4%) |
6.4% |
66.8 |
87.1 |
9.9% |
32.5% |
0.2x |
Buy |
|
Stanbic Holdings |
174.5 |
169.5 |
(2.9%) |
21.3% |
139.8 |
185.3 |
12.2% |
21.6% |
1.0x |
Buy |
|
Equity Group |
46.1 |
47.4 |
2.9% |
(1.3%) |
48.0 |
52.8 |
9.0% |
20.4% |
0.8x |
Buy |
|
CIC Group |
2.9 |
2.9 |
(2.4%) |
34.1% |
2.1 |
3.1 |
4.5% |
12.5% |
0.8x |
Accumulate |
|
Britam |
6.6 |
6.7 |
2.4% |
15.5% |
5.8 |
7.5 |
0.0% |
11.6% |
0.6x |
Accumulate |
|
*Target Price as per Cytonn Analyst estimates **Upside/ (Downside) is adjusted for Dividend Yield ***Dividend Yield is calculated using FY’2024 Dividends |
||||||||||
- Stanbic Group Q1’2025 Financial Performance
During the week, Stanbic Group released their FY’2024 financial results. Below is a summary of the performance:
|
Balance Sheet Items |
Q1’2024 |
Q1’2025 |
y/y change |
|
Net Loans and Advances to Customers |
255.8 |
244.0 |
(4.6%) |
|
Kenya Government Securities |
58.9 |
74.9 |
27.2% |
|
Total Assets |
491.5 |
450.1 |
(8.4%) |
|
Customer Deposits |
355.5 |
337.6 |
(5.0%) |
|
Deposits Per Branch |
12.7 |
11.3 |
(11.4%) |
|
Total Liabilities |
429.6 |
381.5 |
(11.2%) |
|
Shareholders' Funds |
61.9 |
68.7 |
10.9% |
|
Balance Sheet Ratios |
Q1’2024 |
Q1’2025 |
% points change |
|
Loan to Deposit Ratio |
71.9% |
72.3% |
0.3% |
|
Government Securities to Deposit Ratio |
16.6% |
22.2% |
5.6% |
|
Return on average equity |
20.8% |
20.0% |
(0.8%) |
|
Return on average assets |
2.8% |
2.8% |
(0.0%) |
|
Income Statement |
Q1’2024 |
Q1’2025 |
y/y change |
|
Net Interest Income |
6.5 |
6.8 |
4.6% |
|
Net non-Interest Income |
3.8 |
2.8 |
(27.2%) |
|
Total Operating income |
10.3 |
9.5 |
(7.1%) |
|
Loan Loss provision |
(1.1) |
(0.9) |
(24.8%) |
|
Total Operating expenses |
(4.8) |
(5.5) |
13.6% |
|
Profit before tax |
5.5 |
4.1 |
(25.3%) |
|
Profit after tax |
4.0 |
3.3 |
(16.6%) |
|
Core EPS |
10.1 |
8.4 |
(16.6%) |
|
Income Statement Ratios |
Q1’2024 |
Q1’2025 |
% points change |
|
Yield from interest-earning assets |
13.3% |
16.3% |
2.9% |
|
Cost of funding |
4.5% |
6.5% |
1.9% |
|
Net Interest Margin |
8.4% |
7.8% |
(0.6%) |
|
Net Interest Income as % of operating income |
63.1% |
71.1% |
8.0% |
|
Non-Funded Income as a % of operating income |
36.9% |
28.9% |
(8.0%) |
|
Cost to Income Ratio |
46.8% |
57.2% |
10.4% |
|
CIR without LLP |
35.7% |
48.2% |
12.5% |
|
Cost to Assets |
0.7% |
1.0% |
0.3% |
|
Capital Adequacy Ratios |
Q1’2024 |
Q1’2025 |
% points change |
|
Core Capital/Total Liabilities |
15.1% |
17.1% |
2.0% |
|
Minimum Statutory ratio |
8.0% |
8.0% |
0.0% |
|
Excess |
7.1% |
9.1% |
2.0% |
|
Core Capital/Total Risk Weighted Assets |
13.0% |
14.9% |
1.9% |
|
Minimum Statutory ratio |
10.5% |
10.5% |
0.0% |
|
Excess |
2.5% |
4.4% |
1.9% |
|
Total Capital/Total Risk Weighted Assets |
16.6% |
18.4% |
1.8% |
|
Minimum Statutory ratio |
14.5% |
14.5% |
0.0% |
|
Excess |
2.1% |
3.9% |
1.8% |
|
Liquidity Ratio |
40.3% |
50.5% |
10.2% |
|
Minimum Statutory ratio |
20.0% |
20.0% |
0.0% |
|
Excess |
20.3% |
30.5% |
10.2% |
For a more detailed analysis, please see the Stanbic Group’s Q1’2025 Earnings Note
Key Take-Outs:
- Weaker earnings growth - Core earnings per share decreased by 16.6% to Kshs 8.4 from Kshs 10.1 in Q1’2024, mainly driven by 13.6% increase in total operating expenses to Kshs 5.5 bn, from Kshs 4.8 bn in Q1’2024, attributed to a 9.1% increase in other staff costs to Kshs 2.1 bn from Kshs 1.9 bn recorded in Q1’2024, coupled with the 7.1% decline in total operating income to Kshs 9.5 bn in Q1’2025 from Kshs 10.3 bn in Q1’2024
- Increased Provisioning – General Provisions (LLP) increased by 2.0% to Kshs 12.2 bn in Q1’2025 from Kshs 11.9 bn in Q1’2024. The NPL coverage increased to 80.8% in Q1’2025, from 72.3% in Q1’2024, attributable to the 5.3% decrease in Gross non-performing loans to Kshs 22.9 bn, from Kshs 24.2 bn in Q1’2024, coupled with the 2.0% increase in both general provisions,
- Improved asset quality- Gross NPL ratio decreasing to 8.7% in Q1’2025, from 8.9% in Q1’2024, attributable to 5.3% decrease in Gross non-performing loans to Kshs 22.9 bn, from Kshs 24.2 bn in Q1’2024, which outpaced the 3.9% decrease in gross loans to Kshs 262.6 bn, from Kshs 273.3 bn recorded in Q1’2024,
- Reduced lending- Customer net loans and advances decreased by 4.6% to Kshs 244.0 bn in Q1’2025, from Kshs 255.8 bn in Q1’2024 attributed to increased credit risk with NPLs rising to 17.2% in February 2025, from 15.5% in February 2024.
- Safaricom FY’2025 Financial Performance
During the week, Safaricom Plc released its FY’2025 financial results for the period ending 31st March 2025, highlighting that the profit after tax (PAT) for the Group increased by 7.3% to Kshs 45.8 bn, from 42.7 bn recorded in FFY’2024, largely attributable to a 11.2% increase in Total Revenue to Kshs 388.7 bn from Kshs 349.4 bn recorded in FY’2024, The performance was however weighed down by aa 16.3% increase in Operating cost to Kshs 216.5 bn from 186.2 bn recorded in FY’2024.
The tables below show the breakdown of the group’s financial statements from the report;
|
Cytonn Report: Safaricom PLC Income Statement |
|||
|
Item (All figures in Bns) |
FY'2024 |
FY'2025 |
y/y change |
|
Total Revenue |
349.4 |
388.7 |
11.2% |
|
Operating costs |
(186.2) |
(216.5) |
16.3% |
|
EBITDA |
163.3 |
172.2 |
5.4% |
|
EBITDA Margin |
46.7% |
44.3% |
(2.4%) |
|
Depreciation & Amortization |
(82.9) |
(68.1) |
(17.9%) |
|
Operating Profit |
80.8 |
104.5 |
29.3% |
|
Net Finance Costs |
(16.6) |
(20.9) |
25.6% |
|
Profit Before Tax |
84.7 |
93.2 |
10.1% |
|
Profit After Tax |
42.7 |
45.8 |
7.3% |
|
Earnings Per Share |
1.57 |
1.74 |
10.8% |
|
Payout Ratio |
76.43% |
68.97% |
(9.8%) |
|
Dividend Yield |
7.5% |
6.5% |
(13.1%) |
|
Cytonn Report: Safaricom PLC Balance Sheet |
|||
|
Item (All figures in Bns) |
FY'2024 |
FY'2025 |
y/y change |
|
Current Assets |
82.5 |
84.0 |
1.8% |
|
Non-Current Assets |
558.6 |
431.2 |
(22.8%) |
|
Total Assets |
641.2 |
515.3 |
(19.6)% |
|
Current Liabililities |
167.8 |
155.0 |
(7.6%) |
|
Non-Current Liabilities |
137.6 |
136.2 |
(1.0%) |
|
Total liabilities |
305.4 |
291.3 |
(4.6%) |
|
Shareholder funds |
226.3 |
177.7 |
(21.5%) |
|
Minority Interest |
109.4 |
46.3 |
(57.7%) |
|
Total Equity |
335.7 |
224.0 |
(33.3%) |
Key take outs from the report include;
- Total revenue increased by 11.2% to Kshs 388.7 bn in FY’2025, from Kshs 349.4 bn in FY’2024, mainly attributable to the 10.8% increase in service revenue to Kshs 371.4 bn in FY’2025, from Kshs 335.4 bn in FY’2024. Notably, MPESA revenue increased by 15.1% to Kshs 161.1 bn, from Kshs 140.0 bn in FY’2024,
- Voice revenue for the group increased by 1.2% to Kshs 82.0 bn, from Kshs 80.5 in FY’2024, while mobile data revenue increased by 16.5% to Kshs 78.5 bn, from Kshs 67.4 in FY’2024.
- Earnings before interest, taxes, depreciation and amortization (EBITDA) increased by 5.4% to 172.2 bn in FY’2025 from 163.3 bn in FY’2024, owing to a 11.2% increase in total revenue to Kshs 7 bn in FY’2025, from Kshs 349.4 bn in FY’2024 it was however weighed down by the 16.3% increase in operating cost. As such, EBITDA margin recorded an 2.4%-point decline to 44.3% in FY’2025 from 46.7% in FY’2024,
- Ethiopian subsidiary recorded a 18.3% increase in net losses after tax to Kshs 49.8 bn from a net loss of Kshs 42.1 bn in FY’2024, while the Kenyan business recorded a 12.7% increase in net profits to Kshs 93.2 bn, from 84.7 bn in FY’2024. As such, the Group recorded a 7.3% increase in net profit to Kshs 45.8 bn in FY’2025, from Kshs 42.7 bn in FY’2024,
- The balance sheet recorded a contraction as total assets decreased by 19.6% to Kshs 515.3 bn, from Kshs 641.2 bn in FY’2024, mainly driven by a 22.8% decrease in Non-Current assets to Kshs 2 bn, from Kshs 558.6 bn in FY’2024,
- The Group’s customers grew by 4% to 57.1 mn from 49.0 mn in FY’2024, while Safaricom’s market share in Kenya declined to 65.2% as of December 2024, from 65.9% recorded same period last year.
- The Board of directors of Safaricom PLC have recommended a final dividend of Kshs 0.65, having paid Kshs 0.55 in interim dividend which brings total dividend per share in FY’2025 to Kshs 1.2 remaining unchanged from FY’ 2024. The translates to a payout ratio of 69.0% a decrease from 76.4% in FY’2024 while the dividend yield is currently at 6.5%.
Additionally, its Ethiopian subsidiary recorded a total revenue of Kshs 7.9 bn, with service revenue coming at Kshs 7.5 bn and operating cost at Kshs 36.2 bn leading to a loss after tax of Kshs 49.8 bn which weighed down on the group’s overall performance.
The 7.3% increase in the firm’s core earnings to Kshs 1.14 in FY’2025, from Kshs 1.06 in FY’2024 shows that Safaricom continues to have a strong long-term proposition, owing to its 65.2% of market share in Kenya and over 97.0% market share in mobile money subscribers through M-Pesa, with M-Pesa recording a 10.5% year on year growth in one-month active customers to 35.8 mn in FY’2025. Additionally, the Ethiopian subsidiary is expected to gain further traction with the firm expecting to tap into Ethiopian market with a population of more than 133.2 mn people. However, the adverse macroeconomic situation, coupled with the ongoing depreciation of the Ethiopian Birr against the US dollar is likely to weigh on the group’s overall performance during this period when it is aggressively expanding its network in Ethiopia.
We are “Bullish” on the Equities markets in the short term due to current cheap valuations, lower yields on short-term government papers and expected global and local economic recovery, and, “Neutral” in the long term due to persistent foreign investor outflows. With the market currently trading at a discount to its future growth (PEG Ratio at 0.6x), we believe that investors should reposition towards value stocks with strong earnings growth and that are trading at discounts to their intrinsic value. We expect the current high foreign investors sell-offs to continue weighing down the economic outlook in the short term.
- Industry Report
- KNBS Economic Survey: Real Estate sector growth
During the week, The Kenya National Bureau of Statistics (KNBS) 2025 Economic Survey provides insights into the performance of various economic sectors in Kenya for 2024, the following were the key highlights related to the Real Estate sector’s performance in 2024:
- The Real Estate sector recorded a growth of 3% in 2024, according to the KNBS 2025 Economic Survey. This growth was driven by a combination of factors that included sustained demand for housing and commercial properties, particularly in urban areas like the Nairobi Metropolitan Area (NMA) and Government-led infrastructure investments and public works projects which provided a boost to the sector, creating opportunities for construction; though it was moderated by challenges in the related Construction sector. The challenges included (i) high construction costs - Cost of key construction materials, such as cement and reinforced steel, increased significantly. For instance, cement prices rose by 10.7% in 2024 to Kshs 830.0 from Kshs 750.0 in 2023, increasing overall construction costs, (ii) shift in developer strategies, showing that developers and investors likely prioritized operational efficiency and sustainability over initiating new large-scale projects, leading to fewer approved building plans, (iii) tightened lending conditions as lending institutions increased borrowing costs due to a high rate of Non-Performing Loans (NPLs) in the Real Estate sector. The gross NPL ratio was reported at 16.5% as of September 2024, a marginal improvement from 16.6% in June 2024, signalling ongoing credit risk concerns.
- The report also stated that the Real Estate sector faced headwinds due to the contraction in the related Construction sector, which recorded a 7% decline to an average of (0.7%) in 2024 compared to an average of 3.0% growth in 2023. This contraction was partly due to reduced production of construction materials, such as cement and other minerals, as highlighted by the 9.2% contraction in the Mining and Quarrying sector.
Source: KNBS
- Tourism
According to the Economic survey 2025, Real Estate remains one of Kenya’s leading foreign exchange earners and the third-largest contributor to GDP after agriculture and manufacturing, as noted in KNBS data and this performance is supported by the tourism industry. The data below shows how various sectors performed in the year 2024 against the year 2025:
Source: KNBS
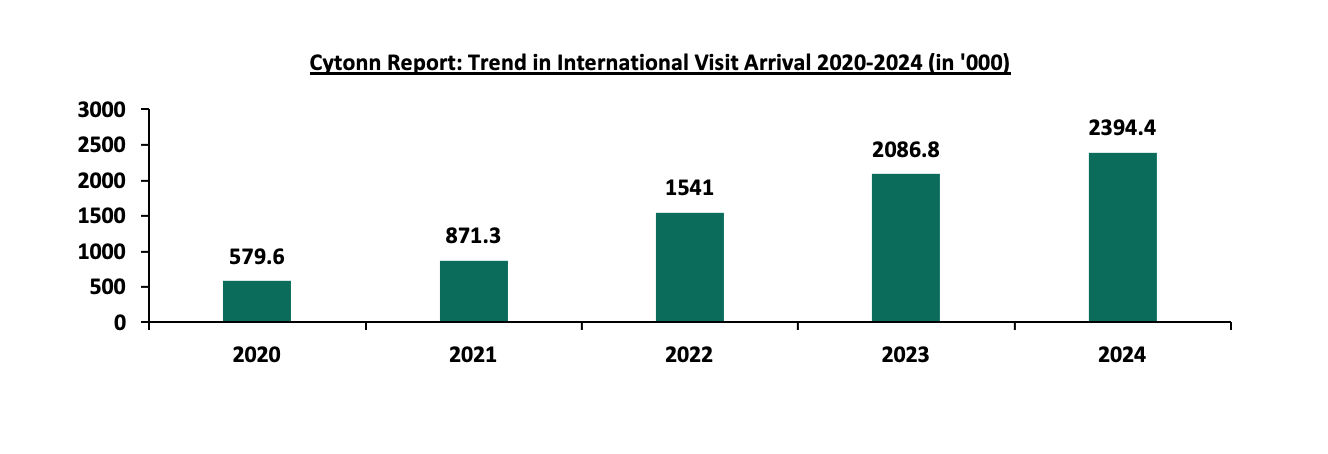
- International arrivals
Number of international arrivals increased by 14.7% to 2.4 mn in 2024 from 2.1 mn in 2023. The growth in arrivals was largely attributed to the following factors; (i) Strategic Government Reforms such as rollout of the Electronic Travel Authorization (ETA) system, digital integration for visa processing enhanced Kenya’s appeal as a tourism hub by streamlining entry processes and improved global visibility, (ii) Hosting Major Conferences and Events such as UN Civil Society Conference in Nairobi, the Global Bioeconomic Summit, the Humanitarian Energy Conference, the Global Off-Grid Solar Forum and Expo, the AVPA Conference on impact investing, and the International Conference on ICTs and similar high-profile conferences in 2024 likely continued to attract business travelers, boosting arrivals.
Source:KNBS
The number of international conferences expanded by 2.3% to 999 in 2024 from 977 in 2023 while local conferences increased by 4.7 % to 11,225 in the same period from 10,725 in 2023. The conferences were largely supported by the increase in visitor arrivals and the hosting of high-profile meetings having both local and international delegates meetings such as 2024 PEP Annual Conference, held in Nairobi from June 3rd to 6th 2024.
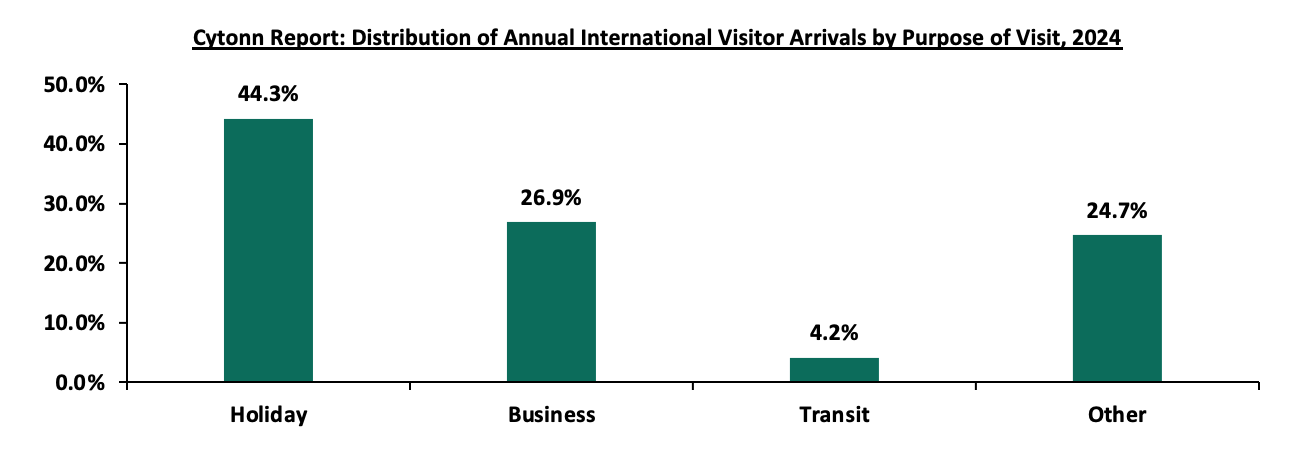
Additionally, the number of visitor arrivals on holiday accounted for 44.3 % of all international arrivals in 2024 compared to 44.8 % in 2023 while those on business accounted for 26.9 per cent in the review period.
Source:KNBS
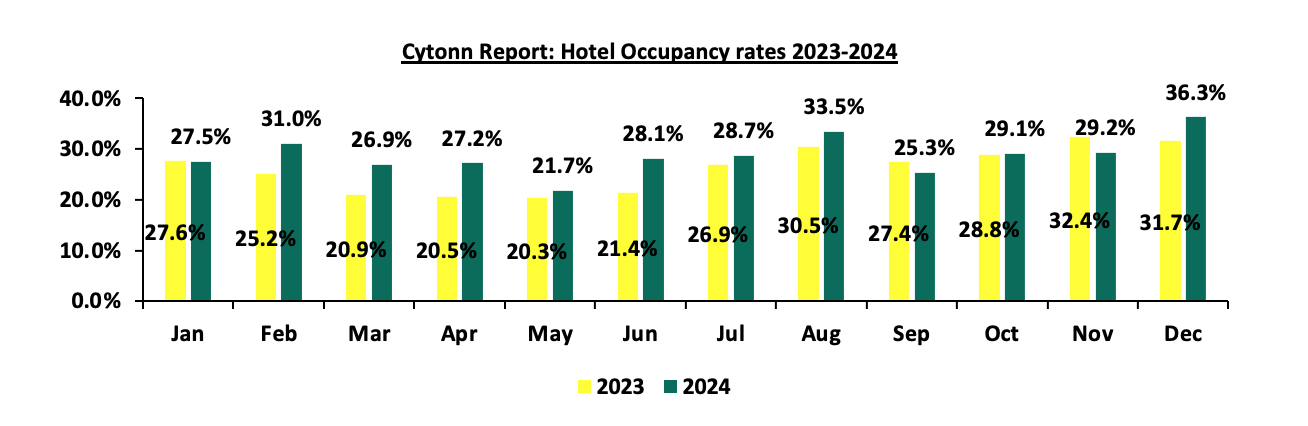
- Bed Occupancy
During the period under review, hotel bed occupancy in the country saw growth, with December recording the highest in 2024 at 36.3%. This was different from 2023 where bed occupancy peak was recorded in November 2024 at 36.3%. Highest bed occupancy recorded in Coast at 47.5% followed by Nairobi at 24.5%. This could be linked to holiday travels in the country.
Source:KNBS
We expect Kenya’s tourism sector to remain resilient in 2025, driven by growing international arrivals, enhanced aviation connectivity, and hotel expansions like the Hyatt Regency. Nairobi’s prominence as a conference hub and supportive government policies, including VAT exemptions, will further bolster growth. However, challenges such as unpredictable weather with flooding risks, rising construction costs, and high non-performing loan ratios in the banking sector may impede progress.
- Infrastructure
The report noted that Kenya made major improvements to its transportation and storage infrastructure to support economic and social development. Key initiatives from review period include expanding the Port of Mombasa, redeveloping Kisumu Lake Port, upgrading Metre Gauge Railway (MGR) infrastructure, and introducing premium passenger services on the Standard Gauge Railway (SGR). These projects were aimed at enhancing trade, improving connectivity, creating jobs and driving economic growth.
We expect that the real estate sector will continue to grow at a steady rate supported by the ongoing global economic recovery, infrastructure growth and increased tourist visits to the country.
- FY’2024 Real Estate contribution to GDP
During the week, the Kenya National Bureau of Statistics (KNBS) released the 2025 Economic survey that outlined the performance of various sectors to the GDP and below are the key take-outs related to the Real Estate sector:
- Steady growth in the Real Estate Sector - The Real Estate sector posted steady growth of 3.6% in Q4’2024, which is 3.7% points slower than the 7.3% growth registered in Q4’2023. The steady growth can be attributable to an increasing demand for housing in the country. However, the slowed growth compared to Q4’2023 can be attributable to the sustained increase in the cost of construction materials which remained a significant challenge to developers and investors during the period under review. Additionally, the total value of building plans approved in the Nairobi Metropolitan Area (NMA) increased y/y basis by 0.7% to Kshs 221.6 bn in December 2024, from Kshs 220.0 bn recorded in December 2023.On a quarter-on-quarter basis, this represented a 1.2%-points decrease from the 4.8% growth recorded in Q3’2024. The decrease in performance can be attributable to; i) increased prices of construction materials such as reinforced steel and cement, ii) tough operating environment, which led lenders to tighten lending to the real estate sector due to the rising number of non-performing loans which was reported at 16.5% as of September 2024, a marginal improvement from 16.6% in June 2024, iii) developers and investors shifting strategies, emphasizing operational efficiency and sustainability rather than embarking on new large-scale developments. The graphs below show the Real Estate sector contribution to GDP from FY’2017 to FY’2024 as well as growth rates from Q1’2020 to Q4’2024.
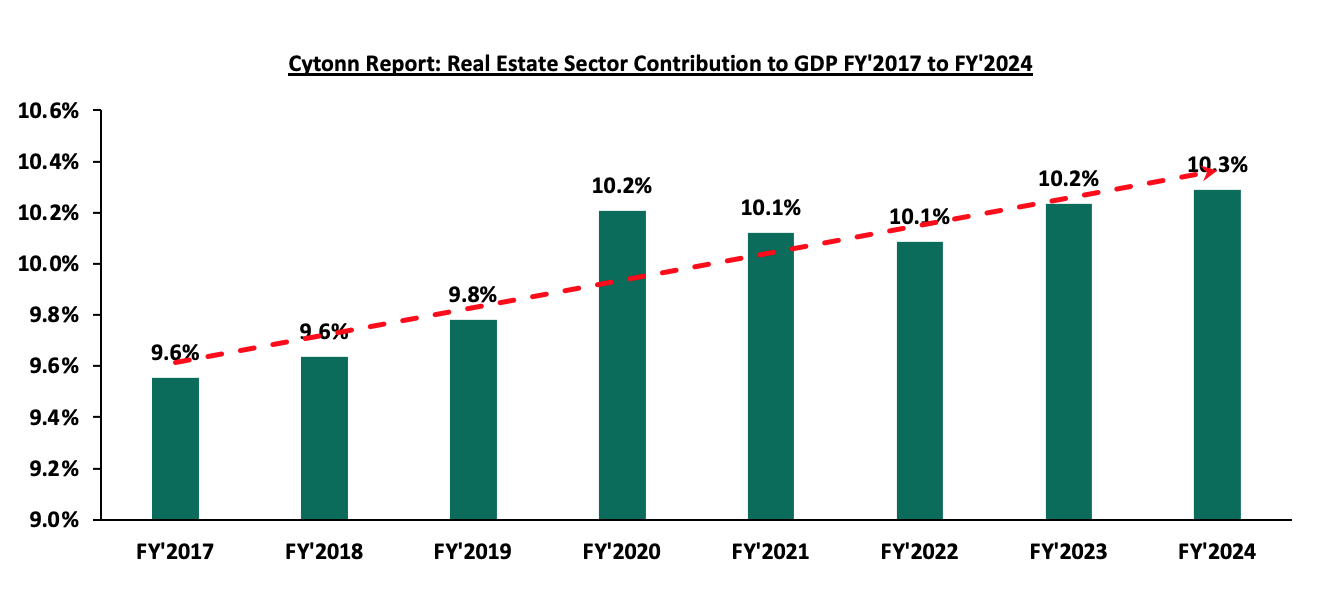
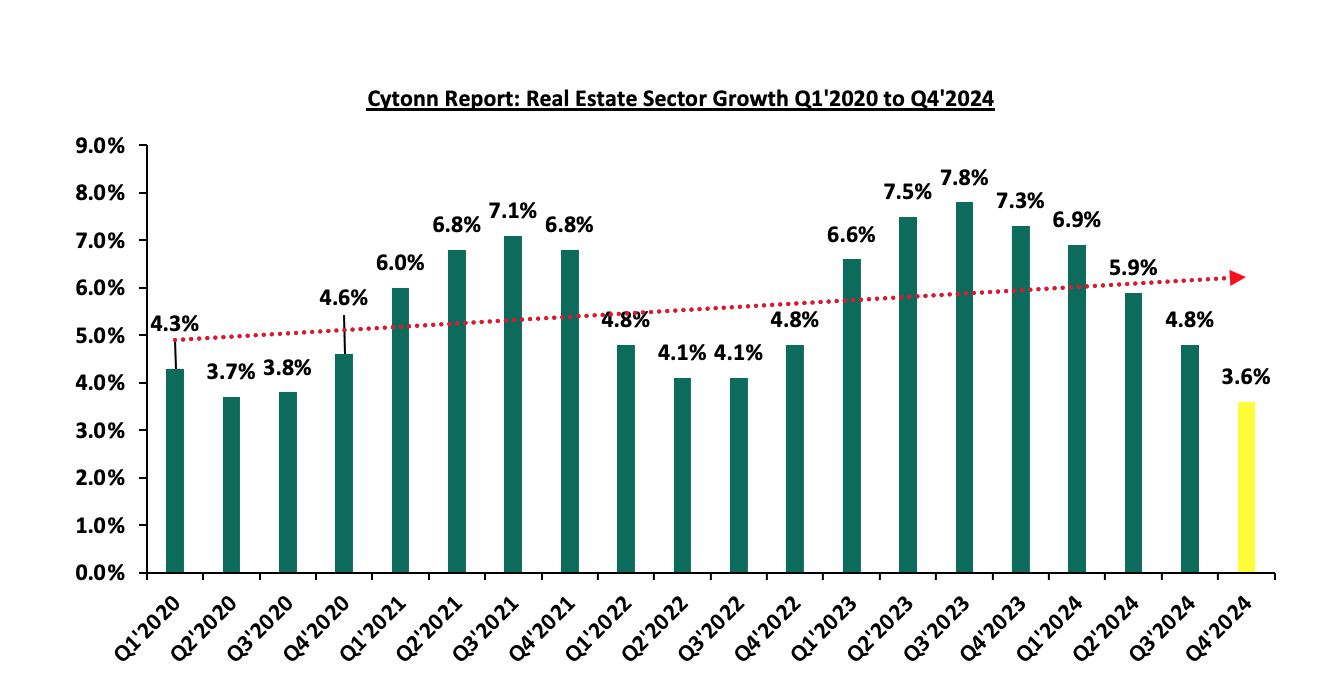
Source: Kenya National Bureau of Statistics (KNBS)
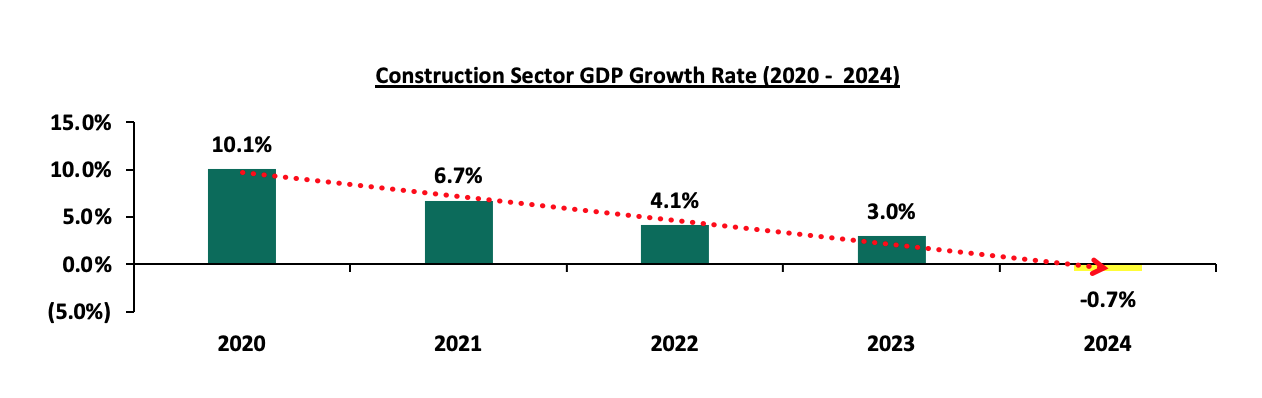
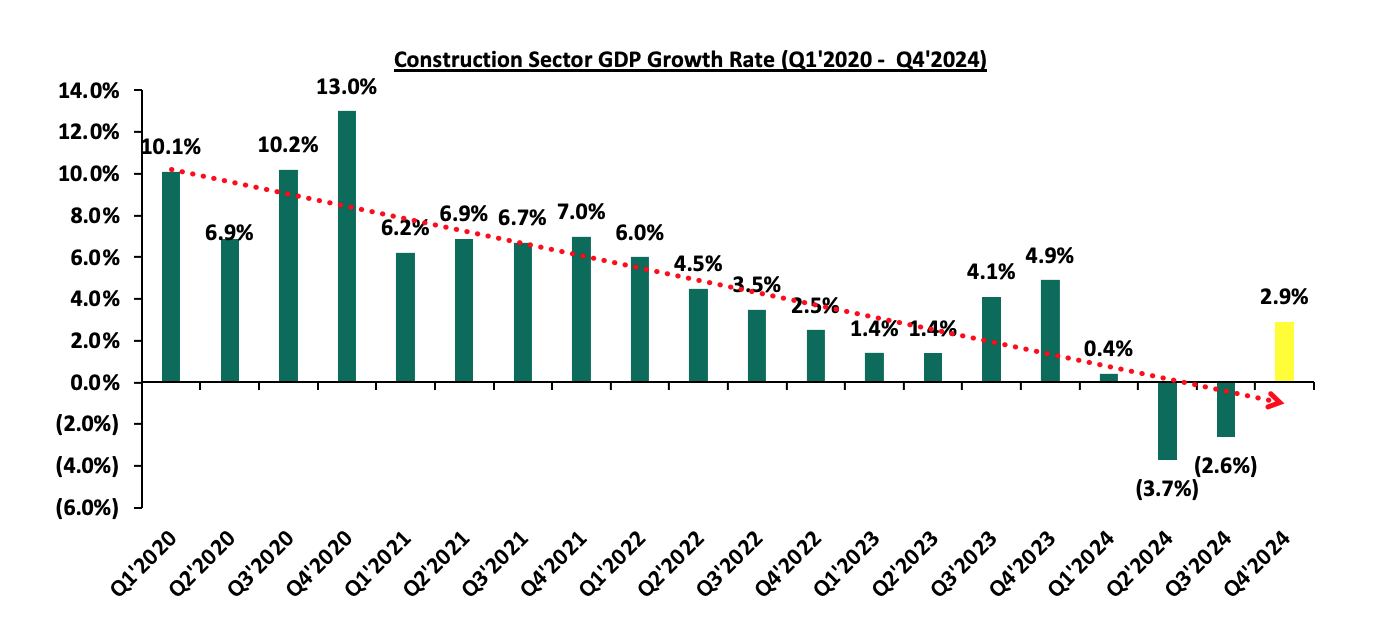
- Subdued growth in the construction sector - The construction sector grew by 2.9% in Q4’2024, which is 2.0% points slower than the 4.9% growth in Q4’2023. On a quarter-on-quarter basis, this performance represented a 5.5%-point increase from the 2.6% decline recorded in Q3’2024. On a year to year basis the construction sector recorded a contraction rate of 0.7% in FY’2024 compared to 3.0% growth in the same period last year, while the contribution to GDP decreased by 0.3% points, to 5.4% in FY’2024, from 5.7% recorded in FY’2023. Additionally; i) Credit extended to enterprises in the construction sector declined by 14.2% to stand at Kshs 528.0bn as at December 2024, from Kshs 602.7 bn in FY’2023, ii) Cement consumption declined by 7.2% to stand at 8,537.0 thousand metric tonnes in FY 2024 from 9,195.8 thousand metric tonnes in the corresponding period of 2023, iii) Private sector employment in construction declined by 1.3% to 223,400 employees in FY’2024 from 226,300 employees in FY’2023. The graph below shows the Construction sector growth rates from Q1’2020 to Q4’2024.
Source: Kenya National Bureau of Statistics (KNBS)
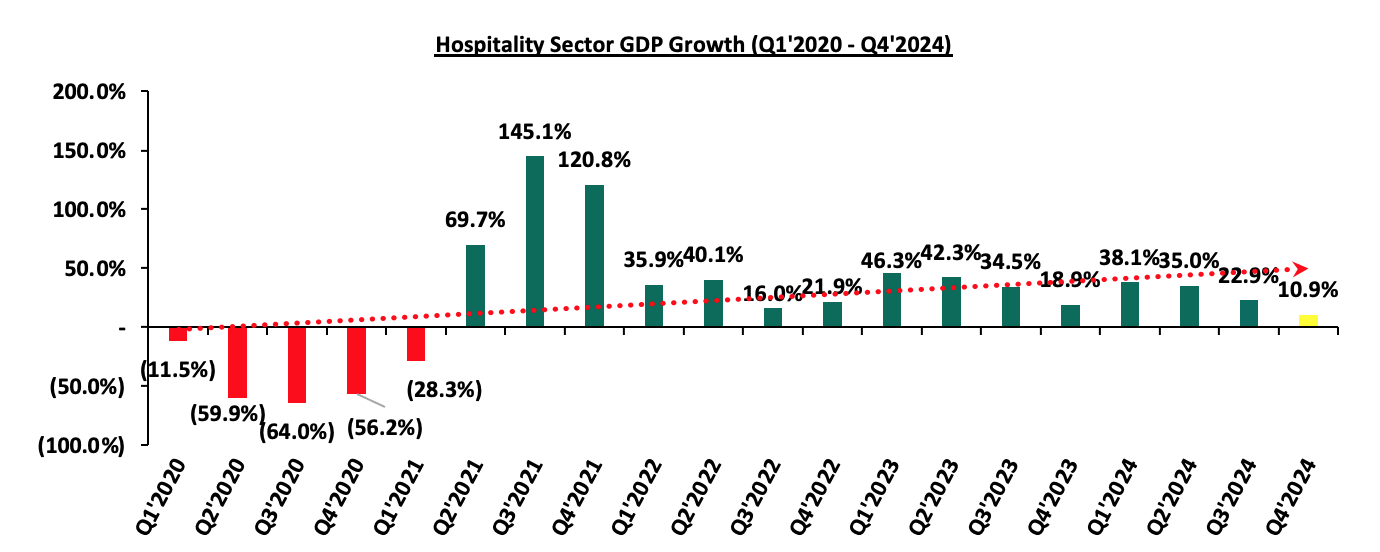
- Sustained Recovery in Accommodation and Restaurant Sector – The accommodation and restaurant services grew by 10.9% during Q4’2024, representing an 8.0% points y/y decline from the 18.9% growth recorded in Q4’2023. On a q/q basis, this performance represented 12.0% points decrease from the 22.9% in Q3’2024. The slowed growth can be attributed to economic deceleration, high operational cost and somewhat constrained consumer spending due to increased taxation and high cost of living. Despite these challenges, the market shows steady recovery from the impacts of COVID-19, with the lifting of travel restrictions playing a major role in boosting activity within the real estate sector. The sector is however expected to continue benefitting from an increased number of international arrivals; for instance, Arrivals through the two major airports, the Jomo Kenyatta International Airport (JKIA) and Mombasa International Airport (MIA) rose by 14.7% in FY’2024 to stand at 2,394,400 visitors compared to 2,086,800 visitors in FY’2023. The graph below shows the accommodation and restaurant sector contribution to GDP growth rates from Q1’2020 to Q4’2024;
Source: Kenya National Bureau of Statistics (KNBS)
We anticipate growth in Kenya's Real Estate sector, supported by several key factors such as; i) high urbanization and population growth rates of 3.8% p.a and 2.0% p.a, respectively, against the global average of 1.7% p.a and 0.9% p.a, respectively, respectively as at 2023, sustaining demand for housing units and other Real estate developments, ii) increased visitor arrivals through the major points of entry such as the Jomo Kenyatta International Airport (JKIA) and Mombasa International Airport (MIA) by 14.8% to stand at 2,394,400 visitors compared to 2,086,800 visitors in FY’2023, iii) the government continued roll out and support of the affordable housing programme in the country, iv) increased activities by industry players, especially in the residential sector. However, we expect the sector’s growth to be weighed down by increasing construction costs and the tough lending environment for real estate developers.
- Residential Sector
- Treasury projects housing levy flows to hit Kshs 95.8 bn
During the week, the national Treasury projected to collect Kshs 95.8 bn from the housing development levy in financial year starting July, indicating President Ruto’s plan to put up 200,000 subsidized housing units annually for middle and lower-income households. The forecasted Kshs 30.3 bn increase has clashed with employer’s call on the Ruto administration to consider slashing the levy by 1.0% to 0.5% from 1.5% of the gross income, citing the continued hit on workers’ net income amid rising inflation. Workers in the informal sector will also contribute to the housing levy at 1.5% of the gross income under the housing law, unlike the previous framework under the employment law which had left out the informal workers. This will help achieve equity which is one of the core principles of taxation.
These projected flows will have implications such as increased government revenue, where there will be an additional revenue stream therefore improving fiscal space for affordable housing projects. Moreover, these additional inflows reduce reliance on public debt and allows for reallocation of funds to other sectors. This will also guarantee a stimulus to the construction and Real Estate sector which is attributed to the steady flow of revenue into housing which fosters demand for labour and boosts related industries such as cement and steel. In addition to creating more jobs among the youth, it will increase demand for vocational training in the construction sector. This may be beneficial in easing the number of students who enroll in Kenyan universities annually.
Given the projection of Kshs 95.8 bn, it is expected that the government will significantly accelerate the delivery of affordable housing units across the country, therefore addressing the growing urban housing deficit and stimulate economic activity through job creation and improved infrastructure. However, the success of this initiative will mainly depend on transparent governance, equitable allocation of housing units and effective integration with broad urban development plans. If well-managed, the levy could serve as a powerful tool for social and economic transformation, but its sustainability and public acceptance remain key to its longevity.
- Government Allocates Kshs 2.8 Bn for Affordable Housing Studies Amid Concerns
During the week, the government tabled a Kshs 119.6 bn budget for the State Department for Housing and Urban Development for the 2025/26 financial year, including Kshs2.8 bn for research and feasibility studies to support the Affordable Housing Programme. This marks a Kshs1.0 bn increase from the 2024/25 allocation.
The programme, funded by a 1.5% housing levy on salaried workers and matched by employers, has collected Kshs 88.7 bn as of December 2024, with Kshs 46.0 bn invested in Treasury bonds. However, Auditor-General Nancy Gathungu highlighted the absence of land ownership documents, which could hinder title issuance for completed units. Additionally, only 52,000 of over 547,000 registrants on the Bomayangu platform have saved Kshs 2.3 bn, signaling low public interest.
The programme’s budget has seen significant increases to Kshs 74.7 bn in 2024/25 from Kshs 15.5 bn in FY’2021/22 but actual expenditures remain lower for example Kshs 25.5 bn in FY’2023/24 against Kshs 78.2 bn allocated.
Currently, 124,000 housing units are under construction across 75 sites in 37 counties, falling short of the 250,000 units annual target. Notable achievements include 605 units in Bondeni, Nakuru, and 462 units for police and prison services. Critics, including MP Anthony Kibagendi, argue that the rising budget diverts funds from critical sectors like education and healthcare.
These developments have implications for the Real Estate sector. The steady levy inflows provide a reliable revenue stream, stimulating construction activity, job creation, and demand for materials like cement and steel. However, challenges such as land title issues and low uptake could erode public trust and limit private-sector participation. Transparent governance, clear land documentation, and effective public engagement will be critical to achieving the programme’s goals and addressing Kenya’s urban housing deficit. If well-executed, the initiative could drive economic growth and social transformation, but its success hinges on addressing current bottlenecks and sustaining public support
- Infrastructure Sector
- National Treasury proposed an allocation of Kshs 16.5 bn to fund the SGR extension
During the week, the National Treasury proposed an allocation of Kshs 16.5 bn to facilitate the extension of the Standard Gauge Railway from Naivasha to Kisumu and Malaba actualizing the vision of having a seamless rail transport from the Mombasa port to Malaba. The allocation which will be complemented by funding from China has set the stage for the plan to extend the SGR to neighbouring Uganda, ending years of uncertainty on whether the modern rail would connect the two countries. The facilitation from China comes after their decision to reject Kenya’s proposal to fully fund the entire project. This has saved the Kenyan taxpayer from further increase in the debt that Kenya owes China whose repayments account for the biggest portion of the money that Kenya pays in foreign debt.
This extension will enhance trade efficiency by streamlining cargo movement from the Mombasa port through Nairobi and landlocked countries such as Uganda. This is expected to reduce transportation costs and time taken which will foster competitiveness. The extension is anticipated to attract investments in manufacturing and processing industries which will foster economic growth in regions such as Western Kenya. There will be an increase in employment opportunities which will help Kenyans to improve their standard of living and skill development in the local communities. The extention will foster East African cohesion as it aligns with the East African Railways Master Plan, aiming to connect Kenya with Uganda, Rwanda, Burundi and eventually South Sudan, Ethiopia and beyond. This project will also impact the Real Estate sector in Kenya through appreciation of land and property values which have close proximity to the SGR stations. Areas like Bungoma and Malaba have the potential of experiencing Real Estate booms. Emergence of satellite towns will be beneficial to decongesting major urban centres such as Nairobi and Kisumu by fostering development of smaller towns within the SGR corridor.
The extension of the SGR to Malaba is a strategic initiative with the potential to transform Kenya’s economic landscape, enhance social welfare and strengthen regional ties. However, its success will depend on effective governance and inclusive policies such as local empowerment and environment conservation which will address the needs of all stakeholders.
- Real Estate Investments Trusts (REITs) Performance
On the Unquoted Securities Platform, Acorn D-REIT and I-REIT traded at Kshs 26.7 and Kshs 22.9 per unit, respectively, as per the last updated data on 2nd May 2025. The performance represented a 33.5% and 14.5% gain for the D-REIT and I-REIT, respectively, from the Kshs 20.0 inception price. The volumes traded for the D-REIT and I-REIT came in at Kshs 12.8 mn and Kshs 36.1 mn shares, respectively, with a turnover of Kshs 323.5 mn and Kshs 791.5 mn, respectively, since inception in February 2021. Additionally, ILAM Fahari I-REIT traded at Kshs 11.0 per share as of 2nd May 2025, representing a 45.0% loss from the Kshs 20.0 inception price. The volume traded to date came in at 138,600 shares for the I-REIT, with a turnover of Kshs 1.5 mn since inception in November 2015.
REITs offer various benefits, such as tax exemptions, diversified portfolios, and stable long-term profits. However, the ongoing decline in the performance of Kenyan REITs and the restructuring of their business portfolios are hindering significant previous investments. Additional general challenges include:
- Insufficient understanding of the investment instrument among investors leading to a slower uptake of REIT products,
- Lengthy approval processes for REIT creation,
- High minimum capital requirements of Kshs 100.0 mn for REIT trustees compared to Kshs 10.0 mn for pension funds Trustees, essentially limiting the licensed REIT Trustee to banks only
- The rigidity of choice between either a D-REIT or and I-REIT forces managers to form two REITs, rather than having one Hybrid REIT that can allocate between development and income earning properties
- Limiting the type of legal entity that can form a REIT to only a trust company, as opposed to allowing other entities such as partnerships, and companies,
- We need to give time before REITS are required to list – they would be allowed to stay private for a few years before the requirement to list given that not all companies maybe comfortable with listing on day one, and,
- Minimum subscription amounts or offer parcels set at Kshs 0.1 mn for D-REITs and Kshs 5.0 mn for restricted I-REITs. The significant capital requirements still make REITs relatively inaccessible to smaller retail investors compared to other investment vehicles like unit trusts or government bonds, all of which continue to limit the performance of Kenyan REITs.
We expect Kenya’s Real Estate sector to remain on a growth trend, supported by: i) demand for housing sustained by positive demographics, such as urbanization and population growth rates of 3.8% p.a and 2.0% p.a, respectively, against the global average of 1.7% p.a and 0.9% p.a, respectively, as at 2023,, ii) activities by the government under the Affordable Housing Program (AHP) iii) heightened activities by private players in the residential sector iv) increased investment by local and international investors in the retail sector. However, challenges such as rising construction costs, strain on infrastructure development (including drainage systems), high capital requirements for REITs, and existing oversupply in select Real Estate sectors will continue to hinder the sector’s optimal performance by limiting developments and investments.
Private placements or non-public offerings are a method of raising capital by selling securities directly to a chosen or pre-determined number of investors rather than through a public offering. Private placements have emerged as a vital component of capital raising in Kenya’s financial markets, especially in an environment where traditional public offerings face stringent regulatory requirements, prolonged approval timelines, and market volatility. We chose to cover this topic to demystify a financial mechanism that remains under-discussed yet widely used by both private and public sector players. With the Kenyan economy in a state of recovery and transition, businesses and the government need flexible, accessible, and efficient ways of raising capital. Private placements are now gaining more traction among the government, medium-sized corporates and large institutions that require capital without the regulatory complexities and public scrutiny associated with public offerings, inclusive of Eurobonds for the government. By understanding private placements, readers will be better positioned to engage in or evaluate private placement deals, especially in the context of accredited institutional and individual investors meeting specific criteria, actively participating in such issuances.
We will focus on providing a clear understanding of private placements in Kenya, how they operate and their role in Kenya’s financial markets. We aim to equip investors, issuers, and other stakeholders with the knowledge required to assess the suitability of private placements as a financing tool, particularly given recent developments such as the Government of Kenya’s amortizing note issued via private placement in April 2025. As such we shall cover;
- Demystifying Private Placements in Kenya,
- Regulations on Private Placements in Kenya,
- Kenya’s Private Placements Dealings,
- Implications of Private Placements, and,
- Recommendations for Expanding and Strengthening Private Placements in Kenya, and,
- Conclusion.
Section I: Demystifying Private Placements in Kenya
In Kenya, private placements are governed by the Capital Markets Act and regulations from the Capital Markets Authority (CMA) and typically involves high net-worth investors, institutional investors or specific financial intermediaries. Private placements are favored for their speed, flexibility, and confidentiality, particularly in circumstances where time-sensitive funding is required or where the issuer wishes to avoid the regulatory complexities of a public issue. They appeal to both issuers seeking quick capital and investors desiring tailored investment terms. In Kenya, financial institutions, real estate developers, and government agencies frequently use private placements to meet their funding needs without diluting control or incurring heavy regulatory costs.
Unlike public issues, private placements are not open to the general public and do not require listing on a securities exchange. Public issues involve offering securities to the general public. The table below outlines the key differences between private placements and public issues:
|
Cytonn Report: Differences Between Private Placements and Public Issues in Kenya |
||
|
Feature |
Private Placement |
Public Issue |
|
Target Investors |
Select group, often accredited investors |
Open to the general public |
|
Regulation |
Less regulated, streamlined documentation, and often exempt from full reporting requirements |
More regulated, requires extensive documentation and compliance |
|
Cost |
Generally lower cost due to fewer regulatory requirements |
Higher cost due to extensive compliance and marketing efforts |
|
Speed |
Faster process, can be completed more quickly than public offerings |
Slower process, requires significant time for regulatory approvals and market analysis |
|
Control |
Issuer retains more control over the investment process and investor selection |
Issuer has less control over investor selection and potential market fluctuations |
|
Investor Rights |
Investors may have fewer rights, but potentially higher returns |
Investors generally have more rights, but potentially lower returns |
|
Liquidity |
Relatively less liquid as its unlisted |
Relatively more liquid as it is unlisted |
|
Purpose |
Suitable for raising capital for specific projects, smaller companies, or when control over the investment process is desired |
Suitable for raising large amounts of capital from a broad investor base, often for growth or expansion |
Source: Cytonn Research
In Kenya private placements are employed by a diverse range of entities from start-ups and SMEs that lack resources for public offerings, large corporations looking to avoid the regulatory complexities of public issues to government, government agencies and parastatals requiring swift funding.
Typically, the steps involved in a private placement in Kenya include:
- Preparation: The issuer prepares a short-form prospectus outlining the terms of the offering,
- Regulatory Submission: The prospectus and, if applicable, an information notice are submitted to the Capital Markets Authority (CMA) for approval,
- Investor Engagement: The issuer or an appointed arranger markets the offering to selected investors,
- Due Diligence: Potential Investors conduct their own thorough investigations into the issuer and offering to assess the investment’s risk and return,
- Subscription and Allotment: Investors subscribe to the securities, and the issuer allots them accordingly, and,
- Settlement: Funds are transferred, and the securities are registered, often through the Central Depository and Settlement Corporation (CDSC) for corporate issuances, or through the Central Bank of Kenya (CBK) in the case of government securities.”
Section II: Regulations on Private Placements in Kenya
In Kenya, the framework for private placements is anchored in Section 30A of the Capital Markets Act, which governs offers and invitations to subscribe for securities. This provision restricts such activities to those compliant with the Capital Markets Authority (CMA) regulations, while carving out exemptions for private placements, as elaborated in Regulation 17 of the 2023 Regulations. The rules aim to confine private placements to a select group of investors, minimizing the risks inherent in broader public offerings. Regulation 21 outlines the boundaries of private placements with precision: offers must target fewer than 100 persons (excluding professional investors) within a 12-month period, avoid public advertising through mediums like newspapers or television, and focus on qualified institutional investors or sophisticated individuals with specific income or net worth profiles. This structure ensures the offer remains private, aligning with global standards that emphasize investor sophistication to reduce financial risks.
Disclosure and Documentation
Unlike public offerings, private placements in Kenya are spared the requirement of a CMA-approved prospectus. Instead, issuers are tasked with preparing an Information Memorandum or a similar disclosure document, which serves as a vital resource for investors’ decision-making. This document must paint a clear picture of the issuer’s background, business model, and operational history. It should articulate how the funds raised will be utilized, disclose potential risks tied to the investment, and specify the terms, pricing, and conditions of the securities offered. Additionally, issuers must provide audited financial statements spanning the past three years to ensure transparency, alongside details of the company’s governance structure and shareholding. Although the Information Memorandum does not require CMA approval, it must be shared with prospective investors. The CMA retains the right to request and scrutinize this document at any time, holding issuers accountable to high standards of disclosure.
Investor Eligibility
The regulations place a premium on investor sophistication, a cornerstone of the exemptions granted to private placements. Eligible investors typically fall into two categories qualified institutional investors, such as banks, insurance companies, or pension funds, which possess the expertise to navigate complex investment opportunities, and sophisticated individuals, defined as high-net-worth persons meeting CMA-specified income or asset thresholds. By targeting these capable investors, the regulations reduce the need for intensive regulatory oversight, as these parties are assumed to have the knowledge and resources to perform thorough due diligence before committing their capital.
Restrictions on Marketing
To preserve the private nature of these offerings, issuers are strictly prohibited from employing public media or broad marketing campaigns. This restriction is critical to preventing private placements from morphing into de facto public offers, which would trigger far more stringent compliance obligations. By limiting outreach to direct, private channels, the regulations ensure that only the intended audience, sophisticated or institutional investors, receives the offer.
Exemptions and Reporting Obligations
Private placements enjoy significant regulatory relief, making them an appealing option for small and medium-sized enterprises (SMEs) or startups looking to raise capital efficiently. Issuers are exempt from preparing a CMA-approved prospectus, bypassing a time-consuming and costly process. They also do not need prior CMA approval for the offer, unlike public offerings, and are free from the continuous disclosure requirements imposed on publicly listed companies. These exemptions streamline the fundraising process, allowing issuers to focus on their business objectives rather than navigating bureaucratic hurdles.
Oversight and Reporting
Despite the exemptions, the CMA maintains robust oversight to ensure compliance. The Authority can request the Information Memorandum or other relevant documents at any time and investigate potential violations, such as exceeding the 100-investor limit or engaging in prohibited public solicitation. Issuers are required to keep detailed records of the offer and investor information, enabling the CMA to conduct inquiries when necessary. This balance of flexibility and accountability fosters transparency without imposing excessive reporting burdens on issuers.
Enforcement and Penalties
The CMA vigilantly enforces the rules governing private placements to protect investors and maintain market integrity. Breaches of exemption conditions such as surpassing the 100-investor threshold, advertising the offer publicly, or targeting unqualified investors can lead to severe consequences. The CMA may declare the offer illegal, effectively halting the fundraising effort, and investors may be entitled to refunds or compensation for losses. Issuers face fines, and directors could be disqualified from holding office.
The table below highlights the comparison between private placements and public offers under the Capital Markets Act:
|
Cytonn Report: Comparison between Private Placements and Public Offers under the Capital Markets Act |
||
|
Aspect |
Private Offers |
Public Offers |
|
Definition |
Offers of securities made under specified conditions not deemed to be to the public |
Offers of securities made to the general public requiring regulatory compliance and disclosure |
|
Number of Offerees |
Limited to not more than 100 persons |
Unlimited/general public |
|
Disclosure Requirements |
Not subject to the public disclosure and continuing obligations under the Regulations |
Must comply with detailed disclosure requirements and continuing obligations |
|
Eligible Recipients |
Members of clubs/associations with common interest, knowledgeable investors, employees/family of a private company, etc. |
General public without restriction |
|
Authority Oversight |
Not regulated under the public offer rules |
Regulated and approved by the Capital Markets Authority |
|
Prospectus Requirement |
Not required |
Prospectus must be approved and published |
|
Minimum Subscription |
Minimum of Kshs 100,000 per applicant in some cases |
No stated minimum subscription in the Act for public offers |
|
Transferability |
Securities are not freely transferable |
Freely transferable securities |
|
Applicability of Regulations |
Exempt from most parts of the Capital Markets (Public Offers, Listing and Disclosures) Regulations |
Fully subject to the Capital Markets Regulations |
Source: Cytonn Research, Capital Markets Act
Section III: Kenya’s Private Placement Dealings
- Kenya’s Recent Private Placement dealings by the government
Over the past decade, Kenya has diversified its borrowing strategies, tapping into Eurobond markets, multilateral institutions like the World Bank, Trade and Development Bank, and IMF, and bilateral lenders such as China. However, Eurobonds have become more expensive due to high interest rates, while Chinese lending to African countries has slowed amid shifting geopolitical dynamics. Additionally, Eurobonds tend to have bullet repayments where all the principal is paid at the end of the loan, which poses refinancing and rollover risks. However, Kenya has recently been issuing amortizing Eurobonds such as the Eurobonds issued in 2019 which were to be amortized over their last three years to maturity. In response, Kenya has increasingly turned to private placements and alternative funding channels such as Panda and Samurai bonds to manage its debt obligations and finance development. This strategic pivot allows for more flexible terms, reduced market exposure, and better alignment with fiscal planning.
Kenya secured a USD 1.5 billion private bond placement in the United Arab Emirates, structured with bullet repayments of USD 500.0 million each in 2032, 2034, and 2036. This repayment structure offers liquidity but defers repayment pressure to the future. This financing, agreed upon in 2024, carries an 8.25% interest rate and a 7-year tenor. As of early 2025, the government had opted to delay drawing down these funds to better align with its fiscal framework and budgetary planning. The funds are earmarked for liability management and budgetary support, providing flexibility to address upcoming debt maturities and fiscal needs. The government received the first tranche of USD 500.0 million in the last week of April 2025, and opted to receive the remaining USD 1.0 billion in the next fiscal year.
On April 25, 2025, Kenya announced the pricing of a USD 500.0 million amortizing note maturing in 2032, carrying a fixed coupon rate of 8.25%. This seven-year tenor bond was arranged through a private placement at par value, offering the government more control over investor selection and pricing. The amortizing structure means that principal repayments will be made periodically over the life of the bond, rather than a lump sum at maturity. Proceeds from this issuance are intended to support budgetary needs and refinance existing debt, contributing to Kenya's broader strategy of managing its debt profile and ensuring fiscal sustainability. This deal was led with advisory from G&A Advocates LLP and White & Case LLP. Compared to the 2024 USD 1.5 bn Eurobond issue with a similar tenor which matures in February 2031, a coupon rate of 9.75% and a yield of 10.3%, the private placement offers a lower cost of debt at 8.25%. Even though the 2024 Eurobond is structured with semi-annual interest payments scheduled for February 16 and August 16 each year, beginning on August 16, 2024, it remains more expensive than the recent private placement. Therefore, these notes are fairly priced and support better debt management without excessive cost. Typically, amortizing notes are considered lower-risk by investors, which justifies a lower coupon.
In 2024, several Sub-Saharan African nations, including Kenya, Ivory Coast, Benin, Senegal, Cameroon, South Africa and Nigeria re-entered the Eurobond market after a 1-year hiatus to raise funds to refinance debt and fund infrastructure projects. Additionally, as of May 2025, three countries in the Sub-Saharan African region have tapped into the international markets by issuing Eurobonds. Benin initiated Africa's first Eurobond issuance of the year, a 16-year USD 500.0 mn through a 16-year bond that attracted USD 3.5 bn in demand. Kenya issued a new USD 1.5 bn 11-year Eurobond to facilitate the buyback of the 7-year tenor USD 900.0 mn Eurobond tenders issued in 2019 with a maturity of May 2027. Ivory Coast issued a 11- year USD 1.75 bn Eurobond in March 2025. The table below shows the 2024 and 2025 Eurobond issuance for Sub-Saharan African countries along with their Fitch’s ratings’ Long-Term Foreign Currency IDR:
|
Fitch Rating's Long-Term Foreign-Currency Issuer Default Rating (IDR) |
2024 Eurobond Issues |
2025 Eurobond Issues |
|||||||||
|
Country |
IDR Credit Rating |
Issue Date |
Value USD Mn |
Tenor (Years) |
Coupon Rate |
Issue Date |
Value USD Mn |
Tenor (Years) |
Coupon Rate |
||
|
Ivory Coast
|
BB-
|
Stable
|
Jan-25
|
Jan-24
|
1100.0 |
9 |
7.650% |
March-25 |
1750.0 |
11 |
6.450% |
|
1500.0 |
13 |
8.250% |
|||||||||
|
Benin |
B+ |
Stable |
Feb-25 |
Feb-24 |
750.0 |
14 |
8.375% |
Jan-25 |
500.0 |
16 |
8.625% |
|
Kenya |
B- |
Stable |
Jan-25 |
Feb-24 |
1500.0 |
7 |
9.750% |
Feb-25 |
1500.0 |
11 |
9.500% |
|
Senegal |
B- |
Stable |
Nov-24 |
Jun-24 |
750.0 |
7 |
7.750% |
|
|
|
|
|
Cameroon |
B |
Negative |
May-25 |
Jul-24 |
550.0 |
7 |
10.750% |
|
|
|
|
|
South Africa |
BB- |
Stable |
Sep-24 |
Nov-24 |
2000.0 |
12 |
7.100% |
|
|
|
|
|
1500.0 |
30 |
7.950% |
|||||||||
|
Nigeria |
B |
Stable |
Apr-25 |
Dec-24 |
700.0 |
6.5 |
9.625% |
|
|
|
|
|
1500.0 |
10 |
10.375% |
|||||||||
By tapping into private placements, Kenya seeks to secure funding with potentially more favorable terms, further supporting its development agenda and debt management objectives. Private placements diversify funding sources and potentially reduce borrowing costs and risks.
- Private Placements by Corporate Institutions in Kenya
Private placements have become an increasingly popular financing mechanism among Kenyan corporate institutions, offering a streamlined and cost-effective alternative to public offerings. This method allows companies to raise capital by selling securities directly to a select group of investors, thereby avoiding the extensive regulatory requirements associated with public offers. Under the Capital Markets (Securities) (Public Offers, Listing and Disclosures) Regulations, 2002, private placements are defined by criteria such as the number of offerees and the nature of the investor group, ensuring that the offerings are targeted and compliant with existing laws. The reduced disclosure obligations and faster execution timelines make private placements particularly attractive for companies seeking flexible funding solutions.
Private placements for companies can be made through various ways:
- Private Bonds – Companies issue bonds directly to select investors than the general public. These bonds provide fixed interest payments and are often used for long-term financing. The terms, including the interest rates and tenors are negotiated privately and must comply with the CMA regulations.
- Private Placement of Equity – This involves selling shares of the company to private investors rather than through a public offering. The company identifies a few individuals or institutional investors to buy newly issued shares. Approvals from the CMA and the company’s board are required, and disclosure obligations apply even through it is not public.
- Commercial Paper – Commercial papers are short-term unsecured debt instruments, with maturity of less than a year, issued by companies to meet immediate financing needs. The company issues commercial paper to select investors. They must meet CMA guidelines, including minimum credit ratings and disclosure requirements.
- Notes – Notes are debt instruments similar to bonds but can vary in term length. Short-term notes have a maturity up to 1 year while medium-term range between 5-10 years. Medium-term notes are issued in tranches. They are issued privately to select investors under mutually agreed terms, where the company negotiates interest and repayment schedules privately.
- Convertible Debentures – These are debt instruments that can be converted into equities shares after a set period of time or under specified conditions. They are issued private to select investors. The terms for conversion, interest rates and maturity rates are set out in advance. CMA approval is needed, and conversion terms must be disclosed to the investors.
Kenyan companies have increasingly turned to private placements to raise capital efficiently. The table below shows some of the private placements issued by Kenyan Companies across various industries over the years:
|
Cytonn Report: Private Placements by Private Institutions |
||||
|
Date |
Company |
Transaction |
Amount (Kshs bn) |
Industry |
|
May-24 |
4G Capital |
Private Bond |
0.5 |
Financial Services |
|
Jul-23 |
Burn Manufacturing |
Green Bond |
1.4 |
Manufacturing |
|
Sep-23 |
Lipa Later Group |
Private Debt Financing |
0.5 |
Financial Services |
|
Jan-23 |
Mogo Auto |
1 and 2-year notes |
2.0 |
Financial services |
|
Jun-22 |
Mogo Auto Kenya |
6- and 12-month notes |
1.0 |
Financial Services |
|
Dec-20 |
Prime Bank |
Private Bond |
1.0 |
Banking |
|
Dec-20 |
Mayfox Mining |
Private Placement of Equity |
0.04 |
Mining |
|
Jan-18 |
Flame Tree Group |
Commercial Paper |
Undisclosed |
Consumer goods |
|
Jun-18 |
ARM Cement |
Equity Investment by CDC |
14.1 |
Construction |
|
Jan-17 |
GardaWorld Security |
Private Bond |
1.8 |
Security Services |
|
Oct-15 |
Stockport Exploration |
Private Placement of Equity |
0.1 |
Mining |
|
May-15 |
Africa Oil |
Private Placement of Equity |
10.0 |
Oil and Gas |
|
Oct-14 |
Funguo Limited (owned by ICDC) |
Private Placement of Equity |
0.4 |
Financial Services |
|
Apr-14 |
Car and General |
Commercial Paper |
0.8 |
Automobiles |
|
Feb-14 |
ARM Cement |
Commercial Paper |
0.8 |
Construction |
|
Jan-14 |
TPS Eastern Africa (Serena Hotels) |
Commercial Paper |
Undisclosed |
Consumer Services |
|
Oct-13 |
Stockport Exploration |
Private Placement of Convertible Debentures |
0.1 |
Mining |
|
Jul-13 |
KenolKobil Petroleum |
Commercial Paper (private) |
1.7 |
Oil Marketing |
|
Mar-13 |
Stockport Exploration |
Private Placement of Equity |
0.04 |
Mining |
|
Jul-05 |
Intex Construction |
Commercial Paper |
0.5 |
Construction |
|
Aug-06 |
Deacons Kenya |
Private Equity Placement |
0.2 |
Retail |
|
Oct-01 |
ICDC Investments |
Equity Offer |
Undisclosed |
Financial Services |
|
2001 |
K-Rep Bank |
Commercial Paper |
0.5 |
Banking |
|
Feb-00 |
African Lakes Corporation |
Equity Offer |
Undisclosed |
Information Technology |
|
|
Car and General |
Medium-note program |
0.2 |
Automobiles |
|
|
Guaranty Trust Bank |
Private Bond |
0.5 |
Banking |
Source: Cytonn Research
The adoption of private placements by Kenyan corporates reflects a broader shift towards more agile and tailored financing strategies. By leveraging this mechanism, companies can access capital more efficiently, align funding structures with their specific needs, and engage with investors who bring not only capital but also strategic value. As the financial landscape continues to evolve, private placements are poised to play a pivotal role in supporting the growth and resilience of Kenya's corporate sector.
Section IV: Implications of Private Placements
Private placements present both benefits and limitations that affects the issuers and investors. While they offer a streamlined and adaptable method for raising capital, they also come with inherent trade-offs. Some of the advantages and disadvantages are outlined below;
Advantages of private placements
- Speed and Cost Efficiency-Private placements typically bypass many of the bureaucratic hurdles and high cost of public offerings. This makes them particularly attractive during times of urgency, such as when a government or company needs to refinance debt quickly or respond to market shocks. Additionally, with reduced intermediaries such as broker and lower legal costs, issuers can raise funds faster and more economically. This is ideal for small businesses seeking to raise funds for expansion.
- Flexibility-Unlike public offerings, which must be standardized to attract a broad investor base, private placements can be customized. Issuers can negotiate terms such as amortization schedules, interest rate structures and amounts based on the unique needs of both parties. Private placements can also be tailored to enable companies to access funding rapidly and cost-effectively, bypassing the lengthy and expensive procedures typically associated with public offerings.
- Confidentiality-Private placements do not require broad public disclosure before issuance such as disclosure of detailed financial information required for public listings. For issuers managing sensitive financial restructurings or strategic moves, this discretion helps avoid market speculation and preserves negotiating leverage.
- Strategic Investor Relationships-Engaging a select group of institutional investors allows for deeper, long-term partnerships. Governments, for instance, can use private placements to strengthen ties with local pension funds or banks—providing consistent investment pipelines while keeping capital within domestic markets.
- Control-Private placements enable companies to retain stronger control over their financing arrangements and ownership structure. They allow issuers to selectively engage with investors and tailor the terms of the offering to align with their operational and strategic goals. Additionally, private placements help companies minimize exposure to activist investors or external pressures that could potentially interfere with internal decision-making and long-term planning.
Disadvantages of private placements
- Illiquidity-Privately placed instruments are not listed on secondary markets, making them harder to sell before maturity. The limited liquidity of private placement securities can reduce their appeal to investors, potentially impacting the overall demand for such offerings.
- Dilution of Ownership-Private placements can lead to the dilution of existing shareholders' equity in the company. By issuing additional ownership stakes to new investors, the relative shareholding of current owners may be reduced. This dilution can affect decision-making power and influence over the company’s strategic direction, potentially resulting in tensions or conflicts among shareholders regarding control and governance.
- Investor Concentration Risk-Heavy reliance on a small group of investors may pose systemic risks. For example, if a large institutional investor like a pension fund holds a significant portion of a government placement and later faces liquidity issues, the effects can ripple across the financial system.
- Risk of Overuse or Misuse-There’s a fine line between strategic private placements and using them to bypass market scrutiny or parliamentary oversight. Overuse may signal an inability to raise funds transparently or efficiently in public markets; a red flag for credit rating agencies and foreign investors.
- Less competitive rate discovery – Unlike public markets that benefit from broad investor participation, private placements involve a smaller pool of investors. This can limit competitive pressure during pricing, potentially leading to interest rates that are more influenced by investor expectations than by broader market benchmarks.
Section V: Recommendations for Expanding and Strengthening Private Placements Dealings in Kenya
As Kenya seeks to deepen its capital markets and diversify financing tools, private placements have a clear and important role to play. However, there are still major gaps that needs to be addressed to ensure its success. Below are some of the actions recommended:
- Improve perception: Too often private placements are seen as illegal in Kenya given the myth that all fund raisings have to be regulated and or approved by CMA. The market needs to be comfortable that private placements are exempt from being regulated.
- Address illiquidity in Private Placements-To mitigate the challenge of illiquidity associated with privately placed instruments, policymakers and market participants should explore the development of structured secondary trading platforms or private placement exchange mechanisms within regulated environments. This would allow limited, controlled resale of private placement securities among qualified investors, thereby enhancing their attractiveness without compromising regulatory safeguards. Additionally, issuers can improve marketability by incorporating call or put options, shorter tenors, or periodic liquidity windows into the terms of the instruments, providing investors with greater flexibility and exit opportunities. Expanding investor awareness and education around these features can further help alleviate liquidity concerns.
- Broaden the domestic investor base- To ensure the sustainability of private placement issuance and avoid excessive concentration of risk among a small number of large institutional investors, it is crucial to diversify and expand the pool of domestic participants. One key approach is to increase the number of persons to whom the offer is to be made from the current 100 persons and also to promote financial literacy and education, particularly among mid-sized institutions such as SACCO’s, Tier II pension schemes, cooperative societies, fund managers, and insurance funds. By enhancing their understanding of private placement instruments, these investors can more confidently participate in such offerings, thus increasing market depth. Additionally, product innovation can play a transformative role. Structuring pooled investment vehicles—such as private placement funds or securitized instruments—can enable smaller institutions to collectively access investment opportunities that would otherwise be beyond their individual reach. This not only democratizes access but also helps distribute risk more evenly across the financial ecosystem, ultimately supporting a more resilient and inclusive capital market.
- Enhance local capacity for advisory Services- Another barrier to the growth of private placements in Kenya is the limited internal capacity among many corporates—especially small and mid-sized enterprises—to structure and execute these transactions effectively. Without the necessary expertise in legal, financial, and regulatory matters, many potential issuers are unable to take advantage of private placement opportunities. To bridge this gap, training programs are necessary, equipping the parties with practical skills in deal structuring, legal compliance, investor engagement, and risk assessment. Building a strong pipeline of local talent will foster a deeper understanding of the domestic regulatory environment. Additionally, the government and financial sector regulators can incentivize local advisory firms—such as fund managers, investment banks, law firms, and financial consultants—to develop and offer affordable, tailored services for mid-sized businesses.
- Align with Regional Capital Market Goals-As Kenya continues to participate in the broader financial integration agenda of the East African Community (EAC) and the African Union, aligning its private placement framework with regional objectives can help achieve greater opportunities. By aligning with the private placement regulations across member states, Kenya can facilitate cross-border investor participation, allowing issuers to tap into a larger pool of capital while providing investors with more diverse opportunities. Additionally, regulators and market players should encourage cross-listing or joint private placements within the region. This would enable companies to access capital from multiple jurisdictions without undergoing the full requirements of a public listing. Regional alignment can enhance liquidity, deepen market integration, and make Kenya a hub for private capital flows in East Africa.
Section VI: Conclusion
Private placements enable business owners to secure funding without going through the lengthy, complex, and demanding process of an initial public offering (IPO). By targeting a select group of investors, companies can raise capital for growth while avoiding the extensive regulatory obligations associated with going public.
Private placements offer companies enhanced control over their funding strategies and ownership structure, while also providing a higher level of confidentiality compared to public offerings. As entities increasingly seek flexible, cost-efficient financing methods and investors look for diversified alternatives, private placements are expected to remain a significant component of today’s modern capital markets.
The continued advancement of technology and the rise of digital platforms are likely to further increase both the accessibility and reach of private placement opportunities, benefiting a broader range of issuers and investors.
However, both parties must approach private placements with a clear and informed understanding of the associated risks and benefits. Investors should adequately evaluate potential returns, assess the underlying risks, and engage only with credible issuers and trusted financial intermediaries. Meanwhile, issuers must ensure full compliance with all relevant securities laws and regulatory requirements to mitigate the risk of legal or reputational repercussions. Additionally, issuers should be strategic in selecting investors and negotiating terms that align with their capital needs and long-term goals.
Disclaimer: The views expressed in this publication are those of the writers where particulars are not warranted. This publication is meant for general information only and is not a warranty, representation, advice or solicitation of any nature. Readers are advised in all circumstances to seek the advice of a registered investment advisor.

- Talk to us
- Kenya
- P.O Box 20695 - 00200, Nairobi, Kenya
- Cell +254709101200
- Tel +254709101200
- WhatsApp +254741676635
- United States
- +254709101200
- DOWNLOAD OUR APP
-


- Kenya
- 8th Floor, Pinetree Plaza, Kaburu Drive, Ngong Road, Nairobi, Kenya
- USA
- Suite 1150, 1775 Eye Street NW, USA, Washington DC 20006, USA
- Investments
- High Yield
- Private Equity
- Real Estate
- Real Estate
- RiverRun Estates
- Cytonn Towers
- The Ridge
- Taraji Heights
- The Alma