Progress of Kenyan Pension Schemes-2022, & Cytonn Weekly #31/2022
By Research, Aug 7, 2022
Executive Summary
Fixed Income
During the week, T-bills remained undersubscribed, with the overall subscription rate coming in at 48.3%, down from the 82.1% recorded the previous week, partly attributable to the heightened perceived risks as the 2022 elections edge closer. Investors’ preference for the shorter 91-day paper persisted, with the paper receiving bids worth Kshs 7.4 bn against the offered Kshs 4.0 bn, translating to a subscription rate of 186.9%, down from the 351.9% recorded the previous week. The subscription rate for the 364-day and 182-day papers also declined to 20.5% and 20.6% from 23.8% and 32.5%, respectively, recorded the previous week. The yields on the government papers recorded mixed performance, with the yields on the 182-day and 91-day papers increasing by 0.8 bps and 7.4 bps to 9.4% and 8.5%, respectively, while the yield on the 364-day paper declined by 2.6 bps to 9.9%. In the Primary Bond Market, the government re-opened three bonds namely; FXD1/2022/03, FXD2/2019/10 and FXD1/2021/20 with effective tenors of 2.7 years, 6.7 years and 19.1 years respectively, in a bid to raise Kshs 50.0 bn for budgetary support. The period of sale for the bonds runs from 29th July to 16th August 2022;
Also during the week, Stanbic Bank released its monthly Purchasing Manager’s Index (PMI) highlighting that the index for the month of July 2022 declined for the fourth consecutive time to 46.3, from 46.8 recorded in June 2022 pointing towards a further deterioration in the business environment in the Kenyan private sector;
Equities
During the week, the equities market was on an upward trajectory with NASI and NSE 25 both gaining by 0.7% while NSE 20 gained by 1.5%, taking their YTD performance to losses of 15.0%, 9.8% and 12.2%, for NASI, NSE 20 and NSE 25, respectively. The equities market performance was mainly driven by gains recorded by large-cap stocks such as Bamburi, ABSA, NCBA and Standard Chartered (SCBK) of 12.7%, 3.2%, 2.4% and 1.7%, respectively. The gains were however weighed down by losses recorded by BAT and EABL which declined by 1.4% and 0.2%, respectively;
Also during the week, the Insurance Regulatory Authority of Kenya (IRA) released the Quarterly Insurance Industry Report for the period ending 31st March 2022 highlighting that the industry’s profits after tax declined by 73.7% to Kshs 0.4 bn, from Kshs 1.5 bn recorded in Q1’2021. Additionally, KCB Group announced that it had entered into a final agreement with shareholders of Trust Merchant Bank (TMB) to acquire an 85.0% stake in the Democratic Republic of Congo (DRC)-based lender, with an option to acquire the remaining stake after two years;
Real Estate
During the week, Knight Frank, an international property consulting and management company, released the Prime Global Cities Index – Q2’2022 highlighting that the average selling prices for houses in the sampled prime cities globally recorded a capital appreciation of 0.9% quarter on quarter (q/q) and 8.0% year on year (y/y). For the mixed use developments, Local Authorities Pension Fund (LAPF) announced plans to construct a mixed use development facility at an estimated cost of kshs 10.0 bn in Nakuru County. Additionally, property developer Mi Vida Homes completed and launched the first phase of the Mi Vida Garden City Project worth Kshs 12.0 bn. In the Nairobi Stock Exchange, Fahari I-REIT closed the week trading at an average price of Kshs 7.0 per share;
Focus of the Week
In the face of unprecedented economic occurrences such as the resurgence of COVID-19 infections and the persistent geopolitical pressures, the pensions industry continues to feel the impact in terms of both sustainability and adequacy, with the pension schemes registering lower returns hence a decline in their asset value. The economic uncertainties influence retirement benefit schemes through various ways including: i) Increased individuals exiting the schemes ii) A decline in the disposable income hence lower contributions, and, iii) Regulatory compliance challenges due to fair value losses in some of the asset classes invested in. This week, we turn our focus to the pensions industry in Kenya, defying and redefining the sector’s current state and what can be done going forward;
Investment Updates:
- Weekly Rates:
- Cytonn Money Market Fund closed the week at a yield of 10.58%. To invest, dial *809# or download the Cytonn App from Google Playstore here or from the Appstore here;
- Cytonn High Yield Fund closed the week at a yield of 13.93% p.a. To invest, email us at sales@cytonn.com and to withdraw the interest, dial *809# or download the Cytonn App from Google Playstore here or from the Appstore here;
- We continue to offer Wealth Management Training every Wednesday and every third Saturday of the month, from 9:00 am to 11:00 am, through our Cytonn Foundation. The training aims to grow financial literacy among the general public. To register for any of our Wealth Management Trainings, click here;
- If interested in our Private Wealth Management Training for your employees or investment group, please get in touch with us through wmt@cytonn.com;
- Any CHYS and CPN investors still looking to convert are welcome to consider one of the five projects currently available for assignment, click here for the latest term sheet;
- Cytonn Insurance Agency acts as an intermediary for those looking to secure their assets and loved ones’ future through insurance namely; Motor, Medical, Life, Property, WIBA, Credit and Fire and Burglary insurance covers. For assistance, get in touch with us through insuranceagency@cytonn.com;
- Cytonnaire Savings and Credit Co-operative Society Limited (SACCO) provides a savings and investments avenue to help you in your financial planning journey. To enjoy competitive investment returns, kindly get in touch with us through clientservices@cytonn.com;
Real Estate Updates:
- For an exclusive tour of Cytonn’s real estate developments, visit: Sharp Investor's Tour, and for more information, email us at sales@cytonn.com;
- Phase 3 of The Alma is now ready for occupation and the show house is open daily. To rent please email properties@cytonn.com;
- We have 8 investment-ready projects, offering attractive development and buyer targeted returns; See further details here: Summary of Investment-ready Projects;
- For Third Party Real Estate Consultancy Services, email us at rdo@cytonn.com;
- For recent news about the group, see our news section here;
Hospitality Updates:
- We currently have promotions for Staycations. Visit cysuites.com/offers for details or email us at sales@cysuites.com;
Money Markets, T-Bills Primary Auction:
During the week, T-bills remained undersubscribed, with the overall subscription rate coming in at 48.3%, down from the 82.1% recorded the previous week, partly attributable to the heightened perceived risks as the 2022 elections edge closer. Investors’ preference for the shorter 91-day paper persisted, with the paper receiving bids worth Kshs 7.4 bn against the offered Kshs 4.0 bn, translating to a subscription rate of 186.9%, down from the 351.9% recorded the previous week. The subscription rate for the 364-day and 182-day papers also declined to 20.5% and 20.6% from 23.8% and 32.5%, respectively, recorded the previous week. The yields on the government papers recorded mixed performance, with the yields on the 182-day and 91-day papers increasing by 0.8 bps and 7.4 bps to 9.4% and 8.5%, respectively, while the yield on the 364-day paper declined by 2.6 bps to 9.9%. The government continued to reject expensive bids, accepting a total of Kshs 11.4 bn worth of bids out of the Kshs 11.6 bn worth of bids received, translating to an acceptance rate of 98.6%.
In the Primary Bond Market, the government re-opened three bonds namely; FXD1/2022/03, FXD2/2019/10 and FXD1/2021/20 with effective tenors of 2.7 years, 6.7 years and 19.1 years respectively, in a bid to raise Kshs 50.0 bn for budgetary support. The coupon rates for the bonds are 11.8%, 12.3% and 13.4% for FXD1/2022/03, FXD2/2019/10 and FXD1/2021/20, respectively. We expect the bonds to be undersubscribed as investors continue to attach higher risk premium on the country due to the increased perceived risks arising from increasing inflationary pressures, the upcoming elections and local currency depreciation. The bonds are currently trading in the secondary market at yields of 11.7%, 13.5% and 13.9%, for FXD1/2022/03, FXD2/2019/10 and FXD1/2021/20, respectively. As such, our recommended bidding ranges for the three bonds is 11.7%-12.2% for FXD1/2022/03, 13.5%-14.0% for FXD2/2019/10 and 13.9% -14.4% for FXD1/2021/20. The period of sale for the bonds runs from 29th July to 16th August 2022.
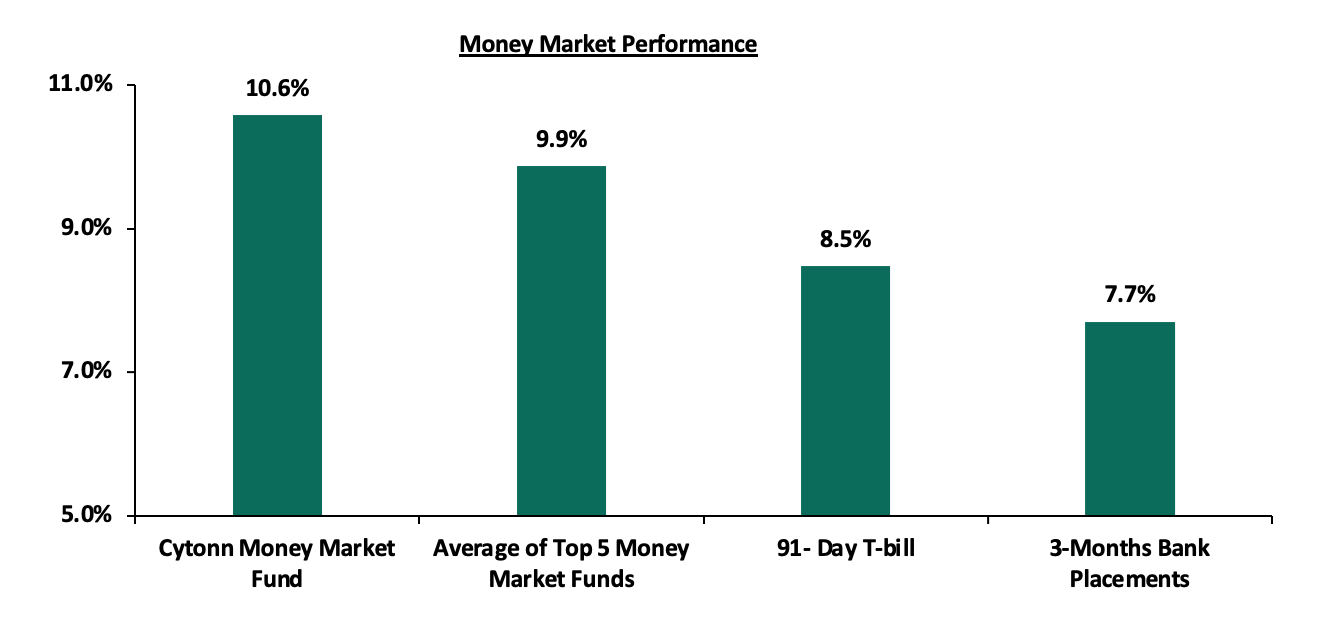
In the money markets, 3-month bank placements ended the week at 7.7% (based on what we have been offered by various banks), while the yield on the 91-day T-bill increased by 7.4 bps to 8.5%. The average yield of the Top 5 Money Market Funds increased by 100.0 bps to 9.9% from 9.8% as was recorded last week while the yield of Cytonn Money Market Fund remained relatively unchanged at 10.6%, as was recorded the previous week.
The table below shows the Money Market Fund Yields for Kenyan Fund Managers as published on 5th August 2022:
|
Money Market Fund Yield for Fund Managers as published on 5th August 2022 |
||
|
Rank |
Fund Manager |
Effective Annual Rate |
|
1 |
Cytonn Money Market Fund |
10.6% |
|
2 |
Zimele Money Market Fund |
9.9% |
|
3 |
Nabo Africa Money Market Fund |
9.9% |
|
4 |
Sanlam Money Market Fund |
9.6% |
|
5 |
Apollo Money Market Fund |
9.3% |
|
6 |
Madison Money Market Fund |
9.3% |
|
7 |
Dry Associates Money Market Fund |
9.1% |
|
8 |
NCBA Money Market Fund |
9.0% |
|
9 |
GenCap Hela Imara Money Market Fund |
9.0% |
|
10 |
CIC Money Market Fund |
9.0% |
|
11 |
Co-op Money Market Fund |
8.9% |
|
12 |
ICEA Lion Money Market Fund |
8.7% |
|
13 |
Orient Kasha Money Market Fund |
8.5% |
|
14 |
Old Mutual Money Market Fund |
8.0% |
|
15 |
AA Kenya Shillings Fund |
7.9% |
|
16 |
British-American Money Market Fund |
7.3% |
Source: Business Daily
Liquidity:
During the week, liquidity in the money markets eased, with the average interbank rate declining to 5.3% from 5.4% recorded the previous week, partly attributable to government payments which offset tax remittances. The average interbank volumes traded declined by 0.2% to Kshs 21.4 bn from Kshs 21.8 bn recorded the previous week.
Kenya Eurobonds:
During the week, the yields on Eurobonds recorded mixed performance with the yield on the 30-year Eurobond issued in 2018 being the only gainer, increasing by 0.1% points to 13.4%, from 13.3% recorded the previous week. The yield on the 10-year Eurobond issued in 2014 recorded the highest decline having declined by 0.9% points to 15.3%, from 16.2%, recorded the previous week. The table below shows the summary of the performance of the Kenyan Eurobonds as of 5th August 2022;
|
Kenya Eurobond Performance |
||||||
|
2014 |
2018 |
2019 |
2021 |
|||
|
Date |
10-year issue |
10-year issue |
30-year issue |
7-year issue |
12-year issue |
12-year issue |
|
3-Jan-22 |
4.4% |
8.1% |
8.1% |
5.6% |
6.7% |
6.6% |
|
30-Jun-22 |
17.0% |
14.7% |
13.7% |
16.1% |
13.8% |
12.7% |
|
29-Jul-22 |
16.2% |
14.9% |
13.3% |
16.3% |
14.0% |
13.3% |
|
1-Aug-22 |
14.8% |
14.6% |
13.4% |
16.1% |
13.9% |
12.9% |
|
2-Aug-22 |
14.8% |
14.5% |
13.2% |
16.0% |
13.7% |
12.8% |
|
3-Aug-22 |
15.4% |
14.8% |
13.3% |
16.5% |
14.0% |
12.7% |
|
4-Aug-22 |
15.3% |
14.8% |
13.4% |
16.2% |
14.0% |
12.7% |
|
Weekly Change |
(0.9%) |
(0.1%) |
0.1% |
(0.2%) |
0.0% |
(0.6%) |
|
MTD Change |
(1.7%) |
0.1% |
(0.4%) |
0.1% |
0.2% |
(0.1%) |
|
YTD Change |
10.9% |
6.7% |
5.3% |
10.6% |
7.3% |
6.1% |
Source: Central Bank of Kenya (CBK)
Kenya Shilling:
During the week, the Kenyan shilling depreciated by 0.2% against the US dollar to close the week at Kshs 119.1, from Kshs 118.8 recorded the previous week, partly attributable to increased dollar demand from the oil and energy sectors against a slower supply of hard currency. On a year to date basis, the shilling has depreciated by 5.3% against the dollar, higher than the 3.6% depreciation recorded in 2021. We expect the shilling to remain under pressure in 2022 as a result of:
- High global crude oil prices on the back of persistent supply chain bottlenecks further exacerbated by the Russian-Ukrainian geopolitical pressures at a time when demand is picking up with the easing of COVID-19 restrictions and as economies continue to recover. Key to note, risks abound the recovery following the resurgence of COVID-19 infections in the country and the country’s trading partners,
- Increased demand from merchandise traders as they beef up their hard currency positions in anticipation for increased demand as economies gradually recover,
- An ever-present current account deficit due to an imbalance between imports and exports, with Kenya’s current account deficit estimated to come in at 5.3% of GDP in the 12 months to May 2022 compared to the 5.0% for a similar period in 2021. The wider deficit reflects a higher import bill, particularly for petroleum products, with the imports for Q1’2022 increasing by 14.5%, 5.7% points higher than the 8.8% increase in exports, and,
- The aggressively growing government debt, with Kenya’s public debt having increased at a 10-year CAGR of 18.2% to Kshs 8.6 tn in May 2022, from Kshs 1.6 tn in May 2012 thus putting pressure on forex reserves to service some of the public debt. It is worth noting that the average GDP growth over the same period has been 3.9%, an indicator that the increase in debt is not translating into GDP growth.
The shilling is however expected to be supported by:
- High Forex reserves currently at USD 7.7 bn (equivalent to 4.5-months of import cover), which is above the statutory requirement of maintaining at least 4.0-months of import cover, and the EAC region’s convergence criteria of 4.5-months of import cover. In addition, the reserves were boosted by the USD 750.0 mn World Bank loan facility received in March 2022 and are expected to be boosted further by the USD 235.6 mn funding from the International Monetary Fund (IMF), and,
- Improving diaspora remittances evidenced by a 6.6% y/y increase to USD 326.1 mn as of June 2022, from USD 305.9 mn recorded over the same period in 2021, which has continued to cushion the shilling against a faster depreciation. In the recently released June 2022 diaspora remittances figures, North America remained the largest source of remittances to Kenya accounting for 59.1% in the period, followed by Europe at 18.2% while the rest of the world accounted for 22.7% of the total.
Weekly Highlight:
Stanbic Bank’s July 2022 Purchasing Manager’s Index (PMI)
During the week, Stanbic Bank released its monthly Purchasing Manager’s Index (PMI) highlighting that the index for the month of July 2022 declined for the fourth consecutive time to 46.3, from 46.8 recorded in June 2022 pointing towards a further deterioration in the business environment in the Kenyan private sector. Notably, this was the lowest reading since April 2021, when the index came in at 41.5. The decline was largely attributable to the prevailing inflationary pressures with the inflation rate for the month of July coming in at 8.3%, from the 7.9% recorded in June 2022. The private sector was characterized by a rise in input costs, occasioned by the high fuel prices as fuel is a major input which consequently led to a decline in new order volumes due to reduced consumer spending. Key to note, purchasing activity by businesses recorded the highest decline since April 2021, but stock of purchases continued to rise as firms continued to accumulate stocks to ensure sufficient inventory levels to cater for future order needs. The chart below summarizes the evolution of the PMI in the last two years;
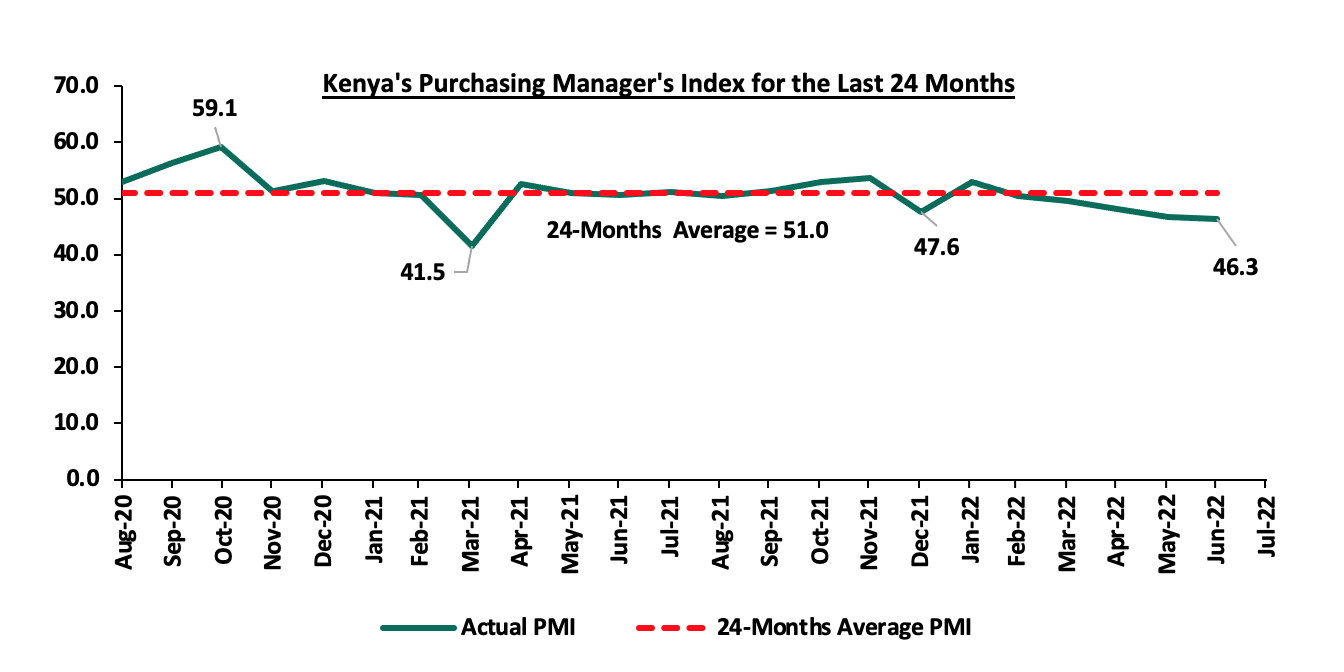
*** Key to note, a reading above 50.0 signals an improvement in business conditions, while readings below 50.0 indicate a deterioration.
Kenya’s general business environment continues to deteriorate with the average PMI for the last seven months coming in at 48.8, as the cost of living remains elevated thus forcing consumers to cut on spending. The key challenge remains the cost of input materials such as fuel which has been further accelerated by the depreciation of the Kenyan shilling. Going forward, we maintain our view that the recovery of the private sector business environment in Kenya is largely pegged on how quickly the global economy stabilizes, how well the Independent Electoral and Boundaries Commission (IEBC) conducts the August elections and how soon the inflationary pressures ease.
Rates in the Fixed Income market have remained relatively stable due to the relatively ample liquidity in the money market. As it is still early in the financial year, the government is 53.6% behind its prorated borrowing target of Kshs 57.5 bn having borrowed Kshs 26.7 bn of the Kshs 581.7 bn borrowing target for the FY’2022/2023. We expect sustained gradual economic recovery as evidenced by the revenue collections of Kshs 2.0 tn in the FY’2021/2022, equivalent to a 2.8% outperformance. Despite the performance, we believe that the projected budget deficit of 6.2% is relatively ambitious given the downside risks and deteriorating business environment occasioned by high inflationary pressures. We however expect the support from the IMF and World Bank to finance some of the government projects and thus help maintain a stable interest rate environment since the government is not desperate for cash. Owing to this, our view is that investors should be biased towards short-term fixed-income securities to reduce duration risk.
Markets Performance
During the week, the equities market was on an upward trajectory with NASI and NSE 25 both gaining by 0.7% while NSE 20 gained by 1.5%, taking their YTD performance to losses of 15.0%, 9.8% and 12.2%, for NASI, NSE 20 and NSE 25, respectively. The equities market performance was mainly driven by gains recorded by large-cap stocks such as Bamburi, ABSA, NCBA and Standard Chartered (SCBK) of 12.7%, 3.2%, 2.4% and 1.7%, respectively. The gains were however weighed down by losses recorded by BAT and EABL which declined by 1.4% and 0.2%, respectively.
During the week, equities turnover increased by 19.8% to USD 13.6 mn, from USD 11.4 mn recorded the previous week, taking the YTD turnover to USD 547.2 mn. Foreign investors remained net sellers, with a net selling position of USD 4.3 mn, from a net selling position of USD 6.4 mn recorded the previous week, taking the YTD net selling position to USD 135.3 mn.
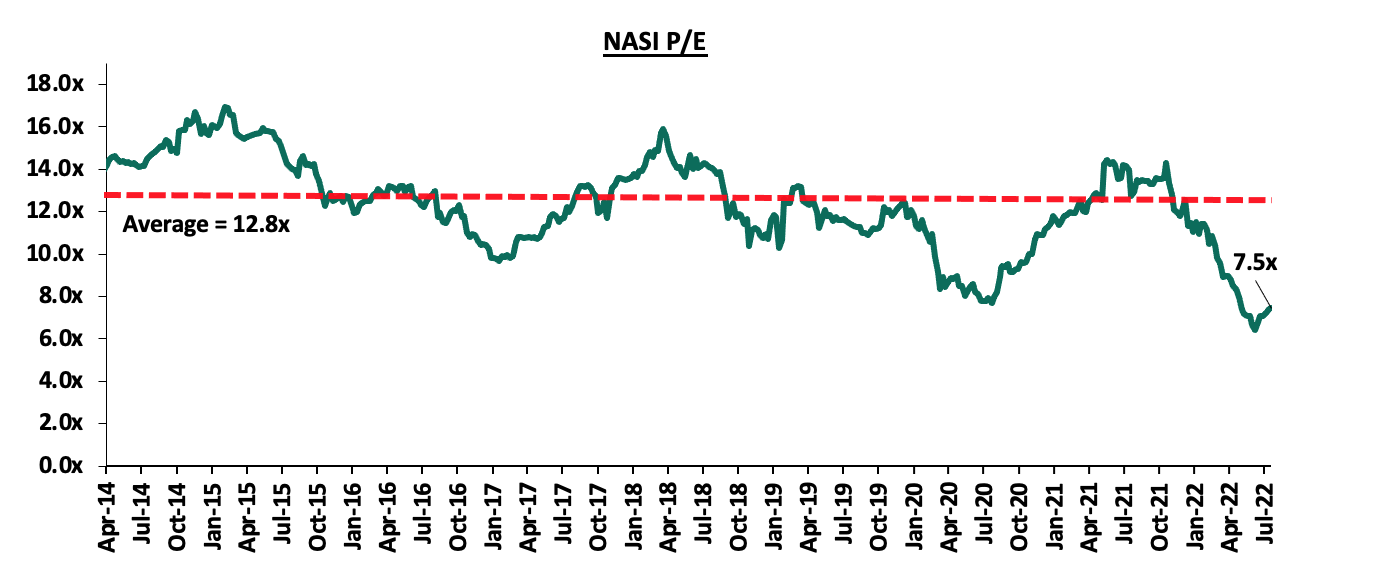
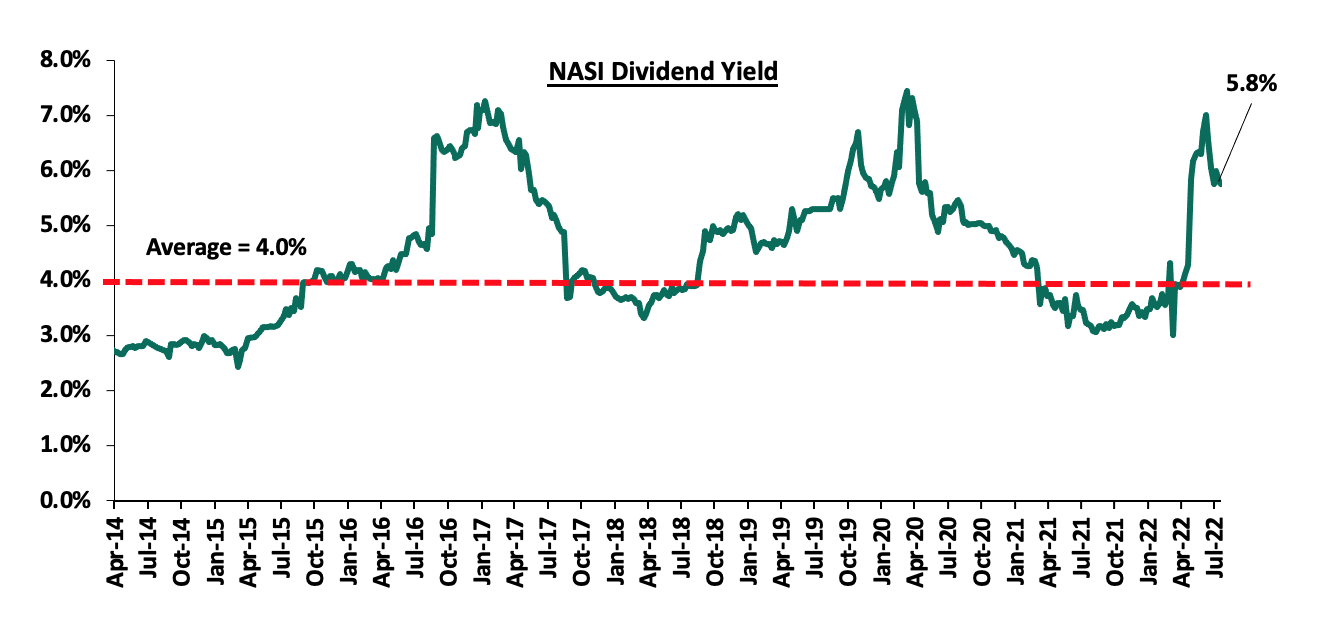
The market is currently trading at a price to earnings ratio (P/E) of 7.5x, 41.2% below the historical average of 12.8x, and a dividend yield of 5.8%, 1.8% points above the historical average of 4.0%. Key to note, NASI’s PEG ratio currently stands at 1.0x, an indication that the market is fairly valued relative to its future growth. A PEG ratio greater than 1.0x indicates the market may be overvalued while a PEG ratio less than 1.0x indicates that the market is undervalued. The charts below indicate the historical P/E and dividend yields of the market:
Weekly Highlights:
- Q1’2022 Insurance Industry Report
During the week, the Insurance Regulatory Authority of Kenya (IRA) released the Quarterly Insurance Industry Report for the period ending 31st March 2022 highlighting that the industry’s profits after tax declined by 73.7% to Kshs 0.4 bn, from Kshs 1.5 bn recorded in Q1’2021. The decline in profits was mainly driven by a 10.3% increase in claims incurred to Kshs 18.4 bn in Q1’2022, from Kshs 16.7 bn in Q1’2021 coupled with a 10.9% increase in management expenses to Kshs 11.6 bn, from Kshs 10.5 bn in Q1’2021. The industry’s gross premiums rose by 11.6% to Kshs 88.4 bn, from Kshs 79.3 bn recorded in Q1’2021, with the general insurance business contributing 61.0% of the industry’s premium income, a 0.2% points decline from the 61.2% contribution witnessed in Q1’2021. However, the general insurance business has continued to report high underwriting losses mainly attributed to the increase in loss ratios as the net claims outpace net premiums.
Other key take-outs from the report include:
- Investment income declined by 17.9% to Kshs 9.0 bn in Q1’2022, from Kshs 11.0 bn recorded in Q1’2021 for long term insurance businesses, and also declined by 12.9% for general insurance businesses to Kshs 2.4 bn, from Kshs 2.8 bn recorded in Q1’2021. The declines can be attributed to fair value losses on quoted equity investments in the capital market as evidenced by the declines in the NASI, NSE 25 and NSE 20 which posted losses of 6.8%, 5.1% and 3.5%, respectively, at the end of Q1’2022,
- The net claims for the long term insurance business increased by 2.8% to Kshs 20.1 bn, from Kshs 19.6 bn in Q1’2021, mainly driven by increased but modest requests from individuals wishing to access their pension benefits given the reduction in their disposable income. The loss ratio for the long term business declined by 4.6% points to 64.3%, from 68.9% recorded in Q1’2021,
- The loss ratio for the general insurance businesses declined to 67.7% in Q1’2022, from 71.2% in Q1’2021 owing to a 15.9% increase in net earned premium income which outpaced the 10.3% increase in the claims incurred. The increase in net premium earned was mainly driven by the 23.4% growth in motor insurance net premium earned to Kshs 5.7 bn in Q1’2022, from Kshs 4.6 bn in Q1’2021.
- The combined ratio for general insurance business declined by 4.3% points to 101.9% in Q1’2021, from 106.2% recorded in Q4'2021 and 5.5% points lower than the 107.4% recorded in Q1'2021. The decline in the combined ratio was mainly attributable to the decreasing claims ratio, having decreased by 3.5% points to 67.7% in Q1'2022, from 71.2% in Q1'2021, coupled with a 1.8% points decrease in management expense ratio to 28.2%, from 30.0% in Q1’2021, and,
- General insurance businesses recorded an underwriting loss of Kshs 0.5 bn in Q1’2022 which was an improvement as compared to a loss of Kshs 1.7 bn recorded in Q1’2021. The decline in the loss was mainly driven by a 476.5% increase in profits from personal accident class insurance to Kshs 0.7 bn, from Kshs 0.1 bn in Q1’2021, coupled with 52.3% increase in profits for Workmen’s compensation class to Kshs 0.6 bn from 0.4 bn in Q1’2021. Personal accident insurance made the highest underwriting profit of Kshs 0.7 bn while motor private and medical classes of general insurance business incurred the highest losses of Kshs 1.0 bn and Kshs 0.6 bn respectively.
The insurance sector has continued to suffer from low penetration rate, standing at 2.3% as at the end of 2021 which is significantly lower than the global average of 7.4%, mainly attributable to low disposable income in the country as well as lack of awareness amongst most people. As such, the insurance core business still remains unprofitable as evidenced by the General insurance’s combined ratio of 101.9% in Q1’2022 which translated to an underwriting loss of Kshs 0.5 bn. On the upside, the sector has continued to witness increased adoption of technological tools in provision insurance services and delivery of innovative insurance products, which have positively impacted the outlook. We expect the insurance sector to record gradual improvements following the continued economic recovery evidenced by a 6.8% growth recorded in Q1’2022, up from the 2.7% growth recorded in Q1’2022, highlighting an improving economic environment. However, risk abound the positive outlook on the back of high loss ratios as well as declining investment income as a result of poor performance of the various asset classes which are likely to lead to constrained profits.
- KCB Group’s acquisition of Trust Merchant Bank (TMB)
During the week, KCB Group announced that it had entered into a final agreement with shareholders of Trust Merchant Bank (TMB) to acquire an 85.0% stake in the Democratic Republic of Congo (DRC)- based lender, with an option to acquire the remaining stake after two years. If successful, the deal will make KCB Group the second Kenyan banking group to enter the DRC banking market after Equity Group Holdings. For this acquisition, KCB will pay a cash consideration based on the net asset value of TMB at completion of the proposed transaction using a Price to Book (P/B) multiple of 1.5x, subject to regulatory, shareholders and other approvals. Key to note, the P/B multiple is higher than the 8-year acquisitions average P/B of 1.2x as well as the current average P/B of the listed banking stocks of 1.0x. We estimate a payment of Kshs 15.7 bn by KCB at the trading multiple of 1.5x given TMB’s book value of FC 208.4 bn (Kshs 12.4 bn) as of 2020. The acquisition, aimed at being completed by the end of Q3’2022 will see KCB Group take over 110 branches from TMB, taking its total branch network to 606, from the current 496 branches.
In our view, the proposed acquisition of TMB by KCB Group will see the group increase its footprint in the region in line with its expansion strategy. By expanding its distribution networks and market share, we expect KCB group to benefit from improved resilience to shocks given higher capital buffers, as well as lower supervisory and compliance costs. Additionally, the acquisition will present an opportunity for increased profitability as the Group expects the bank to help drive business growth in the future, given the attractiveness of DRC as an entry market mainly due to the low banking penetration which was estimated to be around 6.0% in 2019 as compared to 29.6% bank account holding in Kenya, in a similar period. Below is a list of KCB Group’s recent acquisitions:
|
Bank Acquired |
Book Value at Acquisition (Kshs bn) |
Transaction Stake |
Transaction Value (Kshs bn) |
P/Bv Multiple |
Date |
|
Trust Merchant Bank |
12.4 |
85.00% |
15.7 |
1.5x |
Aug-22 |
|
Banque Populaire du Rwanda |
5.3 |
100.00% |
5.6 |
1.1x |
Aug-21 |
|
National Bank of Kenya |
7 |
100.00% |
6.6 |
0.9x |
Sep-19 |
|
Imperial Bank |
Unknown |
Undisclosed |
Undisclosed |
N/A |
Dec-18 |
Universe of coverage:
|
Company |
Price as at 29/07/2022 |
Price as at 05/08/2022 |
w/w change |
YTD Change |
Target Price* |
Dividend Yield |
Upside/ Downside** |
P/TBv Multiple |
Recommendation |
|
Jubilee Holdings |
248.8 |
245.5 |
(1.3%) |
(22.5%) |
379.4 |
5.7% |
60.2% |
0.4x |
Buy |
|
Kenya Reinsurance |
2.0 |
2.1 |
2.5% |
(10.5%) |
3.2 |
4.9% |
59.9% |
0.2x |
Buy |
|
I&M Group*** |
17.0 |
17.0 |
0.0% |
(20.6%) |
22.3 |
8.8% |
40.0% |
0.5x |
Buy |
|
Sanlam |
12.0 |
11.6 |
(3.3%) |
0.4% |
15.9 |
0.0% |
37.1% |
1.2x |
Buy |
|
Diamond Trust Bank*** |
49.0 |
49.0 |
0.0% |
(17.6%) |
62.4 |
6.1% |
33.5% |
0.2x |
Buy |
|
KCB Group*** |
41.2 |
41.8 |
1.5% |
(8.3%) |
52.2 |
7.2% |
32.2% |
0.8x |
Buy |
|
Liberty Holdings |
5.6 |
5.9 |
5.4% |
(16.4%) |
7.8 |
0.0% |
32.2% |
0.4x |
Buy |
|
ABSA Bank*** |
11.1 |
11.4 |
3.2% |
(3.0%) |
13.6 |
9.6% |
28.9% |
1.1x |
Buy |
|
Britam |
6.1 |
6.0 |
(1.3%) |
(20.6%) |
7.7 |
0.0% |
28.3% |
1.0x |
Buy |
|
Co-op Bank*** |
11.9 |
11.9 |
0.0% |
(8.5%) |
14.1 |
8.4% |
26.9% |
0.9x |
Buy |
|
NCBA*** |
25.0 |
25.6 |
2.4% |
0.4% |
29.1 |
11.7% |
25.6% |
0.6x |
Buy |
|
Stanbic Holdings |
95.5 |
96.0 |
0.5% |
10.3% |
109.8 |
9.4% |
23.8% |
0.9x |
Buy |
|
Equity Group*** |
48.0 |
48.3 |
0.5% |
(8.5%) |
54.4 |
6.2% |
19.0% |
1.2x |
Accumulate |
|
Standard Chartered*** |
133.0 |
135.3 |
1.7% |
4.0% |
137.0 |
10.4% |
11.6% |
1.1x |
Accumulate |
|
CIC Group |
2.0 |
2.0 |
(2.5%) |
(8.3%) |
2.1 |
0.0% |
5.5% |
0.7x |
Hold |
|
HF Group |
3.3 |
3.5 |
5.1% |
(7.9%) |
2.8 |
0.0% |
(20.0%) |
0.2x |
Sell |
|
Target Price as per Cytonn Analyst estimates **Upside/ (Downside) is adjusted for Dividend Yield ***For Disclosure, these are stocks in which Cytonn and/or its affiliates are invested in |
|||||||||
We are “Neutral” on the Equities markets in the short term due to the current adverse operating environment and huge foreign investor outflows, and, “Bullish” in the long term due to current cheap valuations and expected global and local economic recovery.
With the market currently trading at a fair value to its future growth (PEG Ratio at 1.0x), we believe that investors should reposition towards value stocks with strong earnings growth and that are trading at discounts to their intrinsic value. We expect the current high foreign investors sell-offs, the upcoming Kenyan general elections and the slow vaccine rollout to continue weighing down the economic outlook in the short term.
- Industry Report
During the week, Knight Frank, an international property consulting and management company, released the Prime Global Cities Index – Q2’2022, a report highlighting the performance of prime residential cities across the globe based on capital appreciation. Notably, Nairobi was the only ranked African City signifying the impressive growth of the area. The following were the key take-outs from the report:
- The average selling prices for houses in the sampled prime cities globally recorded a capital appreciation of 0.9% q/q and 8.0% y/y. This was attributed to the high construction costs, coupled with the high demand for decent houses across the globe resulting from; i) positive demographics such as high urbanization growth rates, ii) infrastructure developments which are mostly concentrated in the urban areas, and, iii) adequate amenities which are also mostly concentrated in urban cities thus enhancing investments,
- Dubai was the best performing city with the highest y/y capital appreciation of 64.8% driven by; i) its magnificent amenities and infrastructure developments enhancing investments such as Dubai Highway, City Centre Mirdif, Dubai Mall, and Dubai Water Canal, among many others, ii) favorable tax conditions which attract rapid investments, iii) ample security boosting investments, and, iv) its recognition as a global trade and financial hub thus attracting high end investments. However, on a q/q basis, the prices declined slightly by 0.6% amidst a decline in the property transaction volumes driven by the high cost of living resulting from high inflation rates, coupled with the increasing mortgage interest rates,
- On the other hand, Wellington city ranked last from the sampled prime cities with a y/y and q/q price correction of 8.1% and 6.8%, respectively, attributed to a decline in property demand and transactions in the area, and,
- Nairobi which was the only ranked African city came in at position 33 out of the sampled 45 cities globally, with a y/y capital appreciation of 2.4%. The increase in performance was mainly driven by increased demand for housing units as a result of: i) rapid infrastructure developments promoting investments such as the Nairobi Expressway, ii) a growing middle income class, iii) recognition of Nairobi as a regional hub thus promoting investments, and, iv) a high urbanization growth rate in Kenya currently at 4.0% compared to the world’s 1.8% according to the World Bank. The table below shows the house selling price performance for various prime cities in the world as at Q2’2022:
|
Capital Appreciations For Prime Cities in the World Q2’2022 |
|||||||||||
|
# |
City |
Q/Q Change (Q1'2022-Q2'2022) |
YoY Change (Q2'2021-Q2'2022) |
# |
City |
Q/Q Change (Q1'2022-Q2'2022) |
YoY Change (Q2'2021-Q2'2022) |
# |
City |
Q/Q Change (Q1'2022-Q2'2022) |
YoY Change (Q2'2021-Q2'2022) |
|
1 |
Dubai |
(0.6%) |
64.8% |
16 |
Taipei |
1.7% |
8.6% |
31 |
Mumbai |
1.4% |
2.9% |
|
2 |
Miami |
11.8% |
37.3% |
17 |
Melbourne |
(0.3%) |
8.2% |
32 |
London |
0.8% |
2.5% |
|
3 |
Los Angeles |
7.2% |
23.4% |
18 |
Shenzhen |
2.3% |
7.5% |
33 |
Nairobi |
(0.1%) |
2.4% |
|
4 |
San Fransisco |
8.5% |
22.2% |
19 |
New York |
2.3% |
7.3% |
34 |
Bucharest |
0.2% |
2.2% |
|
4 |
Seoul |
4.9% |
20.9% |
20 |
Vancouver |
1.5% |
5.8% |
35 |
Bengaluru |
0.4% |
1.8% |
|
6 |
Gold Coast |
1.7% |
15.4% |
21 |
Geneva |
0.8% |
5.4% |
36 |
Shanghai |
(1.2%) |
1.7% |
|
7 |
Toronto |
(1.3%) |
13.8% |
22 |
Lisbon |
1.4% |
5.4% |
37 |
Delhi |
1.0% |
1.2% |
|
8 |
Berlin |
5.2% |
12.6% |
23 |
Stockholm |
(4.7%) |
5.2% |
38 |
Auckland |
(9.0%) |
1.0% |
|
9 |
Edinburgh |
4.4% |
11.2% |
24 |
Beijing |
1.3% |
4.7% |
39 |
Monaco |
(2.0%) |
0.1% |
|
10 |
Dublin |
2.2% |
10.2% |
25 |
Vienna |
1.1% |
4.6% |
40 |
Manila |
(0.6%) |
(0.1%) |
|
11 |
Zurich |
3.7% |
10.2% |
26 |
Perth |
0.1% |
4.6% |
41 |
Kuala Lampur |
0.0% |
(0.5%) |
|
12 |
Tokyo |
(4.5%) |
10.2% |
27 |
Bangkok |
1.5% |
4.5% |
42 |
Jakarta |
(0.8%) |
(2.0%) |
|
13 |
Sydney |
(0.6%) |
9.9% |
28 |
Madrid |
1.5% |
4.4% |
43 |
Guangzhou |
3.8% |
(2.1%) |
|
14 |
Paris |
1.3% |
8.9% |
29 |
Singapore |
1.6% |
3.6% |
44 |
Frankfurt |
(4.0%) |
(5.1%) |
|
15 |
Brisbane |
0.0% |
8.9% |
30 |
Hong Kong |
(0.1%) |
3.1% |
45 |
Wellington |
(6.8%) |
(8.1%) |
|
Average Change |
0.9% |
8.0% |
|||||||||
Source: Knight Frank Research 2022
Nairobi City continues to position itself as a viable area for Real Estate investments having been the only ranked African city globally in the period under review and in Q1’2022 as well. As such, we expect more properties in the city to record capital appreciations, which trickles down to the overall performance of the residential sector coupled with increased investor confidence and appetite for the sector.
- Mixed Use Developments
- Local Authorities Pension Fund (LAPF) plans to Construct a Kshs 10.0 bn Mixed Use Development Facility in Nakuru County
During the week, Local Authorities Pension Fund (LAPF) Kenya announced plans to construct a mixed use development facility at an estimated cost of kshs 10.0 bn in Nakuru County. The mixed use facility will be comprised of a shopping mall, a five-star hotel, a warehouse block, residential apartments, a kindergarten school, a petrol station, and, an amusement park. Consequently, the construction of the facility which will be done in phases for an undisclosed period, will add to the pension administrator’s investment assets, currently over Kshs 51.6 bn. Other Real Estate property by LAPF include the Maksembo affordable housing project consisting of 1,870 units in Kisumu County, near Kisumu International Airport and Moi Stadium. LAPF’s decision to invest in Nakuru County is mainly driven by;
- Rapid economic growth in the area following its upgrade into a city by President Uhuru Kenyatta in December 2021,
- Availability of infrastructure developments as the facility is to be constructed off the busy Nakuru - Kisumu Highway,
- Its need to expand its asset base and revenue sources by venturing into Nakuru’s property sector, and,
- Nakuru’s rapid population growth rate of 2.4% as at 2019, which in turn drives demand for goods, services, and housing units.
- Mi Vida Homes Completes and Launches Phase I of Mi Vida Garden City Housing Project
During the week, property developer Mi Vida Homes completed and launched the first phase of the Mi Vida housing project worth Kshs 12.0 bn. The Construction of the 221 apartment project began in July 2019 and was jointly done by Indian Shapoorji Pallonji Real Estate (SPRE) firm, in conjunction with British private equity firm Actis Limited. The property sits on the larger 47- acre piece of land at Garden City Thika Road. The completion comes barely one month after Mi Vida Homes announced plans to break ground of 800 affordable housing units’ project worth more than Kshs 2.0 bn in Nairobi’s Riruta area by the end of the year, signifying the investors’ appetite for Kenyan property market. Below is the summary of the sales prices of the Mi Vida Garden City Apartments Phase I project;
|
Mi Vida Phase I |
||||
|
Typology |
Type |
Unit size (SQM) |
Unit Price (Kshs) |
Price per SQM (Kshs) |
|
1 Bedroom |
A |
56 |
8.8mn |
157,143 |
|
1 Bedroom |
B |
58 |
9.1mn |
156,897 |
|
1 Bedroom |
C |
62 |
9.2mn |
148,387 |
|
1 Bedroom |
D |
63 |
9.9mn |
157,143 |
|
2 Bedroom |
Compact |
86 |
12.1mn |
140,698 |
|
2 Bedroom + DSQ |
A |
94 |
13.3mn |
141,489 |
|
2 Bedroom + DSQ |
B |
99 |
13.7mn |
138,384 |
|
3 Bedroom + DSQ |
|
123 |
15.7mn |
127,642 |
|
Average |
|
|
|
145,973 |
Source: Cytonn Research
The increased appetite for Mixed–Use Development can be attributed to the good returns that the segment offers. According to our Nairobi Metropolitan Area Mixed-Use Developments (MUDs) Report 2021, MUDs recorded an average rental yield of 7.2% in 2021, 0.7% points higher than the respective single-use, retail, commercial office and residential themes with an average yield of 6.5%. This was mainly attributed to their convenience which incorporates working, shopping and living spaces, thus preferred by many investors. The table below shows the thematic comparison of rental yield performance between Single Use Themes and Mixed Use Developments;
|
Thematic Performance of MUDs in Key Nodes 2021 |
||
|
|
MUD Themes Average |
Market Average |
|
Theme |
Rental Yield 2021 |
Rental Yield 2021 |
|
Retail |
8.4% |
7.8% |
|
Offices |
7.1% |
6.6% |
|
Residential |
6.0% |
5.2% |
|
Average |
7.2% |
6.5% |
Source: Cytonn Research
We expect the mixed use development sector performance to continue being on an upward trajectory, as a result of their convenience thus more preferred as opposed to the single use theme developments, coupled with the adequate amenities available leading to their increased demand. This is in addition to Kenya’s recognition as a regional hub thus attracting foreign investments and the overall development and performance of the sector.
- Real Estate Investment Trusts (REITs)
In the Nairobi Stock Exchange, ILAM Fahari I - REIT closed the week trading at an average price of Kshs 7.0 per share. The performance represents a 6.0% Year-to-Date (YTD) increase from Kshs 6.4 per share. On an Inception-to-Date (ITD) basis, the REIT’s performance continues to be weighed down having realized a 65.0% decline from Kshs 20.0. The graph below shows Fahari I-REIT’s performance from November 2015 to July 2022:
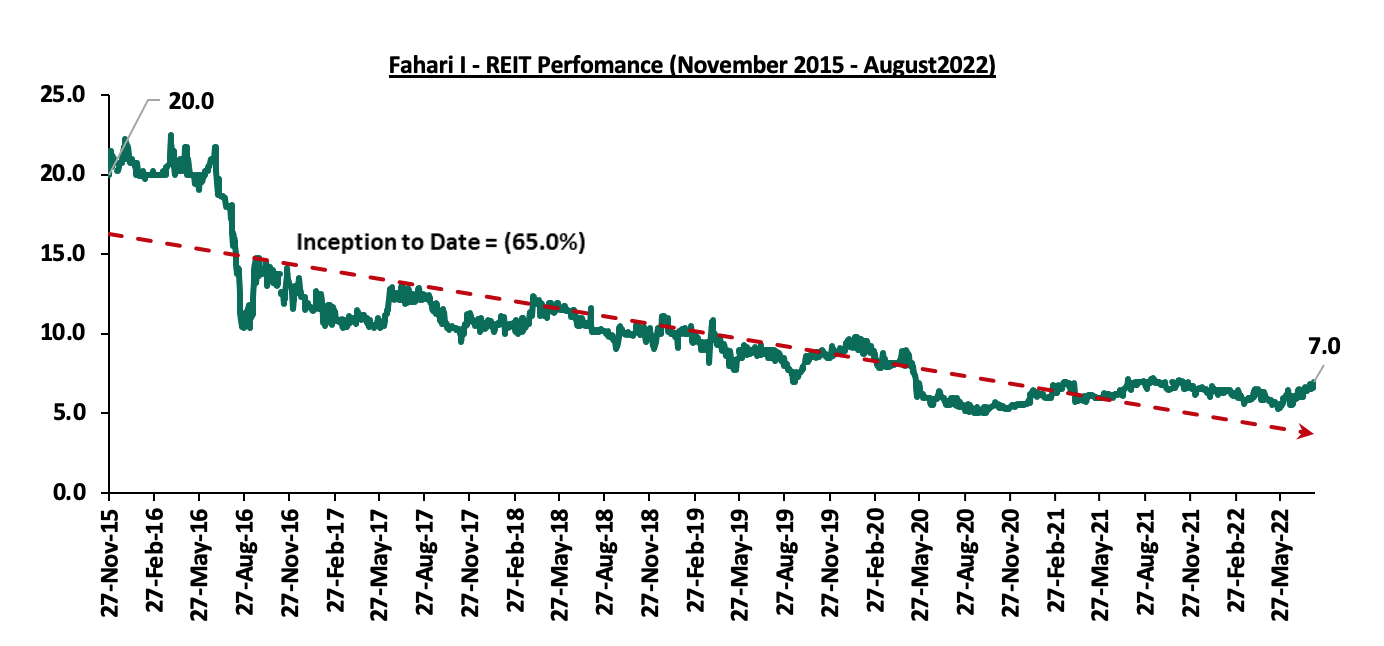
Kenya’s property market continues to register remarkable activities which in turn drives its performance towards an upward trajectory. We expect a similar trend to continue shaping the performance of the sector driven by factors such as; increasing construction activities and investor confidence in Kenya’s housing market, Nairobi’s recognition as a regional hub hence promoting investments, and, increasing popularity of the mixed use developments which in turn promote investments. Conversely, investor’s minimal appetite for the REIT instrument is expected to continue weighing down the overall investments in REITs.
In the face of unprecedented economic occurrences such as the resurgence of COVID-19 infections and the persistent geopolitical pressures, the pensions industry continues to feel the impact in terms of both sustainability and adequacy, with the pension schemes registering lower returns hence a decline in their asset value. The economic uncertainties influence retirement benefit schemes through various ways including: i) Increased individuals exiting the schemes ii) A decline in the disposable income hence lower contributions, and, iii) Regulatory compliance challenges due to fair value losses in some of the asset classes invested in. Closer home, the pensions industry in Kenya has experienced steady growth over time, with the assets under management having grown at a 10-year CAGR of 14.4% to Kshs 1,547.4 bn in 2021 from Kshs 403.2 bn in 2011. However, pensions uptake is still low with only 12.0% of the adult population in the labor force saving for their retirement in retirement benefits schemes as of 2021. Overall, the key challenge remains the extent to which pension schemes can accommodate the existing economic uncertainties.
We have been tracking the performance of retirement benefit schemes with the most recent topic being Kenya Retirement Benefit Schemes FY’2021 Performance. This week, we turn our focus to the progress of Kenyan pensions schemes in 2022, by providing a deep analysis of the current status and what can be done going forward. Therefore, we shall look at the topic in five different sections:
- Introduction
- The Current State of Retirement Benefits Schemes in Kenya
- Factors Hindering the Growth of Retirement Benefits Schemes in Kenya
- Key Considerations to Improving Retirement Prospects in Kenya
- Conclusion
Section 1: Introduction
Retirement Benefits Schemes allow members to make regular contributions during their working years and once a member retires either after attaining the retirement age or earlier due to other factors, mainly ill-health, these contributions plus accrued interest are utilized to provide retirement income to the member. Having a retirement plan cushions retirees from reduced income and ensures decent living after retirement. The retirement schemes in Kenya are categorized based on contributions, mode of payment at retirement, membership and mode of investment, as follows:
- Based on Contributions:
- Defined Benefits Schemes – Defined benefit plans are funded either exclusively by employer contributions or sometimes require employee contributions. The cost of the promises being earned each year are calculated in advance, to advice on the required amount that needs to be contributed each year to keep the scheme healthy, and,
- Defined Contribution Scheme - Member’ and employer’ contributions are fixed either as a percentage of pensionable earnings or as a shilling amount. However, members have the freedom to contribute more than the defined rate (Additional Voluntary Contribution).
- Based on Mode of Payment at Retirement:
- Pension Scheme – At retirement, a member of a pension scheme may access up to a third of their contributions and contributions made on their behalf plus accrued interest as a lump sum and then the remainder is used to purchase an annuity (pension) that pays a periodic income to the pensioner in their retirement years, usually, monthly, and,
- Provident Fund - At retirement, a member of a provident fund receives their contribution and contributions made on their behalf plus accrued interest as a Lump Sum.
- Type of Membership:
- Occupational Retirement Benefits Scheme - These are schemes that are set up by an employer where only members of their staff are eligible to join,
- Umbrella Retirement Benefits Scheme - These are schemes that pool the retirement contributions of multiple employers on behalf of their employees thereby reducing the average cost per member and enhancing the overall returns of both the employer and the employees’ contributions, and,
- Individual Retirement Benefits Scheme – These are schemes where individuals contribute directly into the scheme towards saving for their retirement. The contributions are usually flexible in order to accommodate an individual’s financial circumstances.
- Mode of Investment:
- Segregated Funds – These are Funds where members’ contributions are invested directly by the Trustees via an appointed Fund Manager. The Trustees establish an appropriate Investment Policy which is then implemented by the Fund Manager. The scheme directly holds the investments and the returns are fully accrued to the scheme for the benefit of its members, and,
- Guaranteed Funds - Guaranteed funds are those offered by insurance companies where the members’ contributions are pooled together. The insurance company guarantees a minimum rate of return and should the actual return surpass the minimum guaranteed rate, the insurance company may either top up the minimum rate with a bonus rate of return or reserve the extra return.
As people progressively live longer and retire from employment, it requires more money at retirement. The requirement for a longer period of income also impacts the ability to retire early, being able to stop working due to a health condition or keep the same standard of living. Key to note, saving enough money for retirement reduces the over-reliance on one’s relatives during retirement. As such, it is important for any person with the ability to generate income to join at least one retirement saving plan for a better retirement life.
Section 2: The Current State of Retirement Benefits Schemes in Kenya
- Growth of Retirement Benefits Schemes
According to the Retirement Benefits Authority (RBA), the retirement benefits schemes industry has registered significant growth with the Assets under Management growing steadily at a 10-year CAGR of 14.4% to Kshs 1,547.4 bn in 2021 from Kshs 403.2 bn in 2011. In 2021, assets grew at a faster rate of 10.6% to Kshs 1,547.4 bn from Kshs 1,399.0 bn compared to 7.8% growth in 2020 as a result of the economic recovery that saw people resume contribution to the retirement benefits schemes. The graph below shows the growth of Assets under Management of the retirement benefits schemes over the last 10 years: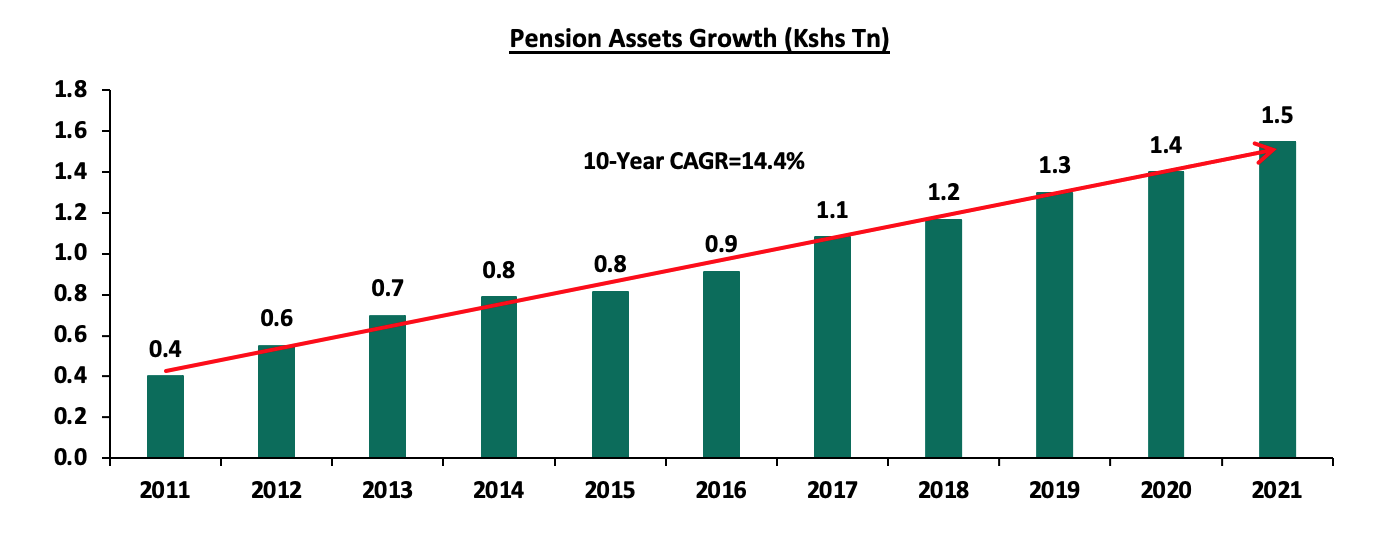
Source: Retirement Benefits Authority (RBA)
The graph below shows the 10-year CAGR of pension schemes’ Assets under Management against other capital markets products and Banking deposits: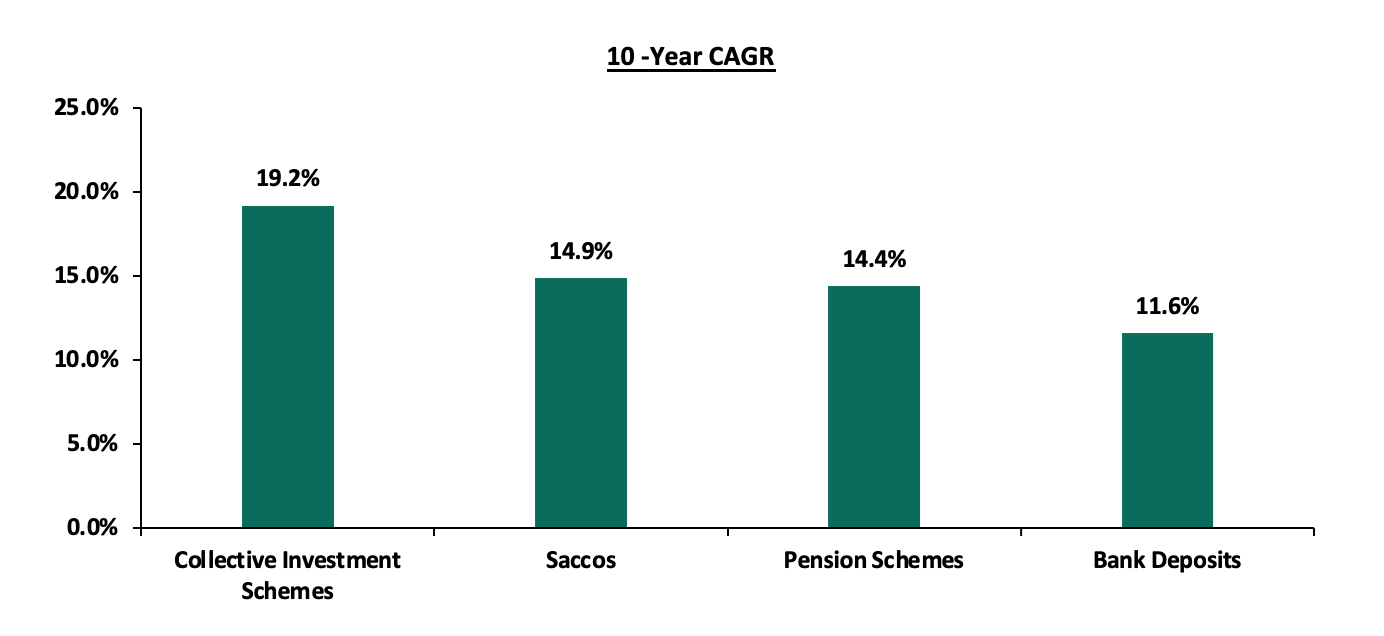
Source: Sasra Annual Reports, Central Bank, Retirement Benefits Authority (RBA), Capital Markets Authority Quarterly Statistical Bulletin
- Performance of Retirement Benefits Schemes
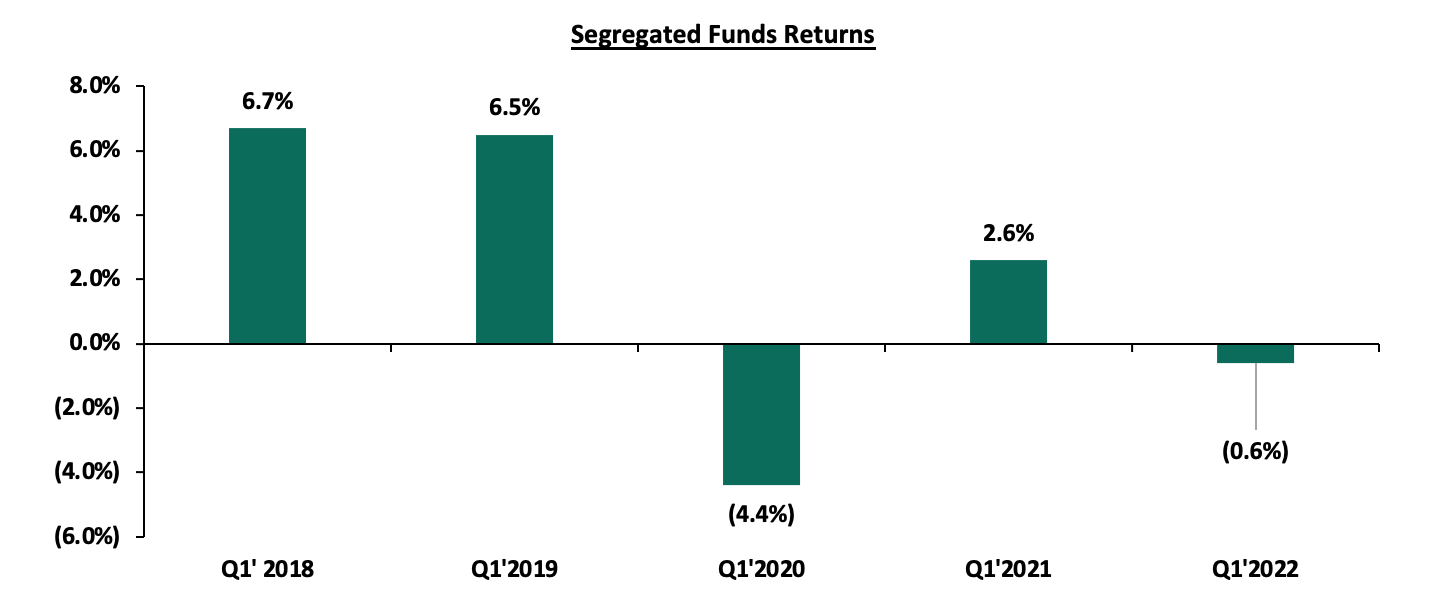
According to the ACTSERV Q1’2022 Pension Schemes Investments Performance Survey, segregated retirement benefits schemes recorded a 0.6% decline in Q1’2022, down from the 2.6% increase recorded in Q1’2021. The decline was largely driven by a 4.8% decline recorded in the equities portfolio in Q1’2022 from the 5.6% gain recorded in Q1’2021 as a result of increased investor selloffs emanating from the uncertainties regarding global political events and the forthcoming general elections. The graph below highlights the performance of the segregated pension schemes over the last five years:
Source: ACTSERV Surveys
Overtime, segregated funds have continued to outperform the guaranteed funds save for 2020, when the equities market significantly weighed down the overall performance of segregated funds having declined by 23.9% due to the effects of the pandemic. The graph below highlights the performance of the Segregated Vs Guaranteed Schemes between 2013 and 2021: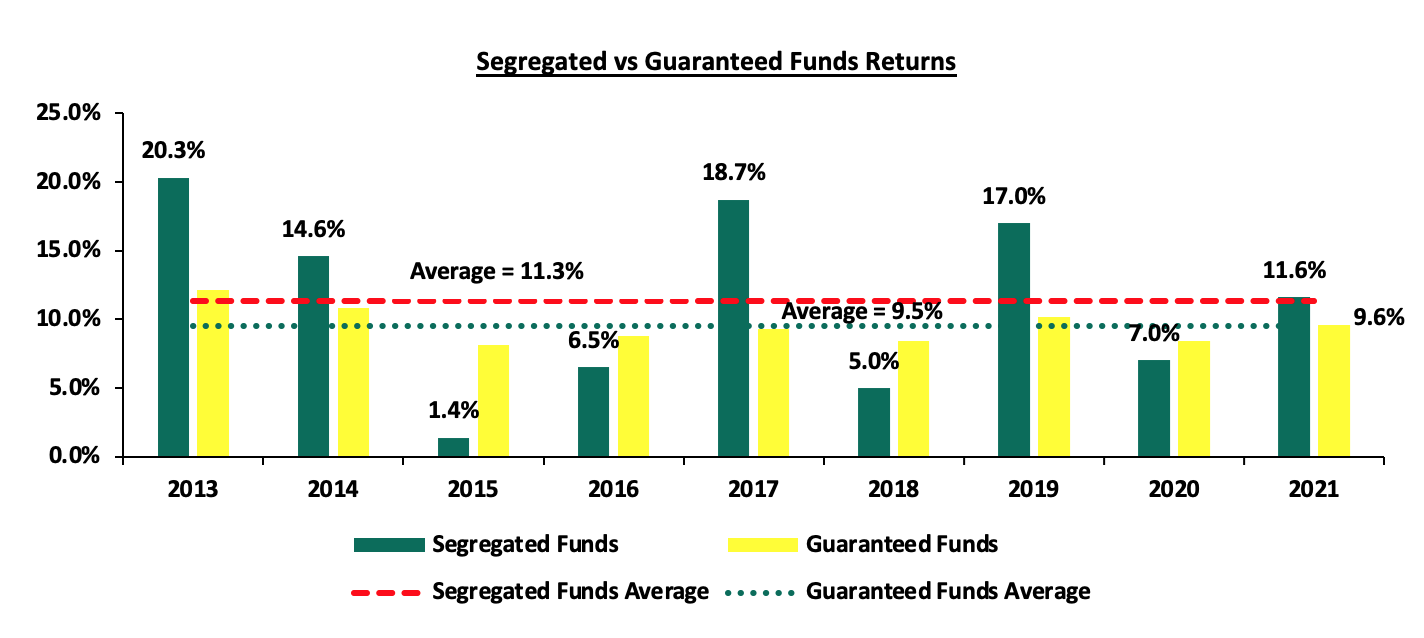
Source: ACTSERV Surveys, Cytonn Research
The average performance for the segregated funds during the period under review is 11.3%, 1.8% points higher than the 9.5% average return for the Guaranteed Funds. However, the performance of Segregated schemes has fluctuated over the years and was highest in 2013 at 20.3%.
The graph below shows the average performance of segregated funds vs guaranteed funds between 2013 to 2021: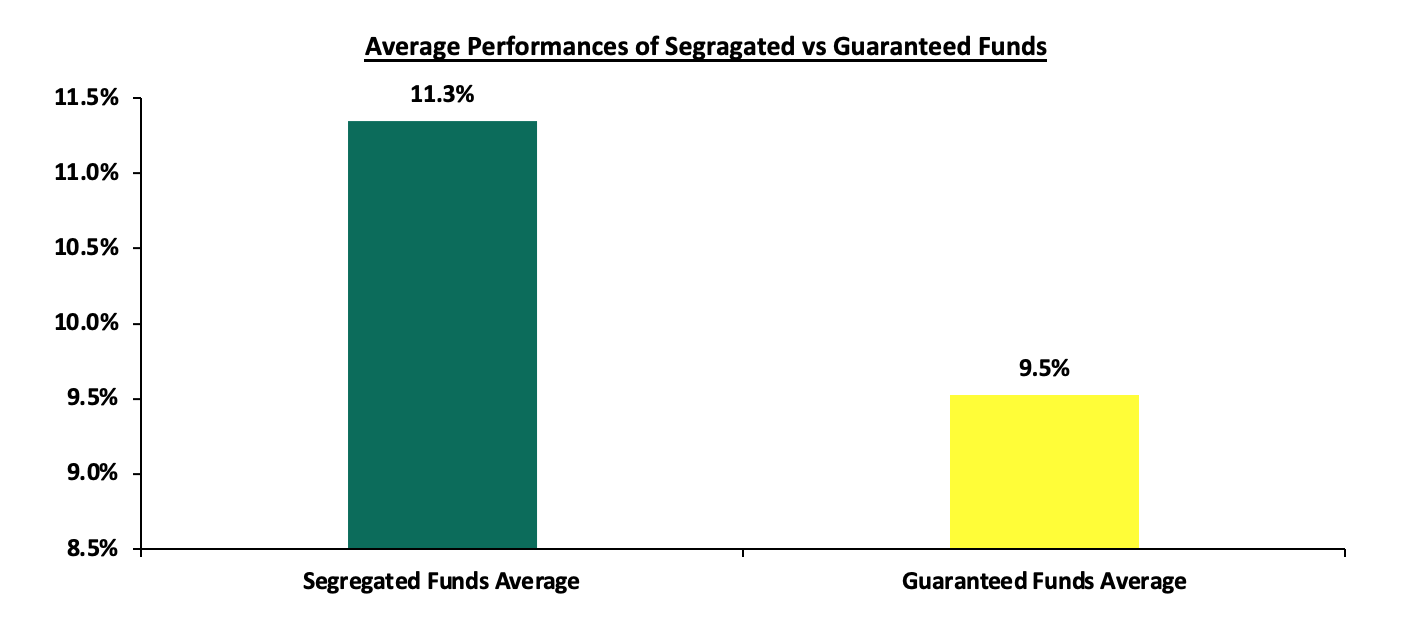
Source: ACTSERV Surveys, Cytonn Research
Further, we look into the various asset classes quarter one performance classified into broad categories of fixed income, Equity and Offshore. Below is a graph showing their performances over the last five years:
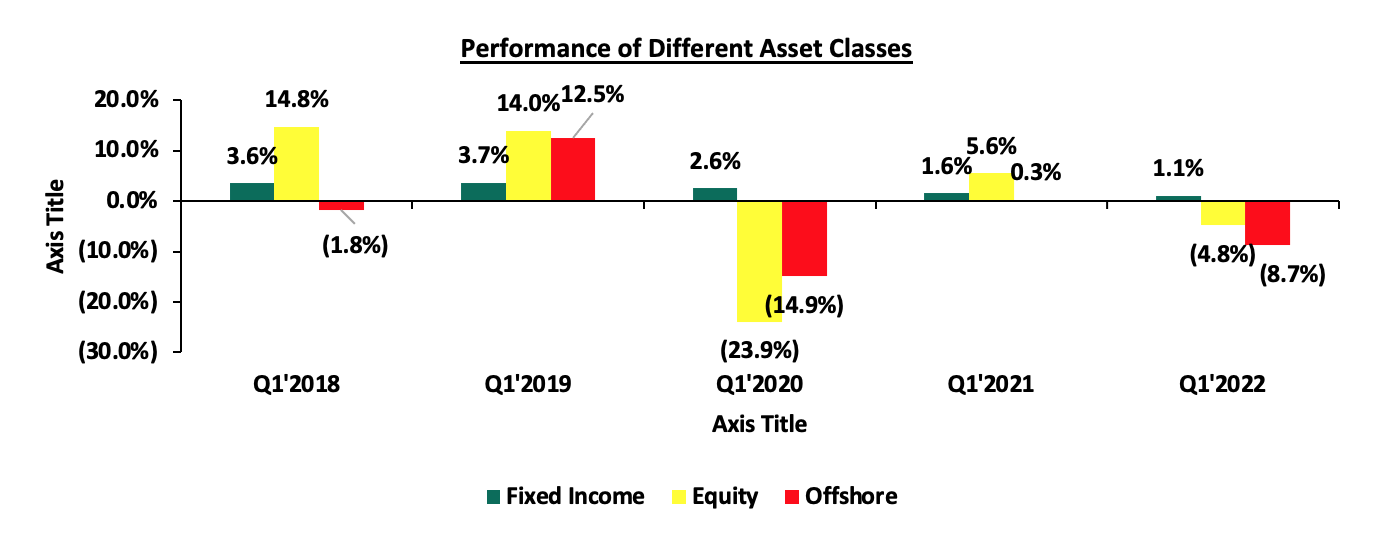
Source: ACTSERV Surveys
Key take-outs from the graph above include;
- Equity investments recorded a 4.8% decline in Q1’2022, from a 5.6% increase recorded in Q1’2021 attributable to increased investor selloffs stemming from the heightened uncertainties regarding global political events and the upcoming general elections,
- Fixed income performance recorded a 1.1% gain in Q1’2022, 0.5% points decline from the 1.6% recorded in Q1’2021 attributable to the increasing yields in government securities as a result of the tighter liquidity in the interbank market, weakening of the Kenyan Shilling and rising inflation,
- In Q1’2022, offshore investments recorded an 8.7% compared to the 0.3% increase recorded in Q1’2021 as a result of high risks emanating from the rising global inflation and global tensions. Offshore investments performed poorly against the other asset classes between Q1’2018-Q1’2022 at an average decline of 2.5% compared to average gains of 2.5% and 1.1% for fixed income and equities, respectively.
Retirement Benefits Schemes Investments Allocations
The performance of the various pension schemes in Kenya has been pegged on a number of factors such as; Asset allocation, selecting the best performing security within a particular asset class, size of the scheme, risk appetite and the investment horizon. The Retirement Benefits (Forms and Fees) Regulations, 2000 offers investment guidelines for retirement benefit schemes in Kenya in terms of the asset classes to invest in and the limits of exposure to ensure good returns and that members’ funds are hedged against losses. Some of the asset classes where the schemes can invest in are; government securities, fixed deposits, quoted equities, and immovable properties. Key to note, pension schemes can formulate their own Investment Policy Statements (IPS) to guide on how much to invest in the asset option and assist the trustees in monitoring and evaluating the performance of the Fund. Additionally, Investments Policy Statements often vary depending on risk return profile and expectations mainly determined by factors such as scheme’s demography and the economic outlook. The table below represents how the retirement benefits schemes have invested their funds in the past:
|
Kenyan Pension Funds Assets Allocation |
|||||||||||
|
Asset Class |
2013 |
2014 |
2015 |
2016 |
2017 |
2018 |
2019 |
2020 |
2021 |
Average |
Limit |
|
Government Securities |
33.8% |
31.0% |
29.8% |
38.3% |
36.5% |
39.4% |
42.0% |
44.7% |
45.7% |
37.9% |
90.0% |
|
Quoted Equities |
25.5% |
26.0% |
23.0% |
17.4% |
19.5% |
17.3% |
17.6% |
15.6% |
16.5% |
19.8% |
70.0% |
|
Immovable Property |
17.2% |
17.0% |
18.5% |
19.5% |
21.0% |
19.7% |
18.5% |
18.0% |
16.5% |
18.4% |
30.0% |
|
Guaranteed Funds |
10.3% |
11.0% |
12.2% |
14.2% |
13.2% |
14.4% |
15.5% |
16.5% |
16.8% |
13.8% |
100.0% |
|
Listed Corporate Bonds |
4.4% |
6.0% |
5.9% |
5.1% |
3.9% |
3.5% |
1.4% |
0.4% |
0.4% |
3.4% |
20.0% |
|
Fixed Deposits |
4.9% |
5.0% |
6.8% |
2.7% |
3.0% |
3.1% |
3.0% |
2.8% |
1.8% |
3.7% |
30.0% |
|
Offshore |
2.2% |
2.0% |
0.9% |
0.8% |
1.2% |
1.1% |
0.5% |
0.8% |
1.3% |
1.2% |
15.0% |
|
Cash |
1.3% |
1.0% |
1.4% |
1.4% |
1.2% |
1.1% |
1.2% |
0.9% |
0.6% |
1.1% |
5.0% |
|
Unquoted Equities |
0.6% |
0.0% |
0.4% |
0.4% |
0.4% |
0.3% |
0.3% |
0.2% |
0.2% |
0.3% |
5.0% |
|
Private Equity |
0.0% |
0.0% |
0.0% |
0.0% |
0.0% |
0.1% |
0.1% |
0.1% |
0.2% |
0.1% |
10.0% |
|
REITs |
0.0% |
0.0% |
0.0% |
0.1% |
0.1% |
0.1% |
0.0% |
0.0% |
0.0% |
0.0% |
30.0% |
|
Commercial Paper, non-listed bonds by private companies |
0.0% |
0.0% |
0.0% |
0.0% |
0.0% |
0.0% |
0.0% |
0.0% |
0.0% |
0.0% |
10.0% |
|
Others e.g. unlisted commercial papers |
0.0% |
0.0% |
0.0% |
0.0% |
0.0% |
0.0% |
0.0% |
0.0% |
0.1% |
0.0% |
10.0% |
|
|
100.0% |
100.0% |
100.0% |
100.0% |
100.0% |
100.0% |
100.0% |
100.0% |
100.0% |
100.0% |
|
Source: Retirement Benefits Authority
Key Take-outs from the table above are;
- Schemes in Kenya allocated an average of 57.7% of their members’ funds towards government securities and Quoted Equities between the period of 2013 and 2021. The 37.9% average allocation to government securities is the highest among the asset classes attributable to safety assurances of members’ funds because of low risk investments,
- The allocation towards quoted equities increased to 16.5% in 2021 from 15.6% in 2020 because of the recovery of the equities market after easing of the pandemic effects, and,
- Retirement Benefits Schemes investments in offshore markets increased by 0.5% points to 1.3% in 2021 from 0.8% in 2020 as a result of its impressive performance.
Key to note, retirement benefits schemes have skewed their investments towards traditional assets such as government securities and quoted equities for a long time. However, other asset classes such as alternative investments (Private Equity and Immovable Properties) are viable and attractive opportunities that have experienced low allocation averaging 18.6% between 2013-2021 against the limit of 70.0% attributable to lack of expertise and experience in the field. This is despite the fact that the asset class offers greater value in terms of returns and can hedge against volatility in the market. Investing in this asset class such as real estate would offer superior long term returns and hence growth in the funds.
Section 3: Factors Hindering the Growth of Retirement Benefits Schemes in Kenya
As aforementioned, the retirement benefits scheme industry in Kenya has significantly grown over the past 10 years with a CAGR of 14.4% to Kshs 1,547.4 bn in 2021 as a result of factors such as government’s legislations to support savings, creating retirement benefits schemes among the citizens by RBA and industry players, as well as improved management of schemes in Kenya among many other factors. However, a huge population of Kenyans are still not in any retirement saving plan mainly due to factors such as;
-
- Market volatility – For segregated schemes, the investment returns are usually uncertain attributable to market volatility that has worsened with the COVID-19 pandemic and the global tensions such as the Russian-Ukrainian war. As a result, many Kenyans are usually reluctant to contribute to retirement schemes for fear of losing their money. The high market volatility also presents a chance of beneficiaries funds depreciating in value,
- Possibility of accessing contributions before retirement – In many retirement benefit schemes, employees can access their savings before actually retiring because of losing a job or leaving a particular employer. However, such actions can always prove to be shortsighted since it significantly depletes the value of savings upon retirement and will reduce the growth of the sector,
- Reluctant attitude towards savings – Substantial number of Kenyans usually worry less concerning their retirements because of the belief on assistance by their children as they have invested in them,
- Belief that pensions is for the older generation – Majority of young people believe that they are too young to start saving for pensions and it is only the older people who should have retirement benefit schemes. Such attitude hinders young people from joining schemes at the onset of their employment and start saving while it is too late, and,
- Low income level from the slow economic growth – Many Kenyans are in informal employment or unemployed which is characterized by seasonal or fluctuating and low income. Such status makes it extremely difficult for them to commit to pension contributions towards their retirement.
Section 4: Key Consideration to Improving Retirement Prospects for Employers and Employees
Employers have a significant impact on employees' capacity to achieve a secure retirement. Their role encompasses the offering of retirement benefits, creating a welcoming environment for workers of all ages, fostering work-life balance, and adapting business practices to support transitions to retirement. Employers also provide valuable non-retirement benefits that can help their employees protect their health, income, and savings. As such, we shall discuss and give recommendations to both employers and employees on how to improve their retirement prospects and increase the likelihood of sufficient income during retirement years by investing in the appropriate scheme;
Recommendations for Employer:
- Offer a Retirement Plan or join an Umbrella Retirement Plan – Firms can offer retirement plans to their employees to encourage them to save for their retirement. However, if the employer has no occupational retirement scheme for the employees or does not have the capacity to start one, they can join an Umbrella Pension Schemes which reduces the average cost per member and provides an avenue to save for retirement,
- Increase efforts to reduce the number of withdrawals in the retirement plan- Employers should create awareness among employees about the ramifications of undertaking premature withdrawals from retirement accounts. Employees should understand and come up with ways of dealing with non-routine and emergency expenses, which will offer employees alternative ways as opposed to withdrawing the retirement benefits,
- Help pre-retirees plan their transition into retirement – Employers can help pre-retirees by educating them about retirement income strategies to efficiently manage savings and retirement plan distribution options,
- Allow part-time employees to join retirement schemes – Firms should encourage part-time employees to join retirement schemes by extending retirement plan eligibility to such groups, and the necessity of back-up plan if forced into early retirement,
- Expected returns – Employers should select providers whose return rate is high enough to ensure a sizeable growth for the retirement savings. The appropriate rate of return should always be higher than the inflation rate to ensure a positive real return by not losing value over time,
- Extra benefits – Employers should recommend to workers schemes that will offer extra benefits in terms of insurance covers and health care benefits. Such complimentary benefits would improve the quality of a retirement plan.
Recommendations for Employees:
- Creating a budget – Employees should have a budget to guide on how to spend on expenses and remain with income to save for retirement in a suitable scheme,
- Have a back-up plan – Employees should have backup plans in case of job loss or early retirement arising from accidents or ill-health,
- Affordability and flexibility – As an employee, it is essential to select a retirement plan that will not strain you in terms of contributions. Additionally, you should look into the flexibility of the plan in terms of changing the contribution amount and measures, if any, should you miss a contribution,
- Understand the various options available – It is prudent to understand how your money will be treated, its accessibility, and the mode of payment at the time of retirement to ensure that its features align with your objectives. Schemes have different provisions on whether you can use your savings to secure mortgage facilities or even buy a residential house, and,
- Select a manager you trust – Retirement benefits plan is a long term affair and the only way to feel secure about your contributions is by selecting a manager you trust. Key to note, a trustworthy manager should have good governance structures and management experience.
Even as we commend the Kenyan government for demystifying retirement benefits by making the services readily accessible, we believe that the current pensions system still leaves many pockets of the society uncovered or with insufficient funds for retirement. We note that more people continue to use banks as a savings channel, as evidenced by the increasing bank deposits at Kshs 4.4 tn compared to the Kshs 1.5 tn pensions assets under management as of Q1’2022. As such, the pensions uptake remains low in the country putting more people at risk of old age poverty. However, we expect the growth trend to continue in the coming years as the economy recovers and more people understand the importance of saving for retirement. The key challenge remains how fast the government comes up with ways to expand the pensions coverage in Kenya and how best to persuade the working population to save enough money for retirement.
Disclaimer: The views expressed in this publication are those of the writers where particulars are not warranted. This publication, which is in compliance with Section 2 of the Capital Markets Authority Act Cap 485A, is meant for general information only and is not a warranty, representation, advice or solicitation of any nature. Readers are advised in all circumstances to seek the advice of a registered investment advisor.

- Talk to us
- Kenya
- P.O Box 20695 - 00200, Nairobi, Kenya
- Cell +254709101200
- Tel +254709101200
- WhatsApp +254741676635
- United States
- +254709101200
- DOWNLOAD OUR APP
-


- Kenya
- 8th Floor, Pinetree Plaza, Kaburu Drive, Ngong Road, Nairobi, Kenya
- USA
- Suite 1150, 1775 Eye Street NW, USA, Washington DC 20006, USA
- Investments
- High Yield
- Private Equity
- Real Estate
- Real Estate
- RiverRun Estates
- Cytonn Towers
- The Ridge
- Taraji Heights
- The Alma