
Progress of the Retirement Benefits Schemes in Kenya in Q1’2026, & Cytonn Weekly #20.2026
By Cytonn Research, May 24, 2026
Executive Summary
Fixed Income
During the week, T-bills were oversubscribed for the third consecutive week, with the overall subscription rate coming in at 125.2%, higher than the subscription rate of 110.0%, recorded the previous week. Investors’ preference for the shorter 91-day paper persisted, with the paper receiving bids worth Kshs 15.9 bn against the offered Kshs 4.0 bn, translating to a subscription rate of 396.6%, higher than the subscription rate of 183.1%, recorded the previous week. The subscription rate for the 182-day paper increased marginally to 83.5% from 78.5% recorded the previous week, while that of the 364-day paper decreased significantly to 57.9% from 112.4% recorded the previous week. The government accepted a total of Kshs 26.1 bn worth of bids out of Kshs 30.0 bn bids received, translating to an acceptance rate of 86.9%. The yields on the government papers showed a mixed performance, with the yields on the 91-day paper increasing the most by 6.9 bps to 8.6% from the 8.3% recorded the previous week. The yields on the 364-day paper also increased by 2.5 bps to 8.59% from the 8.56% recorded the previous week, while the yields on the 182-day paper decreased by 0.1 bps to remain relatively unchanged from the 8.2% recorded the previous week;
During the week, the Central Bank of Kenya released the auction results for the switch of treasury bonds from FXD1/2017/10, with a tenor to maturity of 1.2 years and a fixed coupon rate of 13.0%, to FXD1/2021/020, a with a tenor to maturity of 15.2 years and a fixed coupon rate of 13.4%. This marks the sixth bond switch, following the switches to IFB1/2022/06, IFB1/2020/06, FXD1/2022/015, and FXD3/2019/015 and FXD1/2018/15 in December 2022, June 2020, January 2026, March 2026 and April 2026 respectively. The bond was undersubscribed, with the overall subscription rate coming in at 76.1%, receiving bids worth Kshs 7.6 bn against the offered Kshs 10.0 bn. The weighted average yield for the accepted bids for the FXD1/2021/020came in at 13.4%;
Also, during the week, the Central Bank of Kenya released the auction results for the re-opened treasury bonds FXD3/2019/015 and FXD1/2021/020 with tenors to maturities of 8.3 years and 15.3 years respectively and fixed coupon rates of 12.3% and 13.4% respectively. The bonds were undersubscribed, with the overall subscription rate coming in at 94.3%, receiving bids worth Kshs 47.2 bn against the offered Kshs 50.0 bn. The government accepted bids worth Kshs 36.6 bn, translating to an acceptance rate of 77.6%. The weighted average yield for the accepted bids for the FXD1/2021/020 and FXD3/2019/015 came in at 13.7%and 13.0% respectively. Notably, the 13.7% and 13.0% yields on FXD1/2021/020 and FXD3/2019/015 were both higher than the 13.5% and 12.2% recorded at the last reopening in October 2025and February 2026 respectively;
We are projecting the y/y inflation rate for May 2026 will increase to within the range of 5.8% - 6.4%, primarily driven by higher fuel prices, alongside the depreciation of the Kenyan Shillings against the Dollar, which are linked to the ongoing US–Iran tensions;
During the week, I&M Bank released the results of the first tranche of its Kshs 20.0 bn Medium Term Note Programme, with tenor to maturity of 5.5 years, and a maturity date of November 2031. The first tranche comprises Kshs 10.0 bn with a green shoe option of an additional Kshs 3.0 bn. The bond was oversubscribed, with an overall subscription rate coming in at 232.3% receiving bids worth Kshs 23.2 bn against the Kshs 10.0 bn offered. I&M accepted bids worth 13.0 bn, translating to an acceptance rate of 56.0%. The note was offered at par at an issue price, carries a fixed coupon rate of 12.2% per annum payable semi-annually in May and November of each year in accordance with the Pricing Supplement. The settlement date is 18th May 2026 and the MTN will be listed on NSE on 21st May 2026;
Equities
During the week, the equities market recorded a mixed performance, with NSE 10 and NASI gaining by 0.8%, and 0.3% respectively. NSE 25 remaining relatively unchanged while NSE 20 declined by 1.0%, taking the YTD performance to gains of 11.1%, 11.0%, 10.1% and 9.5% for NSE 20, NSE 25, NASI and NSE 10 respectively. The week-on-week equities market performance was mainly driven by losses recorded by large cap stocks such as Stanbic, Standard Chartered and BAT of 6.8%, 2.8% and 1.9% respectively. However, the performance was supported by gains recorded by large cap stocks such as Safaricom, Equity and EABL of 2.3%, 1.3% and 0.6% respectively;
During the week, the banking sector index declined by 0.8% to 235.1 from 236.9 recorded the previous week. This is attributable to losses recorded by large cap stocks such as Stanbic, Standard Chartered and Co-operative of 6.8%, 2.8% and 0.8% respectively;
During the week, Equity Group released their Q1’2026 financial results, recording a 24.1% increase in profit after tax to Kshs 19.1 bn in Q1’2026, from Kshs 15.3 bn in Q1’2025;
During the week, KCB Group released their Q1’2026 financial results, recording a 10.0% increase in profit after tax to Kshs 18.2 bn in Q1’2026, from Kshs 16.5 bn in Q1’2025;
During the week, NCBA Group released their Q1’2026 financial results. Profit after tax increased by 8.8% to Kshs 6.0 bn, from Kshs 5.5 bn in Q1’2025;
Real Estate
During the week, the Nairobi Securities Exchange listed its first infrastructure fund on the unquoted securities platform, marking a structural milestone in the deepening of Kenya's capital markets. The fund is sponsored by Spearhead Africa Asset Management, a Capital Markets Authority-licensed collective investment scheme, and listed 35.0 mn units at Kshs 100.0 per unit implying a total listed value of Kshs 3.5 bn with a minimum purchase of 1,000 units equivalent to Kshs 100,000.0. In its first series, the fund raised Kshs 3.5 bn local currency, anchored by institutional investors including the UK Government's MOBILIST programme and CPF Group;
During the week, Unaitas Sacco announced plans to construct a Kshs 521.6 mn mixed-use development in Runda, Nairobi. The project will sit on 16,266 SQM and feature twin towers a seven-storey office block and a three-storey strip mall alongside a banking hall, data centre, restaurant, and additional lettable office space. The development marks a significant strategic shift for the sacco, which currently operates its headquarters from Cardinal Otunga Plaza in the Nairobi Central Business District;
On the Unquoted Securities Platform Acorn D-REIT and I-REIT traded at Kshs 29.6 and Kshs 23.8 per unit, respectively, as per the last updated data on 8th May 2026. The performance represented a 48.0% and 18.8% gain for the D-REIT and I-REIT, respectively, from the Kshs 20.0 inception price. Additionally, ILAM Fahari I-REIT traded at Kshs 13.8 per share as of 8th May 2026, representing a 31.0% loss from the Kshs 20.0 inception price;
Digital Payments
The U.S. Securities and Exchange Commission (SEC) this week delayed a proposal that would have allowed crypto platforms to more broadly offer tokenized versions of publicly traded stocks, highlighting growing regulatory caution around the intersection of blockchain technology and traditional capital markets. The proposal was aimed at creating an “innovation exemption” framework that could enable blockchain-based trading of equities with features such as 24/7 trading, fractional ownership, and near-instant settlement.
This week, a major development in Europe’s digital asset landscape came from the rapid expansion of a euro-denominated stablecoin initiative led by the Qivalis consortium. The project added 25 new banks, significantly widening institutional participation to more than three dozen financial institutions across multiple European jurisdictions. Participating banks reportedly include major names such as ABN Amro, Rabobank, Nordea, UniCredit, BNP Paribas, and Bank of Ireland. The expansion signals growing interest among traditional European lenders in building a shared, regulated stablecoin infrastructure to support future digital payments and settlement systems.
The digital payment stocks we track (AXP, Visa, Mastercard and Circle) are currently trading at an average P/E of 84.3x, implying that investors are pricing in very strong future earnings growth expectations and are willing to pay a significant premium for current earnings, which may also suggest the stock is richly valued relative to its near-term fundamentals.
Focus of the Week
According to the ACTSERV Q1’2026 Pension Schemes Investments Performance Survey, segregated retirement benefits scheme quarterly returns increased to a 5.2% return in Q1’2026, up from the 7.1% gain recorded in Q1’2025. The y/y performance in overall returns was largely driven by the positive returns in Equity of 5.3% from a gain of 4.6% in Q1’2025 attributable to improved investor confidence and strong performance of select counters at the Nairobi Securities Exchange (NSE). The performance was, however, weighed down by the 2.1% points decrease in the Fixed Income returns to 5.7%, from 7.8% in Q1’2025 majorly attributable to declining yields in the fixed income market, easing interest rates and cautious investor sentiment amid renewed inflationary pressures and heightened geopolitical tensions in the Middle East. Notably, on a q/q basis the segregated retirement benefits schemes recorded an increase in returns from a gain of 2.6% in Q4’2025;
Investment Updates:
Hospitality Updates:
Fixed Income
Money Markets, T-Bills Primary Auction:
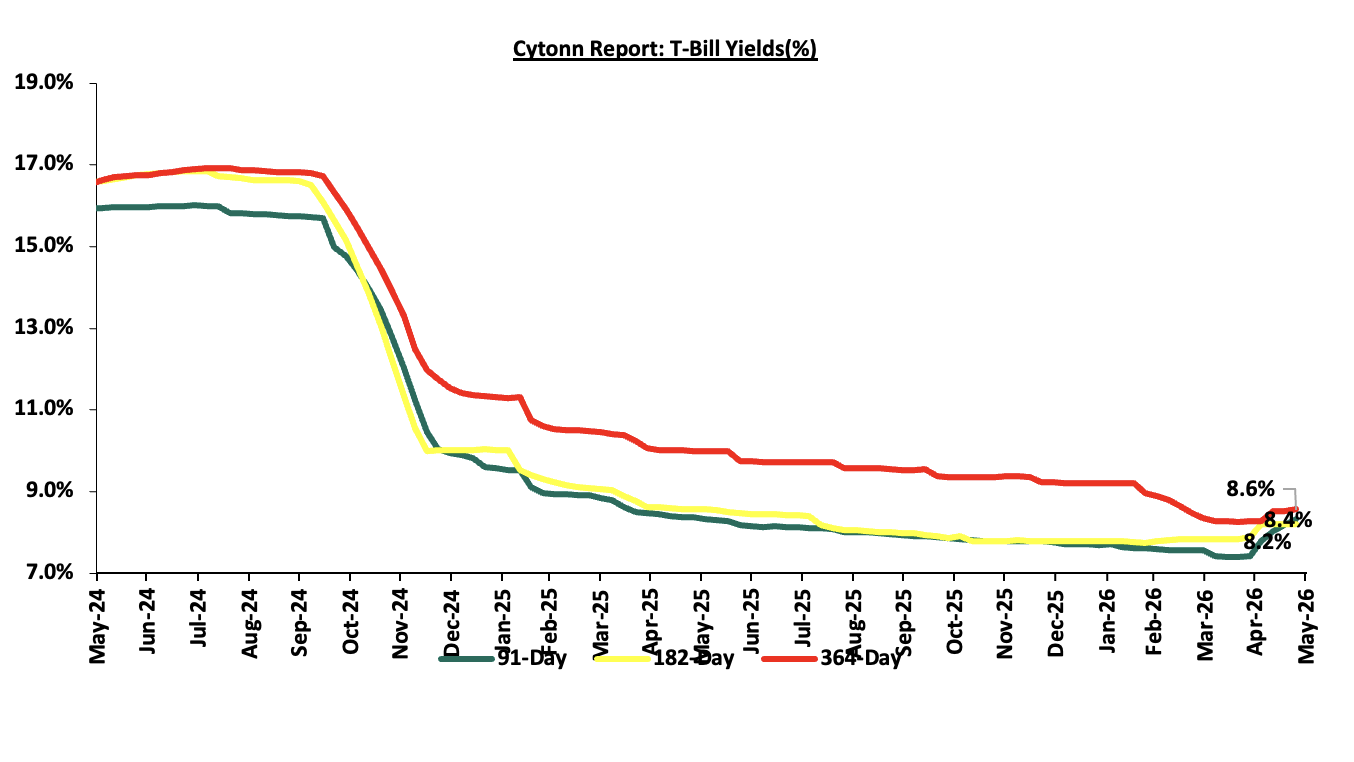
This week, T-bills were oversubscribed for the third consecutive week, with the overall subscription rate coming in at 125.2%, higher than the subscription rate of 110.0%, recorded the previous week. Investors’ preference for the shorter 91-day paper persisted, with the paper receiving bids worth Kshs 15.9 bn against the offered Kshs 4.0 bn, translating to a subscription rate of 396.6%, higher than the subscription rate of 183.1%, recorded the previous week. The subscription rate for the 182-day paper increased marginally to 83.5% from 78.5% recorded the previous week, while that of the 364-day paper decreased significantly to 57.9% from 112.4% recorded the previous week. The government accepted a total of Kshs 26.1 bn worth of bids out of Kshs 30.0 bn bids received, translating to an acceptance rate of 86.9%. The yields on the government papers showed a mixed performance, with the yields on the 91-day paper increasing the most by 6.9 bps to 8.6% from the 8.3% recorded the previous week. The yields on the 364-day paper also increased by 2.5 bps to 8.59% from the 8.56% recorded the previous week, while the yields on the 182-day paper decreased by 0.1 bps to remain relatively unchanged from the 8.2% recorded the previous week.
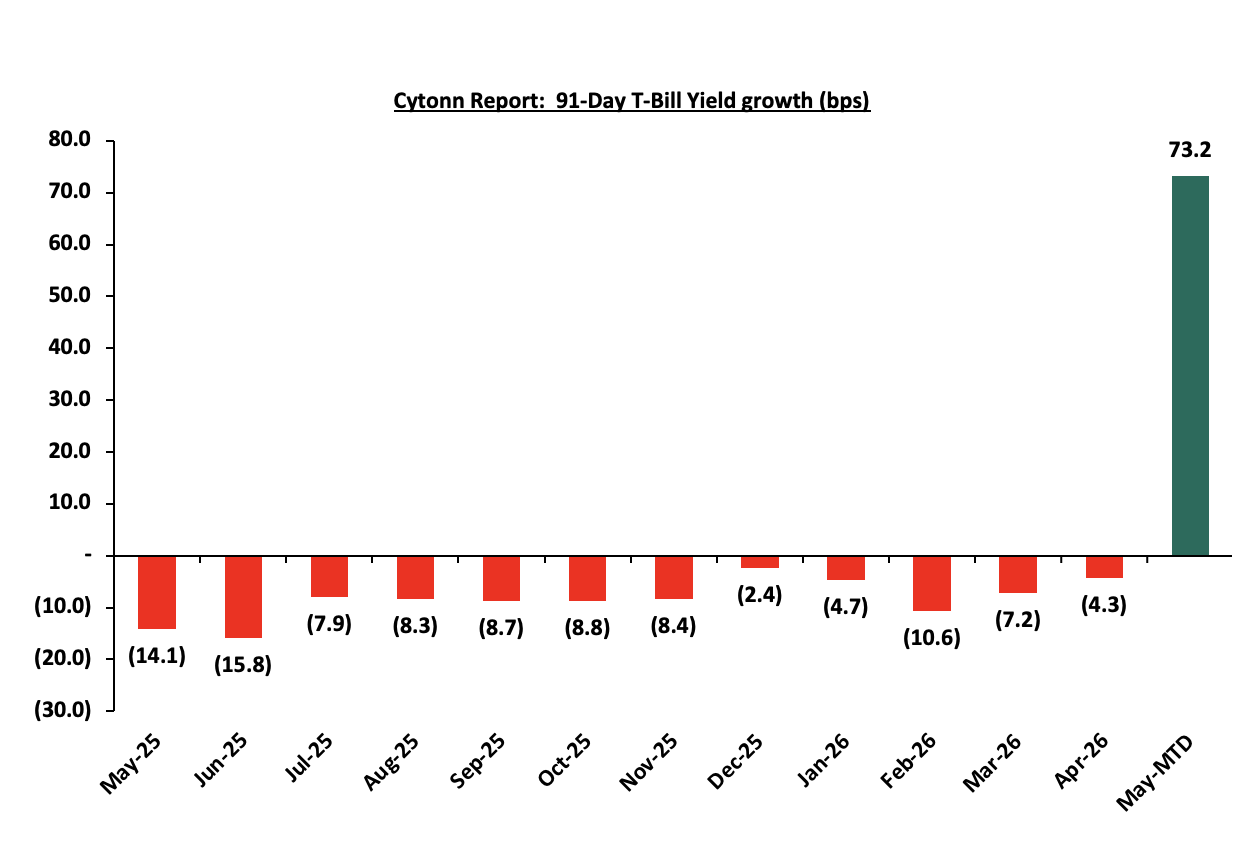
The chart below shows the yield growth rate for the 91-day paper from May 2025 to date:
The chart below shows the performance of the 91-day, 182-day and 364-day papers from May 2024 to May 2026:
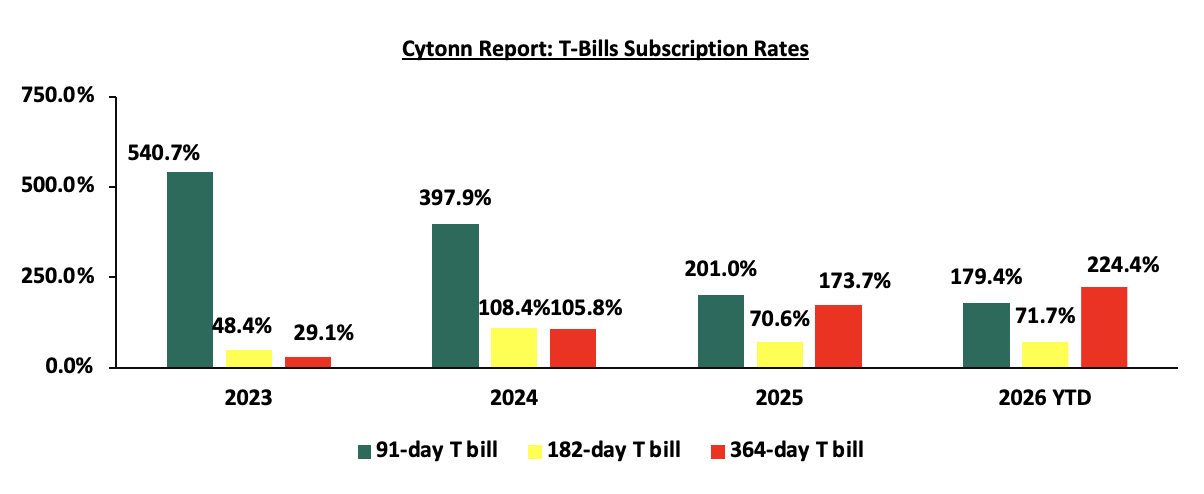
The chart below compares the overall average T-bill subscription rates obtained in 2023, 2024, 2025 and 2026 Year-to-date (YTD):
T-Bonds Primary Auction:
During the week, the Central Bank of Kenya released the auction results for the switch of treasury bonds from FXD1/2017/10, with a tenor to maturity of 1.2 years and a fixed coupon rate of 13.0%, to FXD1/2021/020, a with a tenor to maturity of 15.2 years and a fixed coupon rate of 13.4%. This marks the sixth bond switch, following the switches to IFB1/2022/06, IFB1/2020/06, FXD1/2022/015, and FXD3/2019/015 and FXD1/2018/15 in December 2022, June 2020, January 2026, March 2026 and April 2026 respectively. The bond was undersubscribed, with the overall subscription rate coming in at 76.1%, receiving bids worth Kshs 7.6 bn against the offered Kshs 10.0 bn. The weighted average yield for the accepted bids for the FXD1/2021/020 came in at 13.4%.
Also, during the week, the Central Bank of Kenya released the auction results for the re-opened treasury bonds FXD3/2019/015 and FXD1/2021/020 with tenors to maturities of 8.3 years and 15.3 years respectively and fixed coupon rates of 12.3% and 13.4% respectively. The bonds were undersubscribed, with the overall subscription rate coming in at 94.3%, receiving bids worth Kshs 47.2 bn against the offered Kshs 50.0 bn. The government accepted bids worth Kshs 36.6 bn, translating to an acceptance rate of 77.6%. The weighted average yield for the accepted bids for the FXD1/2021/020 and FXD3/2019/015 came in at 13.7%and 13.0% respectively. Notably, the 13.7% and 13.0% yields on FXD1/2021/020 and FXD3/2019/015 were both higher than the 13.5% and 12.2% recorded at the last reopening in October 2025 and February 2026 respectively.
Money Market Performance:
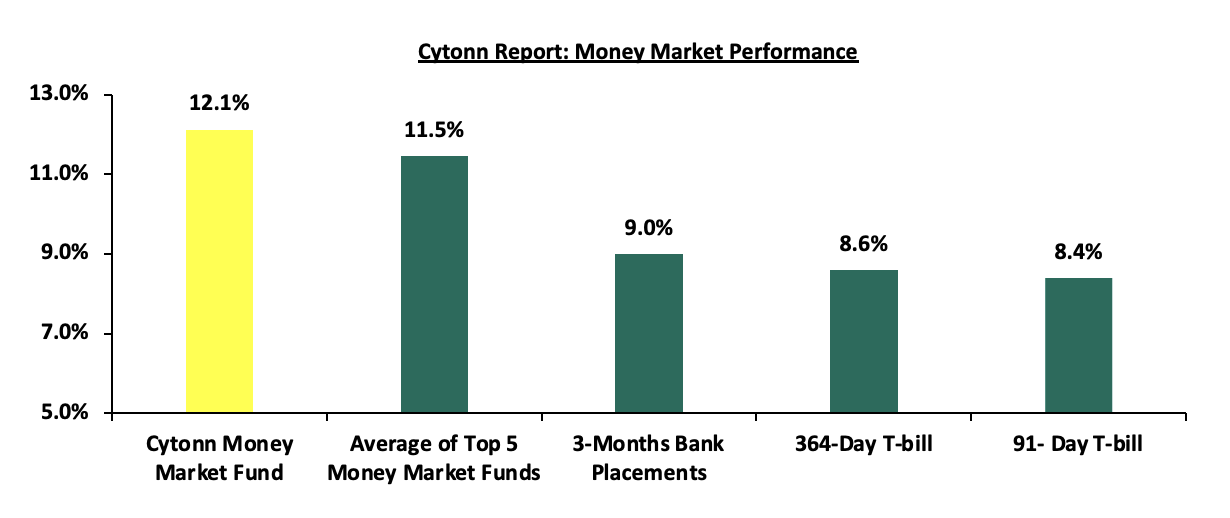
In the money markets, 3-month bank placements ended the week at 9.0% (based on rates offered by various banks. The yields on the government papers showed a mixed performance, with the yields on the 91-day paper increasing the most by 6.9 bps to 8.6% from the 8.3% recorded the previous week. The yields on the 364-day paper also increased by 2.5 bps to 8.59% from the 8.56% recorded the previous week. The yield on the Cytonn Money Market Fund decreased marginally by 5.0 bps to 12.1% from the 12.2% recorded the previous week, while the average yields on the Top 5 Money Market Funds decreased by 4.6 bps to 11.45% from 11.49% recorded the previous week.
The table below shows the Money Market Fund Yields for Kenyan Fund Managers as published on 22nd May 2026:
|
Money Market Fund Yield for Fund Managers as published on 22nd May 2026 |
||
|
Rank |
Fund Manager |
Effective Annual Rate |
|
1 |
Cytonn Money Market Fund (Dial *809# or download Cytonn App) |
12.1% |
|
2 |
Nabo Africa Money Market Fund |
12.0% |
|
3 |
Etica Money Market Fund |
11.5% |
|
4 |
Arvocap Money Market Fund |
10.9% |
|
5 |
Lofty-Corban Money Market Fund |
10.7% |
|
6 |
Enwealth Money Market Fund |
10.6% |
|
7 |
Ndovu Money Market Fund |
10.5% |
|
8 |
Faulu Money Market Fund |
10.5% |
|
9 |
Kuza Money Market fund |
10.4% |
|
10 |
Madison Money Market Fund |
10.2% |
|
11 |
Orient Kasha Money Market Fund |
10.2% |
|
12 |
Old Mutual Money Market Fund |
10.1% |
|
13 |
Gulfcap Money Market Fund |
10.1% |
|
14 |
Jubilee Money Market Fund |
10.0% |
|
15 |
British-American Money Market Fund |
9.8% |
|
16 |
GenAfrica Money Market Fund |
9.6% |
|
17 |
SanlamAllianz Money Market Fund |
9.3% |
|
18 |
Dry Associates Money Market Fund |
9.2% |
|
20 |
KCB Money Market Fund |
9.2% |
|
21 |
Apollo Money Market Fund |
9.1% |
|
22 |
Genghis Money Market Fund |
8.8% |
|
23 |
CIC Money Market Fund |
8.4% |
|
24 |
CPF Money Market Fund |
8.2% |
|
25 |
Co-op Money Market Fund |
8.2% |
|
26 |
Mali Money Market Fund |
8.0% |
|
27 |
ICEA Lion Money Market Fund |
7.9% |
|
28 |
Absa Shilling Money Market Fund |
7.3% |
|
29 |
Mayfair Money Market Fund |
7.0% |
|
30 |
Ziidi Money Market Fund |
6.1% |
|
31 |
AA Kenya Shillings Fund |
6.0% |
|
32 |
Stanbic Money Market Fund |
5.3% |
|
33 |
Equity Money Market Fund |
5.1% |
Source: Business Daily
Liquidity:
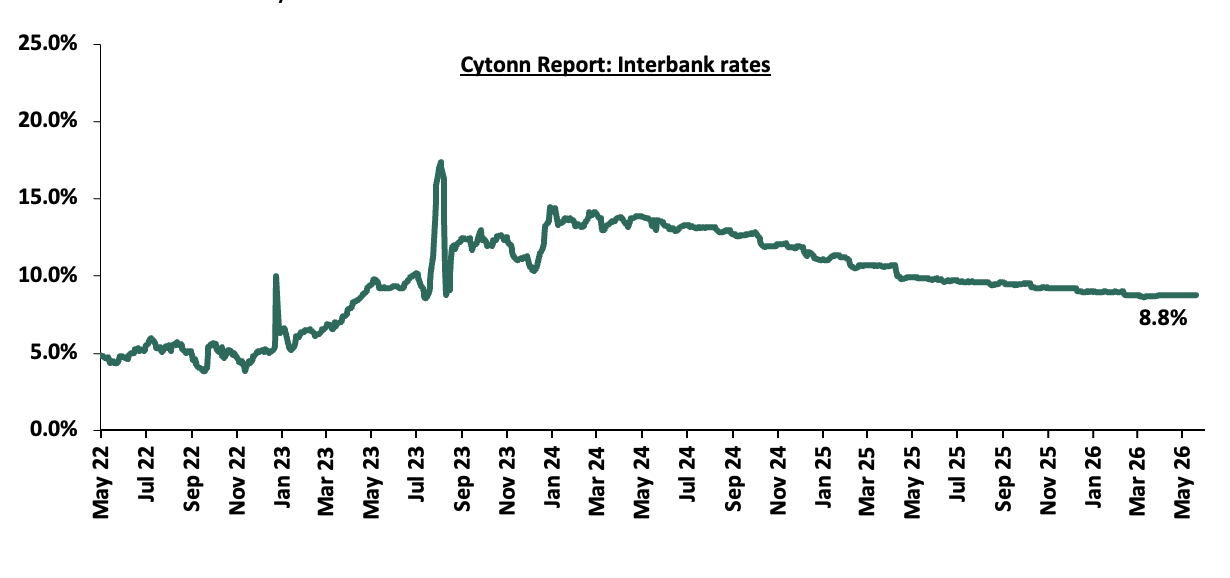
During the week, liquidity in the money markets tightened with the average interbank rate increasing marginally by 0.2 bps to remain relatively unchanged at 8.8% recorded last week, partly attributable to tax remittances that offset government payments. The average interbank volumes traded increased by 19.6% to Kshs 12.8 bn from Kshs 10.7 bn recorded the previous week. The chart below shows the interbank rates in the market over the years:
Kenya Eurobonds:
During the week, the yields on the Eurobonds were on an upward trajectory with the yield on the 13-year Eurobond issued in 2021, increasing the most by 52.0 bps to 8.9% from 8.3% recorded the previous week. The table below shows the summary performance of the Kenyan Eurobonds as of 21st May 2026;
|
Cytonn Report: Kenya Eurobonds Performance |
||||||
|
|
2018 |
2019 |
2021 |
2024 |
||
|
Tenor |
10-year issue |
30-year issue |
12-year issue |
13-year issue |
7-year issue |
|
|
Amount Issued (USD) |
1.0 bn |
1.0 bn |
1.0 bn |
1.5 bn |
1.5 bn |
|
|
Years to Maturity |
2.5 |
22.5 |
8.8 |
5.5 |
10.5 |
|
|
Yields at Issue |
7.3% |
8.3% |
6.2% |
10.4% |
9.9% |
|
|
02-Jan-26 |
6.1% |
8.8% |
7.2% |
7.8% |
7.1% |
|
|
01-May-26 |
7.4% |
9.3% |
8.3% |
8.7% |
8.0% |
|
|
14-May-26 |
7.2% |
9.0% |
7.9% |
8.3% |
7.5% |
|
|
15-May-26 |
7.4% |
9.2% |
8.2% |
8.7% |
7.8% |
|
|
18-May-26 |
7.3% |
9.3% |
8.3% |
8.8% |
7.9% |
|
|
19-May-26 |
7.5% |
9.4% |
8.5% |
9.0% |
8.2% |
|
|
20-May-26 |
7.3% |
9.3% |
8.3% |
8.9% |
8.0% |
|
|
21-May-26 |
7.3% |
9.3% |
8.3% |
8.9% |
8.0% |
|
|
Weekly Change |
0.1% |
0.3% |
0.4% |
0.5% |
0.5% |
|
|
MTD Change |
(0.1%) |
0.1% |
0.0% |
0.2% |
0.0% |
|
|
YTD Change |
1.3% |
0.5% |
1.2% |
1.0% |
0.9% |
|
Source: Central Bank of Kenya (CBK) and National Treasury
Kenya Shilling:
During the week, the Kenya Shilling depreciated against the US Dollar by 32.5 bps to Kshs 129.8 from Kshs 129.3 recorded the previous week. On a year-to-date basis, the shilling has depreciated by 54.2 bps against the dollar, as compared to the 22.9 bps appreciation recorded in 2025.
We expect the shilling to be supported by:
- Diaspora remittances standing at a cumulative USD 5,053.5 mn in the twelve months to April 2026, 1.1% higher than the USD 4,997.2 mn recorded over the same period in 2025. These have continued to cushion the shilling against further depreciation. In the April 2026 diaspora remittances figures, North America remained the largest source of remittances to Kenya accounting for 52.2% in the period, and,
- Tourism inflows, which strengthened significantly. Tourism receipts reached Kshs 560.0 bn in 2025, up from Kshs 452.2 bn in 2024, representing a 23.9% increase, supported by improved international arrivals through the country’s major airports, and,
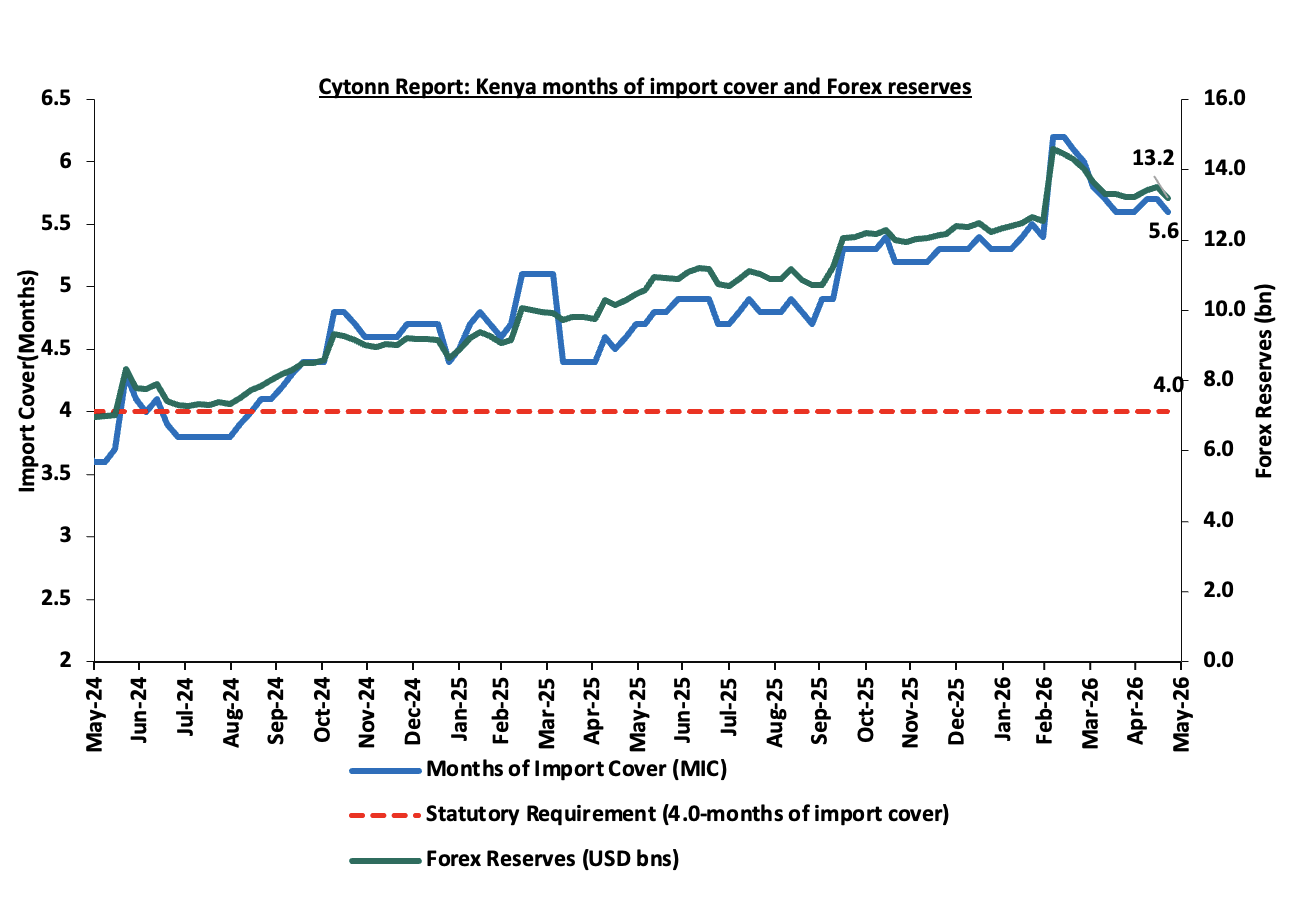
- Improved forex reserves currently at USD 13.2 bn (equivalent to 5.6-months of import cover), which is above the statutory requirement of maintaining at least 4.0-months of import cover and above the EAC region’s convergence criteria of 4.5-months of import cover.
The shilling is however expected to remain under pressure in 2026 as a result of:
- An ever-present current account deficit which came at 2.4% of GDP in the twelve months to February 2026, and,
- The need for government debt servicing, continues to put pressure on forex reserves given that 52.0% of Kenya’s external debt is US Dollar-denominated as of September 2025.
- Rising geopolitical tensions in the Middle East, which could exert pressure on the shilling through higher global oil prices and increased uncertainty in international markets. Given that Kenya is a net importer of petroleum products, any sustained increase in oil prices would widen the import bill, increase demand for US Dollars, and consequently put depreciation pressure on the shilling.
Kenya’s forex reserves decreased by 2.2% during the week to USD 13.2 bn from USD 13.5 bn recorded the previous week, equivalent to 5.6 months of import cover, and above the statutory requirement of maintaining at least 4.0-months of import cover.
The chart below summarizes the evolution of Kenya's months of import cover over the years:
Weekly Highlights
- Inflation Projection
We are projecting the y/y inflation rate for May 2026 will increase to within the range of 5.8% - 6.4%, mainly on the back of:
- Increased fuel prices – The Energy and Petroleum Regulatory Authority (EPRA) released their monthly statement on the maximum retail fuel prices in Kenya, effective from 15th May 2026 to 14th June 2026. Notably, the maximum allowed prices for Super Petrol, and Diesel increased by Kshs 16.7, and Kshs 46.3 per litre to Kshs 214.3, and Kshs 242.9 per litre from Kshs 197.6, and Kshs 196.6 per litre respectively in April 2026, the second increase in 2026. While Kerosene remain unchanged at Kshs 152.8 per litre. Subsequently, the Authority issued a revised pricing schedule effective 19th May 2026 to 14th June 2026. Diesel prices were adjusted downwards by Kshs 10.1 per litre to Kshs 232.8 per litre, while Kerosene prices were adjusted upward by Kshs 38.6 per litre to Kshs 191.4 per litre, reflecting elevated global crude oil prices amid ongoing geopolitical tensions in the Middle East. On the other hand, Super petrol remain unchanged at Kshs 214.3 per litre. Despite the revision, fuel prices remain significantly higher compared to April levels, and this increase is expected to exert upward pressure on inflation through higher transport and production costs, which are likely to be passed on to consumers.
- Depreciation of the Kenya Shilling against the US Dollar- The Kenya Shilling recorded a 43.3 bps month-to-date depreciation as of 22nd May 2026 to Kshs 129.8 from Kshs 129.2 recorded at the beginning of the month. This depreciation in the exchange rate could tighten inflationary pressures, making imported goods more expensive.
- The Central Bank Rate (CBR) – In April 2026, the CBK Monetary Policy Committee maintained the Central Bank Rate (CBR) at 8.75%, unchanged from February 2026, in a bid to keep inflation expectations anchored amid geopolitical tensions in the Middle East. However, overall, policy rates had eased in recent months, declining by a cumulative 1.3% points in the 12 months to April 2026 to 8.75% from 10.75% in April 2025. The Monetary Policy Committee is expected to adopt a more cautious approach to rate adjustments in the coming meetings while monitoring the effects of the Middle East Conflict. Even with a cautious stance, cheaper credit from past easing, external supply shocks and potential currency depreciation create an environment where inflationary pressures can outpace CBK’s stabilizing efforts.
We, however expect the inflation to be supported by:
- Decreased electricity forex adjustments charges - In May 2026, electricity prices decreased marginally with EPRA setting the fuel cost charge at Kshs 3.1 down from Kshs 3.5 in April 2026, while the forex adjustment was dropped to Kshs 1.1 from Kshs 1.2 in April 2026. Given that electricity is a key driver of inflation, the decline is expected to ease production costs for businesses and reduce electricity expenses for households, thereby providing some relief to overall inflationary pressures.
The ongoing US–Iran tensions continue to disrupt global oil logistics, particularly around the Strait of Hormuz, sustaining volatility and a persistent risk premium in crude oil prices. Although disruptions have shifted from acute shocks to more intermittent and structural supply frictions, Murban crude, Kenya’s key import grade, remains elevated and volatile, keeping upward pressure on future pump prices. Any pass through into fuel prices would have significant implications for inflation, given fuel’s central role in transport, logistics, and production costs. The depreciation of the Kenyan Shilling is expected to exert upward pressure on inflation by increasing the landed cost of imports such as fuel, raw materials, and intermediate goods. Given the economy’s reliance on imported inputs, the weaker currency is likely to raise production and transportation costs across various sectors, with businesses potentially passing these additional costs on to consumers through higher prices of goods and services.
While the recent marginal decrease of the electricity forex adjustment charges offers some temporary relief on inflation, this support remains vulnerable to renewed geopolitical risks and sustained oil price volatility. We however still expect inflationary pressures to remain anchored within the CBK’s target range of 2.5%-7.5%, but above the midpoint in the short to medium term.
- I&M Medium Term Note
During the week, I&M Bank released the results of the first tranche of its Kshs 20.0 bn Medium Term Note Programme, with tenors to maturity of 5.5 years, with maturity date of November 2031. The first tranche comprises Kshs 10.0 bn with a green shoe option of an additional Kshs 3.0 bn. The bond was oversubscribed, with an overall subscription rate coming in at 232.3% receiving bids worth Kshs 23.2 bn against the Kshs 10.0 bn offered. I&M accepted bids worth 13.0 bn, translating to an acceptance rate of 56.0%. The note was offered at par at an issue price, carries a fixed coupon rate of 12.2% per annum payable semi-annually in May and November of each year in accordance with the Pricing Supplement. The settlement date is 18th May 2026 and the MTN will be listed on NSE on 21st May 2026.
|
Cytonn Report: I&M Medium Term Note Tranche One Results |
||
|
No. |
Item |
Description |
|
1 |
Programme Amount |
Kshs 20.0 bn |
|
2 |
Tranche number |
1 |
|
3 |
Total amount offered in Tranche 1 |
Kshs 10.0 bn |
|
4 |
Total bids received in Tranche 1 |
Kshs 23.2 bn |
|
5 |
Subscription rate |
232.3% |
|
6 |
Amount accepted (after exercising Kshs 5.0 bn green shoe option) |
Kshs 13.0 bn |
|
7 |
Acceptance rate |
56.0% |
|
8 |
Coupon rate |
12.2% p.a |
|
9 |
Issue price |
Par |
|
10 |
Issue date |
18th May 2026 |
|
11 |
Tenor |
5.5 years |
|
12 |
Maturity date |
18th November 2031 |
|
13 |
Coupon payment dates |
Semi-annually in May and November each year |
I&M Bank issued the Medium Term Note to diversify its funding sources and secure stable medium-term capital beyond traditional deposits. The proceeds will support onward lending, business expansion, and strengthen the bank’s capital adequacy ratios through Tier II capital enhancement. I&M Bank’s oversubscribed Medium-Term Note reflects strong investor confidence in the bank’s credit profile and highlights sustained demand for high quality corporate fixed income instruments in the market. The strong uptake of the note reinforces the growing depth of Kenya’s corporate bond market, supports diversification away from government securities, and positions I&M as a credible issuer capable of attracting long term capital at competitive pricing.
Rates in the Fixed Income market have been on an upward trend driven by tightening liquidity in the money market, which has limited the government's ability to front load its borrowing. The government is 17.3% ahead of its prorated net domestic borrowing target of Kshs 899.8 bn, having a net borrowing position of Kshs 1055.8 bn (inclusive of T-bills). However, we expect a stabilization of the yield curve in the short and medium term, with the government looking to increase its external borrowing to maintain the fiscal surplus, hence alleviating pressure in the domestic market. As such, we expect the yield curve to stabilize in the short to medium-term and hence investors are expected to shift towards the long-term papers to lock in the high returns
Market Performance:
During the week, the equities market recorded a mixed performance, with NSE 10 and NASI gaining by 0.8%, and 0.3% respectively. NSE 25 remaining relatively unchanged while NSE 20 declined by 1.0%, taking the YTD performance to gains of 11.1%, 11.0%, 10.1% and 9.5% for NSE 20, NSE 25, NASI and NSE 10 respectively. The week-on-week equities market performance was mainly driven by losses recorded by large cap stocks such as Stanbic, Standard Chartered and BAT of 6.8%, 2.8% and 1.9% respectively. However, the performance was supported by gains recorded by large cap stocks such as Safaricom, Equity and EABL of 2.3%, 1.3% and 0.6% respectively;
During the week, the banking sector index declined by 0.8% to 235.1 from 236.9 recorded the previous week. This is attributable to losses recorded by large cap stocks such as Stanbic, Standard Chartered and Co-operative of 6.8%, 2.8% and 0.8% respectively;
During the week, equities turnover increased by 21.2% to USD 28.8 mn from USD 23.7 mn recorded the previous week, taking the YTD total turnover to USD 644.2 mn. Foreign investors remained net sellers for the fifth consecutive week with a net selling position of USD 1.9 mn, from a net selling position of USD 2.9 mn recorded the previous week, taking the YTD foreign net selling position to USD 93.8 mn, compared to a net selling position of USD 92.9 mn recorded in 2025;
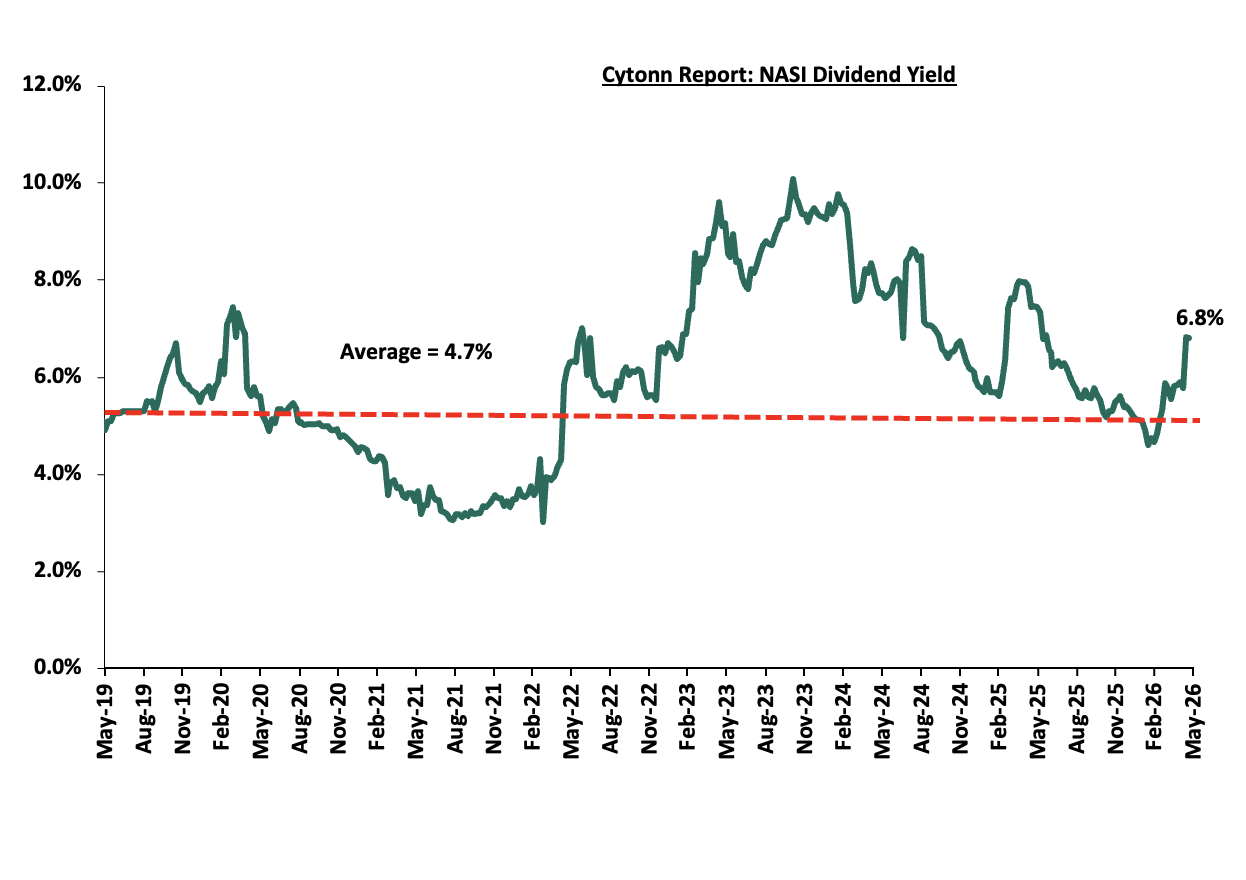
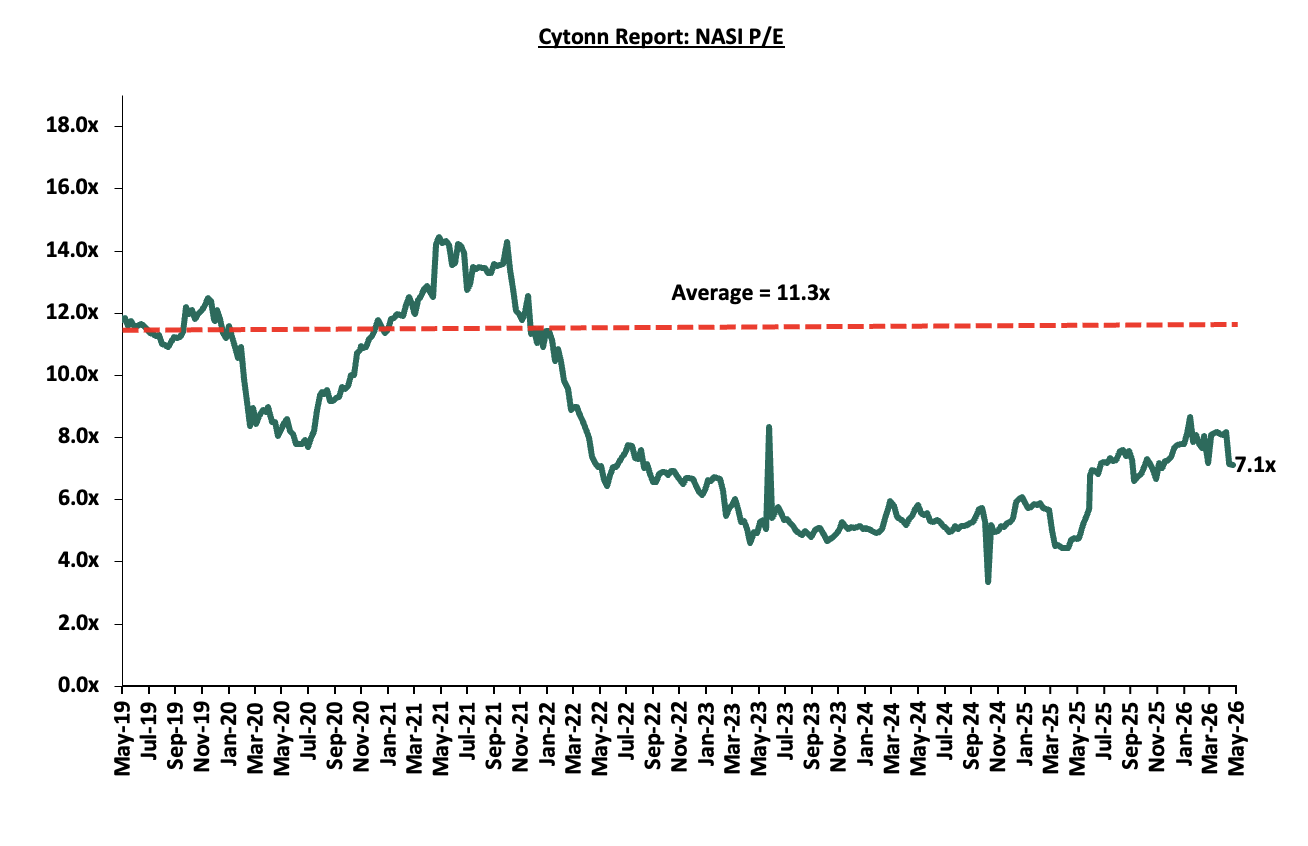
The market is currently trading at a price to earnings ratio (P/E) of 7.1x, 36.8% below the historical average of 11.3x, and a dividend yield of 6.8%, 2.1% points above the historical average of 4.7%. Key to note, NASI’s PEG ratio currently stands at 0.9x, an indication that the market is slightly undervalued relative to its future growth. A PEG ratio greater than 1.0x indicates the market may be overvalued while a PEG ratio less than 1.0x indicates that the market is undervalued;
The charts below indicate the historical P/E and dividend yields of the market:
Universe of Coverage:
|
Cytonn Report: Equities Universe of Coverage |
|||||||||||
|
Company |
Price as at 15/05/2026 |
Price as at 22/05/2026 |
w/w change |
m/m change |
YTD Change |
Year Open 2026 |
Target Price* |
Dividend Yield |
Upside/ Downside** |
P/TBv Multiple |
Recommendation |
|
CIC Group |
4.2 |
4.2 |
(1.4%) |
(2.3%) |
(8.4%) |
4.5 |
5.5 |
3.1% |
35.3% |
1.0x |
Buy |
|
KCB Group |
66.8 |
66.8 |
0.0% |
(0.4%) |
1.5% |
65.8 |
81.1 |
10.5% |
32.0% |
0.7x |
Buy |
|
NCBA |
88.5 |
88.3 |
(0.3%) |
(0.8%) |
3.8% |
85.0 |
103.3 |
8.0% |
25.1% |
1.2x |
Buy |
|
Diamond Trust Bank |
149.3 |
149.5 |
0.2% |
1.4% |
30.3% |
67.0 |
175.1 |
6.0% |
23.1% |
0.4x |
Buy |
|
Equity Group |
75.0 |
76.0 |
1.3% |
3.4% |
13.4% |
114.8 |
87.8 |
7.6% |
23.1% |
1.0x |
Buy |
|
Co-op Bank |
32.5 |
32.3 |
(0.8%) |
3.0% |
34.9% |
23.9 |
37.2 |
7.8% |
23.0% |
1.2x |
Buy |
|
I&M Group |
49.7 |
50.0 |
0.6% |
1.0% |
16.8% |
42.8 |
56.7 |
7.5% |
20.8% |
0.8x |
Buy |
|
ABSA Bank |
28.8 |
28.8 |
0.0% |
(5.7%) |
15.7% |
24.9 |
31.7 |
7.1% |
17.5% |
1.6x |
Accumulate |
|
Stanbic Holdings |
294.5 |
274.5 |
(6.8%) |
(4.0%) |
38.8% |
322.5 |
297.5 |
8.1% |
16.5% |
1.6x |
Accumulate |
|
Jubilee Holdings |
369.8 |
365.3 |
(1.2%) |
(3.9%) |
13.3% |
299.8 |
407.5 |
4.1% |
15.7% |
0.5x |
Accumulate |
|
Standard Chartered Bank |
344.5 |
335.0 |
(2.8%) |
(4.6%) |
11.8% |
9.1 |
346.8 |
9.3% |
12.8% |
2.1x |
Accumulate |
|
Britam |
12.5 |
12.9 |
2.8% |
4.5% |
41.8% |
197.8 |
13.5 |
0.0% |
5.1% |
1.0x |
Hold |
|
*Target Price as per Cytonn Analyst estimates **Upside/ (Downside) is adjusted for Dividend Yield ***Dividend Yield is calculated using FY’2025 Dividends |
|||||||||||
Weekly Highlights
- Earnings Releases
- Equity Group Q1’2026 Performance
During the week, Equity Group released their Q1’2026 financial results. Below is a summary of Equity Group’s Q1’2026 performance:
|
Balance Sheet Items |
Q1'2025 |
Q1'2026 |
y/y change |
|
Government Securities |
329.0 |
353.7 |
7.5% |
|
Net Loans and Advances |
804.7 |
873.5 |
8.6% |
|
Total Assets |
1749.2 |
2036.5 |
16.4% |
|
Customer Deposits |
1314.2 |
1480.2 |
12.6% |
|
Deposits per branch |
3.3 |
3.6 |
9.9% |
|
Total Liabilities |
1484.5 |
1692.9 |
14.0% |
|
Shareholders’ Funds |
251.3 |
326.5 |
29.9% |
|
Balance Sheet Ratios |
Q1'2025 |
Q1'2026 |
% points change |
|
Loan to Deposit Ratio |
61.2% |
59.0% |
(2.2%) |
|
Government Securities to Deposits |
25.0% |
23.9% |
(1.1%) |
|
Return on average equity |
20.8% |
27.4% |
6.6% |
|
Return on average assets |
2.8% |
4.2% |
1.4% |
|
Income Statement |
Q1'2025 |
Q1'2026 |
y/y change |
|
Net Interest Income |
28.6 |
33.0 |
15.6% |
|
Net non-Interest Income |
19.6 |
22.3 |
13.7% |
|
Total Operating income |
48.2 |
55.3 |
14.8% |
|
Loan Loss provision |
(3.4) |
(2.8) |
(17.0%) |
|
Total Operating expenses |
(29.50) |
(30.8) |
4.4% |
|
Profit before tax |
18.7 |
24.5 |
31.2% |
|
Profit after tax |
15.3 |
19.1 |
24.1% |
|
Core EPS |
3.9 |
4.9 |
24.0% |
|
Income Statement Ratios |
Q1'2025 |
Q1'2026 |
% points change |
|
Yield from interest-earning assets |
11.5% |
10.5% |
(1.0%) |
|
Cost of funding |
4.3% |
3.0% |
(1.4%) |
|
Cost of risk |
7.0% |
5.1% |
(1.9%) |
|
Net Interest Margin |
7.4% |
7.9% |
0.4% |
|
Net Interest Income as % of operating income |
59.3% |
59.7% |
0.4% |
|
Non-Funded Income as a % of operating income |
40.7% |
40.3% |
(0.4%) |
|
Cost to Income Ratio |
61.2% |
55.7% |
(5.6%) |
|
CIR without LLP |
54.2% |
50.6% |
(3.6%) |
|
Cost to Assets |
1.5% |
1.4% |
(0.1%) |
|
Capital Adequacy Ratios |
Q1'2025 |
Q1'2026 |
% points change |
|
Core Capital/Total Liabilities |
18.2% |
19.5% |
1.3% |
|
Minimum Statutory ratio |
8.0% |
8.0% |
0.0% |
|
Excess |
10.2% |
11.5% |
1.3% |
|
Core Capital/Total Risk Weighted Assets |
16.5% |
17.7% |
1.2% |
|
Minimum Statutory ratio |
10.5% |
10.5% |
0.0% |
|
Excess |
6.0% |
7.2% |
1.2% |
|
Total Capital/Total Risk Weighted Assets |
18.3% |
19.1% |
0.8% |
|
Minimum Statutory ratio |
14.5% |
14.5% |
0.0% |
|
Excess |
3.8% |
4.6% |
0.8% |
|
Liquidity Ratio |
58.5% |
64.7% |
6.2% |
|
Minimum Statutory ratio |
20.0% |
20.0% |
0.0% |
|
Excess |
38.5% |
44.7% |
6.2% |
Key Take-Outs:
- Increased earnings - Core earnings per share grew by 24.0% to Kshs 4.9, from Kshs 3.9 in Q1’2025, driven by the 14.8% increase in total operating income to Kshs 55.3 bn, from Kshs 48.2 bn in Q1’2025, that outpaced the 4.4% increase in total operating expenses to Kshs 30.8 bn from Kshs 29.5 bn in Q1’2025,
- Improved asset quality – The bank’s Asset Quality improved, with Gross NPL ratio decreasing to 11.5% in Q1’2026, from 15.0% in Q1’2025, attributable to a 17.5% decrease in Gross non-performing loans to Kshs 109.5 bn, from Kshs 132.8 bn in Q1’2025, compared to the 7.2% increase in gross loans to Kshs 948.5 bn, from Kshs 885.1 bn recorded in Q1’2025,
- Expanded Balanced sheet - The balance sheet registered an expansion as total assets increased by 16.4% to Kshs 2,036.5 bn in Q1’2026, from Kshs 1,749.2 bn in Q1’2025, mainly driven by the 8.6% increase in net loans and advances to customers to Kshs 875.5 bn, from Kshs 804.7 bn in Q1’2025, coupled with a 7.5% increase in government securities to Kshs 353.7 bn, from Kshs 329.0 bn in Q1’2025,
- Increased lending- Customer net loans and advances increased by 8.6% to Kshs 873.5 bn, from Kshs 804.7 bn in Q1’2025.
For a more detailed analysis, please see our Equity Group Q1’2026 Earnings Note
- KCB Group Q1’2026 Performance
During the week, KCB Group released their Q1’2026 financial results. Below is a summary of KCB Group’s Q1’2026 performance:
|
Balance Sheet Items |
Q1'2025 |
Q1'2026 |
y/y change |
|
Government Securities |
309.2 |
366.4 |
18.5% |
|
Net Loans and Advances |
1,018.6 |
1,208.2 |
18.6% |
|
Total Assets |
2,034.2 |
2,254.5 |
10.8% |
|
Customer Deposits |
1,427.8 |
1,652.1 |
15.7% |
|
Total Liabilities |
1,728.7 |
1,892.7 |
9.5% |
|
Shareholders’ Funds |
297.1 |
352.2 |
18.6% |
|
Government Securities |
309.2 |
366.4 |
18.5% |
|
Balance Sheet Ratios |
Q1'2025 |
Q1'2026 |
% point change |
|
Loan to Deposit Ratio |
71.3% |
73.1% |
1.8% |
|
Government Securities to Deposit Ratio |
21.7% |
22.2% |
0.5% |
|
Return on average equity |
23.4% |
21.6% |
(1.8%) |
|
Return on average assets |
3.1% |
3.3% |
0.2% |
|
Income Statement (Kshs Bn) |
Q1'2025 |
Q1'2026 |
y/y change |
|
Net Interest Income |
33.7 |
36.6 |
8.6% |
|
Net non-Interest Income |
15.7 |
17.0 |
8.3% |
|
Total Operating income |
49.4 |
53.6 |
8.5% |
|
Loan Loss provision |
(5.6) |
(4.9) |
(12.4%) |
|
Total Operating expenses |
(28.3) |
(29.2) |
3.4% |
|
Profit before tax |
21.2 |
24.4 |
15.3% |
|
Profit after tax |
16.5 |
18.2 |
10.0% |
|
Core EPS |
5.2 |
5.7 |
10.0% |
|
Income Statement Ratios |
Q1'2025 |
Q1'2026 |
% points change |
|
Yield from interest-earning assets |
12.6% |
11.8% |
(0.8%) |
|
Cost of funding |
4.7% |
3.6% |
(1.2%) |
|
Net Interest Spread |
7.9% |
8.3% |
0.4% |
|
Net Interest Margin |
8.2% |
8.5% |
0.2% |
|
Cost of Risk |
11.3% |
9.2% |
(2.2%) |
|
Net Interest Income as % of operating income |
68.2% |
68.3% |
0.1% |
|
Non-Funded Income as a % of operating income |
31.8% |
31.7% |
(0.1%) |
|
Cost to Income Ratio |
57.2% |
54.5% |
(2.7%) |
|
Cost to Income Ratio (without LLP) |
45.8% |
45.3% |
(0.5%) |
|
Capital Adequacy Ratios |
Q1'2025 |
Q1'2026 |
% points change |
|
Core Capital/Total Liabilities |
19.7% |
20.0% |
0.3% |
|
Minimum Statutory ratio |
8.0% |
8.0% |
0.0% |
|
Excess |
11.7% |
12.0% |
0.3% |
|
Core Capital/Total Risk Weighted Assets |
16.7% |
18.2% |
1.5% |
|
Minimum Statutory ratio |
10.5% |
10.5% |
0.0% |
|
Excess |
6.2% |
7.7% |
1.5% |
|
Total Capital/Total Risk Weighted Assets |
19.7% |
21.6% |
1.9% |
|
Minimum Statutory ratio |
14.5% |
14.5% |
0.0% |
|
Excess |
5.2% |
7.1% |
1.9% |
|
Liquidity Ratio |
48.9% |
51.1% |
2.2% |
|
Minimum Statutory ratio |
20.0% |
20.0% |
0.0% |
|
Excess |
28.9% |
31.1% |
2.2% |
Key Take-Outs:
- Increased earnings - Core earnings per share grew by 10.0% to Kshs 5.7, from Kshs 5.2 in Q1’2025, driven by the 8.5% increase in total operating income to Kshs 53.6 bn, from Kshs 49.4 bn in Q1’2025, it was however weighed down by the 3.4% increase in total operating expenses to Kshs 53.6 bn, from Kshs 49.4 bn in Q1’2025,
- Improved asset quality – The bank’s Asset Quality improved, with Gross NPL ratio decreasing to 15.9% in Q1’2026, from 19.9% in Q1’2025, attributable to a 15.0% increase in gross loans to Kshs 1,373.0 bn, from Kshs 1,174.8 bn recorded in Q1’2025 compared to the 6.6% decrease in Gross non-performing loans to Kshs 217.8 bn, from Kshs 233.3 bn in Q1’2025,
- Expanded balanced sheet - The balance sheet recorded an expansion as total assets increased by 10.8% to Kshs 2,254.5 bn, from Kshs 2,034.2 bn in Q1’2025, mainly driven by a 16.3% increase in net loans and advances to Kshs 1,208.2 bn, from 1,018.6 bn in Q1’2025.
For a more detailed analysis, please see our KCB Group Q1’2026 Earnings Note
- NCBA Group Q1’2026 Performance
During the week, NCBA Group released their Q1’2026 financial results. Below is a summary of NCBA Group’s Q1’2026 performance:
|
Balance Sheet Items |
Q1'2025 |
Q1'2026 |
y/y change |
|
Net Loans and Advances |
287.0 |
324.4 |
13.0% |
|
Government Securities |
187.5 |
216.6 |
15.6% |
|
Total Assets |
656.0 |
741.1 |
13.0% |
|
Customer Deposits |
495.7 |
544.4 |
9.8% |
|
Deposits per Branch |
4.3 |
4.4 |
3.6% |
|
Total Liabilities |
539.7 |
607.7 |
12.6% |
|
Shareholders’ Funds |
116.3 |
133.4 |
14.7% |
|
Key Ratios |
Q1'2025 |
Q1'2026 |
% points change |
|
Loan to Deposit Ratio |
57.9% |
59.6% |
1.7% |
|
Government Securities to Deposit ratio |
37.8% |
39.8% |
2.0% |
|
Return on average equity |
20.5% |
19.1% |
(1.4%) |
|
Return on average assets |
3.3% |
3.4% |
0.2% |
|
Income Statement |
Q1'2025 |
Q1'2026 |
y/y change |
|
Net Interest Income |
10.0 |
12.2 |
22.0% |
|
Net non-Interest Income |
7.4 |
7.8 |
6.3% |
|
Total Operating income |
17.3 |
20.0 |
15.4% |
|
Loan Loss provision |
1.6 |
2.5 |
56.2% |
|
Total Operating expenses |
10.5 |
12.2 |
16.6% |
|
Profit before tax |
6.8 |
7.4 |
8.8% |
|
Profit after tax |
5.5 |
6.0 |
8.8% |
|
Core EPS |
3.3 |
3.6 |
8.8% |
|
Income Statement Ratios |
Q1'2025 |
Q1'2026 |
% points change |
|
Yield from interest-earning assets |
12.8% |
11.5% |
(1.3%) |
|
Cost of funding |
7.0% |
4.2% |
(2.8%) |
|
Net Interest Spread |
5.8% |
7.3% |
1.5% |
|
Net Interest Margin |
6.3% |
7.7% |
1.5% |
|
Cost of Risk |
9.4% |
12.7% |
3.3% |
|
Net Interest Income as % of operating income |
57.5% |
60.8% |
3.3% |
|
Non-Funded Income as a % of operating income |
42.5% |
39.2% |
(3.3%) |
|
Cost to Income Ratio |
60.6% |
61.2% |
0.7% |
|
Cost to Income Ratio without LLP |
51.2% |
48.6% |
(2.7%) |
|
Capital Adequacy Ratios |
Q1'2025 |
Q1'2026 |
% points change |
|
Core Capital/Total Liabilities |
21.2% |
20.9% |
(0.3%) |
|
Minimum Statutory ratio |
8.0% |
8.0% |
|
|
Excess |
13.2% |
12.9% |
(0.3%) |
|
Core Capital/Total Risk Weighted Assets |
21.5% |
21.7% |
0.2% |
|
Minimum Statutory ratio |
10.5% |
10.5% |
|
|
Excess |
11.0% |
11.2% |
0.2% |
|
Total Capital/Total Risk Weighted Assets |
21.6% |
21.8% |
0.2% |
|
Minimum Statutory ratio |
14.5% |
14.5% |
|
|
Excess |
7.1% |
7.3% |
0.2% |
|
Liquidity Ratio |
55.8% |
63.9% |
8.2% |
|
Minimum Statutory ratio |
20.0% |
20.0% |
|
|
Excess |
35.8% |
43.9% |
8.2% |
Key Take-Outs:
- Increased earnings – Core earnings per share increased by 8.8% to Kshs 3.6, from Kshs 3.3 in Q1’2025, mainly driven by the 15.4% increase in total operating income to Kshs 20.0 bn, from Kshs 17.3 bn in Q1’2025. The performance was weighed down by the 16.6% increase in total operating expenses to Kshs 12.2 bn, from Kshs 10.5 bn in Q1’2025
- Improved asset quality – The bank’s Asset Quality improved, with Gross NPL ratio reduced by 0.9% points to 11.2% in Q1’2026 from 12.2% in Q1’2025, attributable to the the 3.9% increase in gross non-performing loans to Kshs 39.3 bn, from Kshs 37.8 bn in Q1’2025, which was outpaced by the 12.7% increase in gross loans to Kshs 350.4 bn, from Kshs 310.8 bn recorded in Q1’2025
- Expanded Balance sheet- The balance sheet recorded an expansion as total assets increased by 13.0% to Kshs 741.1 bn, from Kshs 656.0 bn in Q1’2025, mainly driven by a 13.0% loan book expansion to Kshs 324.4 bn from Kshs 287.0 bn in Q1’2025.
For a more detailed analysis, please see our NCBA Group Q1’2026 Earnings Note.
Asset Quality:
|
Cytonn Report: Listed Banks Asset Quality in Q1’2026 |
||||||
|
Bank |
Q1'2026 NPL Ratio* |
Q1'2025 NPL Ratio** |
% point change in NPL Ratio |
Q1'2026 NPL Coverage* |
Q1'2025 NPL Coverage** |
% point change in NPL Coverage |
|
KCB Group |
15.9% |
19.9% |
(4.0%) |
75.7% |
67.0% |
8.7% |
|
Equity Group |
11.5% |
15.0% |
(3.5%) |
68.5% |
60.5% |
7.9% |
|
Co-operative Bank |
14.7% |
17.1% |
(2.4%) |
67.7% |
64.2% |
3.5% |
|
Diamond Trust Bank |
11.8% |
13.2% |
(1.5%) |
56.1% |
39.9% |
16.2% |
|
NCBA Group |
11.2% |
12.2% |
(0.9%) |
66.2% |
63.0% |
3.2% |
|
Stanbic Holdings |
8.4% |
8.7% |
(0.4%) |
85.4% |
80.8% |
4.6% |
|
Q1’2026 Mkt Weighted Average* |
12.7% |
14.0% |
(1.2%) |
70.9% |
66.3% |
4.6% |
|
Q1’2025 Mkt Weighted Average** |
14.0% |
13.5% |
0.5% |
66.3% |
62.7% |
3.6% |
|
*Market cap weighted as at 22/05/2026 |
||||||
|
**Market cap weighted as at 13/06/2025 |
||||||
The table below shows the asset quality of listed banks that have released their Q1’2026 results using several metrics:
Key take-outs from the table include;
- Asset quality for the listed banks that have released results improved during Q1’2026, with market-weighted average NPL ratio decreasing by 1.2% points to 12.7% from 14.0% in Q1’2025 largely due to KCB Group and Co-operative Bank numbers, and,
- Market-weighted average NPL Coverage for the six listed banks increased by 4.6% points to 70.9% in Q1’2026 from 66.3% recorded in Q1’2025. The increase was attributable to Diamond Trust Bank NPL coverage ratio increasing by 16.2% points to 56.1% from 39.9% in Q1’2025.
Summary Performance
The table below shows the performance of listed banks that have released their Q1’2026 results using several metrics:
|
Cytonn Report: Listed Banks Performance in Q1’2026 |
||||||||||||||
|
Bank |
Core EPS Growth |
Interest Income Growth |
Interest Expense Growth |
Net Interest Income Growth |
Net Interest Margin |
Non-Funded Income Growth |
NFI to Total Operating Income |
Growth in Total Fees & Commissions |
Deposit Growth |
Growth in Government Securities |
Loan to Deposit Ratio |
Loan Growth |
Return on Average Equity |
|
|
Equity Group |
24.0% |
4.6% |
(19.1%) |
15.6% |
7.9% |
13.7% |
40.3% |
27.4% |
12.6% |
7.5% |
59.0% |
8.6% |
27.4% |
|
|
Co-operative Bank |
21.3% |
4.8% |
(8.3%) |
12.2% |
8.9% |
16.3% |
33.6% |
14.4% |
16.6% |
12.7% |
71.3% |
13.6% |
18.9% |
|
|
KCB Group |
10.0% |
2.1% |
(11.1%) |
8.6% |
8.5% |
8.3% |
31.7% |
6.7% |
15.7% |
18.5% |
73.1% |
18.6% |
21.6% |
|
|
NCBA Group |
8.8% |
3.0% |
(23.3%) |
22.0% |
7.7% |
6.3% |
39.2% |
6.6% |
9.8% |
15.6% |
59.6% |
13.0% |
19.1% |
|
|
Diamond Trust Bank |
7.7% |
10.3% |
(12.2%) |
30.9% |
7.0% |
(3.2%) |
22.6% |
2.1% |
10.4% |
16.7% |
63.2% |
13.8% |
11.4% |
|
|
Stanbic Group |
5.5% |
4.7% |
(6.4%) |
11.7% |
5.7% |
(13.7%) |
23.9% |
4.0% |
21.7% |
73.5% |
62.8% |
5.8% |
19.6% |
|
|
Q1'2026 Mkt Weighted Average* |
15.5% |
4.1% |
(14.2%) |
14.6% |
7.9% |
8.2% |
34.4% |
13.7% |
14.6% |
19.7% |
65.1% |
12.3% |
21.8% |
|
|
Q1'2025 Mkt Weighted Average* |
(0.7%) |
(1.4%) |
(14.4%) |
7.9% |
8.0% |
(11.2%) |
33.6% |
0.9% |
0.6% |
30.2% |
66.5% |
(2.3%) |
21.7% |
|
|
*Market cap weighted as at 22/05/2026 |
||||||||||||||
|
**Market cap weighted as at 13/06/2025 |
||||||||||||||
Key take-outs from the table include:
- The listed banks that have released their Q1’2026 results recorded a 15.5% growth in core Earnings per Share (EPS) in Q1’2026, compared to the weighted average decline of 0.7% in Q1’2025, an indication of improved performance attributable to the Equity Group and Co-operative Bank numbers.
- Interest income recorded a weighted average increase of 4.1% in Q1’2026, compared to 1.4% decrease in Q1’2025. However, interest expenses recorded a market-weighted average decline of 14.2% in Q1’2026 compared to the weighted average decline of 14.4% in Q1’2025.
- The Banks’ net interest income recorded a weighted average growth of 14.6% in Q1’2026, an increase from the 7.9% recorded over a similar period in 2025, while the non-funded income grew by 8.2% in Q1’2026 compared to the 11.2% decline recorded in Q1’ 2025, and,
- The Banks recorded a weighted average deposit growth of 14.6%, compared to the increase in market-weighted average deposit of 0.6% in Q1’2025.
We maintain a “cautiously optimistic” short-term outlook supported primarily earnings-led attractive valuations, despite rising yields on short-term government papers, which increase competition for capital by drawing investors towards risk-free government securities, as well as heightened geopolitical risks such as Iran war that may weigh on investor sentiment, and, “neutral” in the long term as persistent foreign investor outflows continue to constrain market liquidity and limit broad-based market re-rating. With the market currently trading at a discount to its future growth (PEG Ratio at 0.9x), where performance will be driven by company-specific fundamentals rather than general market direction, we believe that investors should reposition towards value stocks exhibiting strong earnings growth, attractive dividend yields, solid balance sheets, sustainable competitive advantages and trading at compelling discounts to their intrinsic value. While foreign investor sell-offs are expected to continue exerting pressure in the near term, we believe this will create selective entry opportunities for long-term investors.
- Infrastructure Sector
- NSE Lists First Infrastructure Fund
During the week, the Nairobi Securities Exchange listed its first infrastructure fund on the unquoted securities platform on 19th May 2026, marking a structural milestone in the deepening of Kenya's capital markets. Sponsored by Spearhead Africa Asset Management, the fund listed 35.0 mn units at Kshs 100.0 per unit, implying a total listed value of Kshs 3.5 bn, with a minimum purchase of 1,000 units. The first series, anchored by institutional investors including the UK Government's MOBILIST programme and CPF Group, raised Kshs 3.5 bn in local currency.
The fund operates as a listed infrastructure debt vehicle, deploying capital as senior debt into private sector-led infrastructure projects across East Africa, targeting renewable energy, digital infrastructure, logistics, agribusiness, and electrification. It raises long-term capital from investors and channels it directly into projects, earning interest income distributed to unit holders quarterly, with the fund targeting a yield of 5.0% to 6.0% above the prevailing 10-year government bond yield which is currently at 12.7% as at the week closing May 22nd 2026, implying a gross target return of 17.7% to 18.7%. The listed format is a structural departure from how infrastructure has traditionally been financed in Kenya, through private, illiquid vehicles with no secondary market, and whether the unquoted securities platform can deliver meaningful liquidity in practice remains the central question for prospective investors.
Looking ahead, the fund's listing has the potential to reshape how infrastructure is financed in Kenya by opening the asset class to a broader pool of capital, including domestic institutional investors such as pension funds and insurance companies that have long sought long-duration, yield-generating instruments aligned with their liability profiles. If the vehicle scales as intended towards Kshs 15.0 bn, it could catalyse a pipeline of similar listed debt instruments, gradually reducing Kenya's dependence on sovereign borrowing and donor financing for critical infrastructure. More broadly, it signals a maturing capital market where private sector-led structures can mobilise local currency at scale, a development that, if sustained, would meaningfully strengthen the foundation of East Africa's infrastructure financing ecosystem
- Mixed-Used Development Sector
- Unaitas Sacco's Kshs 521.6 mn Runda Development
During the week, Unaitas Sacco announced plans to construct a KShs 521.6 mn mixed-use development in Runda, Nairobi. The project will sit on 16,266 SQM and feature twin towers a seven-storey office block and a three-storey strip mall alongside a banking hall, data centre, restaurant, and additional lettable office space. The development marks a significant strategic shift for the sacco, which currently operates its headquarters from Cardinal Otunga Plaza in the Nairobi Central Business District.
The project, pending approval from the National Environment Management Authority (NEMA), will convert idle land along the northern bypass in Westlands into a fully income-generating venture. The strip mall will accommodate a Unaitas branch and retail tenants, while the office block will serve as the sacco's new headquarters. Sitting near landmarks such as the Glee Hotel, Githogoro village, and Runda Estate, and just 300 metres from the Kiambu Road–Northern Bypass junction, the development slots into a rapidly commercialising corridor.
We expect the Runda development to make a meaningful contribution to Kenya's real estate landscape, particularly along the Northern Bypass corridor. By introducing high-quality mixed-use space offices, retail, banking, and data infrastructure into an area already seeing growing commercial activity, Unaitas will help accelerate the corridor's transformation from a predominantly residential zone into a vibrant business hub, generating both direct and indirect employment and stimulating demand for skilled and unskilled labour during construction and beyond. For the broader property market, the entry of an institutional player like a major sacco into asset-backed real estate signals growing confidence in mixed-use developments outside the CBD, reflecting a wider trend of saccos and financial institutions leveraging their balance sheets to build long-term physical assets ultimately adding depth and diversity to commercial property supply in Nairobi's peri-urban areas
Real Estate Investments Trusts
- REITs Weekly Performance
On the Unquoted Securities Platform Acorn D-REIT and I-REIT traded at Kshs 29.6 and Kshs 23.8 per unit, respectively, as per the last updated data on 8th May 2026. The performance represented a 48.0% and 18.8% gain for the D-REIT and I-REIT, respectively, from the Kshs 20.0 inception price. The volumes traded for the D-REIT and I-REIT came in at 13.5 mn and 43.3 mn shares, respectively. Additionally, ILAM Fahari I-REIT traded at Kshs 13.8 per share as of 8th May 2026, representing a 31.0% loss from the Kshs 20.0 inception price. The volume traded to date came in at 1.2 mn shares for the I-REIT, REITs offer various benefits, such as tax exemptions, diversified portfolios, and stable long-term profits. However, the ongoing decline in the performance of Kenyan REITs and the restructuring of their business portfolios are hindering significant previous investments. Additional general challenges include:
- Insufficient understanding of the investment instrument among investors leading to a slower uptake of REIT products,
- Lengthy approval processes for REIT creation,
- High minimum capital requirements of Kshs 100.0 mn for REIT trustees compared to Kshs 10.0 mn for pension funds Trustees, essentially limiting the licensed REIT Trustee to banks only
- The rigidity of choice between either a D-REIT or and I-REIT forces managers to form two REITs, rather than having one Hybrid REIT that can allocate between development and income earning properties
- Limiting the type of legal entity that can form a REIT to only a trust company, as opposed to allowing other entities such as partnerships, and companies,
- We need to give time before REITS are required to list – they would be allowed to stay private for a few years before the requirement to list given that not all companies maybe comfortable with listing on day one, and,
- Minimum subscription amounts or offer parcels set at Kshs 0.1 mn for D-REITs and Kshs 5.0 mn for restricted I-REITs. The significant capital requirements still make REITs relatively inaccessible to smaller retail investors compared to other investment vehicles like unit trusts or government bonds, all of which continue to limit the performance of Kenyan REITs.
We expect the performance of Kenya's Real Estate sector to remain resilient, supported by several factors: i) The NSE's listing of its first infrastructure fund on the unquoted securities platform, which signals deepening capital markets and opens a new channel for mobilising long-term local currency capital into sectors such as real estate and related infrastructure ii) Unaitas Sacco's Kshs 521.6 mn mixed-use development in Runda, which reflects growing institutional confidence in asset-backed expansion beyond the CBD and is expected to contribute to commercial space supply and employment along the Northern Bypass corridor. However, challenges such the weak investor appetite in listed REITs like ILAM Fahari I-REIT and high capital requirements will continue to constrain the sector's optimal performance.
- U.S. SEC delays proposal to allow tokenized versions of publicly traded stocks
The U.S. Securities and Exchange Commission (SEC) this week delayed a proposal that would have allowed crypto platforms to more broadly offer tokenized versions of publicly traded stocks, highlighting growing regulatory caution around the intersection of blockchain technology and traditional capital markets. The proposal was aimed at creating an “innovation exemption” framework that could enable blockchain-based trading of equities with features such as 24/7 trading, fractional ownership, and near-instant settlement. However, the initiative faced resistance from stock exchanges, market infrastructure firms, and regulators over concerns related to investor protection, shareholder rights, and the possibility of firms issuing tokenized stocks without authorization from the underlying listed companies.
The delay is significant for the stablecoin industry because stablecoins serve as the primary settlement and liquidity infrastructure for tokenized asset trading ecosystems. Wider adoption of tokenized equities would likely increase demand for regulated dollar-backed stablecoins such as USDC, particularly for settlement, collateral management, and cross-platform liquidity transfers. Although the SEC’s decision temporarily slowed momentum around tokenized securities in the U.S., it does not signal opposition to asset tokenization altogether. Instead, regulators appear focused on establishing clearer legal, operational, and market-structure safeguards before permitting broader institutional adoption of blockchain-based securities trading.
- The Qivalis consortium adds 25 new banks in the Euro-dominated stablecoin initiave
This week, a major development in Europe’s digital asset landscape came from the rapid expansion of a euro-denominated stablecoin initiative led by the Qivalis consortium. The project added 25 new banks, significantly widening institutional participation to more than three dozen financial institutions across multiple European jurisdictions. Participating banks reportedly include major names such as ABN Amro, Rabobank, Nordea, UniCredit, BNP Paribas, and Bank of Ireland. The expansion signals growing interest among traditional European lenders in building a shared, regulated stablecoin infrastructure to support future digital payments and settlement systems.
The move reflects a strategic shift among European banks as they prepare for tokenized payment rails and blockchain-based settlement mechanisms, even as regulatory authorities remain cautious. While the European Central Bank has warned that stablecoins could pose risks to monetary sovereignty and bank deposit stability, the banking sector appears to be moving ahead with collaborative infrastructure to avoid being left behind by USD-dominated stablecoin ecosystems. The initiative also highlights Europe’s effort to develop a locally governed alternative to global USD stablecoins, aiming to preserve competitiveness in cross-border payments and digital finance innovation.
- Digital payments stock perfomance
The table below presents a snapshot of NYSE-listed digital payments stocks, covering Visa, Mastercard, American Express (AXP), and Circle.
|
Company |
Year Open 2026 |
Price 5/15/2026 |
Price 5/22/2026 |
w/w change |
YTD change |
P/E |
|
American Express |
372.7 |
357.4 |
311.8 |
(12.8%) |
(16.4%) |
25.2x |
|
Visa |
346.5 |
313.5 |
328.9 |
4.9% |
(5.1%) |
16.6x |
|
Mastercard |
563.1 |
494.2 |
498.5 |
0.9% |
(11.5%) |
31.0x |
|
Circle |
83.5 |
114 |
113.1 |
(0.8%) |
35.5% |
62.2x |
|
Average |
|
|
|
|
|
33.7x |
Source: Visa, AXP, Circle, Mastercard financials
The stocks are currently trading at an average P/E of 33.7x, implying that investors are pricing in strong future earnings growth expectations and are willing to pay a significant premium for current earnings, which may also suggest that the stocks are richly valued relative to their near-term fundamentals.
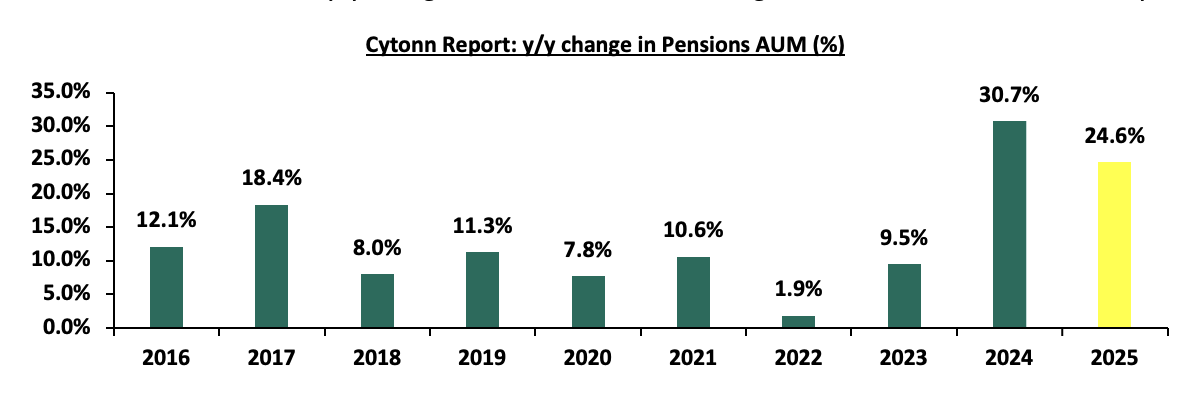
Kenya’s retirement benefits industry continued to demonstrate resilience and steady growth in Q1’2026, supported by continued implementation of the National Social Security Fund (NSSF) Act, 2013, improved contributions and favourable capital markets performance. The retirement benefits sector remains a critical pillar of Kenya’s financial system, serving both as a long-term savings vehicle for members and as a major source of long-term capital for the economy, contributing 16.1% of GDP as of December 2025. According to the latest Retirement Benefits Authority Industry Brief for December 2025, the Assets Under Management (AUM) increased by 24.6% to Kshs 2.8 tn from Kshs 2.3 tn. The performance was attributable to higher contributions from the NSSF Act, 2013’s raised limits and strong investment performance supported by a stable macroeconomic environment. According to the ACTSERV Q1’2026 Pension Schemes Investments Performance Survey, segregated retirement benefits scheme quarterly returns increased to a 5.2% return in Q1’2026, up from the 7.1% gain recorded in Q1’2025. The y/y performance in overall returns was largely driven by the positive returns in Equity of 5.3% from a gain of 4.6% in Q1’2025 attributable to improved investor confidence and strong performance of select counters at the Nairobi Securities Exchange (NSE). The performance was, however, weighed down by the 2.1% points decrease in the Fixed Income returns to 5.7%, from 7.8% in Q1’2025 majorly attributable to declining yields in the fixed income market, easing interest rates and cautious investor sentiment amid persistent inflationary pressures and heightened geopolitical tensions in the Middle East. Notably, on a q/q basis the segregated retirement benefits schemes recorded an increase in returns from a gain of 2.6% in Q4’2025.
We have been tracking the performance of Kenya’s Pension schemes with the most recent topical being,
Retirement Benefits Schemes FY'2025 Performance Report, done in March 2026. This week, we shall focus on looking into the historical and current state of retirement benefits schemes in Kenya and what can be done going forward. We shall also analyze other asset classes that the schemes can tap into to achieve higher returns. Additionally, we shall look into factors and challenges influencing the growth of the RBSs in Kenya as well as the actionable steps that can be taken to improve the pension industry. We shall do this by looking into the following:
- Historical and Current State of Retirement Benefits Schemes in Kenya,
- Factors Influencing the Growth of Retirement Benefits Scheme in Kenya,
- Challenges that Have Hindered the Growth of Retirement Benefit Schemes, and,
- Recommendations on Enhancing the Performance of Retirement Benefits Schemes in Kenya;
Section I: Historical and the Current State of Retirement Benefits Schemes in Kenya
- Growth of Retirement Benefits Schemes
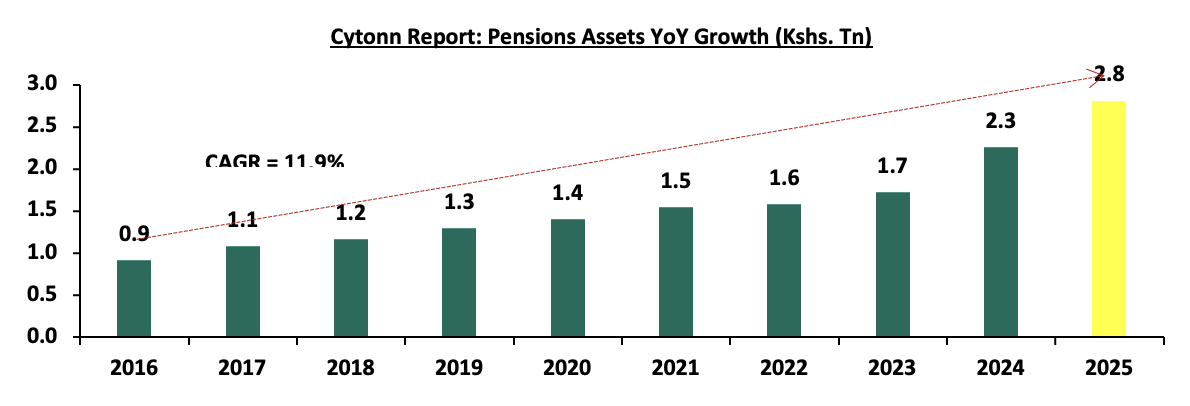
According to the latest Retirement Benefits Authority (RBA) Industry Report for December 2025, assets under management increased by 24.6% to Kshs 2.8 tn from the Kshs 2.3 tn recorded in December 2024. The growth of the assets was majorly attributed to the increase in contributions to the mandatory National Social Security Fund (NSSF) scheme, through the rollout of the third phase of the NSSF Act, 2013 which took effect in February 2025 significantly boosting retirement savings. Under Phase 3, the lower earnings limit increased from Kshs 7,000.0 to Kshs 8,000.0, while the upper earnings limit doubled from Kshs 36,000.0 to Kshs 72,000.0. As such, the NSSF investment assets increased by 43.1% to Kshs 623.8 bn in December 2025, from Kshs 435.9 bn in December 2024. Additionally, the improved macroeconomic conditions during the period as evidenced by favorable interest rate environment, mild inflationary pressures and stability of the exchange rate led to the growth in investment income for the schemes. In February 2026, the fourth phase of the NSSF contribution limit adjustment was successfully implemented, raising the lower earnings limit to Kshs 9,000 from Kshs 8,000 and the upper earnings limit to Kshs 108,000 from Kshs 72,000. Additionally, Tier I contributions rose from Kshs 480 to Kshs 540 for both employer and employee, while maximum Tier II contributions increased from Kshs 3,840 to Kshs 5,940 for both. This upward revision has already begun to strengthen the retirement benefits sector by boosting individual savings and accelerating the growth of overall Assets Under Management (AUM). The enhanced contributions are expected to continue to deepen long-term investment capacity and improve income security for future retirees, reinforcing the sector’s role in national economic development.
The graph below shows the growth of Assets under Management of the retirement benefits schemes over the last 10 years:
Source: RBA Industry Report
The consistent YoY increase demonstrates the significant role that the enhanced NSSF contributions made to the industry’s performance, following the implementation of the NSSF Act of 2013, which took effect in February 2023. The primary goal of the Act was to broaden the NSSF’s benefit coverage, range, and scope as well as improve the adequacy of benefits paid out of the scheme by the Fund amongst others.
The chart below shows the y/y changes in the assets under management for the schemes over the years.
Source: RBA Industry Report
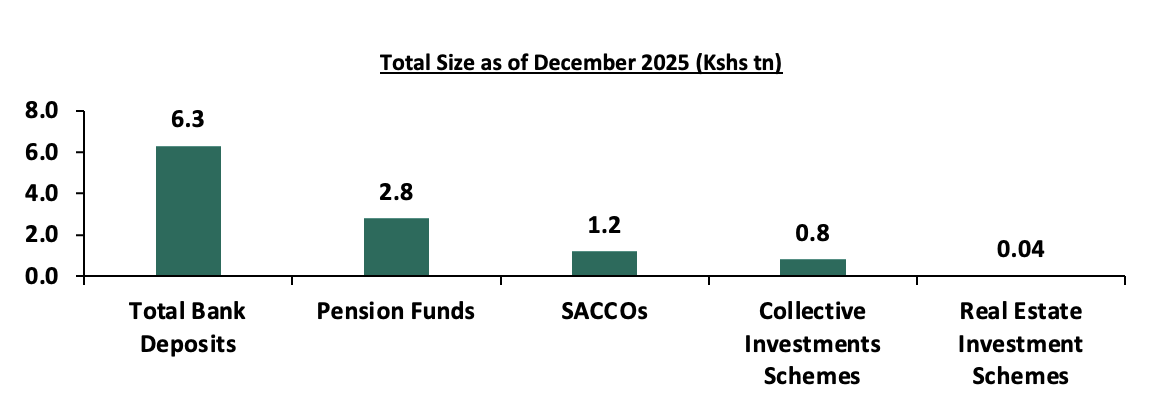
In Kenya, pension funds hold a substantial share of financial assets, consistently growing due to mandatory and voluntary contributions under the National Social Security Fund (NSSF) Act of 2013 regulations. In comparison, bank deposits remain the largest financial pool, reflecting their role as the primary savings vehicle driven by their liquidity, security, and accessibility, though they offer lower returns. Capital markets products, including unit trusts and REITs, are relatively smaller highlighting the nascent stage of capital markets in Kenya, but expanding as investors seek diversification and higher yields. Key to note, the Collective Investments Scheme’s industry’s overall Assets under Management (AUM) grew by 11.3% quarter‑on‑quarter to Kshs 756.2 bn in FY’2025 from Kshs 679.6 bn in Q3’2025, while on a year‑on‑year basis AUM rose by 94.3% from Kshs 389.2 bn in FY’2024. SACCOs play a crucial role in cooperative-based savings and credit access, especially for middle-income earners.
The graph below shows the Assets under Management of Pensions against other Capital Markets products and bank deposits:
Sources: CMA, RBA, SASRA and RAK
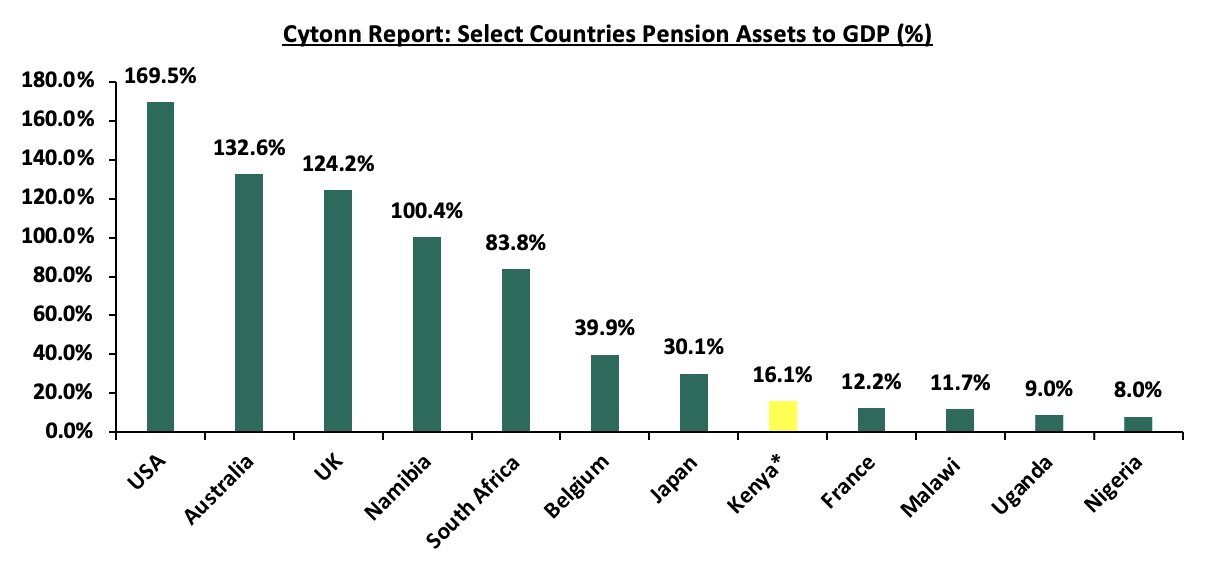
As of the latest available data by RBA, Kenya’s pension-to-GDP ratio increased by 1.5% points to 16.1% in December 2025 from 14.6% in 2024, driven by a 24.6% increase in pension Assets Under Management (AUM) to Kshs 2.8 bn, significantly outpacing the country’s GDP growth rate, which recorded a growth of 4.6% in FY’2025. This disparity implies that the pension sector is expanding at a much faster rate than the broader economy, reflecting stronger savings mobilization, improved investment returns, and possibly increased compliance or contribution levels following regulatory reforms. However, the 16.1% is significantly lower than that of developed countries such as the United States at 169.5%, Australia at 132.6%, and the United Kingdom at 124.2%, reflecting the maturity and depth of their pension systems. In Sub-Saharan Africa region, Kenya outperforms countries like Malawi at 11.7%, Uganda at 9.0% and Nigeria at 8.0%, but still lags behind Namibia at 100.4% and South Africa at 83.8%. This positioning indicates that while Kenya’s pension sector is growing steadily, particularly with recent reforms, there remains considerable room for expansion and deeper integration into the national economy. The graph below shows select countries’ pension assets to GDP ratio as per the latest published data by World Bank as of 2020:
Sources: World Bank, RBA *data as of December 2025
The graph below shows Kenya’s pension to GDP ratio over the years:
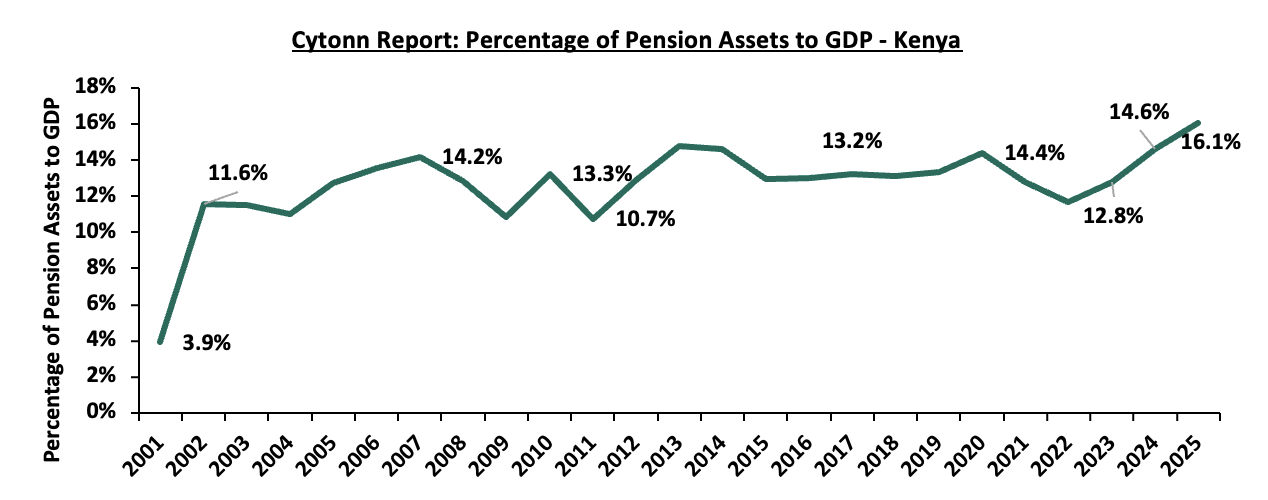
Source: RBA Industry Reports
- Assets Held by Fund Managers
According to the Retirement Benefits Authority, as of the end of December 2025, 23 fund managers submitted their returns to RBA. The AUM for the fund managers increased by 12.7% to Kshs 2,217.8 bn in December 2025 from Kshs 1,967.5 bn recorded in June 2025. The table below outlines the performance of the Fund Managers comparing June 2025 and December 2025:
|
# |
Cytonn Report: Assets Under Management by Fund Managers |
|||||
|
Fund Manager |
June 2025 AUM |
Market Share |
December 2025 AUM |
Market Share |
AUM Growth (June 2024 to December 2024) |
|
|
1. |
Genafrica Asset Managers Limited |
770.5 |
39.2% |
703.7 |
31.7% |
(8.7%) |
|
2. |
Co-optrust Investment Services Limited |
376.8 |
19.2% |
466.8 |
21.0% |
23.9% |
|
3. |
African Alliance Kenya Asset Management Limited |
218.8 |
11.1% |
320.4 |
14.4% |
46.4% |
|
4. |
Sanlam Investments East Africa Limited |
250.9 |
12.8% |
316.3 |
14.3% |
26.1% |
|
5. |
Old Mutual Investment Group Limited |
211.2 |
10.7% |
227.0 |
10.2% |
7.5% |
|
6. |
ICEA Lion Asset Management Limited |
94.7 |
4.8% |
103.3 |
4.7% |
9.1% |
|
7. |
CIC Asset Management Limited |
15.3 |
0.8% |
45.7 |
2.1% |
199.3% |
|
8. |
ABSA Asset Management Ltd |
4.5 |
0.2% |
9.8 |
0.4% |
115.2% |
|
9. |
NCBA Investment Bank Ltd |
8.0 |
0.4% |
8.8 |
0.4% |
9.8% |
|
10. |
Britam Asset Managers Kenya Limited |
9.8 |
0.5% |
7.7 |
0.3% |
(21.6%) |
|
11. |
Globetec Asset Management Limited |
4.1 |
0.2% |
5.1 |
0.2% |
23.8% |
|
12. |
Mayfair Asset Managers Limited |
0.6 |
0.0% |
0.8 |
0.0% |
31.5% |
|
13. |
Zimele Asset Management Company Limited |
0.8 |
0.0% |
0.8 |
0.0% |
0.7% |
|
14. |
Investcent Partners Limited |
0.6 |
0.0% |
0.7 |
0.0% |
5.5% |
|
15. |
Kuza Asset Management Limited |
0.2 |
0.0% |
0.3 |
0.0% |
55.4% |
|
16. |
Dry Associates Limited |
0.3 |
0.0% |
0.3 |
0.0% |
(0.0%) |
|
17. |
Cytonn Asset Managers Limited |
0.1 |
0.0% |
0.1 |
0.0% |
14.7% |
|
18. |
Lofty Corban Investments Limited |
0.0 |
0.0% |
0.1 |
0.0% |
47.8% |
|
19. |
Amana Capital Limited |
0.1 |
0.0% |
0.0 |
0.0% |
(9.6%) |
|
20. |
Fusion Investment Management Limited |
0.0 |
0.0% |
0.0 |
0.0% |
15.0% |
|
21. |
Genghis Capital Ltd |
0.0 |
0.0% |
0.0 |
0.0% |
1.7% |
|
22. |
VCG Asset Management Limited |
0.0 |
0.0% |
0.0 |
0.0% |
651.6% |
|
23. |
Star Capital Management Ltd |
- |
- |
0.0 |
0.0% |
- |
|
|
Total |
1,967.5 |
2,217.8 |
12.7% |
||
Source: RBA Industry Report
Key take-outs from the above table include:
- Assets Under Management: The AUM recorded a 12.7% growth to Kshs 2,217.8 bn in December 2025, higher than the AUM of Kshs 1,967.5 bn in June 2025,
- Growth:In terms of AUM growth, VCG Asset Managers recorded the highest growth of 651.6% with its AUM increasing to Kshs 4.5 mn, from Kshs 0.6 mn in June 2025, attributable to the base effect. On the other hand, Britam Asset Managers recorded the largest decline with its AUM declining by 21.6% to Kshs 7.7 bn in December 2025, from Kshs 9.8 mn in June 2025,
- Market Share:GenAfrica Asset Managers remained the largest overall Unit Trust with a market share of 31.7%, 7.4% points increase from 39.2% recorded in June 2025.
- Assets Held by NSSF
The total assets held by NSSF increased by 37.4% on a year-on-year basis to Kshs 623.8 bn in December 2025 from Kshs 453.9 bn in December 2024, and by 11.8% from Kshs 558.1 in June 2025. This is attributable to increased contributions due to the implementation of the NSSF Act of 2013, with the total NSSF remitted contributions increasing by 38.5% to Kshs 81.9 bn in FY’2023/24 from Kshs 59.1 bn in FY’2024/25, while unremitted contributions decreased by 35.4% to Kshs 2.0 bn from Kshs 3.1 bn in June 2024 highlighting improved employer compliance. Notably, contributions to the NSSF increased by 2.7% to Kshs 43.4 bn in December 2025 from Kshs 44.7 bn in June 2025. Additionally, internally managed funds amounted to Kshs 34.5 bn while externally managed funds were Kshs 589.3 bn. The graph below shows the total Assets under Management of NSSF over the last 5 years:
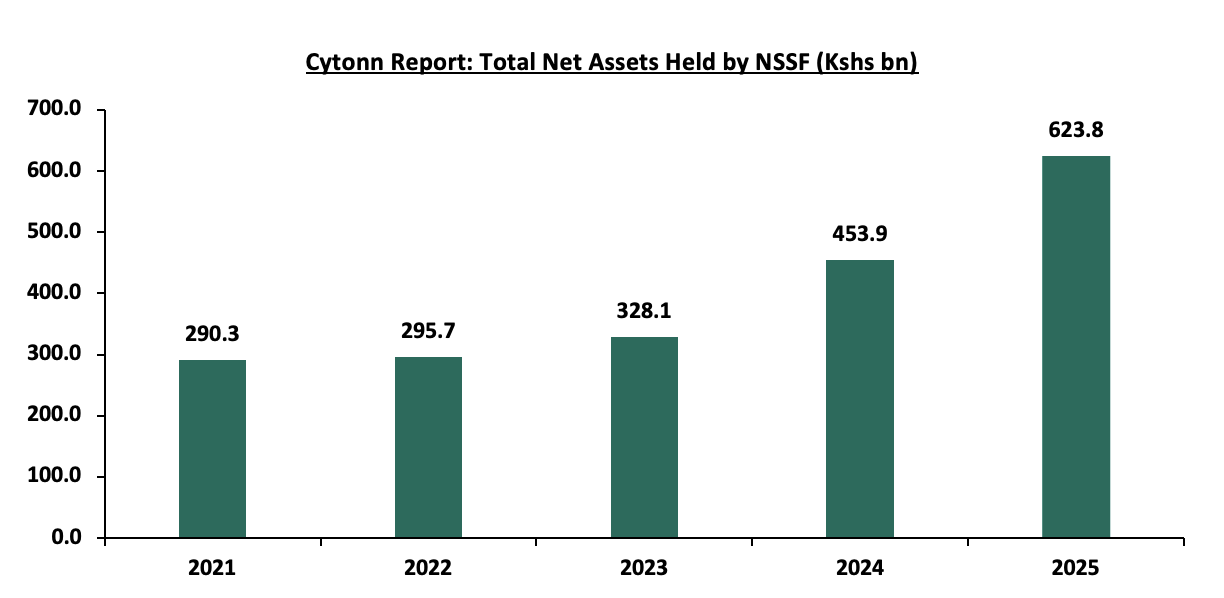
Source: RBA Industry Report
- Total Pension Contributions
Total pension contributions according to the KNBS 2026 Economic Survey came in at 285.4 bn in 2025, a 8.3% increase from the 263.5 bn in 2024. Since the implementation of the NSSF Act, 2013 in February 2023, the total pension contributions have increased gradually from Kshs 138.7 bn in 2022 to Kshs 205.0 bn in 2023 and Kshs 263.5 in 2024. Notably, the total NSSF remitted contributions increased by 38.5% to Kshs 81.9 bn in FY’2023/24 from Kshs 59.1 bn in FY’2024/25, while unremitted contributions decreased by 35.4% to Kshs 2.0 bn from Kshs 3.1 bn in June 2024 highlighting improved employer compliance.
Contributions to Post-Retirement Medical Funds (PRMFs) increased by 32.2% to Kshs 157.1 bn in December 2025 from Kshs 118.8 bn in 2024. This growth is primarily attributed to an increasing number of retirement benefit schemes being established and commencing contributions to PRMFs to enhance member welfare post-retirement.
Membership in pension schemes increased by 4.1% to 8.0 mn in 2025 from 7.7 mn in 2024, with active members increasing to 4.2 mn in 2025 from 3.8 mn in 2024 while inactive members remained relatively unchanged at 3.8 mn.
- Retirement Benefits Schemes Allocations and Various Investment Opportunities
The table below shows the AUM in the different asset classes in 2024 and 2025 and the change:
|
Cytonn Report: Kenyan Pension Funds’ Assets AUM (Kshs bn) |
|||
|
Asset Category |
2024 |
2025 |
YoY Change (%) |
|
Government Securities |
1,183.3 |
1,465.6 |
23.9% |
|
Guaranteed Funds |
437.5 |
522.4 |
19.4% |
|
Quoted Equities |
202.3 |
312.8 |
54.6% |
|
Immovable Property |
249.2 |
241.0 |
(3.3%) |
|
Offshore |
64.5 |
85.2 |
32.1% |
|
Fixed Deposits |
53.7 |
56.5 |
5.2% |
|
Cash |
23.1 |
33.2 |
43.6% |
|
Private Equity |
16.2 |
29.9 |
84.8% |
|
Listed Corporate Bonds |
6.3 |
28.3 |
349.0% |
|
REITs* |
11.7 |
14.4 |
22.8% |
|
Commercial Paper, non-listed bonds by private companies* |
3.2 |
12.1 |
276.9% |
|
Unquoted Equities |
4.0 |
8.9 |
122.5% |
|
Others e.g. Unlisted Commercial Papers |
0.2 |
0.5 |
135.0% |
|
TOTAL |
2,255.2 |
2,810.6 |
24.6% |
Source: RBA Industry report
Key take-outs from the table above are;
- Government securities remained the highest allocated asset class, recording a 23.9% increase in AUM to Kshs 1,465.6 bn in 2025 from Kshs 1,183.3 bn in 2024. Additionally, quoted equities grew by 54.6% to Kshs 312.8 bn in 2025 from Kshs 202.3 bn in 2024,
- Commercial paper and non-listed bonds by private companies grew significantly by 276.9% to Kshs 12.1 bn in 2025 from Kshs 3.2 bn in 2024 due to the growth of the Linzi Sukuk Bond value to Kshs 16.9 bn. Notably, investment in other assets increased by 135.0% to Kshs 0.5 bn from Kshs 0.2 bn, attributable to increased demand for specialized investment vehicles with Mansa-X Shariah Compliant Fund and SIB Najah Mansa-X Special Fund growing to Kshs 417.1 mn and Kshs 50.4 mn,
- Listed corporate bonds increased significantly by 349.0% to Kshs 28.3 bn in 2025 from Kshs 6.3 bn in 2024 attributable to new issuances such as the LINZI 003 Infrastructure Asset‑Backed Security, which accounted for Kshs 18.1 bn in scheme investments at a fixed 15.0% return to fund the Talanta Sports Stadium. Further contributions came from East African Breweries Ltd’s 11.8% medium‑term note with Kshs 196.6 mn invested, and Safaricom’s medium‑term notes with Kshs 209.6 mn and Kshs 68.4 mn invested, expanding exposure to manufacturing and telecommunications.
- Fixed deposits grew by 5.2% to Kshs 56.5 bn in 2025 from Kshs 53.7 bn in 2024. Additionally, cash increased by 43.6% to Kshs 33.2 bn in 2025 from Kshs 23.1 bn in 2024.
Performance of the Retirement Benefit Schemes
According to the ACTSERV Q1’2026 Pension Schemes Investments Performance Survey, segregated retirement benefits scheme quarterly returns increased to a 5.2% return in Q1’2026, down from the 7.1% gain recorded in Q1’2025. The y/y performance in overall returns was largely driven by the positive returns in Equity of 5.3% from a gain of 4.6% in Q1’2025 attributable to improved investor confidence and strong performance of select counters at the Nairobi Securities Exchange (NSE). The performance was, however, weighed down by the 2.1% points decrease in the Fixed Income returns to 5.7%, from 7.8% in Q1’2025 majorly attributable to declining yields in the fixed income market, easing interest rates and cautious investor sentiment amid renewed inflationary pressures and heightened geopolitical tensions in the Middle East. Notably, on a q/q basis the segregated retirement benefits schemes recorded an increase in returns from a gain of 2.6% in Q4’2025. The chart below shows the performance of segregated pension schemes in the first quarters over the last 5 years:
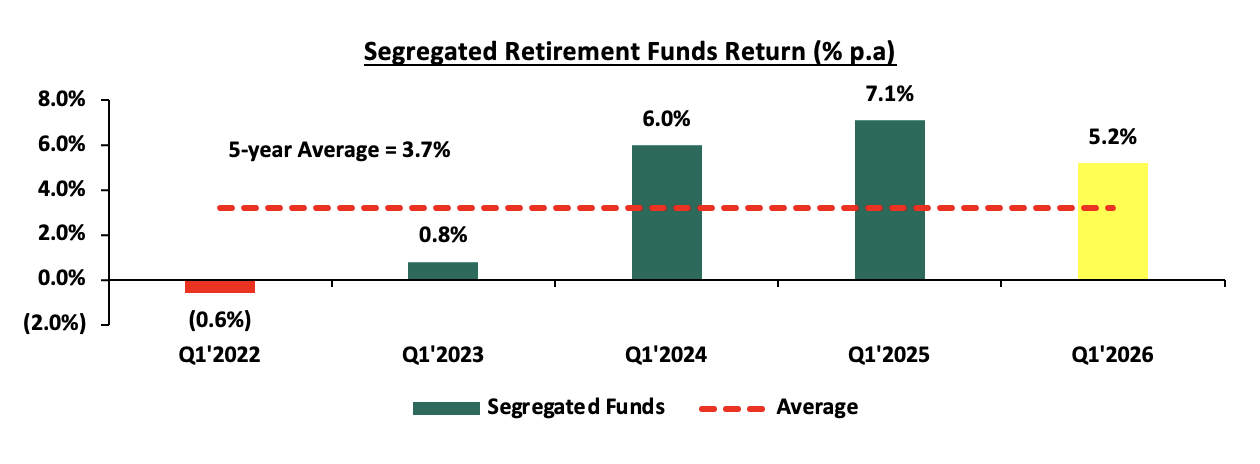
Source: ACTSERV Survey Reports (Segregated Schemes)
The key take-outs from the graph include:
- Schemes recorded a 5.2% gain in Q1’2026, representing 1.9% points decrease from the 7.1% gain recorded in Q1’2025. The performance was largely driven by the positive returns in Equity of 5.3% from a gain of 4.6% in Q1’2025 attributable to improved investor confidence and strong performance of select counters at the Nairobi Securities Exchange (NSE). The performance was, however, weighed down by the 2.1% points decrease in the Fixed Income returns to 5.7%, from 7.8% in Q1’2025 majorly attributable to declining yields in the fixed income market, easing interest rates and cautious investor sentiment amid renewed inflationary pressures and heightened geopolitical tensions in the Middle East and,
- Returns from segregated retirement funds have exhibited significant fluctuations over the last five years, ranging from a high of 7.1% recorded in Q1’2025 to a low of (0.6%) in Q1’2022, highlighting the sensitivity of fund performance to market and economic conditions.
The survey covered the performance of asset classes in three broad categories: Fixed Income, Equity, Offshore, and Overall Return. Below is a table showing the first quarter performances over the period 2022-2026:
|
Cytonn Report: Quarterly Performance of Asset Classes (2022 – 2026) |
|||||||
|
|
Q1'2022 |
Q1'2023 |
Q1’2024 |
Q1'2025 (a) |
Q1'2026 (b) |
Average (2022-2026) |
% points change (b-a) |
|
Equity |
(4.8%) |
(7.2%) |
25.6% |
4.6% |
5.3% |
4.7% |
0.7% |
|
Fixed Income |
1.1% |
2.6% |
2.9% |
7.8% |
5.7% |
4.0% |
(2.1%) |
|
Offshore |
(8.7%) |
16.0% |
(9.2%) |
(4.1%) |
(4.4%) |
(2.1%) |
(0.3%) |
|
Overall Return |
(0.6%) |
0.8% |
6.0% |
7.1% |
5.2% |
3.7% |
(1.9%) |
Source: ACTSERV Surveys
Key take-outs from the table above include;
- Returns from Equity investments recorded an increase by 0.7% points to a 5.3% gain in Q1’2026, from the 4.6% gain recorded in Q1’2025, majorly driven by the increase in the equities market performance
- Returns from Fixed Income recorded a decrease of 2.1% points to 5.7% in Q1’2026 from 7.8% recorded in Q1’2025. Declining yields in the fixed income market, easing interest rates and cautious investor sentiment amid renewed inflationary pressures and heightened geopolitical tensions in the Middle East.
- Returns from the Offshore investments recorded a decrease to a loss of 4.4% return in Q1’2026 from the 4.1% loss recorded in Q1’2025. The performance was partly attributable to trade frictions, rising energy costs, elevated valuations and a cautious stance by central banks.
Section II: Factors Influencing the Growth of Retirement Benefit Schemes
The retirement benefit scheme industry in Kenya has registered significant growth in the past 10 years with assets under management growing at a CAGR of 11.9% to Kshs 2.8 tn in 2025, from Kshs 0.9 tn in 2016. Notably, the AUM increased by 24.6% to Kshs 2.8 tn in 2025 from the Kshs 2.3 tn recorded in 2024. The growth is attributable to:
- Legislation - The National Assembly, on 26th December 2024, assented to the Tax Laws (Amendment) Bill 2024. The Bill amended the Income Tax Act by increasing the deductible amount for contributions to registered pension, provident, and individual retirement funds or public pension schemes to Kshs 360,000 annually from Kshs 240,000 and introduced provisions that allow contributions to post-retirement medical funds up to Kshs 15,000 per month to be tax-deductible. Additionally, income from registered retirement benefits schemes is now tax-exempt for individuals who have reached the retirement age set by their scheme, those withdrawing benefits early due to ill health, or those exiting a registered scheme after at least 20 years of membership. These changes aim to adjust for inflation and modernize deductions that have remained unchanged for over a decade. The revisions are expected to reduce individual taxable income and enhance retirement benefits. In addition, the implementation of the National Social Security Fund Act, 2013 is entering its third year and is expected to foster the growth of the pension industry by allowing both the employees in the formal and informal sector to save towards their retirement. The upward revision of the NSSF Tier 1 and Tier 2 contribution limits effective from February 2026, to Kshs 9,000 and 108,000 respectively from Kshs 8,000 and Kshs 72,000 respectively is expected to enhance retirement savings, improving pension adequacy for retirees,
- Public-Private partnerships - Public-private partnerships can be instrumental in expanding financial inclusion in the Kenyan pension sector. Collaborations between the government and private financial institutions can lead to the development and promotion of inclusive pension products. In Kenya, the National Social Security Fund (NSSF) is currently licensing and partnering with the private sector (Pension Fund Managers) to invest and manage NSSF Tier II contributions. This is a good example that the government is giving employees, employers, and persons in the informal sector to invest and save for their retirement in the private sector,
- Increased Pension Awareness – More people are becoming increasingly aware of the importance of pension schemes and as such, they are joining schemes to grow their retirement pot which they will use during their golden years. Over the last 20 years, pension coverage has grown from 12.0% to about 26.0% of the labour force. The Retirement Benefits Authority, through their Strategic Plan 2024-2029, aims to further expand this coverage to0% by 2029. This growth reflects industry-wide initiatives to increase awareness among Kenyan citizens on the need for retirement planning and innovations,
- Tax Incentives - Members of Retirement Benefit Schemes are entitled to a maximum tax-free contribution of of Kshs 30,000 monthly, equivalent to Kshs 360,000 annually. Consequently, pension scheme members enjoy a reduction in their taxable income and pay less taxes. This incentive has motivated more people to not only register but also increase their regular contributions to pension schemes,
- Micro-pension schemes - Micro-pension schemes are tailored to address the needs of Kenyans in the informal sector with irregular earnings. These schemes allow people to make small, flexible contributions towards their retirement. By accommodating their financial realities, micro-pensions can attract a broader segment of the population into the pension sector. Examples of these pension schemes are Mbao Pension Plan and Individual Pension Schemes where one can start saving voluntarily and any amount towards their retirement,
- Relevant Product Development – Pension schemes are not only targeting people in formal employment but also those in informal employment through individual pension schemes, with the main aim of improving pension coverage in Kenya. To achieve this, most Individual schemes have come up with flexible plans that fit various individuals in terms of affordability and convenience. Additionally, the National Social Security Fund Act, 2013 contains a provision for self-employed members to register as members of the fund, with the minimum aggregate contribution in a year being Kshs 4,800 with the flexibility of making the contribution by paying directly to their designated offices or through mobile money or any other electronics transfers specified by the board,
- Technological Advancement – The adoption of technology into pension schemes has improved the efficiency and management of pension schemes. A notable example of pension technology in Kenya is the M-Akiba This is a mobile-based platform that was developed by the government to enable Kenyans to save for their retirement using their mobile phones. Additionally, the improvement of mobile penetration rate and internet connectivity has enabled members to make contributions and track their benefits from the convenience of their mobile phones, and,
- Financial literacy programs - Financial literacy programs play a vital role in promoting the growth of retirement benefit schemes by enhancing financial inclusion among the public. Educating the public about the benefits of retirement savings and how to navigate pension schemes can empower individuals to take control of their financial future. The Retirement Benefits Authority (RBA) is at the forefront of ensuring the public is educated on financial literacy by organizing free training.
- RBA Stakeholder engagement and feedback - RBA intensified stakeholder engagement in Q1’2026 through public participation forums on proposed amendments to retirement benefits laws and regulations for FY’2026/27. The proposed reforms are expected to strengthen governance, improve pension adequacy, enhance operational efficiency, and encourage innovation in retirement savings products.
Section III: Challenges that Have Hindered the Growth of Retirement Benefit Schemes
Despite the expansion of the Retirement Benefit industry, several challenges continue to hinder its growth. Key factors include:
- Market Volatility – In segregated schemes, investment returns are not guaranteed and remain exposed to fluctuations in financial markets. A significant portion of pension assets in Kenya is invested in fixed income instruments, particularly government securities, which, despite being considered relatively stable, are still affected by changing market conditions. For instance, returns from the fixed income asset class declined to 5.7% in Q1’2026 from 7.8% in Q1’2025, reflecting the impact of changing interest rate dynamics and easing yields in the domestic fixed income market. Additionally, fluctuations in interest rates continue to influence overall portfolio performance, as declining interest rates may reduce bond yields while supporting gains in other asset classes such as equities. Such market movements create uncertainty in the growth of retirement savings and may affect the long-term value of pension portfolios,
- Inadequate Contributions - Even when individuals are covered by retirement schemes, their contributions are often inadequate to meet future financial needs due to factors such as low disposable income, delayed enrolment in schemes and inadequate contribution rates. Insufficient contributions translate directly into lower payouts upon retirement. For retirees, this can result in financial insecurity, dependence on family or government assistance and inability to meet basic living expenses. Low contributions may be insufficient to sustain post-retirement life,
- Premature Access to Savings – Members of individual pension schemes can withdraw 100.0% of their contributions, excluding any transferred employer contributions. In umbrella and occupational schemes, members can access up to 50.0% of their benefits before reaching retirement age, often due to job loss or changing employers. The RBA proposed a two-pot pension system where members can access a part of their pension savings during financial hardships such as education, housing and medical bills. While this provides short-term relief, it reduces the value of retirement savings, limiting the sector's growth potential,
- Low Pension Coverage in the Informal Sector – The informal sector is a significant part of Kenya's economy but is marked by irregular incomes and job insecurity. Kenya’s informal sector employs over 83.0% of the workforce, yet most workers in this segment lack access to structured retirement savings plans. Unlike formal employees who are automatically enrolled in schemes like NSSF, informal workers often operate outside regulatory frameworks. The Retirement Benefit Statistical Digest 2024 reports that only 151.5 mn individuals are registered in individual pension schemes. This number is low compared to the 7 mn people in the informal sector, representing 83.4% of the total workforce. Many in this sector prioritize immediate financial needs over long-term savings, and traditional pension products may not meet their financial realities,
- Unremitted Contributions – Some employers face financial constraints and fail to remit pension contributions to umbrella and occupational schemes. According to the NSSF 2025 Annual Report, as of 30th June 2025, total unremitted contributions had reached Kshs 2.0 bn. A notable example is the Standard Chartered Bank Kenya case, where 629 former employees successfully challenged the undervaluation of their pension benefits following the conversion of the scheme from a defined benefit to a defined contribution plan. The Supreme Court upheld the Retirement Benefits Appeals Tribunal ruling, compelling the bank to pay Kshs 7.2 bn in arrears. This case illustrates how both unremitted and undervalued contributions can expose employees to significant losses, while also highlighting the need for stricter compliance and oversight in the pension industry.
- Delayed Benefit Payments – The process of paying retirement benefits involves multiple steps, from determining accrued benefits to obtaining approvals from pension scheme trustees and employers. Delays are common as files move between service providers, creating frustration for retirees. These delays can discourage potential members from joining retirement schemes. According to the Pensioner Survey 2024, delay in payments of benefits is a major challenge to retirees,
- Low Allocation into Alternative Investments and Private Equity – There is limited allocation to alternative investments and private equity, despite their alignment with the long-term nature of retirement savings. These asset classes such as infrastructure, venture capital, and unlisted real estate offer the potential for higher returns, inflation hedging, and broader economic impact. However, pension schemes continue to favor traditional investments like fixed income and listed equities, largely due to regulatory conservatism, limited expertise in private markets, and perceived risk. This cautious approach restricts portfolio diversification and underutilizes the opportunity to channel pension capital into transformative sectors that could stimulate national development while enhancing member returns over time. Addressing this gap requires capacity building, regulatory support, and strategic partnerships to unlock the full potential of pension funds in alternative asset spaces. and,
- Low Financial Literacy and Awareness - A significant portion of Kenyans lack basic understanding of how pension schemes work, why they matter, and how to plan for retirement. According to RBA surveys, many contributors are unaware of their scheme’s investment strategy or the expected benefits upon retirement. This knowledge gap leads to poor decision-making, such as early withdrawals or failure to contribute consistently. For example, a young worker may opt out of a pension scheme believing it’s unnecessary, only to face financial insecurity later in life.
Section IV: Recommendations to Enhance the Growth and Penetration of Retirement Benefit Schemes in Kenya
- Increase Public Education and Awareness – To enhance the growth and inclusivity of retirement benefit schemes in Kenya, especially among informal sector workers, a multifaceted approach is essential. One of the most pressing challenges is the widespread lack of financial literacy and awareness about pension schemes. Many Kenyans, particularly those in informal employment, do not understand the importance of long-term savings or how pension systems operate. According to the RBA Pensioners Survey 2024, 65.0% of retirees expressed dissatisfaction with their retirement income, largely due to unrealistic expectations and poor planning. To address this, the government and stakeholders should invest in nationwide financial education campaigns tailored to different demographics. These initiatives can be delivered through radio, mobile platforms, and community outreach programs, leveraging trusted institutions such as SACCOs, religious organizations, and local leaders to build credibility and drive participation.
- Improve Regulatory Framework to Address Unremitted Contributions – The Retirement Benefits Authority (RBA) should enhance its oversight of employers to ensure pension contributions are fully and promptly remitted. Non-compliant employers should be subject to stricter penalties, such as fines or legal action, to encourage timely payments. However, for businesses experiencing short-term financial difficulties, RBA could provide options for structured payment plans or deadline extensions, helping them meet their obligations without defaulting. Additionally, RBA could involve Kenya Revenue Authority (KRA) to collect unremitted pension contributions and remit to RBA. KRA shall issue agency notices requiring holders of unremitted pension contributions to pay up within a specified date or notify KRA of their inability to pay due to lack of funds within 14 days of the receipt of the notice. Additionally, RBA should automate remittance tracking through systems like the Pensions Management Information System (PMIS), and publicly disclose defaulter lists to enhance transparency and accountability. An example of steps being taken to tackle the challenge of unremitted payments is the call for a comprehensive overhaul of Kenya’s pensions system by the Commission on Administrative Justice (Office of the Ombudsman) in February 2025. The initiative sought to address inordinate delays, unresponsiveness, and the manifest injustices affecting the public service pensions system, with the aim of restoring fairness, dignity, and public confidence.
- Introduce Policy Reforms to Limit Premature Withdrawals – To safeguard long-term retirement savings, the percentage of pension funds accessible before retirement should be further reduced. Withdrawals should only be permitted in cases of genuine emergencies, such as critical illness, and must be supported by clear documentation and justification. Additionally, retirement schemes should provide educational workshops and materials to raise awareness about the long-term benefits of sustained savings and the financial risks associated with early withdrawals. Incentives such as loyalty bonuses, employer matching contributions, and enhanced tax relief for retained benefits can further motivate individuals to maintain their savings over the long term.
- Adoption of Flexible Contribution Models in the Informal Sector – Traditional monthly contribution structures are often impractical for individuals whose earnings fluctuate daily or seasonally. Pension products should therefore allow for micro-contributions, daily, weekly, or even seasonal payments, through accessible platforms like mobile money. Schemes such as the Mbao Pension Plan have demonstrated the viability of this approach, enabling contributors to save as little as Kshs 20.0 per day. However, broader awareness and integration with other financial services are needed to scale these models.
- Promote Employees and Employer Participation in Pension Schemes – The Retirement Benefits Authority (RBA) should introduce incentives to encourage higher pension savings. This could include enhanced tax benefits for individuals and employers who contribute more to their pension schemes or a matching contribution system for voluntary savings. Such measures would motivate employees and employers to save beyond the mandatory contributions, ultimately improving retirement security and financial well-being.
- Streamline the Benefit Payment Process – The approval and disbursement of retirement benefits should be streamlined to minimize delays. Implementing automation for key processes and establishing clear timelines for each stage would ensure that retirees receive their benefits promptly. This efficiency would enhance trust in pension schemes and encourage greater participation, ultimately strengthening the retirement savings culture.
- Increase Allocation to Alternative Investments – alternative investments such as real estate, infrastructure and private equity then to have long-term investment horizons, usually in decades, and more stable and higher returns hence more suited to pension funds. However, allocation to these assets class is very low. It would help with returns and stability if retirement schemes increased their allocation to these asset classes.
- Incorporating Post-Retirement Medical Funds (PRMFs) into pension schemes – Incorporating Post-Retirement Medical Funds into pension schemes is a crucial step toward ensuring retirees can access quality healthcare without financial strain. The RBA Pensioners Survey 2024 revealed that 29.0% of retirees lack any form of medical insurance, while 77.0% of those with coverage still incur out-of-pocket expenses. Only 16.0% of the covered retirees are able to meet their medical costs through their insurance schemes or PRMFs. With most private insurers unwilling to cover individuals over 65, retirees are left vulnerable. PRMFs should be made a mandatory component of all pension schemes, with flexible contribution options and separate asset management to ensure transparency. Tax incentives for PRMF contributions and employer matching can further encourage uptake, with contributions deductible up to Kshs 15,000 per month. Contributions to PRMFs increased by 32.2% to Kshs 157.1 bn in 2025 from Kshs 118.8 in 2024. Kenya Power Pension Fund’s PRMF model, which allows members to save for healthcare during employment and access funds post-retirement, serves as a strong example of best practice.
Implementing these recommendations will be instrumental in fostering the sustainable expansion of Kenya’s retirement benefits sector. By addressing the underlying structural challenges that have long hindered progress, the industry can move toward a more inclusive and resilient future. This transformation will help build public confidence in pension systems, encouraging broader participation across both formal and informal employment segments.
Disclaimer: The views expressed in this publication are those of the writers where particulars are not warranted. This publication, which follows Section 2 of the Capital Markets Authority Act Cap 485A, is meant for general information only and is not a warranty, representation, advice or solicitation of any nature. Readers are advised in all circumstances to seek the advice of a registered investment advisor

- Talk to us
- Kenya
- P.O Box 20695 - 00200, Nairobi, Kenya
- Cell +254709101200
- Tel +254709101200
- WhatsApp +254741676635
- United States
- +254709101200
- DOWNLOAD OUR APP
-


- Kenya
- 8th Floor, Pinetree Plaza, Kaburu Drive, Ngong Road, Nairobi, Kenya
- USA
- Suite 1150, 1775 Eye Street NW, USA, Washington DC 20006, USA
- Investments
- High Yield
- Private Equity
- Real Estate
- Real Estate
- RiverRun Estates
- Cytonn Towers
- The Ridge
- Taraji Heights
- The Alma