Q2’2023 Unit Trust Funds Performance, & Cytonn Weekly #39/2023
By Research, Oct 1, 2023
Executive Summary
Fixed Income
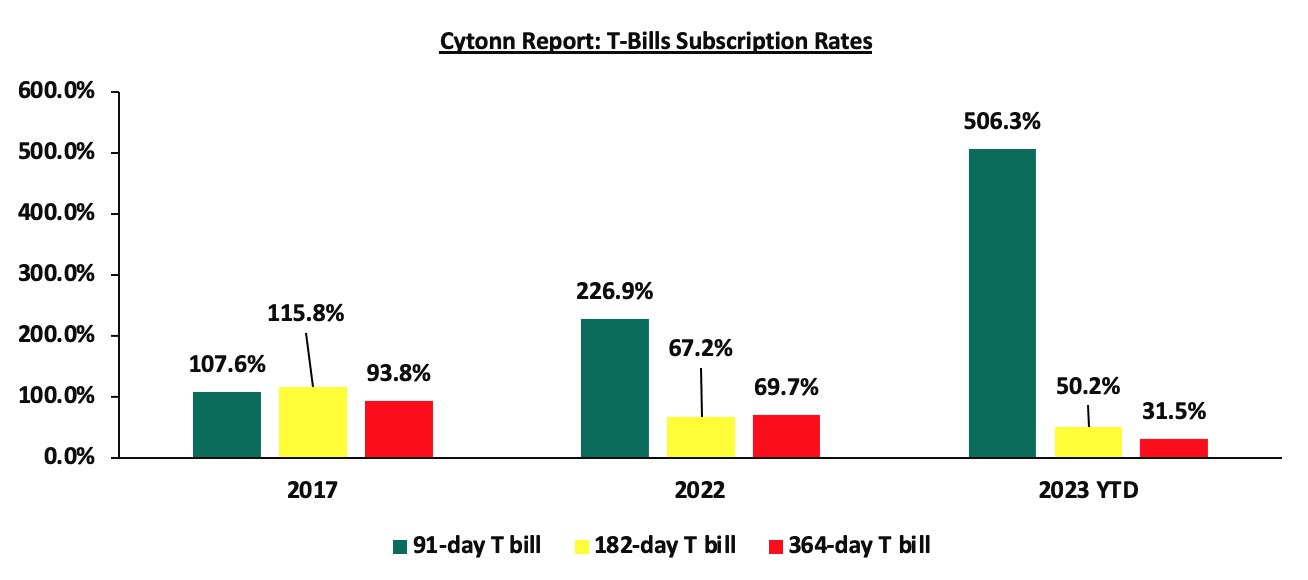
During the week, T-bills were undersubscribed for the third consecutive week, with the overall subscription rate coming in at 56.9%, albeit lower than the undersubscription rate of 84.1% recorded the previous week. Investors’ preference for the shorter 91-day paper persisted, with the paper receiving bids worth Kshs 11.0 bn against the offered Kshs 4.0 bn, translating to an oversubscription rate of 275.2%, albeit lower than the oversubscription rate of 401.7% recorded the previous week. The subscription rate for the 364-day paper decreased to 18.4%, from 25.3% recorded the previous week while that of 182-day paper decreased to 8.1%, from 15.8% recorded the previous week. The government accepted a total of Kshs 4.5 bn worth of bids out of Kshs 13.7 bn of bids received, translating to an acceptance rate of 33.1%. The yields on the government papers recorded mixed performance, with the yields on the 182-day and 91-day papers increasing by 1.0 bps and 3.4 bps to 14.9% and 14.8%, respectively while the yield on the 364-day paper decreased by 16.7 bps to 15.1%;
In the primary bond market, the Central Bank of Kenya released the auction results for the tap sale of the re-opened bond FXD1/2016/10 with a 2.9-year tenor to maturity and the re-opened bond FXD1/2023/02 with a tenor to maturity of 1.9 years. The tap sale was undersubscribed, receiving bids worth Kshs 3.45 bn against the offered Kshs 15.0 bn, translating to a 23.0% undersubscription rate. The government accepted bids worth Kshs 3.39 bn, translating to an acceptance rate of 98.5%. For FXD1/2023/002, the allocated average yield of accepted bids came in at 17.5%, 9.6 bps higher than the yield to maturity of 17.4% offered in the secondary market. The allocated average yield for FXD1/2016/10 came in at 17.9%, 4.9 bps lower than current yield to maturity of 18.0% in the secondary market. The coupon rate for the FXD1/2023/002 was set at 17.0% and FXD1/2016/10 was set at 15.0%, respectively;
During the week, the Kenya National Bureau of Statistics (KNBS) released the year-on-year inflation highlighting that the inflation rate in the month of September 2023 increased marginally to 6.8%, from the 6.7% inflation rate recorded in the month of August 2023. This was in line, but below our projections of an increase to within a range of 7.2% to 7.6%. The headline inflation in September 2023 was majorly driven by increase in prices of commodities in the following categories, food and non-alcoholic beverages; housing, water, electricity, gas and other fuels, and transport;
Equities
During the week, the equities market was on a downward trajectory, with NSE 10 declining the most by 1.8%, while NASI, NSE 20 and NSE 25 declined by 1.6%, 0.7% and 1.3% respectively, taking the YTD performance to losses of 25.2%, 9.9%, and 21.2% for NASI, NSE 20, and NSE 25, respectively. The equities market performance was mainly driven by losses recorded by large-cap stocks such as KCB Group, Equity Group, Safaricom of 6.7%, 3.7% and 2.7% respectively. The losses were however mitigated by gains recorded by stocks such as Stanbic Bank, NCBA Group and Standard Chartered Bank-Kenya of 3.8%, 1.6% and 1.2% respectively;
Real Estate
During the week, the Capital Markets Authority (CMA) granted Linzi Finco Trust the approval to issue an inaugural Shariah compliant bond, ‘Linzi Sukuk;
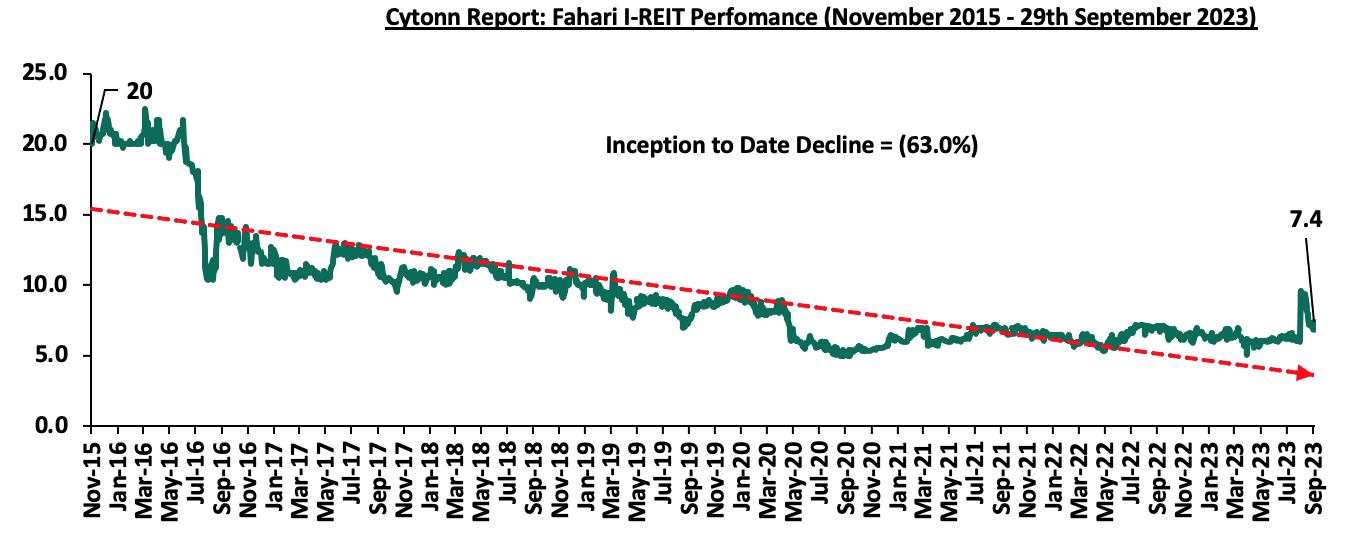
In regulated Real Estate Funds, under the Real Estate Investment Trusts (REITs) segment, Fahari I-REIT closed the week trading at an average price of Kshs 7.4 per share on the Nairobi Securities Exchange representing a 3.6% growth from the Kshs 7.1 recorded the previous week. On the Unquoted Securities Platform as at 29 September 2023, Acorn D-REIT and I-REIT closed the week trading at Kshs 25.3 and Kshs 21.7 per unit, a 26.6% and 8.2% gain for the D-REIT and I-REIT, respectively, from the Kshs 20.0 inception price. In addition, Cytonn High Yield Fund (CHYF) closed the week with an annualized yield of 14.7%, a 0.7% points increase from 14.0% recorded the previous week;
Focus of the Week
Unit Trust Funds are Collective Investment Schemes that pool money from multiple investors to collectively invest in a diversified portfolio of assets, managed by a Fund Manager, with the aim of generating returns to the investors. Following the release of the Capital Markets Authority (CMA) Quarterly CIS Report - Q2’2023, we examine the performance of Unit Trust Funds for the period ended 30th June 2023. During the period under review, Unit Trusts Funds’ Assets under Management grew by 7.1% to Kshs 176.0 bn as at the end of Q2’2023, from Kshs 164.3 bn recorded in Q1’2023. Additionally, as at the end of Q2’2023, there were 2 Unit Trusts Funds that became active, increasing the total number of active funds to 27 from 25 in Q1’2023;
Investment Updates:
- Weekly Rates:
- Cytonn Money Market Fund closed the week at a yield of 13.88% p.a To invest, dial *809# or download the Cytonn App from Google Playstore here or from the Appstore here;
- Cytonn High Yield Fund closed the week at a yield of 14.65% p.a. To invest, email us at sales@cytonn.com and to withdraw the interest, dial *809# or download the Cytonn App from Google Playstore here or from the Appstore here;
- We continue to offer Wealth Management Training every Wednesday, from 9:00 am to 11:00 am. The training aims to grow financial literacy among the general public. To register for any of our Wealth Management Trainings, click here;
- If interested in our Private Wealth Management Training for your employees or investment group, please get in touch with us through wmt@cytonn.com;
- Cytonn Insurance Agency acts as an intermediary for those looking to secure their assets and loved ones’ future through insurance namely; Motor, Medical, Life, Property, WIBA, Credit and Fire and Burglary insurance covers. For assistance, get in touch with us through insuranceagency@cytonn.com;
- Cytonn Asset Managers Limited (CAML) continues to offer pension products to meet the needs of both individual clients who want to save for their retirement during their working years and Institutional clients that want to contribute on behalf of their employees to help them build their retirement pot. To more about our pension schemes, kindly get in touch with us through pensions@cytonn.com;
Real Estate Updates:
- For more information on Cytonn’s real estate developments, email us at sales@cytonn.com;
- Phase 3 of The Alma is now ready for occupation and the show house is open daily. To join the waiting list to rent, please email properties@cytonn.com;
- For Third Party Real Estate Consultancy Services, email us at rdo@cytonn.com;
- For recent news about the group, see our news section here;
Hospitality Updates:
- We currently have promotions for Staycations. Visit cysuites.com/offers for details or email us at sales@cysuites.com;
During the week, T-bills were undersubscribed for the third consecutive week, with the overall subscription rate coming in at 56.9%, albeit lower than the undersubscription rate of 84.1% recorded the previous week. Investors’ preference for the shorter 91-day paper persisted, with the paper receiving bids worth Kshs 11.0 bn against the offered Kshs 4.0 bn, translating to an oversubscription rate of 275.2%, albeit lower than the oversubscription rate of 401.7% recorded the previous week. The subscription rate for the 364-day paper decreased to 18.4%, from 25.3% recorded the previous week while that of 182-day paper decreased to 8.1%, from 15.8% recorded the previous week. The government accepted a total of Kshs 4.5 bn worth of bids out of Kshs 13.7 bn of bids received, translating to an acceptance rate of 33.1%. The yields on the government papers recorded mixed performance, with the yields on the 182-day and 91-day papers increasing by 1.0 bps and 3.4 bps to 14.9% and 14.8%, respectively while the yield on the 364-day paper decreased by 16.7 bps to 15.1%. The chart below compares the overall average T- bills subscription rates obtained in 2017, 2022 and 2023 Year to Date (YTD):
In the primary bond market, the Central Bank of Kenya released the auction results for the tap sale of the re-opened bond FXD1/2016/10 with a 2.9-year tenor to maturity and the re-opened bond FXD1/2023/02 with a tenor to maturity of 1.9 years. The tap sale was undersubscribed, receiving bids worth Kshs 3.45 bn against the offered Kshs 15.0 bn, translating to a 23.0% undersubscription rate. The government accepted bids worth Kshs 3.39 bn, translating to an acceptance rate of 98.5%. For FXD1/2023/002, the allocated average yield of accepted bids came in at 17.5%, 9.6 bps higher than the yield to maturity of 17.4% offered in the secondary market. The allocated average yield for FXD1/2016/10 came in at 17.9%, 4.9 bps lower than current yield to maturity of 18.0% in the secondary market. The coupon rate for the FXD1/2023/002 was set at 17.0% and FXD1/2016/10 was set at 15.0%, respectively.
Money Market Performance:
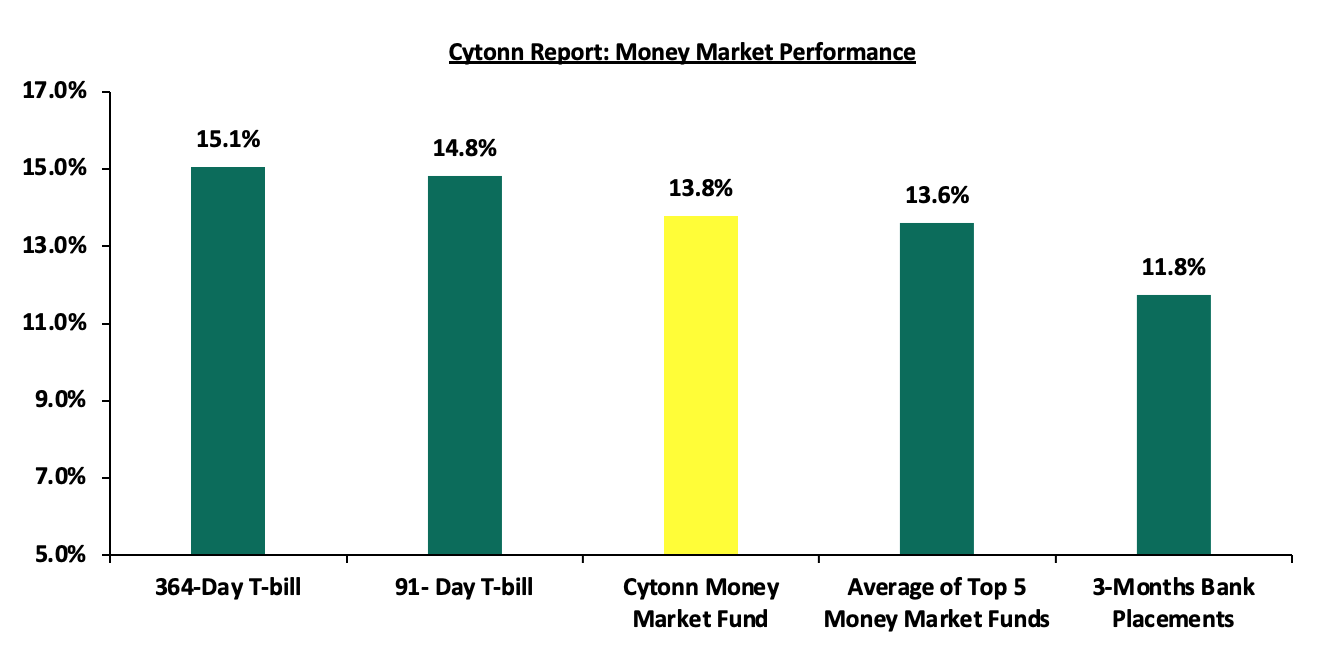
In the money markets, 3-month bank placements ended the week at 11.8% (based on what we have been offered by various banks), the yield on the 364-day paper decreased by 16.7 bps to 15.1%, while that of 91-day paper increased by 1.0 bps to 14.9%. The yield of Cytonn Money Market Fund increased by 12.0 bps, to 13.8%, from 13.7% and the average yields on the Top 5 Money Market Funds increased by 24.2 bps to 13.6% from 13.4% recorded the previous week.
The table below shows the Money Market Fund Yields for Kenyan Fund Managers as published on 29th Sep 2023:
|
Cytonn Report: Money Market Fund Yield for Fund Managers as published on 29th September 2023 |
||
|
Rank |
Fund Manager |
Effective Annual |
|
1 |
GenAfrica Money Market Fund |
14.2% |
|
2 |
Enwealth Money Market Fund |
13.9% |
|
3 |
Cytonn Money Market Fund |
13.8% |
|
4 |
Lofty-Corban Money Market Fund |
13.2% |
|
5 |
Etica Money Market Fund |
13.0% |
|
6 |
Co-op Money Market Fund |
12.9% |
|
7 |
AA Kenya Shillings Fund |
12.8% |
|
8 |
Jubilee Money Market Fund |
12.7% |
|
9 |
Apollo Money Market Fund |
12.6% |
|
10 |
Nabo Africa Money Market Fund |
12.6% |
|
11 |
Kuza Money Market fund |
12.5% |
|
12 |
GenCap Hela Imara Money Market Fund |
12.4% |
|
13 |
Madison Money Market Fund |
12.4% |
|
14 |
Sanlam Money Market Fund |
12.2% |
|
15 |
Old Mutual Money Market Fund |
12.2% |
|
16 |
Absa Shilling Money Market Fund |
12.0% |
|
17 |
ICEA Lion Money Market Fund |
11.6% |
|
18 |
KCB Money Market Fund |
11.5% |
|
19 |
Mali Money Market Fund |
11.3% |
|
20 |
Dry Associates Money Market Fund |
11.3% |
|
21 |
Orient Kasha Money Market Fund |
11.0% |
|
22 |
Equity Money Market Fund |
10.7% |
|
23 |
CIC Money Market Fund |
10.3% |
|
24 |
British-American Money Market Fund |
9.5% |
Source: Business Daily
Liquidity:
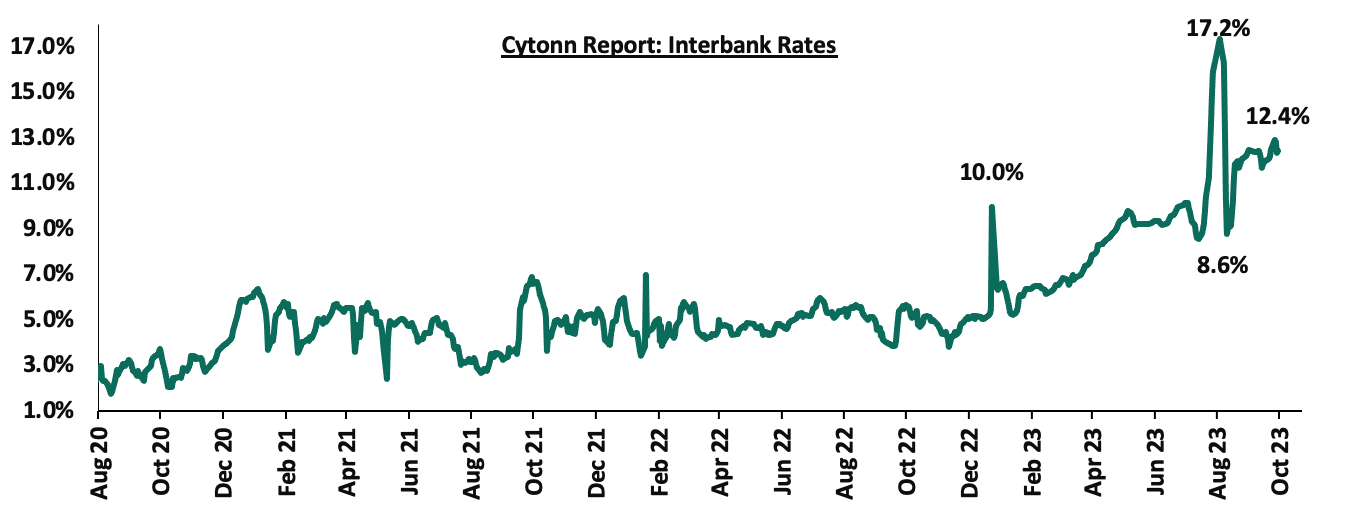
During the week, liquidity in the money markets tightened, with the average interbank rate increasing to 12.7%, from 12.2% recorded the previous week, partly attributable to tax remittances that offset government payments. The average interbank volumes traded increased by 5.8% to Kshs 23.1 bn, from Kshs 21.8 bn recorded the previous week. The chart below shows the interbank rates in the market over the years:
Kenya Eurobonds:
During the week, the yields on Eurobonds were on an upward trajectory, with the yield on the 10-year Eurobond issued in 2014 increasing the most by 1.9% points to 18.7%, from 16.8%, recorded the previous week. The table below shows the summary of the performance of the Kenyan Eurobonds as of 28th Sep 2023;
|
Cytonn Report: Kenya Eurobonds Performance |
||||||
|
|
2014 |
2018 |
2019 |
2021 |
||
|
Tenor |
10-year issue |
10-year issue |
30-year issue |
7-year issue |
12-year issue |
12-year issue |
|
Amount Issued (USD) |
2.0 bn |
1.0 bn |
1.0 bn |
0.9 bn |
1.2 bn |
1.0 bn |
|
Years to Maturity |
0.8 |
4.5 |
24.5 |
3.7 |
8.7 |
10.8 |
|
Yields at Issue |
6.6% |
7.3% |
8.3% |
7.0% |
7.9% |
6.2% |
|
02-Jan-23 |
12.9% |
10.5% |
10.9% |
10.9% |
10.8% |
9.9% |
|
01-Sep-23 |
13.8% |
11.7% |
11.4% |
12.0% |
11.5% |
11.0% |
|
21-Sep-23 |
16.8% |
13.0% |
12.1% |
14.0% |
12.3% |
11.9% |
|
22-Sep-23 |
18.4% |
13.4% |
10.4% |
14.6% |
12.6% |
12.2% |
|
25-Sep-23 |
18.7% |
13.5% |
10.4% |
14.6% |
12.7% |
12.3% |
|
26-Sep-23 |
18.7% |
13.4% |
10.5% |
14.5% |
12.7% |
12.3% |
|
27-Sep-23 |
18.6% |
13.4% |
10.6% |
14.5% |
12.8% |
12.4% |
|
28-Sep-23 |
18.7% |
13.5% |
10.8% |
14.6% |
12.9% |
12.5% |
|
Weekly Change |
1.9% |
0.5% |
(1.3%) |
0.5% |
0.6% |
0.6% |
|
MTD Change |
4.9% |
1.8% |
(0.5%) |
2.5% |
1.4% |
1.5% |
|
YTD Change |
5.8% |
3.0% |
0.1% |
2.1% |
2.6% |
|
Source: Central Bank of Kenya (CBK) and National Treasury
Kenya Shilling:
During the week, the Kenya Shilling depreciated by 0.4% against the US dollar to close the week at Kshs 148.1, from Kshs 147.4 recorded the previous week. On a year to date basis, the shilling has depreciated by 20.0% against the dollar, adding to the 9.0% depreciation recorded in 2022. We expect the shilling to remain under pressure in 2023 as a result of:
- An ever-present current account deficit, which came at 2.3% of GDP in Q1’2023 from 4.2% recorded in a similar period last year, and,
- The need for government debt servicing, continues to put pressure on forex reserves given that 66.8% of Kenya’s external debt is US Dollar denominated as of April 2023, and,
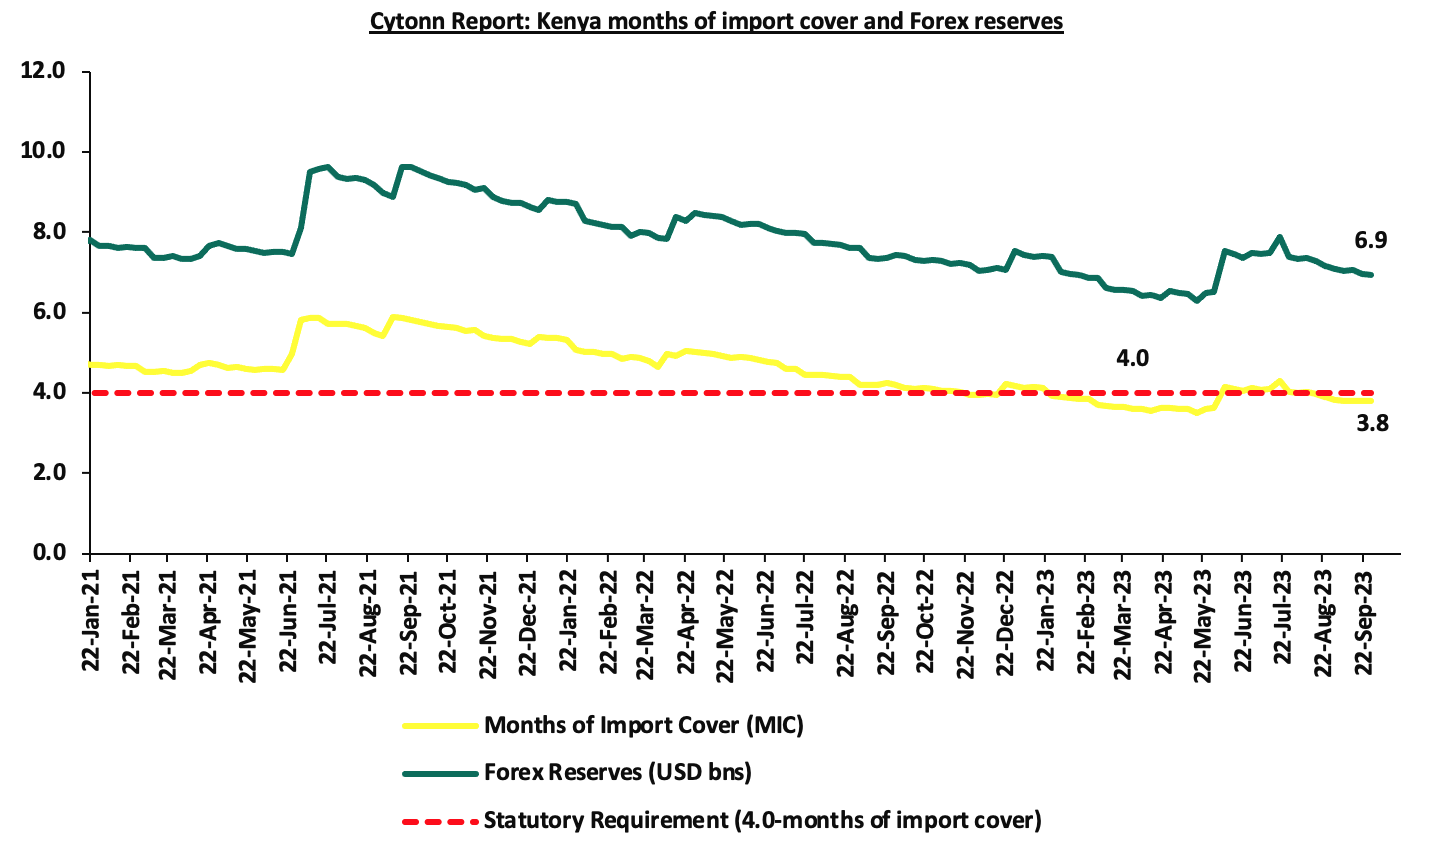
- Dwindling forex reserves currently at USD 6.9 bn (equivalent to 3.8-months of import cover), which is below the statutory requirement of maintaining at least 4.0-months of import cover.
The shilling is however expected to be supported by:
- Diaspora remittances standing at a cumulative USD 2,766.3 mn in 2023 as of August 2023, 3.4% higher than the USD 2,674.5 mn recorded over the same period in 2022, and,
- The tourism inflow receipts which came in at Kshs 268.1 bn in 2022, a significant 82.9% increase from Kshs 146.5 bn inflow receipts recorded in 2021.
The chart below summarizes the evolution of Kenya months of import cover over the years:
Weekly Highlight
- September Inflation 2023
The y/y inflation in September 2023 increased marginally by 0.1% points to 6.8%, from the 6.7% recorded in August 2023. This was in line, but below our projections of an increase to within a range of 7.2% to 7.6%. The headline inflation in September 2023 was majorly driven by increase in prices of commodities in the following categories, food and non-alcoholic beverages; housing, water, electricity, gas and other fuels, and transport. The table below shows a summary of both the year on year and month on month commodity indices performance:
|
Cytonn Report: Major Inflation Changes – 2023 |
|||
|
Broad Commodity Group |
Price change m/m (September-2023/August-2023) |
Price change y/y (September-2022/September-2023) |
Reason |
|
Food and Non-Alcoholic Beverages |
0.7% |
7.9% |
The m/m increase was mainly driven by the increase in prices of commodities such as potatoes, cabbages and Kales (Sukuma-Wiki) of 18.4%, 7.4% and 4.2%, respectively. However, the increase was weighed down by decrease in prices of Maize flour-loose, maize flour-sifted, maize grain-loose, and wheat flour-white by 6.7%, 6.0%, 5.4%, and 3.6%, respectively. |
|
Housing, Water, Electricity, Gas and Other Fuel |
1.4% |
6.3% |
The m/m performance was mainly driven by the increase in prices of 13.0kg gas/LPG by 3.2%. However, there was a decrease in prices of Electricity of 200kWh and 50kWh by 2.1% and 2.5% respectively. |
|
Transport cost |
3.5% |
13.0% |
The m/m increase in transport Index was mainly due to increase in prices of nationwide bus fares on the back of the rise in the prices of petrol and diesel by 8.7% and 11.8%, respectively. |
|
Overall Inflation |
1.0% |
6.8% |
The m/m increase was mainly driven by 3.5% increase in transport costs. |
Notably, the overall headline inflation remained within the Central Bank of Kenya (CBK) target range of 2.5% to 7.5% for the third consecutive month. The increase in headline inflation in September 2023 comes amid the recent rise in fuel prices which increased by 8.7%, 11.8% and 19.4% to Kshs 211.6, Kshs 200.6 and Kshs 202.6, per litre of Super Petrol, Diesel and Kerosene, respectively, for the period between 15th September 2023 to 14th October 2023. The chart below shows the inflation rates for the past 5 years:
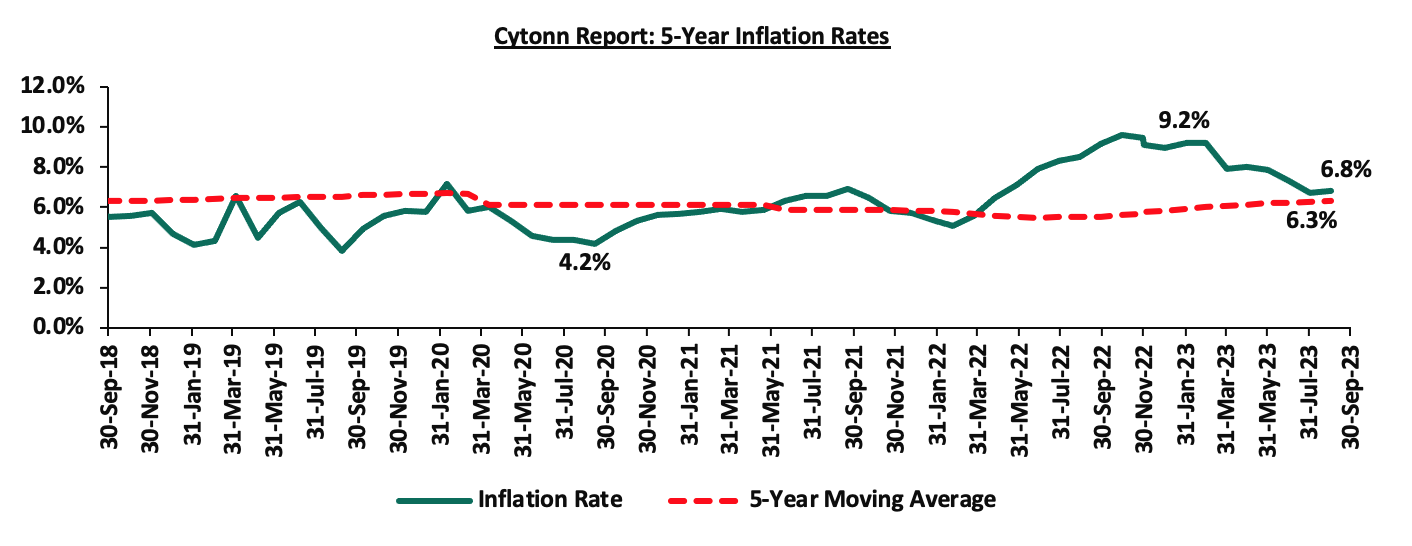
Key to note, the high commodity prices in the country is also attributed to the sustained depreciation of the Kenya Shilling having depreciated by 20.0% against the US dollar on Year-To-Date (YTD) basis resulting to inflated import bills. As a result, manufacturers pass on the cost to consumers through hike in consumer prices. Going forward, we expect inflationary pressures to persist in the short term mainly on the back of the high fuel prices, with fuel being a major input in most businesses, the cost of production is expected to remain elevated. However, we expect the measures taken by the government to subsidize major inputs of agricultural production such as fertilizers to lower the cost of farm inputs and the continuous efforts by the government to stabilize fuel prices will support the easing of inflation in both the short and long term.
Rates in the Fixed Income market have been on an upward trend given the continued high demand for cash by the government and the occasional liquidity tightness in the money market. The government is 2.7% ahead of its prorated net domestic borrowing target of Kshs 68.1 bn, having a net borrowing position of Kshs 69.9 bn of the domestic net borrowing target of Kshs 313.6 bn for the FY’2023/2024. Therefore, we expect a continued upward readjustment of the yield curve in the short and medium term, with the government looking to bridge the fiscal deficit through the domestic market. Owing to this, our view is that investors should be biased towards short-term fixed-income securities to reduce duration risk.
Market Performance:
During the week, the equities market was on a downward trajectory, with NSE 10 declining the most by 1.8%, while NASI, NSE 20 and NSE 25 declined by 1.6%, 0.7% and 1.3% respectively, taking the YTD performance to losses of 25.2%, 9.9%, and 21.2% for NASI, NSE 20, and NSE 25, respectively. The equities market performance was mainly driven by losses recorded by large-cap stocks such as KCB Group, Equity Group, Safaricom of 6.7%, 3.7% and 2.7% respectively. The losses were however mitigated by gains recorded by stocks such as Stanbic Bank, NCBA Group and Standard Chartered Bank-Kenya of 3.8%, 1.6% and 1.2% respectively,
During the week, equities turnover decreased by 60.9% to USD 3.5 mn from USD 8.9 mn recorded the previous week, taking the YTD total turnover to USD 572.7 mn. Foreign investors remained net sellers for the fifth consecutive week with a net selling position of USD 0.5 mn, from a net selling position of USD 3.9 mn recorded the previous week, taking the YTD foreign net selling position to USD 282.1 mn.
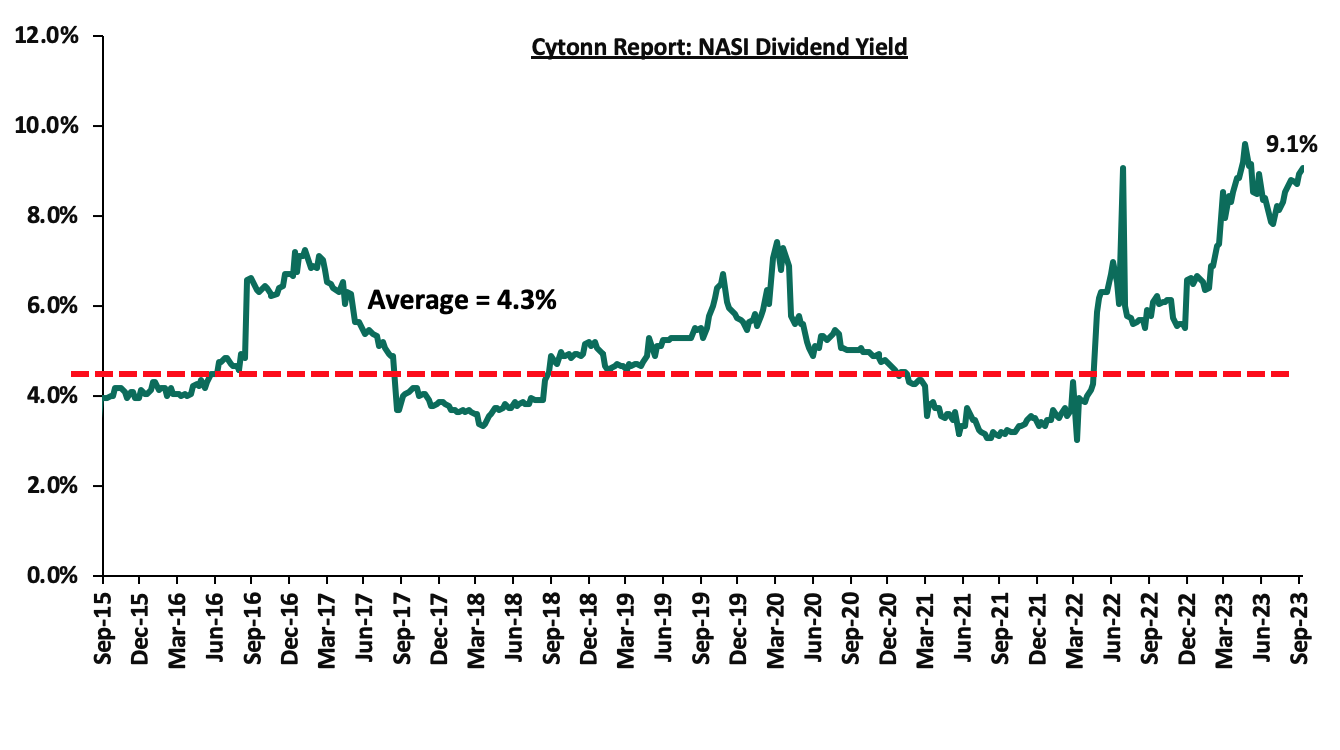
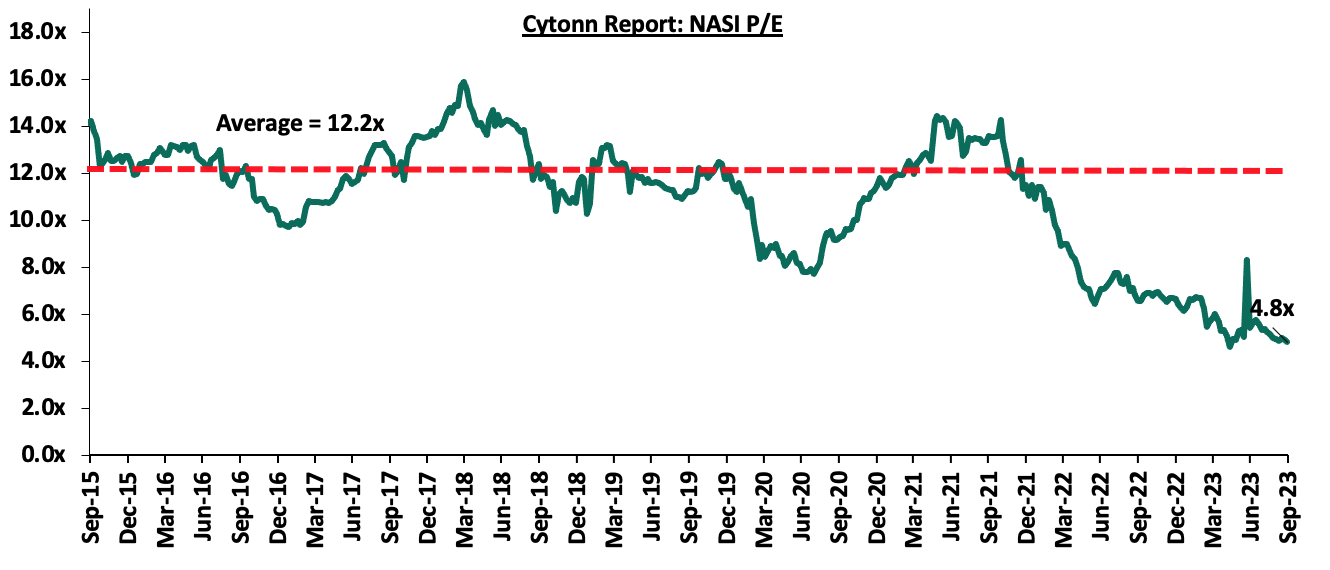
The market is currently trading at a price to earnings ratio (P/E) of 4.8x, 60.7% below the historical average of 12.2x. The dividend yield stands at 9.1%, 4.8% points above the historical average of 4.3%. Key to note, NASI’s PEG ratio currently stands at 0.6x, an indication that the market is undervalued relative to its future growth. A PEG ratio greater than 1.0x indicates the market is overvalued while a PEG ratio less than 1.0x indicates that the market is undervalued. The charts below indicate the historical P/E and dividend yields of the market;
Universe of coverage:
|
Company |
Price as at 22/09/2023 |
Price as at 29/09/2023 |
w/w change |
YTD Change |
Target Price* |
Dividend Yield |
Upside/ Downside** |
P/TBv Multiple |
Recommendation |
|
KCB Group*** |
22.4 |
20.9 |
(6.7%) |
(45.6%) |
41.3 |
9.6% |
107.5% |
0.4x |
Buy |
|
Liberty Holdings |
3.8 |
3.6 |
(4.3%) |
(28.6%) |
5.9 |
0.0% |
64.4% |
0.3x |
Buy |
|
Jubilee Holdings |
180.8 |
185.8 |
2.8% |
(6.5%) |
260.7 |
6.5% |
46.8% |
0.3x |
Buy |
|
Equity Group*** |
36.9 |
35.6 |
(3.7%) |
(21.1%) |
51.2 |
11.3% |
55.2% |
0.8x |
Buy |
|
Kenya Reinsurance |
1.8 |
1.8 |
(3.3%) |
(5.3%) |
2.5 |
11.3% |
53.1% |
0.1x |
Buy |
|
Sanlam |
7.2 |
6.5 |
(8.9%) |
(31.7%) |
10.3 |
0.0% |
57.3% |
1.8x |
Buy |
|
NCBA*** |
37.3 |
37.9 |
1.6% |
(2.8%) |
48.9 |
11.2% |
40.3% |
0.8x |
Buy |
|
Co-op Bank*** |
11.8 |
11.8 |
0.0% |
(2.5%) |
15.0 |
12.7% |
39.4% |
0.6x |
Buy |
|
ABSA Bank*** |
11.9 |
12.0 |
0.8% |
(2.0%) |
14.7 |
11.3% |
34.1% |
1.0x |
Buy |
|
HF Group |
4.5 |
4.4 |
(2.2%) |
38.4% |
5.8 |
0.0% |
33.3% |
0.2x |
Buy |
|
Stanbic Holdings |
111.0 |
115.3 |
3.8% |
13.0% |
127.9 |
10.9% |
21.9% |
0.8x |
Buy |
|
Standard Chartered*** |
163.0 |
165.0 |
1.2% |
13.8% |
183.9 |
13.3% |
24.8% |
1.1x |
Buy |
|
Diamond Trust Bank*** |
48.0 |
48.1 |
0.2% |
(3.5%) |
54.6 |
10.4% |
23.9% |
0.2x |
Buy |
|
I&M Group*** |
17.5 |
17.1 |
(2.6%) |
0.0% |
19.5 |
13.2% |
27.3% |
0.4x |
Buy |
|
CIC Group |
2.1 |
2.1 |
0.5% |
12.0% |
2.5 |
6.1% |
22.9% |
0.7x |
Buy |
|
Britam |
4.9 |
5.0 |
2.9% |
(4.0%) |
6.0 |
0.0% |
19.6% |
0.7x |
Accumulate |
We are “Neutral” on the Equities markets in the short term due to the current tough operating environment and huge foreign investor outflows, and, “Bullish” in the long term due to current cheap valuations and expected global and local economic recovery.
With the market currently being undervalued to its future growth (PEG Ratio at 0.6x), we believe that investors should reposition towards value stocks with strong earnings growth and that are trading at discounts to their intrinsic value. We expect the current high foreign investors sell-offs to continue weighing down the equities outlook in the short term.
- Residential Sector
During the week, the Capital Markets Authority (CMA) granted Linzi Finco Trust the approval to issue an inaugural Shariah compliant bond, ‘Linzi Sukuk’. The bond which is set to raise Kshs 3.0 bn to finance the development of 3,069 institutional grade affordable housing units will offer an internal rate of return of 11.1%. Sukuk bonds are Islamic financial instruments that comply with Shariah compliant principles, structured in a way that complies with Islamic prohibitions on interest (usury), excessive uncertainty (gharar), and investments in certain industries or activities deemed unethical in Islam, such as gambling or alcohol. The issuance of the bond aligns with the government's transformative agenda and commitment to addressing the 80.0% national housing deficit by increasing the availability of affordable housing through the provision of accessible financing.
We expect the bond will; i) attract the attention of both local and global investors seeking ethical and socially responsible investment opportunities, ii) set precedence for the introduction of more inventive financial instruments in the nation's capital markets, and, iii) promote an inclusive and diverse capital market that accommodates a wider range of investors and their preferences.
- Regulated Real Estate Funds
- Real Estate Investment Trusts (REITs)
In the Nairobi Securities Exchange, ILAM Fahari I-REIT closed the week trading at an average price of Kshs 7.4 per share. The performance represented a 3.6% growth from Kshs 7.1 per share recorded the previous week, taking it to a 9.1% Year-to-Date (YTD) growth from Kshs 6.8 per share recorded on 3 January 2023. However, the performance represented a 63.0% Inception-to-Date (ITD) loss from the Kshs 20.0 price. The dividend yield currently stands at 8.8%. The graph below shows Fahari I-REIT’s performance from November 2015 to 22 September 2023;
On the Unquoted Securities Platform, Acorn D-REIT and I-REIT traded at Kshs 25.3 and Kshs 21.7 per unit, respectively, as at 29 September 2023. The performance represented a 26.6% and 8.2% gain for the D-REIT and I-REIT, respectively, from the Kshs 20.0 inception price. The volumes traded for the D-REIT and I-REIT came in at 12.3 mn and 30.6 mn shares, respectively, with a turnover of Kshs 257.5 mn and Kshs 632.1 mn, respectively, since inception in February 2021.
REITs provide various benefits like tax exemptions, diversified portfolios, and stable long-term profits. However the continuous deterioration in performance of the Kenyan REITs and restructuring of their business portfolio hampering major investment they had previously made are on top of other general challenges such as; i) inadequate comprehension of the investment instrument among investors, ii) prolonged approval processes for REITs creation, iii) high minimum capital requirements of Kshs 100.0 mn for trustees, and, iv) minimum investment amounts set at Kshs 5.0 mn, continue to limit the performance of the Kenyan REITs market.
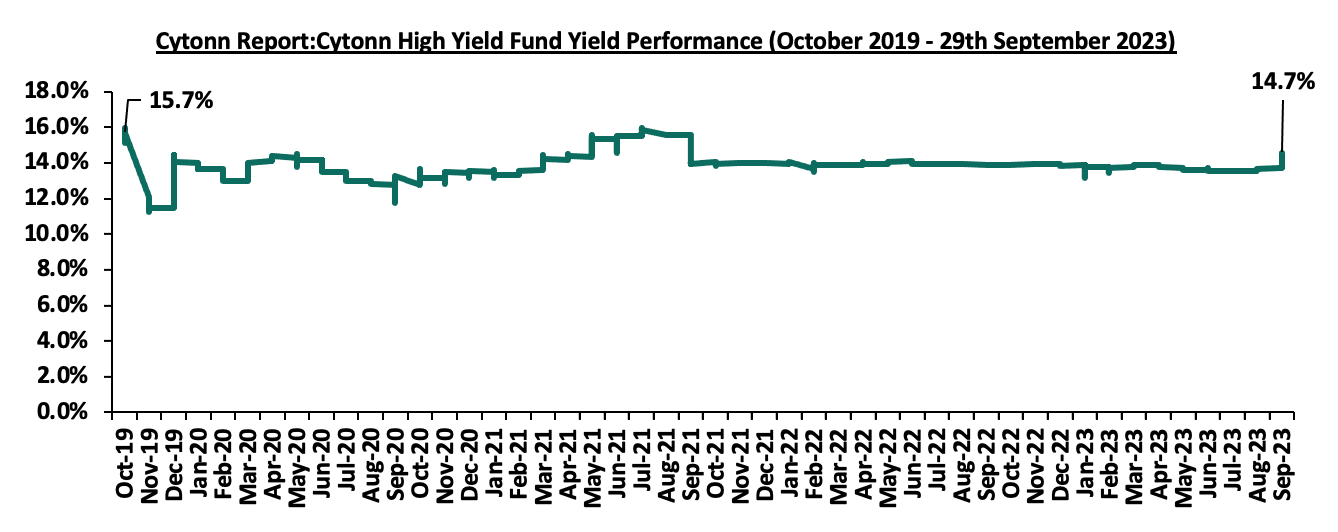
- Cytonn High Yield Fund (CHYF)
Cytonn High Yield Fund (CHYF) closed the week with an annualized yield of 14.7%. The performance represented a 0.7% points increase from 14.0% recorded the previous week, taking it to a 0.8% points Year-to-Date (YTD) growth from 13.9% yield recorded on 1 January 2023. However, the performance represented a 1.0% points Inception-to-Date (ITD) decline from the 15.7% yield. The graph below shows Cytonn High Yield Fund’s performance from October 2019 to 29 September 2023;
Notably, the CHYF has outperformed other regulated Real Estate funds with an annualized yield of 14.0%, as compared to Fahari I-REIT, and Acorn I-REIT with yields of 9.1% and 2.8% respectively. As such, the higher yields offered by CHYF makes the fund one of the best alternative investment resource in the Real Estate sector. The graph below shows the yield performance of the Regulated Real Estate Funds:
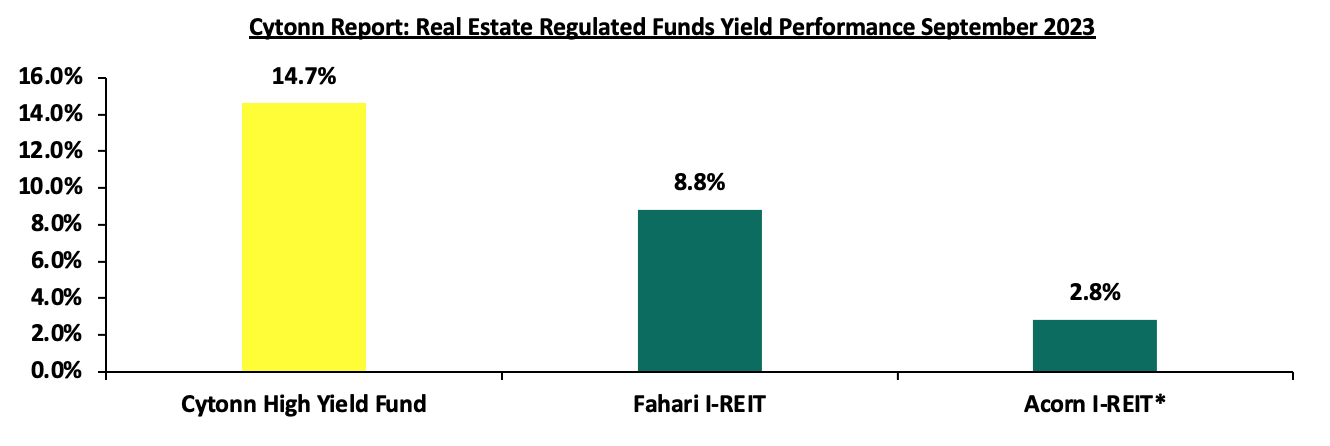
* H1’2023
Source: Cytonn Research
We expect the performance of Kenya’s Real Estate industry to remain on an upward trajectory, supported by factors such as; i) positive demographic trends boosting housing demand thereby leading to increased construction activities, ii) the government’s ongoing emphasis on affordable housing, and, iii) the growing availability of diverse and innovative financing options in the housing sector. However, the sector's optimal performance is expected to be subdued by rising construction costs due to inflationary pressures, an oversupply of physical space in the commercial office and retail segments resulting in slower uptake of new spaces, and limited investor knowledge in REITs coupled with high minimum investment amounts that are stymying the asset class.
Unit Trust Funds (UTFs) are Collective Investment Schemes that pool funds from multiple investors and are managed by professional fund managers. The fund managers invest the pooled funds in a diversified portfolio of securities such as equities, bonds or any authorized financial securities, with the aim of generating returns to meet the specific objectives of the fund. Following the release of the Capital Markets Authority (CMA) Quarterly CIS Report - Q2’2023, we analyze the performance of Unit Trust Funds for the period ending 30th June 2023, whose total Assets Under Management (AUM) have been steadily increasing, and are among the most popular investment options in the Kenyan market. We will further analyze the performance of Money Market Funds, a product under Unit Trust Funds.
In our previous focus on Unit Trust Funds, we looked at the Unit Trust Funds Performance - Q1'2023 by Fund Managers, where we highlighted that their AUM stood at Kshs 164.3 bn, a 2.0% increase from Kshs 161.0 bn recorded in FY’2022. In this topical, we delve on the Q2’2023 performance of Unit Trust Funds where we shall analyze the following:
- Performance of the Unit Trust Funds Industry,
- Performance of Money Market Funds,
- Comparing Unit Trust Funds AUM Growth with other Markets, and,
- Recommendations.
Section I: Performance of the Unit Trust Funds Industry
Unit Trust Funds are Investment schemes that pool funds from investors and are managed by professional Fund Managers. The fund manager invests the pooled funds with the aim of generating returns in line with the specific objectives of the fund. The Unit Trust Funds earn returns in the form of dividends, interest income, rent and/or capital gains depending on the underlying security. The main types of Unit Trust Funds include:
- Money Market Funds – These are a type of mutual fund that invests in short-term, low-risk debt instruments, such as such as fixed deposits, treasury bills and bonds, commercial papers, etc. They are very liquid, have stable returns, and, they are suitable for risk averse investors,
- Equity Funds – These are funds which largely invest in listed securities and seek to offer superior returns over the medium to long-term by maximizing capital gains and dividend income. The funds invest in various sectors to reduce concentration risk and maintain some portion of the fund’s cash in liquid fixed income investments to maintain liquidity and pay investors if need be without losing value,
- Balanced Funds – These are funds whose investments are diversified across the Equities and the Fixed Income market. Balanced Funds offer investors long-term growth as well as reasonable levels of stability of income,
- Fixed Income Funds – These are funds which invest in interest-bearing securities, which include treasury bills, treasury bonds, preference shares, corporate bonds, loan stock, approved securities, notes and liquid assets consistent with the portfolio’s investment objective, and,
- Sector Specific Funds – These are funds that invest primarily in a particular sector or industry. The funds provide a greater measure of diversification within a given sector than may be otherwise possible for the other funds. They are specifically approved by the Capital Markets Authority as they are not invested as per the set rules and regulations.
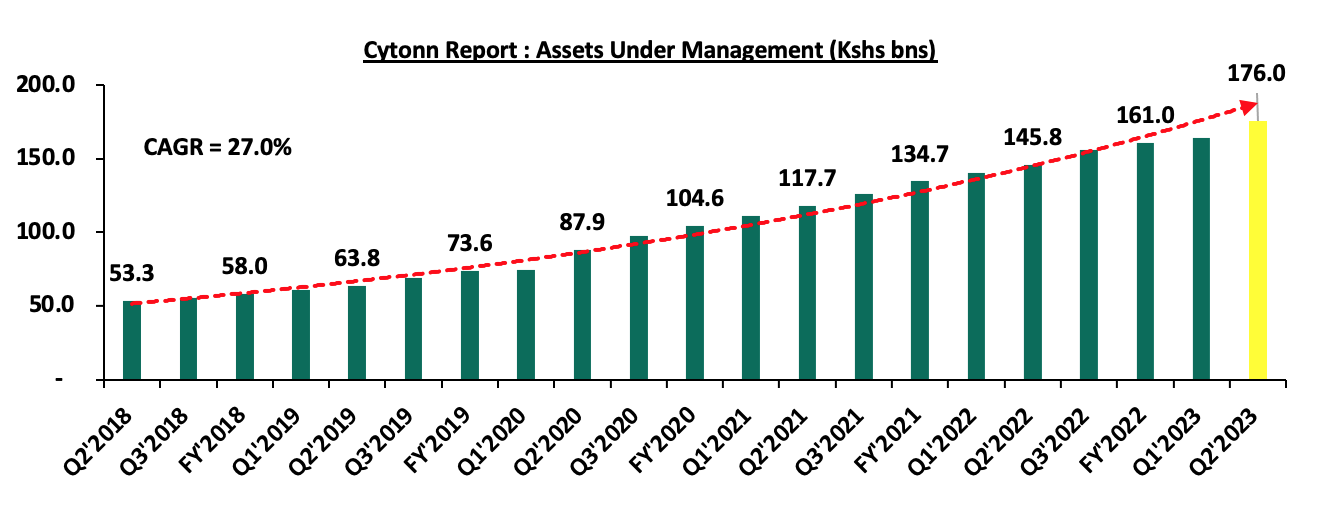
As per the Capital Markets Authority (CMA) Quarterly CIS Report - Q2’2023, the industry’s overall Assets under Management (AUM) registered a significant growth of 7.1% on a quarter on quarter basis to Kshs 176.0 bn as at the end of Q2’2023, from Kshs 164.3 bn recorded in Q1’2023. On a y/y basis, the total AUM increased by 20.7% to Kshs 176.0 bn, from Kshs 145.8 bn as at the end of Q2’2022. Key to note, Assets under Management of the Unit Trust Funds have registered an upward trajectory over the last five years, growing at a 5-year CAGR of 27.0% to Kshs 176.0 bn in Q2’2023, from Kshs 53.3 bn recorded in Q2’2018. The chart below shows the growth in Unit Trust Funds’ AUM:
Source: Capital Markets Authority Quarterly CIS Report
The growth is largely attributed to:
- Low Investments minimums: Majority of the Unit Trust Funds Collective Investment Schemes’ (CIS) in the market require a relatively low initial investment ranging between Kshs 100.0 - Kshs 10,000.0, thereby promoting financial inclusion by allowing even small-scale investors to access professionally managed investments opportunities
- Increased Investor Knowledge: There has been a drive towards investor education mainly by the Capital Markets Authority (CMA) and the fund managers on the various products offered by trust funds, which has meant that more people are aware and have a deeper understanding of the investment subject. As a result, their confidence has been boosted leading to increased uptake,
- Diversified product offering: Unit Trust Funds are also advantageous in terms of providing investors with access to a wider range of investment securities through pooling of funds. This allows investors the opportunity of diversifying their portfolios which would have not been accessible if they invested on their own. Additionally, they also ensure investors are able to shield themselves against the risks associated with market volatility associated with some asset classes,
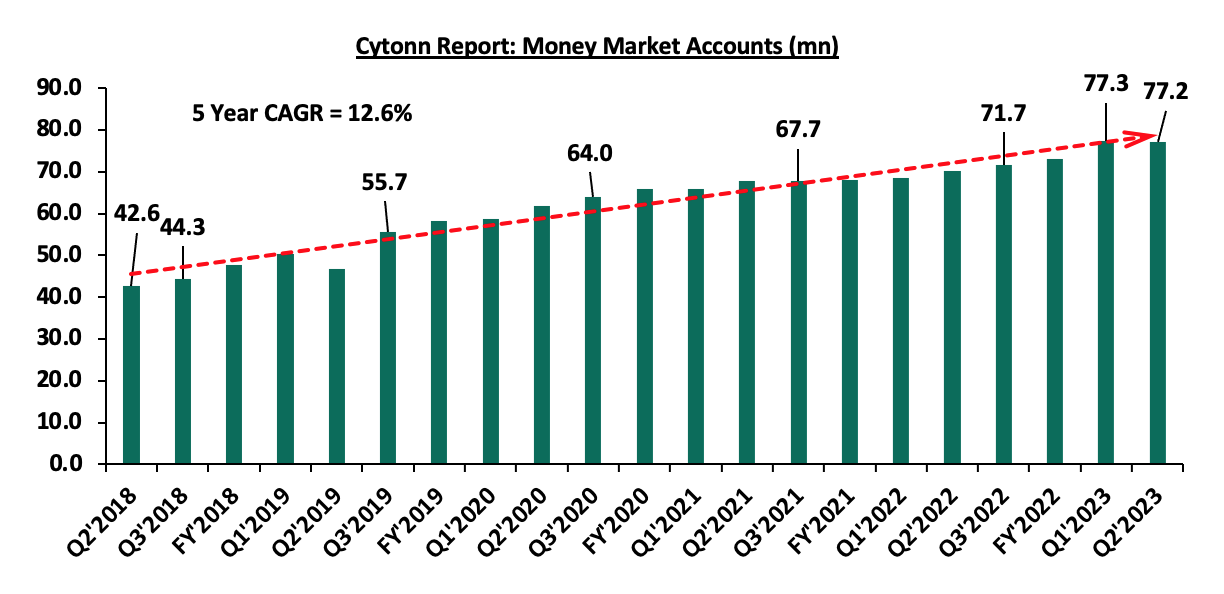
- Adoption of Fintech: Digitization and automation within the industry has enhanced ease in cash accessibility, enabling investors to immediately access their investments via mobile payment platforms. According to the Central Bank of Kenya, more individuals are transacting through mobile money services as evidenced by the increase in the total number of registered mobile money accounts to 77.2 mn in July 2023, up from 42.6 mn recorded in July 2018, translating to a 5-year CAGR of 12.6%. The graph below shows the growth in the number of money market accounts in the period Q2’2018 to Q2’2023;
Source: Central Bank of Kenya
Additionally, investors can easily track their investments based on principal invested as well as interest earned during various periods and the charges incurred via mobile apps, and,
- Competitive returns: Positive performance and competitive returns have been instrumental in attracting investors to unit trust funds. As these funds consistently outperform certain traditional investment options, more investors are drawn to their potential for generating wealth over the long term.
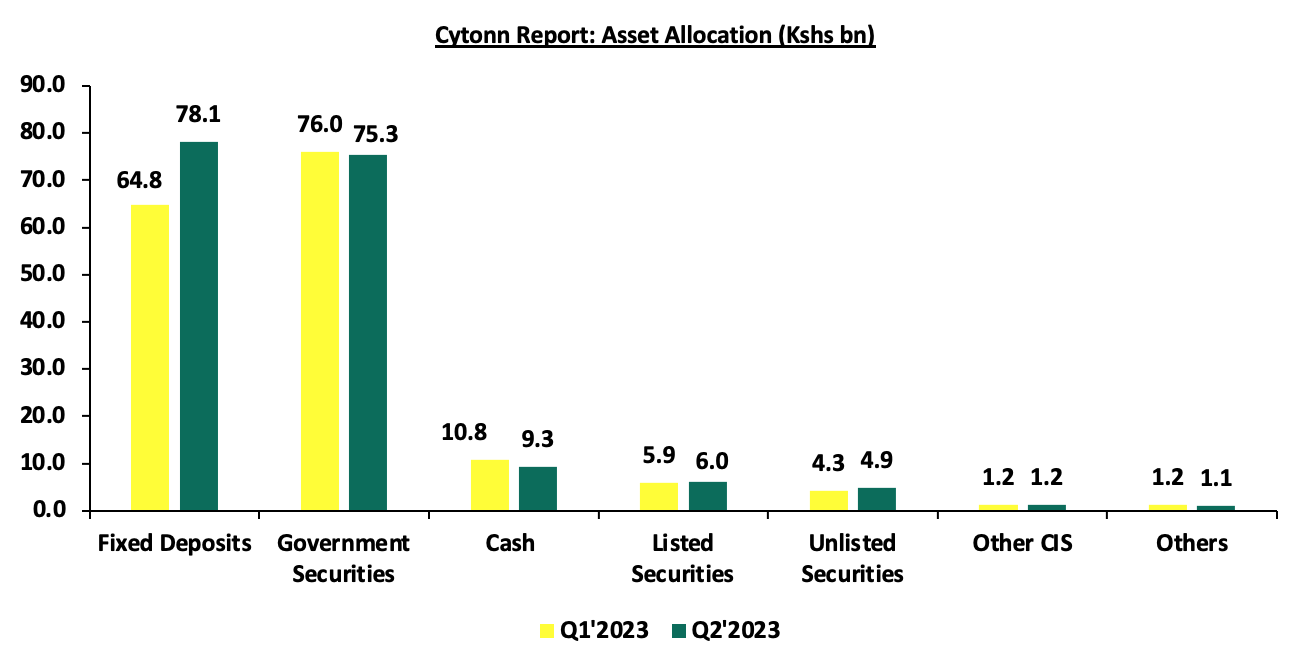
Further, the overall UTFs portfolio is heavily invested in fixed deposits, registering a 20.5% increase to Kshs 78.1 bn, from Kshs 64.8 bn in Q1’2023. As such, the allocation to fixed deposits increased by 4.9% points to 44.4% of the total assets, from the 39.5% recorded in Q1’2023. This was followed by Government securities, at 42.8% allocation from 46.2% in Q1’2023. The graph below represents asset allocations in different asset classes comparing Q1’2023 to Q2’2023 in the UTF industry;
Comparably, the Pensions industry has continued to offer long-term wealth accumulation options for investors in the country, with the total AUM registering a 1.9% growth in FY’2022, to hit Kshs 1.6 tn, from Kshs 1.5 tn in FY’2021. The Pensions Industry has continued to invest heavily in government securities, accounting for 45.8% of the total AUM in FY’2022, from 45.7% in FY’2021. This was followed by guaranteed funds and immovable assets, accounting for 18.9% and 15.8%, respectively. The chart below represents asset allocations in different asset classes comparing FY’2021 to FY’2022 in the Pensions Industry:
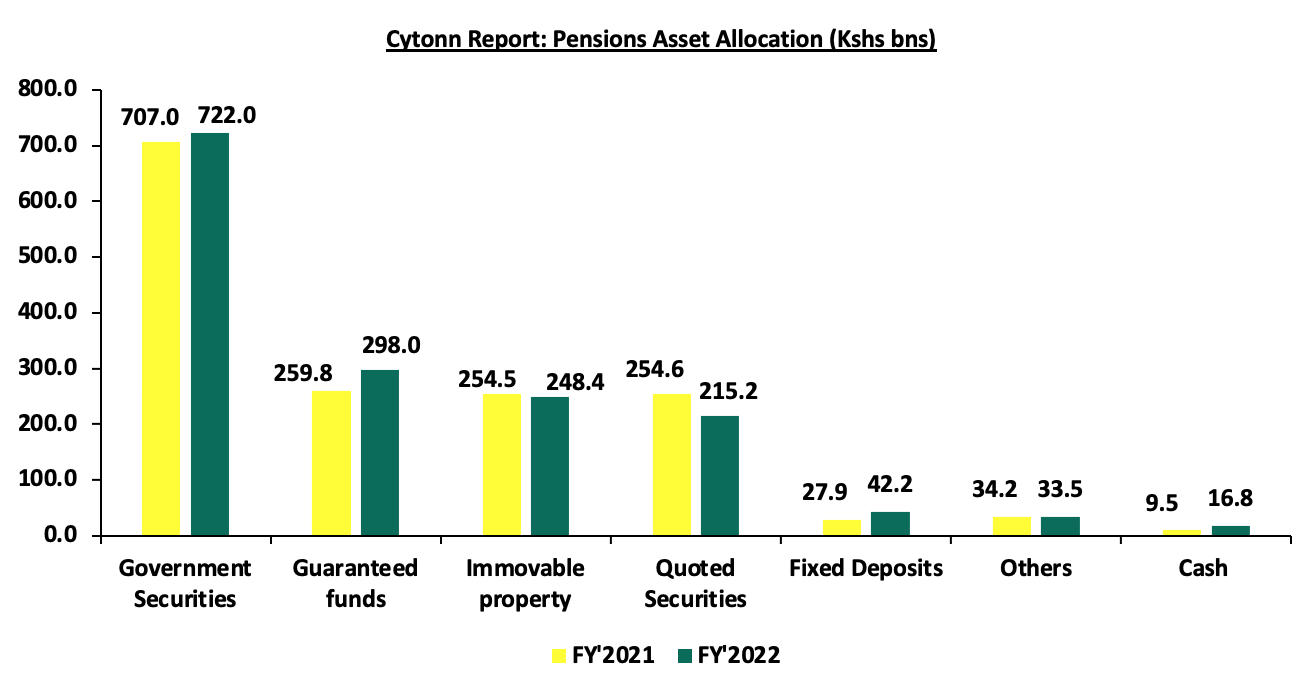
Notably, the Fixed deposits in the Pensions Industry only accounted for 2.7% of the total AUM, compared to 44.4% recorded in the UTF industry. This is partly attributable to the more long-term nature of the industry compared to UTF industry, with investors investing their money for decades. As such, fund managers prefer the long-term government securities offering higher yields compared to the fixed deposits, while still maintaining stability and returns predictability through guaranteed funds.
According to the Capital Markets Authority, as at the end of Q2’2023, there were 36 Collective Investment Schemes (CISs) in Kenya, up from 34 recorded at the end of FY’2022 and 31 recorded at the end of Q2’2022. Out of the 36 schemes, 27 of them (equivalent to 75.0%) were active while 9 (25.0%) were inactive. The table below outlines the performance of the Collective Investment Schemes comparing Q1’2023 and Q2’2023:
|
|
Cytonn Report: Assets Under Management (AUM) for the Approved Collective Investment Schemes |
|||||
|
No. |
Collective Investment Schemes |
Q1’2023 AUM |
Q1’2023 |
Q2'2023 AUM |
Q2’2023 |
AUM Growth |
|
(Kshs mn) |
Market Share |
(Kshs mn) |
Market Share |
Q1’2023 –Q2'2023 |
||
|
1 |
CIC Unit Trust Scheme |
56,970.2 |
34.7% |
59,588.7 |
33.9% |
4.6% |
|
2 |
NCBA Unit Trust Scheme |
27,739.7 |
16.9% |
30,662.3 |
17.4% |
10.5% |
|
3 |
Sanlam Unit Trust Scheme |
16,915.2 |
10.3% |
18,177.0 |
10.3% |
7.5% |
|
4 |
ICEA Unit Trust Scheme |
14,558.6 |
8.9% |
15,538.1 |
8.8% |
6.7% |
|
5 |
British American Unit Trust Scheme |
13,201.8 |
8.0% |
13,684.7 |
7.8% |
3.7% |
|
6 |
Old Mutual Unit Trust Scheme |
8,035.6 |
4.9% |
8,595.8 |
4.9% |
7.0% |
|
7 |
Madison Asset Managers |
3,565.4 |
2.2% |
4,645.8 |
2.6% |
30.3% |
|
8 |
Co-op Unit Trust Scheme |
4,011.4 |
2.4% |
4,525.6 |
2.6% |
12.8% |
|
9 |
Dry Associates Unit Trust Scheme |
4,497.9 |
2.7% |
4,478.6 |
2.5% |
(0.4%) |
|
10 |
Nabo Capital Limited |
3,943.2 |
2.4% |
4,028.2 |
2.3% |
2.2% |
|
11 |
ABSA Unit Trust Scheme |
2,869.6 |
1.7% |
3,054.8 |
1.7% |
6.5% |
|
12 |
Zimele Asset Managers |
2,692.9 |
1.6% |
2,835.8 |
1.6% |
5.3% |
|
13 |
African Alliance Kenya |
1,595.8 |
1.0% |
1,295.3 |
0.7% |
(18.8%) |
|
14 |
Mali Money Market Fund |
877.4 |
0.5% |
1,128.0 |
0.6% |
28.6% |
|
15 |
Apollo Asset Managers |
862.0 |
0.5% |
952.6 |
0.5% |
10.5% |
|
16 |
Cytonn Asset Managers |
701.4 |
0.4% |
705.1 |
0.4% |
0.5% |
|
17 |
Genghis Unit Trust Fund |
620.0 |
0.4% |
669.8 |
0.4% |
8.0% |
|
18 |
Jubilee Unit Trust Scheme |
0.0 |
0.0% |
359.8 |
0.2% |
|
|
18 |
KCB Asset Managers |
56.3 |
0.0% |
344.5 |
0.2% |
511.6% |
|
20 |
Orient Collective Investment Scheme |
252.2 |
0.2% |
259.8 |
0.1% |
3.0% |
|
21 |
Equity Investment Bank |
185.7 |
0.1% |
174.6 |
0.1% |
(6.0%) |
|
22 |
Kuza Asset Managers |
72.1 |
0.0% |
111.1 |
0.1% |
54.1% |
|
23 |
GenAfrica Unit Trust Scheme |
19.2 |
0.0% |
62.9 |
0.0% |
229.8% |
|
24 |
Etica Capital Limited |
5.3 |
0.0% |
54.2 |
0.0% |
921.1% |
|
25 |
Amana Capital |
26.5 |
0.0% |
26.6 |
0.0% |
0.4% |
|
26 |
Enwealth Capital Unit Trust |
0.0 |
0.0% |
25.5 |
0.0% |
|
|
27 |
Wanafunzi Investments |
0.72 |
0.0% |
0.7 |
0.0% |
3.1% |
|
28 |
Genghis Specialized Funds |
- |
- |
- |
- |
|
|
29 |
Standard Investments Bank |
- |
- |
- |
- |
|
|
30 |
Diaspora Unit Trust Scheme |
- |
- |
- |
- |
|
|
31 |
Dyer and Blair Unit Trust Scheme |
- |
- |
- |
- |
|
|
32 |
Jaza Unit Trust Fund |
- |
- |
- |
- |
|
|
33 |
Masaru Unit Trust Fund |
- |
- |
- |
- |
|
|
34 |
Adam Unit Trust Fund |
- |
- |
- |
- |
|
|
35 |
First Ethical Opportunities Fund |
|
|
- |
- |
|
|
36 |
Amaka Unit Trust (Umbrella) Scheme |
|
|
- |
- |
|
|
|
Total |
164,276.0 |
100.0% |
175,985.7 |
100.0% |
7.1% |
Source: Capital Markets Authority: Quarterly Collective Investment Schemes, Q2’2023
Key take outs from the above table include:
- Assets Under Management: CIC Unit Trust Scheme remained the largest overall Unit Trust Fund, recording an AUM growth of 4.6%, to Kshs 59.6 bn in Q2’2023, from the AUM of Kshs 57.0 bn recorded in Q1’2023,
- Growth: In terms of AUM growth, Etica Capital Limited recorded the highest growth of 921.1% with its AUM increasing to Kshs 54.2 mn, from Kshs 5.3 mn in Q1’2023, due to the low base effect. On the other hand, African Alliance Kenya recorded the largest decline with its AUM declining by 18.8% to Kshs 1.3 bn in Q2’2023, from Kshs 1.6 bn in Q1’2023,
- Market Share: CIC Unit Trust Scheme remained the largest overall Unit Trust with a market share of 33.9%, a 0.8% points decline from 34.7% recorded in Q1’2023. The continued decline in market share is an indication of increasing competition as new collective schemes enter the market,
- New Collective Investment Schemes: Jubilee Unit Trust Scheme and Enwealth Capital Unit Trust, with AUMs of Kshs 359.8 mn, and Kshs 25.5 mn respectively, became active collective investment schemes in the capital market during Q2’2023, taking the total number of active collective schemes to 27, and,
- 9 UTFs remained inactive as at the end of Q2’2023: First Ethical Opportunities Fund, Adam Unit Trust Fund, Masaru Unit Trust Fund, Jaza Unit Trust Fund, Dyer and Blair Unit Trust Scheme, Diaspora Unit Trust Scheme, Standard Investments Bank, Genghis Specialized Fund and Amaka Unit Trust remained inactive as at the end of Q2’2023.
Section II: Performance of Money Market Funds
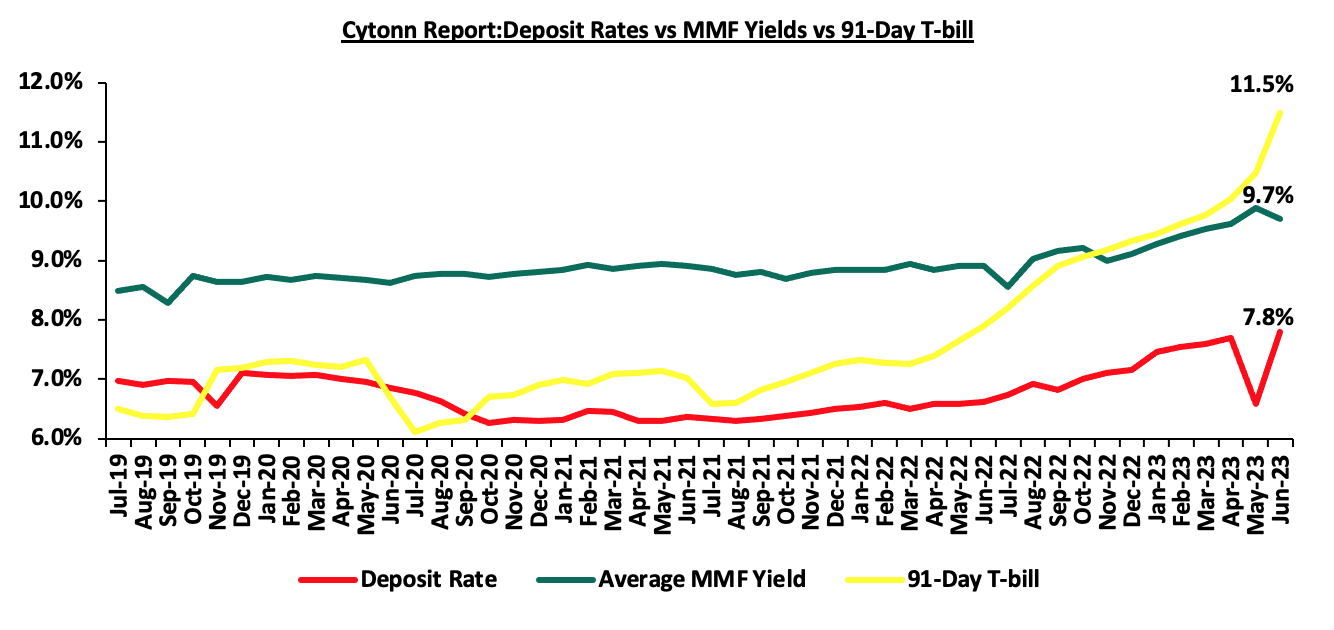
Money Market Funds (MMFs) have continued to gain popularity in Kenya, largely due to the higher returns they offer in comparison to bank deposits. According to the Central Bank of Kenya data, the average deposit rate in June 2023 increased to 7.8% from 7.6% recorded in March 2023, albeit lower than average yields of 91-day T-bill and Money Market Funds at 11.5% and 9.7% respectively. The graph below shows the performance of the Money Market Fund to other short-term financial instruments:
Source: Central Bank of Kenya, Cytonn Research
As per the regulations, funds in MMFs should be invested in short-term liquid interest-bearing securities with a weighted tenor to maturity of 13 months or less. The short-term securities include treasury bills, call deposits, commercial papers and fixed deposits in commercial banks and deposit taking institutions, among others as specified by CBK. As a result, the Money Market Funds are best suited for investors who require a low-risk investment that offers capital stability, liquidity, but with a high-income yield. The funds are also a good safe haven for investors who wish to switch from a higher risk portfolio to a low risk portfolio, especially during times of uncertainty.
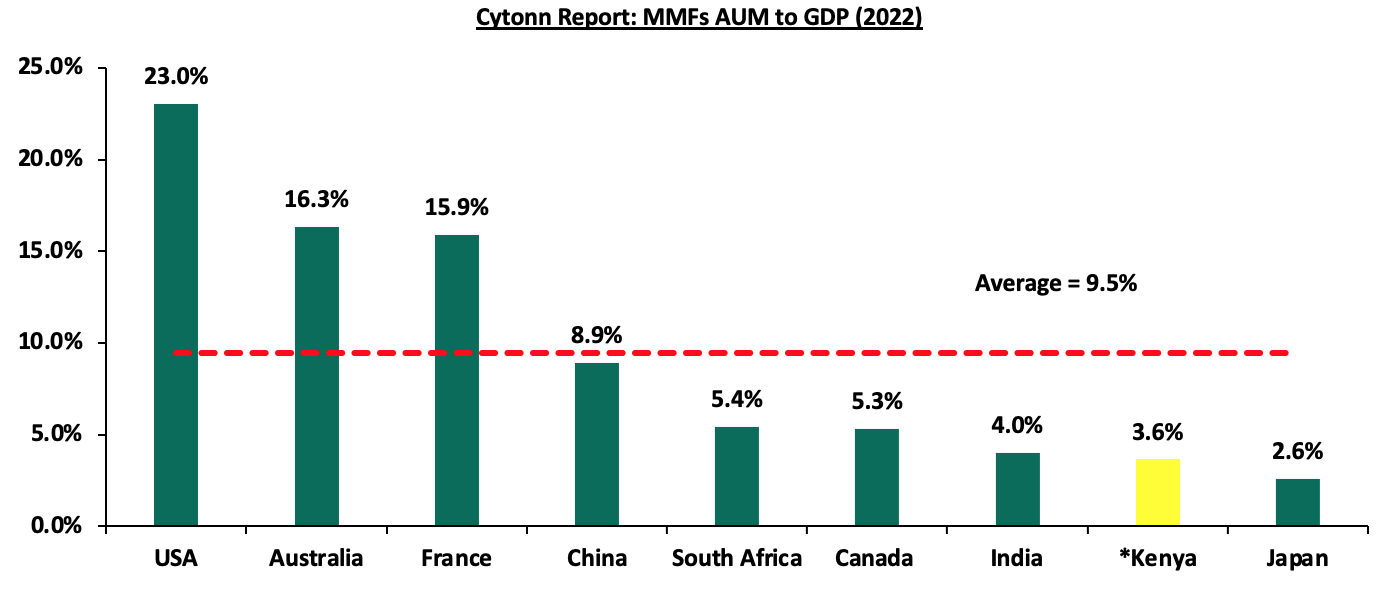
Money Market funds as an asset class are still below the potential, with global average MMF assets at 9.5% to GDP as of FY’2022, which in kenya is 3.6% to GDP as at Q2’2023. More needs to be done to increase the ratio especially at a time when the government is trying to increase savings to GDP ratio. However, the 3.6% Money market AUM to GDP in Kenya is an increase from 1.0% which was recorded in 2021. This can be attributed to the continued higher yields in Money markets compared to other traditional investment options. The chart below shows the performance of the Money Market Funds AUM to GDP comparing Kenya to other economies:
Source: World Bank, CMA, EFAMA
*Kenya Data as of Q2’2023
Top Five Money Market Funds by Yields
During the period under review, the Cytonn Money Market Fund registered the highest effective annual yield at 11.1% against the industry Q2’2023 average of 9.8%. Below is a table of the top five Money Market Funds with the highest average effective annual yield declared in Q2’2023;
|
Cytonn Report: Top 5 Money Market Fund Yield in Q2’2023 |
||
|
Rank |
Money Market Fund |
Effective Annual Rate (Average Q2'2023) |
|
1 |
Cytonn Money Market Fund |
11.1% |
|
2 |
Etica Money Market Fund |
11.0% |
|
3 |
Madison Money Market Fund |
10.5% |
|
4 |
Apollo Money Market Fund |
10.5% |
|
5 |
Dry Associates Money Market Fund |
10.5% |
|
|
Average of Top 5 Money Market Funds |
10.7% |
|
Industry average |
9.8% |
|
Source: Cytonn Research
Section IV: Comparison between Unit Trust Funds AUM Growth and other Markets
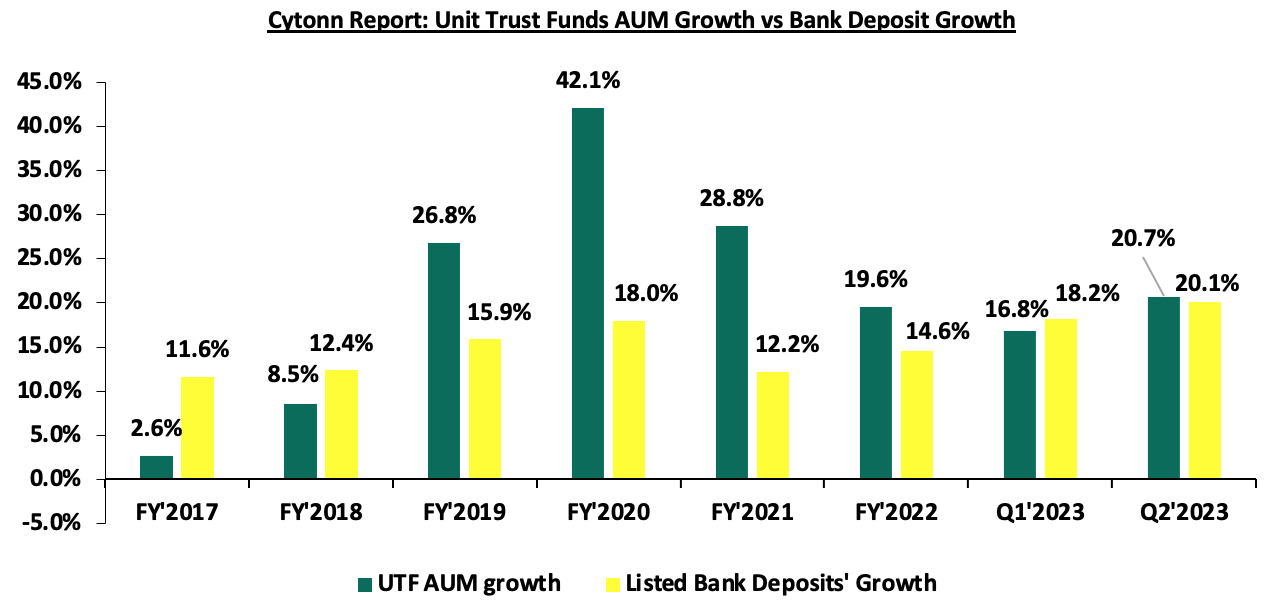
Unit Trust Funds’ assets recorded a y/y growth of 20.7% in Q2’2023, slightly higher than 20.1% cumulative deposits growth for the listed banks recorded over the same period. For the Unit Trust Funds, the growth of 20.7% was an increase of 3.9% points, compared to 16.8% y/y growth recorded in Q1’2023. On the other hand, listed banks deposits recorded a growth of 20.1%, a 1.9% points increase from the 18.2% growth recorded in Q1’2023. The chart below highlights the year on year AUM growths for Unit Trust Funds AUM vs Listed banks deposits growth since 2017;
Source: Cytonn Research
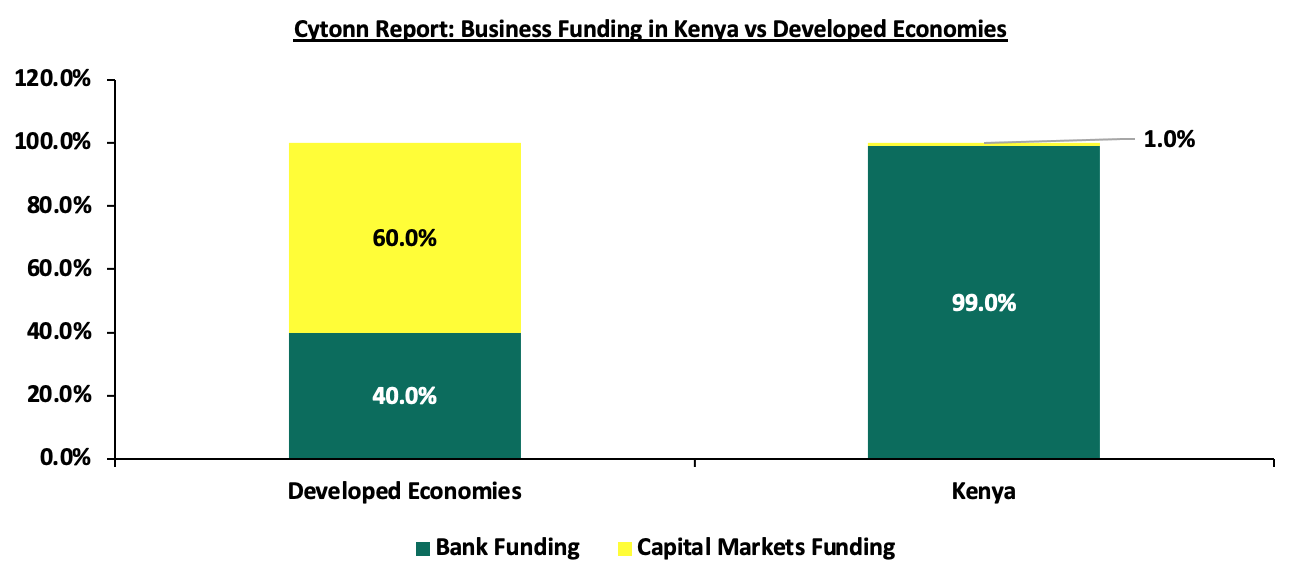
We note that there was a 3.9% points q/q increase in UTF growth compared to listed bank deposits growth of 1.9% points during the same period, which can be attributed to the relatively higher returns in the collective investment schemes, especially the MMFs, which have continued to gain traction among investors. We therefore predict an expansion in business funding coming from capital markets from the current 1.0%, in the short-term to medium term. According to World Bank data, in well-functioning economies, businesses rely on bank funding for a mere 40.0%, with the larger percentage of 60.0% coming from the Capital markets. Closer home, the World Bank noted that businesses in Kenya relied on banks for 99.0% of their funding while less than 1.0% come from the capital markets.
Source: World Bank
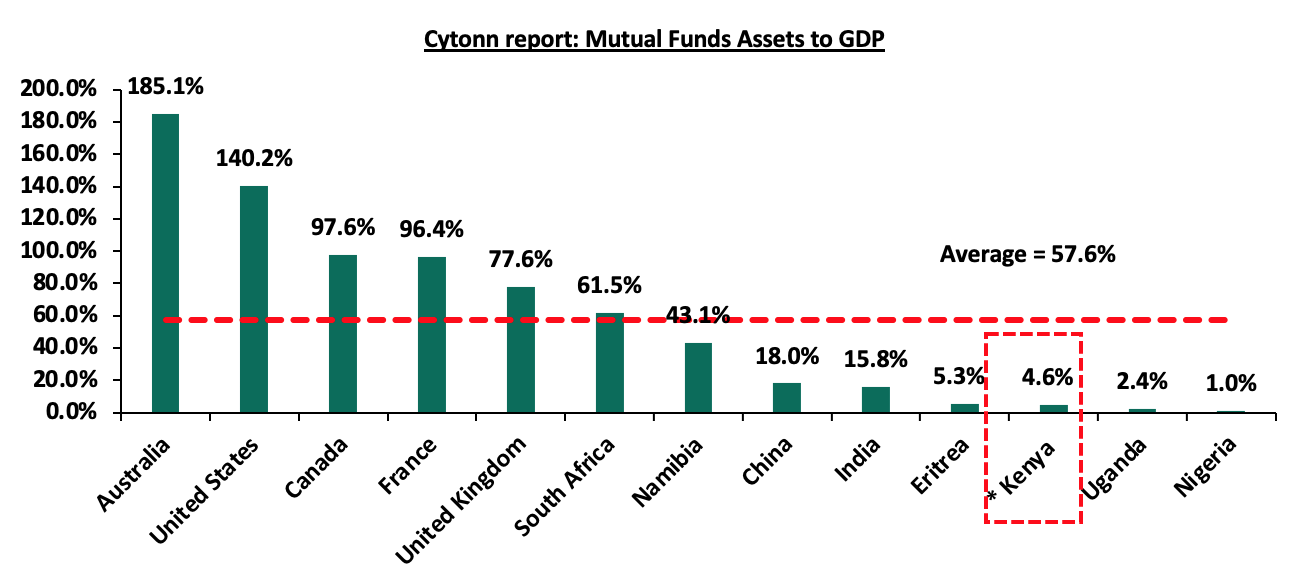
Notably, Kenya’s Mutual Funds/UTFs to GDP ratio at the end of Q2’2023 came in at 4.6%, significantly lower compared to an average of 57.6% amongst select global markets an indication of a need to continue enhancing our capital markets. Additionally, Sub-Saharan African countries such as South Africa and Namibia have higher mutual funds to GDP ratios of 61.5% and 43.1%, respectively as at end of 2020, compared to Kenya. The chart below shows select countries’ mutual funds as a percentage of GDP:
*Data as of June 2023
Source: World Bank Data
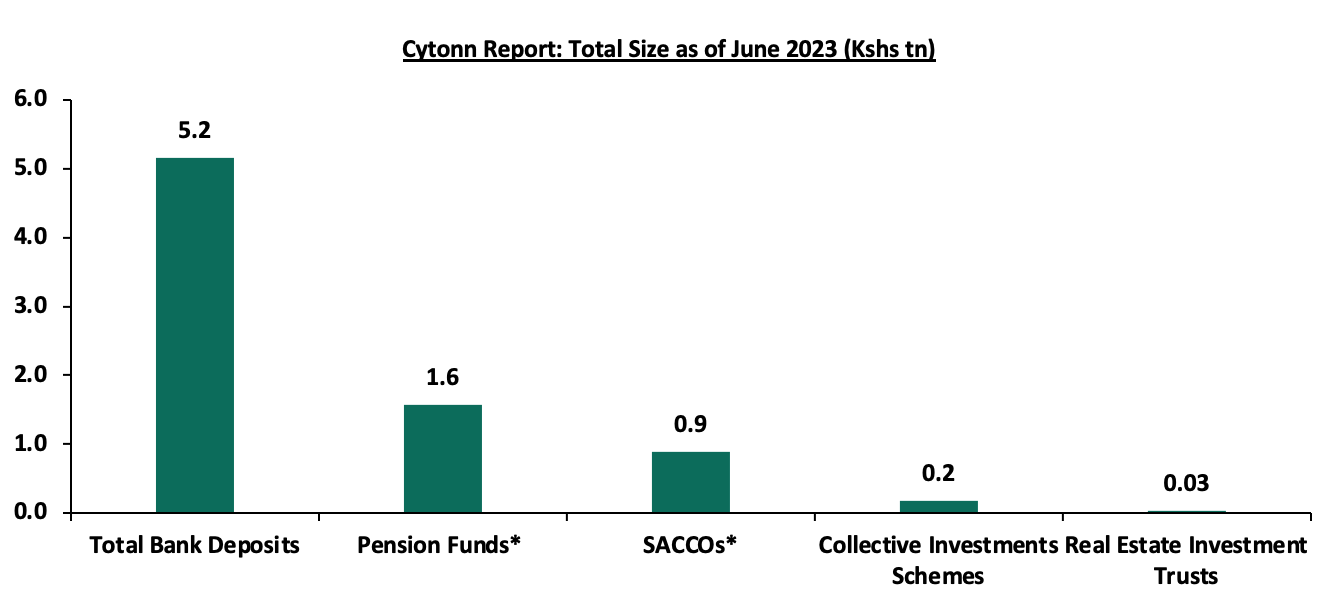
Over the past 5 years, Unit Trust Funds (UTFs) AUM has exhibited positive performance, having grown at a 5-year CAGR of 27.0% to Kshs 176.0 bn in Q2’2023, from Kshs 53.3 bn recorded in Q2’2018. However, the industry is still dwarfed when compared to other deposit taking institutions such as bank deposits, with the entire banking sector deposits coming in at Kshs 5.2 tn as at June 2023 from Kshs 4.8 tn recorded in March 2023. Similarly, the pension industry recorded an increase of 1.9%, to Kshs 1.6 tn as of December 2022 from Kshs 1.5 tn recorded in December 2021. Below is a graph showing the sizes of different saving channels and capital market products in Kenya;
*Data as of December 2022
Source: CMA, RBA, CBK, SASRA Annual Reports and REITs Financial Statements
Comparing other Capital Markets products like REITS, Kenya has made strides in the sector, however, there is still a lot of room for improvement. The REITs’ numbers remain low, with the only 4 registered REITS, out of which, only the ILAM Fahari I-REIT is openly trading on the NSE main investment market. The table below show the authorized REITs in the country:
|
Cytonn Report: Authorized REITs in Kenya |
||||||
|
No |
Issuer |
Name |
Type of REIT |
Listing Date |
Market Segment |
Status |
|
1 |
ICEA Lion Asset Management (ILAM) |
Fahari |
I-REIT |
October 2015 |
Main Investment Segment |
Trading |
|
2 |
Acorn Holdings Limited |
Acorn Student Accommodation (ASA) – Acorn ASA |
I-REIT |
February 2021 |
Unquoted Securities Platform (USP) |
Trading |
|
3 |
Acorn Holdings Limited |
Acorn Student Accommodation (ASA) – Acorn ASA |
D-REIT |
February 2021 |
Unquoted Securities Platform (USP) |
Trading |
|
4 |
Local Authorities Pension Trust (LAP Trust) |
Imara |
I-REIT |
November 2022 |
Main Investment Segment – Restricted Sub segment |
Restricted |
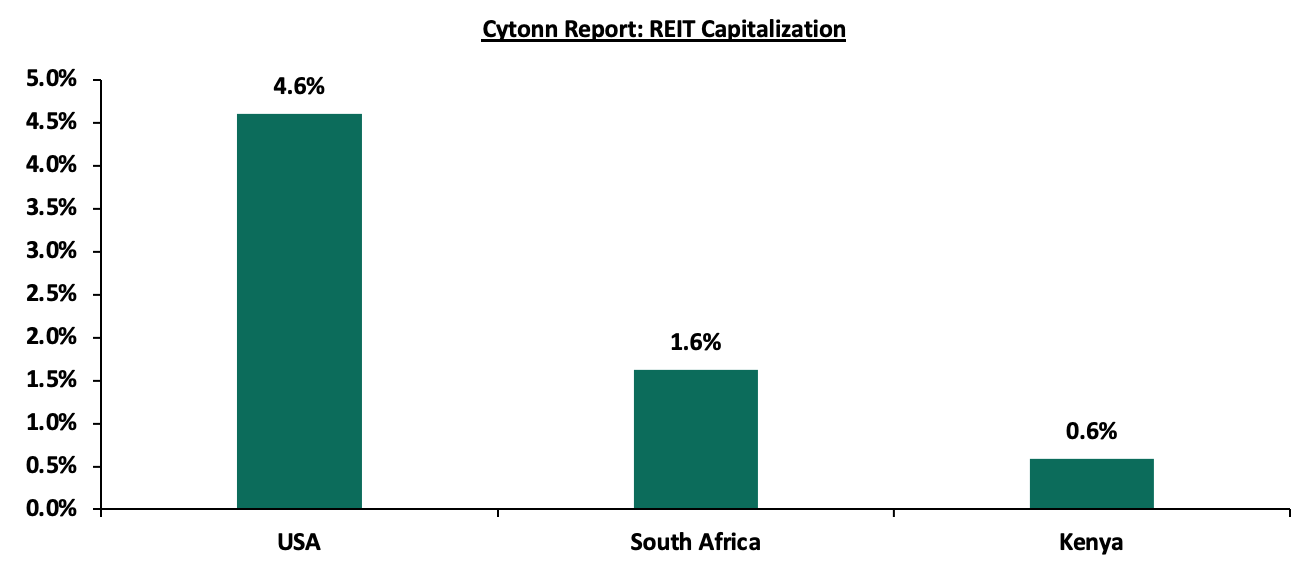
The listed REITs capitalization as a percentage of total market cap in Kenya stands at 0.6%, as compared to 4.6% in USA, and 1.6% in South Africa as of September 2023. Notably, the REITS Capitalization in Kenya as a percentage of total market cap has increased to 0.6% from 0.5% recorded in FY’2022. The increase is due to a decline in the total market capitalization, with NASI registering a 25.2% YTD decline attributable to foreign investors leaving the Nairobi Securities Exchange (NSE), leading to the NSE market registering a net outflow position of USD 282.1 bn as at 29th September 2023, which has adversely affected the NSE. Below is a graph showing comparison of Kenya’s REITs to Market Cap Ratio to that of US and South Africa:
Source: Online Research, Nairobi Securities Exchange (NSE)
*Kenya’s REIT combines both i-REITs and D-REITs
Section V: Recommendations
In conclusion, as witnessed by the growing numbers of total registered Mobile Money Accounts there is need to leverage more on innovation and digitization in order to further propel the growth of unit trust products in Kenya. The use of technology as a distribution channel for unit trusts products opens up the funds to the retail segment, which is characterized by strong demand among retail clients for convenient and innovative products. In addition, we recommend the following actions to stimulate growth of UTFs in the Kenyan capital market;
- Lower the minimum investment amounts: Currently, the minimum investment for sector specific funds is Kshs 1.0 mn, while that for Development REITS is currently at Kshs 5.0 mn. According to the Kenya National Bureau of Statistics, 87.7% of employees earn below Kshs 100,000.0 monthly. As such, the high minimum initial and top up investments amounts for investing in sector specific funds deter potential investors. Furthermore, these high amounts disadvantage the majority of retail investors by restricting their options for investments,
- Open up Trusteeship to Corporate Trustees and Lower Capital Requirement for REIT Trusteeship: Currently, the capital requirement is pegged at Kshs 100.0 mn for REITS trustees in Kenya on top of the requirement that the trustee must be a bank. Lowering the capital to Kshs 10.0 mn would encourage more companies enter the market and provide more options to investors. Similarly, opening trusteeship to Corporate will increase competition leading to better services to investors and overall growth of the UTF industry,
- Allow for private market instruments to drive Competition: Private market instruments such as private equity, private placements, and private debt are not regulated by the Capital Markets Authority (CMA) in Kenya. Private market instruments can provide alternative sources of capital for businesses, which can help to increase competition and innovation in the market. Additionally, private market instruments often offer higher returns than traditional investment options, which can attract more investors to the market thus fuelling growth in the industry
- Encourage innovation and diversification of UTFs’ investments: Majority of UTFs’ investments are either in fixed income or fixed deposits, highlighting high concentration risks. There is need to encourage fund managers to invest in different sectors of the economy as this will spur diversification of investments such as real estate and private offers. As at 30th June 2023, the total allocation to Fixed Deposits and Government securities stood at 44.4% and 42.8% respectively, accounting for 87.2% of the total AUM for unit trust, thus bringing about concentration risk,
- Update regulations: The current Collective Investments Schemes Regulations in Kenya were formulated in 2001 and have not been updated ever since, despite the dynamic nature of the capital markets worldwide. This has led to the regulations lagging behind. For instance, the regulations do not include provisions for private offers that have grown in importance over the years. The regulations also lack stipulated guidelines on special funds to cater for the sophisticated investors’ interest in regulated alternative investments products. While there are efforts to update the regulations, we note that they remain in progress and are yet to be completed,
- Allow for sector funds: Under the current capital markets regulations, UTFs are required to diversify. However, one has to seek special dispensation in the form of sector funds such as a financial services fund, a technology fund or a Real Estate Unit Trust Fund. Regulations allowing unit holders to invest in sector funds would go a long way in expanding the scope of unit holders interested in investing. For example, in Kenya, Real Estate continues to play an important role in the economy contributing 10.0% to the GDP as of March 2022 and remains a popular investment option due to the stable returns it delivers and low correlation with traditional investments. However, looking at the various types of Unit trust we have, investments in real estate are conspicuously missing,
- Incentives: Introduce incentives such as tax benefits or government subsidies for mutual fund investments, encouraging more people to consider them as part of their investment portfolio, similar to pensions and Education plans. This will of great importance in encouraging investors to invest in a long-time horizon,
- Eliminate conflicts of interest in the capital markets governance and allow non-financial institutions to also serve as Trustees: The capital markets regulations should foster a governance structure that is more responsive to both market participants and market growth. In particular, restricting Trustees of Unit Trust Schemes to Banks only limits options, especially given the direct competition between the banking industry and capital markets, and,
- Provide Support to Fund Managers: In our opinion, the regulator, CMA needs to include market stabilization tools as part of the regulations/Act that will help Fund Managers meet fund obligations especially during times of distress like when there are a lot of withdrawals from the funds. We commend and appreciate the regulator’s role in safeguarding investor interests. However, since Fund Managers also play a significant role in the capital markets, the regulator should also protect the reputation of different fund managers in the industry.
As Kenya's financial sector continues to evolve, Unit Trust Funds have emerged as a critical component, offering diversification and accessibility to a wide range of investors. We believe that the UTF market is still underdeveloped, but with a great opportunity and potential to gain in terms of number of investors and AUM. The growth of Unit Trust Funds (UTFs) in Kenya hinges significantly on the active role and strategic initiatives of the Capital Markets Authority (CMA). To foster the expansion of UTFs in the country, the CMA must prioritize several key aspects. Firstly, a streamlined and investor-friendly regulatory framework should be developed, ensuring transparency, trust, and investor protection, which will increase the confidence of investors. In sum, a proactive approach by the Capital Markets Authority, encompassing regulatory enhancements, education, partnerships, and innovation, is pivotal to catalyzing the growth of UTFs in Kenya's financial landscape.
Disclaimer: The views expressed in this publication are those of the writers where particulars are not warranted. This publication is meant for general information only and is not a warranty, representation, advice or solicitation of any nature. Readers are advised in all circumstances to seek the advice of a registered investment advisor.

- Talk to us
- Kenya
- P.O Box 20695 - 00200, Nairobi, Kenya
- Cell +254709101200
- Tel +254709101200
- WhatsApp +254741676635
- United States
- +254709101200
- DOWNLOAD OUR APP
-


- Kenya
- 8th Floor, Pinetree Plaza, Kaburu Drive, Ngong Road, Nairobi, Kenya
- USA
- Suite 1150, 1775 Eye Street NW, USA, Washington DC 20006, USA
- Investments
- High Yield
- Private Equity
- Real Estate
- Real Estate
- RiverRun Estates
- Cytonn Towers
- The Ridge
- Taraji Heights
- The Alma