Q4’2024 Unit Trust Funds Performance Note
By Research Team, Jul 13, 2026
Following the release of the Capital Markets Authority (CMA) Quarterly CIS Report – Q4’2024, we examine the performance of Unit Trust Funds for the period ended 31st December 2024. These funds have seen consistent growth in total Assets Under Management (AUM) and are one of the preferred investment choices in Kenya. Additionally, we will delve into the performance of Money Market Funds, which are a sub-set of Unit Trust Funds.
In our previous note on Unit Trust Funds, we looked at the Q3’2024 Unit Trust Funds Performance by Fund Managers, where we highlighted that their AUM stood at Kshs 316.4 bn, a 24.5% growth from Kshs 254.1 bn recorded in Q2’2024. In this note, we focus on the Q4’2024 performance of Unit Trust Funds where we shall analyze the following:
- Performance of the Unit Trust Funds Industry,
- Performance of Money Market Funds,
- Comparing Unit Trust Funds AUM Growth with other Markets, and,
- Recommendations.
Section I: Performance of the Unit Trust Funds Industry
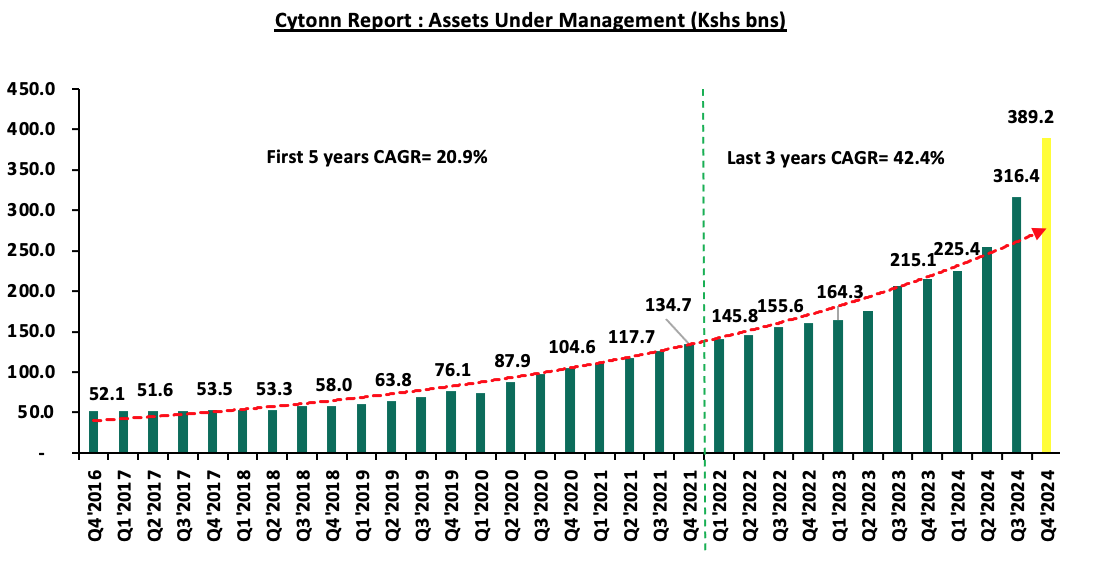
As per the Capital Markets Authority (CMA) Quarterly Collective Investment Schemes (CIS) Report-Q4’2024, the industry’s overall Assets under Management (AUM) grew by 23.0% on a quarter-on-quarter basis to Kshs 389.2 bn at the end of Q4’2024, from Kshs 316.4 bn recorded in Q3’2024. On a y/y basis, the total AUM increased by 81.0%, from Kshs 215.1 bn as at the end of Q4’2023. Key to note, Assets under Management of the Unit Trust Funds have registered an upward trajectory over the last eight years, growing at a 5-year CAGR of 20.9% to Kshs 134.7 bn in Q4’2021, from Kshs 52.1 bn recorded in Q4’2016, and accelerated further at a 3-year CAGR of 42.4% to Kshs 389.2 bn as of Q4’2024 highlighting the rapid expansion and increasing attractiveness of the unit trust funds in Kenya. The chart below shows the growth in Unit Trust Funds’ AUM over the last 8 years:
Source: Capital Markets Authority
The growth can be largely attributed to:
- Low Investments minimums: Most Unit Trust Funds Collective Investment Schemes (CIS) in the market have relatively low initial investment requirements, typically ranging from Kshs 100.0 to Kshs 10,000.0. This has promoted financial inclusion by enabling small-scale investors to access professionally managed investment opportunities,
- Diversified product offering: Unit Trust Funds are also advantageous in terms of providing investors with access to a wider range of investment securities through the pooling of funds. This allows for portfolio diversification that might not be achievable individually, helping investors mitigate the risks associated with market volatility in some asset classes,
- Competitive returns: The positive performance and competitive returns of unit trust funds have been key in attracting investors. As these funds consistently outperform certain traditional investment options, they draw more investors seeking to generate wealth over the long term,
- Increased product awareness: Investor education efforts, primarily led by the Capital Markets Authority (CMA) and fund managers, have focused on raising awareness about the various products offered by trust funds. This has resulted in a deeper understanding of investment options among the public, boosting their confidence and leading to increased participation. Consequently, the number of investors in collective investment schemes has surged significantly, recording a 719.4% growth to 1.4 million by December 2024, from 0.2 million in March 2021, according to the Capital Markets Authority (CMA) Quarterly Collective Investment Schemes (CIS) Report-Q4’2024,
- Regulatory Changes: We have had several regulatory changes that have spurred growth in the industry, such as allowing for Special Collective Investments Schemes and expanding eligibility for trustees to include non-bank trustees.
- Efficiency and High Liquidity: Investments in UTFs are managed as portfolios with various assets, and fund managers maintain a cash buffer. Unit trusts are highly liquid, making it easy to buy and sell units without being dependent on market demand and supply at the time of investment or exit, and,
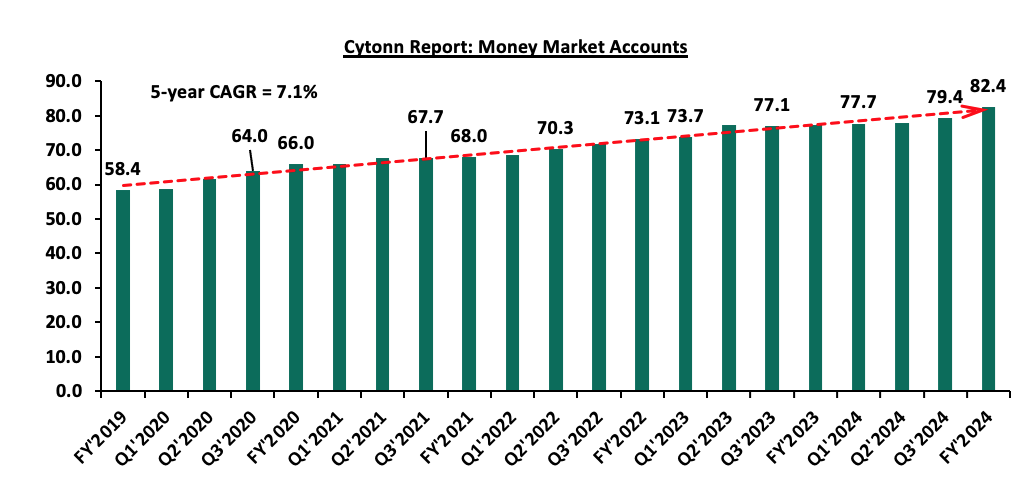
- Adoption of Fintech: Digitization and automation within the industry have enhanced ease in cash accessibility, enabling investors to immediately access their investments via mobile payment platforms. According to the Central Bank of Kenya, more individuals are transacting through mobile money services as evidenced by the sustained growth in the total number of registered mobile money accounts. During the period under review, registered mobile money accounts recorded a 6.7% y/y increase to 82.4 mn accounts, from 77.3 mn accounts registered in FY’2023. Notably, the total number of registered mobile money accounts also grew at a 5-year CAGR of 7.1% to 82.4 mn at the end of FY’2024, from 58.4 mn recorded at the end of FY’2019. The upward trajectory is attributable to Fintech incorporation which has increased the efficiency of processing both payments and investments for fund managers. As a result, Collective Investment Schemes have become more accessible to retail investors.
Source: Central Bank of Kenya (CBK)
Spread of Investments:
|
Cytonn Report: Investment Allocation in Different Funds |
|||||
|
Fund |
Q3’2024 (Kshs bn) |
Q4’2024 (Kshs bn) |
q/q Growth (Q4’2024 & Q3’2024)
|
Q3’2024 Investment Share |
Q4’2024 Investment Share |
|
Money Market |
196.8 |
246.8 |
25.4% |
62.2% |
63.4% |
|
Special Funds |
62.3 |
70.7 |
13.5% |
19.7% |
18.2% |
|
Fixed Income |
53.5 |
66.8 |
24.8% |
16.9% |
17.2% |
|
Equity Fund |
2.3 |
2.5 |
5.5% |
0.7% |
0.6% |
|
Balanced Fund |
1.3 |
2.2 |
65.8% |
0.4% |
0.6% |
|
Other |
0.1 |
0.1 |
99.4% |
0.0% |
0.0% |
|
Total |
316.4 |
389.2 |
23.0% |
100.0% |
100.0% |
Key take-outs from the table above include:
- Money Market Funds: MMFs remained with the largest investment allocation, coming in at 63.4% in Q4’2024, an improvement from 62.2% recorded in Q3’2024. Similarly, the amounts invested in MMFs as of 31st December 2024 recorded a 25.4% increase to Kshs 246.8 bn, from Kshs 196.8 bn recorded at the end of Q3’2024. Notably, on a y/y basis the allocation in MMFs has declined marginally by 2.0% points from 65.5% allocation recorded in Q4’2023 mainly attributable to the diversification of funds into other investment categories, including special funds. Key to note, according to Collective Investments Schemes Regulations 2023, Section VIII, MMFs are required to invest only in interest-earning money market instruments which have a maximum weighted average tenor of eighteen (18) months, while fixed income funds invest a minimum of 80.0% of their market value of assets under management (AUM) in fixed income securities at all times hence concentrating most their investments in bonds. However, the high percentage of 63.4% in Q4’2024 is an indication of MMFs preference by the majority of investors due to their ease of investing and high liquidity, coupled with high returns during the period,
- Special Funds recorded a 13.5% q/q growth to Kshs 70.7 bn in Q4’2024, up from Kshs 62.3 bn in Q3’2024. However, the allocation decreased by 1.5% points to 18.2%, from the 19.7% recorded the previous quarter
- Fixed Income Funds recorded a 24.8% q/q growth to Kshs 66.8 bn in Q4’2024, up from Kshs 53.5 bn in Q3’2024. Similarly, the allocation increased by 0.2% points to 17.2%, from the 16.9% recorded the previous quarter, mainly attributable to high returns on government papers over the period, and,
- Equity Funds recorded a decline in their investment allocation, decreasing marginally by 0.1% points to 0.6% at the end of Q4’2024, from 0.7% at the end of Q3’2024. However, equity funds recorded a 5.5% growth in AUM to Kshs 2.5 bn in Q4’2024, down from Kshs 2.3 bn in Q3’2024. The increase in equity funds’ portfolio holdings is largely attributable to increased market activity, with the Nairobi All Share Index (NASI) registering a 15.2% q/q gain in Q4’2024 following increase in capital gains by major listed companies in the Nairobi Securities Exchange such as DTB-K, SCB-K and Absa, as well as an improved business environment as evidenced by Purchasing Manager’s Index (PMI) registering an average of 6, falling above the expansionary zone in Q4’2024, from an average of 47.8 in Q3’2024.
Notably, the overall UTFs portfolio remained predominantly invested in government securities, accounting for the largest share at 42.4% by the end of Q4’2024. Similarly, this represents 1.0% points increase from the 41.4% allocation in Q3’2024, with the total value increasing by 26.0% to Kshs 164.8 bn in Q4’2024 from Kshs 130.9 billion in Q3’2024. This was followed by Fixed deposits at 30.3% allocation, a marginal 0.8% points decrease from 31.1% allocation in Q3’2024, partly attributable to the lower deposit rates provided by banking institutions during the period, following a decrease in Central Bank Rate (CBR). The table below represents asset allocations in different asset classes comparing Q4’2023, Q3’2024 and Q4’2024 in the UTF industry.
|
Cytonn Report: Distribution of Unit Trust Funds Investments in terms of Asset Classes (Kshs bn) |
||||||
|
Fund |
Q4'2023 |
Q4'2023 (%) |
Q3’2024 |
Q3’2024 (%) |
Q4’2024 |
Q4’2024 (%) |
|
Government Securities |
101.2 |
47.0% |
130.9 |
41.4% |
164.8 |
42.4% |
|
Fixed Deposits |
74.2 |
34.5% |
98.5 |
31.1% |
118.0 |
30.3% |
|
Cash and demand deposits |
22.9 |
10.7% |
46.5 |
14.7% |
56.2 |
14.4% |
|
Offshore Investments |
0.8 |
0.4% |
19.6 |
6.2% |
24.2 |
6.2% |
|
Unlisted Securities |
10.1 |
4.7% |
10.0 |
3.1% |
12.3 |
3.2% |
|
Listed Securities |
4.6 |
2.1% |
6.1 |
1.9% |
7.0 |
1.8% |
|
Other Collective Investments schemes |
0.8 |
0.3% |
1.9 |
0.6% |
6.6 |
1.7% |
|
Immovable Property |
0.6 |
0.3% |
3.0 |
0.9% |
- |
- |
|
Total |
215.1 |
100.0% |
316.4 |
100.0% |
389.2 |
100.0% |
According to the Capital Markets Authority, as of the end of Q3’2024, there were 54 Collective Investment Schemes (CISs) in Kenya, up from 36 recorded at the end of Q4’2023 and an increase from the 41 recorded at the end of Q3’2024. Out of the 54 schemes, 37 of them (equivalent to 68.5%) were active while 17 (31.5%) were inactive. The table below outlines the performance of the Collective Investment Schemes comparing Q3’2024 and Q4’2024;
|
|
Cytonn Report: Assets Under Management (AUM) for the Approved Collective Investment Schemes |
|||||
|
No. |
Collective Investment Schemes
|
Q3’2024 AUM |
Q3’2024 |
Q4’2024 AUM |
Q4’2024 |
AUM Growth |
|
(Kshs mns) |
Market Share |
(Kshs mns) |
Market Share |
Q3’2024 – Q4’2024 |
||
|
1 |
CIC Unit Trust Scheme |
70,321.8 |
22.2% |
82,497.2 |
21.2% |
17.3% |
|
2 |
Sanlam Unit Trust Scheme |
46,848.9 |
14.8% |
62,749.9 |
16.1% |
33.9% |
|
3 |
Mansa X |
34,231.8 |
10.8% |
41,697.0 |
10.7% |
21.8% |
|
4 |
NCBA Unit Trust Scheme |
33,065.9 |
10.5% |
39,331.1 |
10.1% |
18.9% |
|
5 |
British American Unit Trust Scheme |
27,759.6 |
8.8% |
29,283.3 |
7.5% |
5.5% |
|
6 |
ICEA Unit Trust Scheme |
16,995.5 |
5.4% |
19,282.6 |
5.0% |
13.5% |
|
7 |
ABSA Unit Trust Scheme |
12,603.3 |
4.0% |
14,898.5 |
3.8% |
18.2% |
|
8 |
Old Mutual Unit Trust Scheme |
13,326.2 |
4.2% |
14,102.0 |
3.6% |
5.8% |
|
9 |
Co-op Unit Trust Scheme |
10,041.6 |
3.2% |
13,530.3 |
3.5% |
34.7% |
|
10 |
KCB Asset Managers |
5,544.2 |
1.8% |
9,322.0 |
2.4% |
68.1% |
|
11 |
Jubilee Unit Trust Scheme |
5,072.9 |
1.6% |
8,942.0 |
2.3% |
76.3% |
|
12 |
Madison Asset Managers |
7,370.6 |
2.3% |
8,361.1 |
2.1% |
13.4% |
|
13 |
Nabo Capital Limited |
5,954.5 |
1.9% |
6,909.4 |
1.8% |
16.0% |
|
14 |
Etica Capital Limited |
4,603.8 |
1.5% |
6,616.8 |
1.7% |
43.7% |
|
15 |
Dry Associates Unit Trust Scheme |
4,450.5 |
1.4% |
5,157.6 |
1.3% |
15.9% |
|
16 |
Zimele Asset Managers |
2,906.9 |
0.9% |
3,245.0 |
0.8% |
11.6% |
|
17 |
Lofty-Corban Unit Trust Scheme |
2,166.7 |
0.7% |
2,889.5 |
0.7% |
33.4% |
|
18 |
Mali Money Market Fund |
2,764.7 |
0.9% |
2,796.4 |
0.7% |
1.1% |
|
19 |
Stanbic Unit Trust Scheme |
338.2 |
0.1% |
2,437.6 |
0.6% |
620.8% |
|
20 |
Apollo Asset Managers |
2,028.8 |
0.6% |
2,428.6 |
0.6% |
19.7% |
|
21 |
GenAfrica Unit Trust Scheme |
1,720.9 |
0.5% |
2,389.1 |
0.6% |
38.8% |
|
22 |
Ziidi Money Market Fund |
- |
- |
1,713.4 |
0.4% |
- |
|
23 |
Cytonn Asset Managers |
1,540.4 |
0.5% |
1,700.2 |
0.4% |
10.4% |
|
24 |
African Alliance Kenya |
1,528.3 |
0.5% |
1,616.1 |
0.4% |
5.7% |
|
25 |
Kuza Asset Managers |
803.7 |
0.3% |
1,264.9 |
0.3% |
57.4% |
|
26 |
Faida Unit Trust Scheme |
- |
- |
927.8 |
0.2% |
- |
|
27 |
Enwealth Capital Unit Trust |
690.2 |
0.2% |
866.8 |
0.2% |
25.6% |
|
28 |
Genghis Unit Trust Fund |
767.9 |
0.2% |
776.3 |
0.2% |
1.1% |
|
29 |
Arvocap Unit Trust Scheme |
170.3 |
- |
537.7 |
0.1% |
215.7% |
|
30 |
Orient Collective Investment Scheme |
266.7 |
0.1% |
296.9 |
0.1% |
11.3% |
|
31 |
Faulu Unit Trust Scheme |
239.5 |
0.1% |
253.2 |
0.1% |
5.7% |
|
32 |
Equity Investment Bank |
138.9 |
0.0% |
119.5 |
0.0% |
(14.0%) |
|
33 |
Mayfair Asset Managers |
62.5 |
0.0% |
117.7 |
0.0% |
88.4% |
|
34 |
Taifa Unit Trust Scheme |
11.8 |
- |
52.3 |
0.0% |
342.1% |
|
35 |
Amana Capital |
27.1 |
0.0% |
27.6 |
0.0% |
1.9% |
|
36 |
MyXeno Unit Trust Sheme |
13.0 |
- |
14.9 |
0.0% |
14.4% |
|
37 |
Wanafunzi Investments |
0.9 |
0.0% |
0.9 |
0.0% |
2.4% |
|
38 |
Diaspora Unit Trust Scheme |
- |
- |
- |
- |
- |
|
39 |
Dyer and Blair Unit Trust Scheme |
- |
- |
- |
- |
- |
|
40 |
Masaru Unit Trust Fund |
- |
- |
- |
- |
- |
|
41 |
Adam Unit Trust Fund |
- |
- |
- |
- |
- |
|
42 |
First Ethical Opportunities Fund |
- |
|
- |
- |
- |
|
43 |
Amaka Unit Trust (Umbrella) Scheme |
- |
|
- |
- |
- |
|
|
Total |
316,378.6 |
100.0% |
389,152.8 |
100.0% |
23.0% |
Key take-outs from the above table include:
- Assets Under Management: CIC Unit Trust Scheme remained the largest overall Unit Trust Fund, accounting for 21.2% of the total market share. Similarly, the AUM recorded a 17.3% growth to Kshs 82.5 bn in Q4’2024, higher than the AUM of Kshs 70.3 bn in Q3’2024,
- Growth: In terms of AUM growth, Stanbic Unit Scheme recorded the highest growth of 620.8% with its AUM increasing to Kshs 2,437.6 bn, from Kshs 338.2 bn in Q3’2024, attributable to the low base effect. On the other hand, Equity Investment Bank recorded the largest decline with its AUM declining by 14.0% to Kshs 119.5 bn in Q4’2024, from Kshs 138.9 mn in Q3’2024,
- Market Share: CIC Unit Trust Scheme remained the largest overall Unit Trust with a market share of 21.2%, 1.0% points decline from 22.2% recorded in Q3’2024. The decline in market share is an indication of increasing competition as new collective schemes enter the market,
- New Collective Investment Schemes: Ziidi Money Market Fund and Faida Unit Trust Scheme, with AUMs of Kshs 1,713.4 mn and Kshs 927.8 mn respectively, were approved as active collective investment schemes in the capital market during Q4 ’2024, taking the total number of active collective schemes to 37, and,
- 6 UTFs remained inactive as at the end of Q4’2024: First Ethical Opportunities Fund, Adam Unit Trust Fund, Masaru Unit Trust Fund, Dyer and Blair Unit Trust Scheme, Diaspora Unit Trust and Amaka Unit Trust remained inactive as at the end of Q4’2024.
Section II: Performance of Money Market Funds
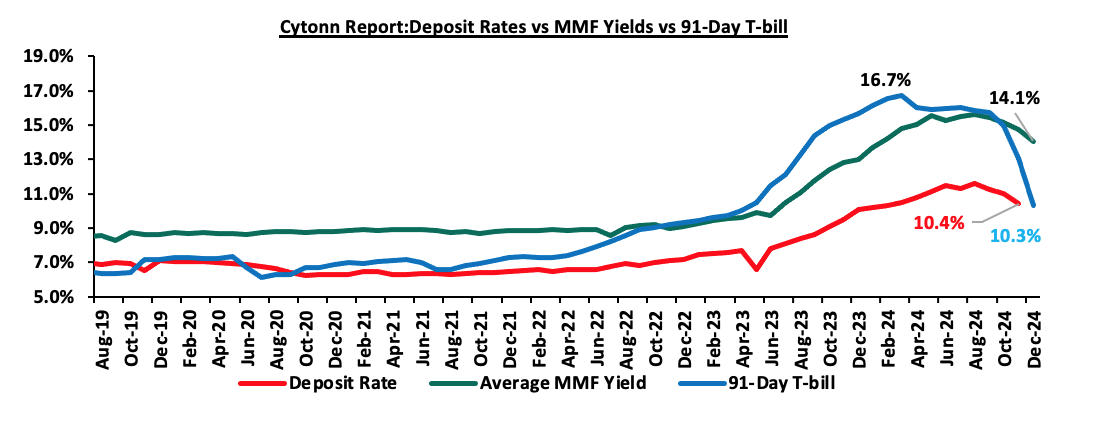
Money Market Funds (MMFs) in Kenya have been growing popularity in Kenya, mainly because they provide higher returns than bank deposits while also offering a high degree of security and liquidity. According to the Central Bank of Kenya data, the weighted average deposit rate in November 2024 decreased to 10.4% from 11.0% recorded in October 2024, albeit lower than the Q4’2024 average yields of 91-day T-bill and Money Market Funds at 12.6% and 14.7% respectively. The graph below shows the performance of the Money Market Fund to other short-term financial instruments:
Source: Central Bank of Kenya, Cytonn Research
According to capital markets Collective Investments Schemes (CIS) Regulations 2023, MMFs should be invested in short-term, liquid, interest-bearing securities with a maximum weighted tenor to maturity of 18 months or less. These securities include treasury bills, call deposits, commercial papers, and fixed deposits in commercial banks and deposit-taking institutions, as specified by the Central Bank of Kenya (CBK). Consequently, MMFs are ideal for investors seeking a low-risk investment that ensures capital preservation and liquidity while offering competitive returns. They also serve as a safe haven for investors transitioning from high-risk portfolios to more stable, low-risk options, particularly during periods of market uncertainty.
Money Market Funds in Kenya accounted for Kshs 246.8 bn which makes up 63.4% of all the funds under management by Collective Investment Schemes for Q4’2024. This is 25.4% higher than the Kshs 196.8bn recorded at the end of Q3’2024.
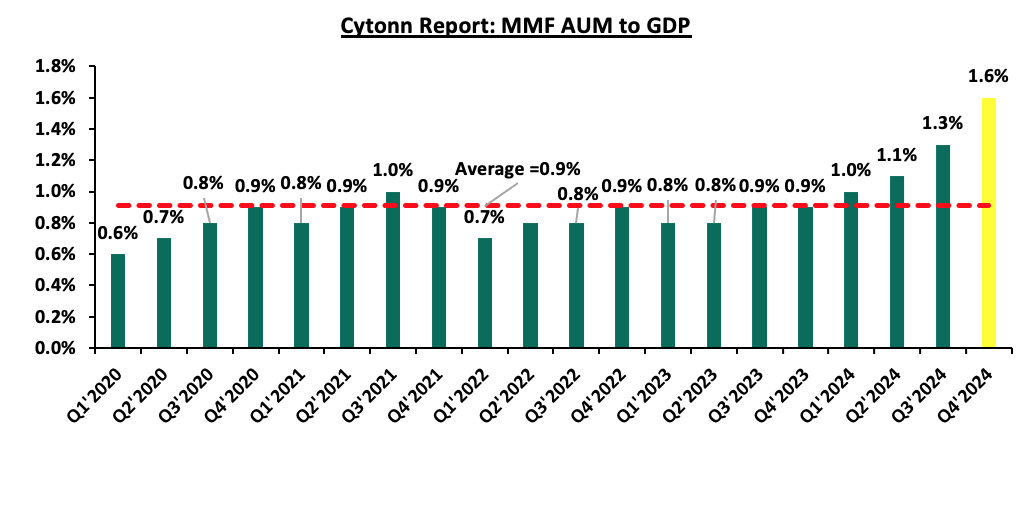
Money Market funds as an asset class are still below the potential, with Kenya’s MMF assets to GDP coming in at 1.6% as of Q4’2024, which is below the global average MMF assets to GDP ratio of 8.6% as of Q4’2024. More needs to be done to increase the ratio, especially at a time when the government is trying to increase savings to GDP ratio. Notably, the 1.6% Money market AUM to GDP in Kenya represents a marginal 0.3% points increase from the 1.3% figure recorded in Q3’2024. The Money markets remain highly competitive compared to other traditional investment options despite the falling yields. The chart below shows the performance of the Money Market Funds AUM to GDP in the last four years.
Source: CMA, Central Bank of Kenya
The chart below shows the performance of the Money Market Funds AUM to GDP comparing Kenya to other economies:
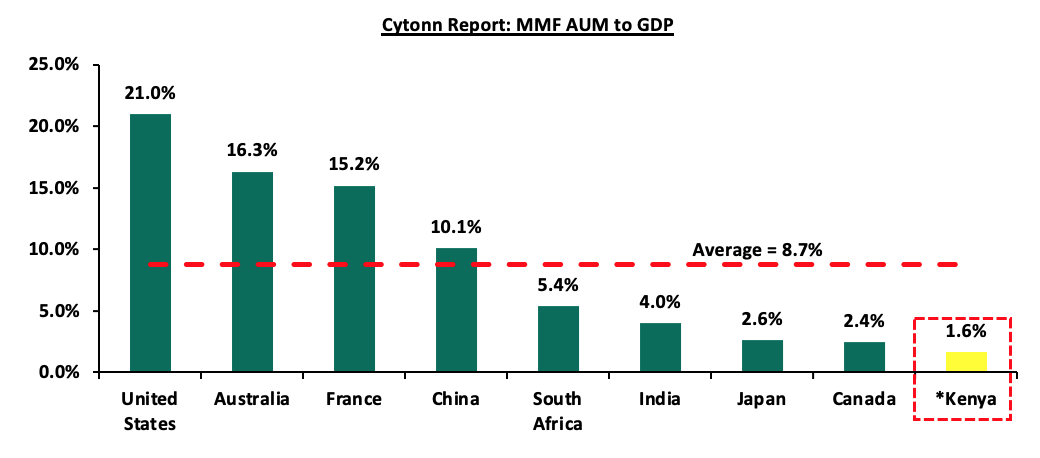
Source: World Bank, CMA, EFAMA
*Data as of Q4’2024
Top Five Money Market Funds by Yields
During the period under review, Cytonn Money Market Fund registered the highest average effective annual yield at 17.8% against the industry Q4’2024 average of 14.7%. Below is a table of the top five Money Market Funds with the highest average effective annual yield declared in Q4’2024;
|
Cytonn Report: Top 5 Money Market Fund Yield in Q4’2024 |
||
|
Rank |
Money Market Fund |
Effective Annual Rate (Average Q4'2024) |
|
1 |
Cytonn Money Market Fund |
17.8% |
|
2 |
Lofty-Corban Money Market Fund |
17.4% |
|
3 |
Etica Money Market Fund |
16.9% |
|
4 |
Kuza Money Market fund |
16.4% |
|
5 |
Arvocap Money Market Fund |
16.4% |
|
|
Average of Top 5 Money Market Funds |
17.0% |
|
Industry average |
14.7% |
|
Source: Cytonn Research, Daily Nation
Section III: Comparison between Unit Trust Funds AUM Growth and Other Markets
Unit Trust Funds’ assets recorded a q/q growth of 23.0% in Q4’2024. On the other hand, banks’ deposits recorded a growth of 1.0% in Q4’2024 to remain relatively unchanged at Kshs 5.7 tn from Q3’2024, translating to 7.3% points decrease from the 8.3% growth recorded in Q3’2024. For the Unit Trust Funds, the q/q growth of 23.0% was a decrease of 1.5% points, compared to the 24.5% points q/q growth recorded in Q3’2024. The chart below highlights the quarter-on-quarter AUM growths for Unit Trust Funds AUM vs Listed banks’ deposits growth since 2023;
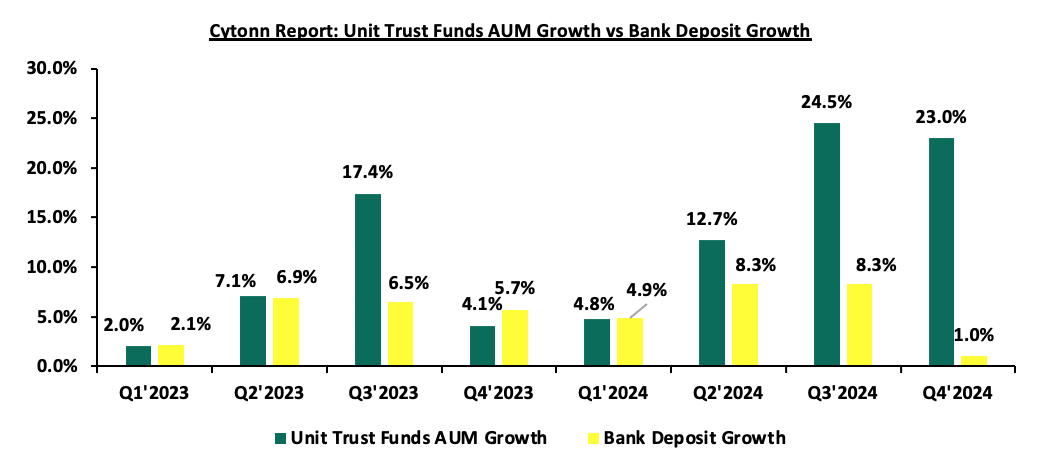
Source: Cytonn Research
We note that there was a 1.5% points q/q decrease in UTF growth rate which can be attributed to the relatively lower returns in the collective investment schemes, especially the MMFs. As at December 2024, Money Market Funds offered an average return of 14.6% for Q4’2024, while bank deposits offered 10.4% as of November 2024. We therefore anticipate an expansion in business funding coming from capital markets from the current 1.0%, in the short-term to medium term due to Kenya’s economic growth and improved investor confidence and awareness. World Bank statistics reveal that in efficient economies, only 40.0% of business financing comes from banks, while a significant 60.0% is sourced from Capital markets. However, in Kenya, the scenario is quite different. The World Bank points out that Kenyan businesses depend on banks for a whopping 99.0% of their funding, with a negligible 1.0% being raised from the capital markets.
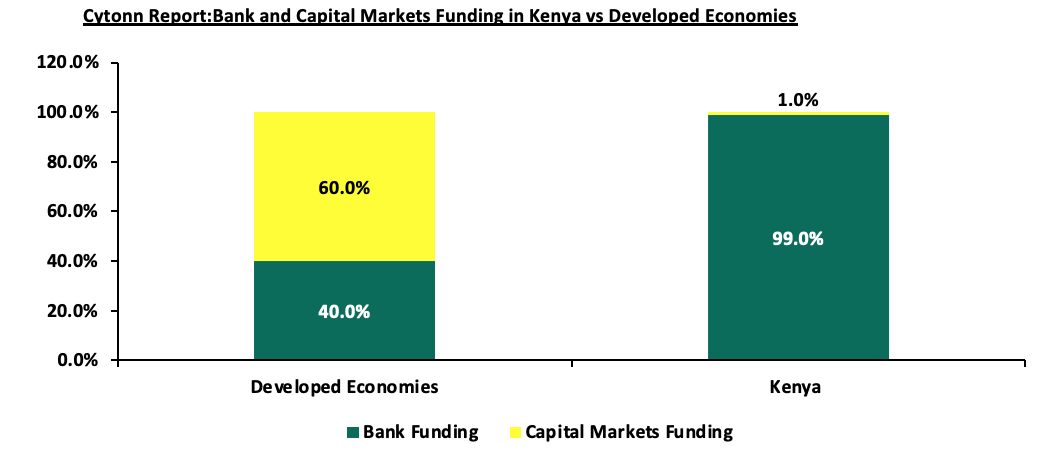
Source: World Bank
Notably, Kenya’s Mutual Funds/UTFs to GDP ratio at the end of FY’2024 came in at 2.6%, significantly lower compared to an average of 50.6% amongst select global markets an indication of a need to continue enhancing our capital markets. Additionally, Sub-Saharan African countries such as South Africa and Namibia have higher mutual funds to GDP ratios coming in at 61.5% and 43.1%, respectively as of the latest data, compared to Kenya. The chart below shows select countries’ mutual funds as a percentage of GDP:
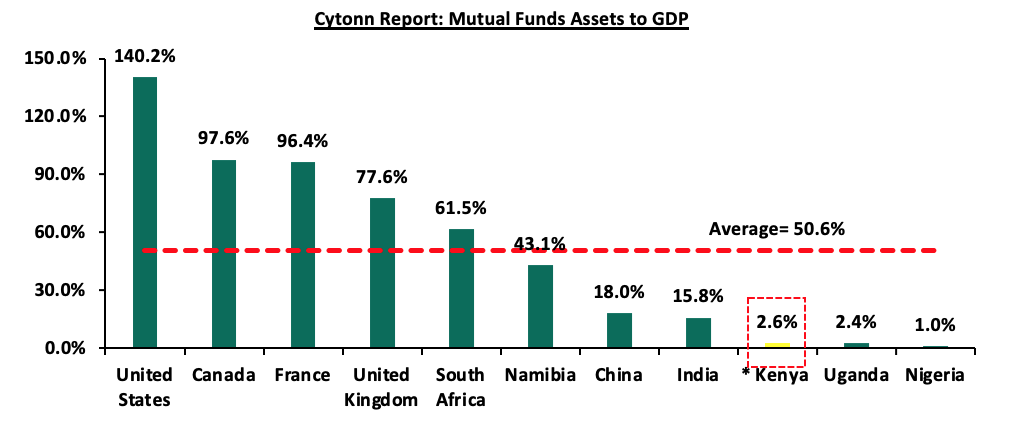
*Data as of December 2024
Source: World Bank Data
In the last five years, the Assets Under Management (AUM) of Unit Trust Funds (UTFs) have shown a remarkable performance, having grown at a 5-year CAGR of 39.5% to Kshs 389.2 bn in FY’2024, from Kshs 73.6 bn in FY’2019. However, the industry is still dwarfed when compared to other deposit-taking institutions such as bank deposits, with the entire banking sector deposits coming in at Kshs 5.7 tn as at December 2024 from Kshs 5.8 tn recorded in December 2023. Similarly, the pension industry recorded an increase of 9.4%, to 2.0 tn as of December 2024 from Kshs 1.7 tn recorded in December 2023. Below is a graph showing the sizes of different saving channels and capital market products in Kenya;
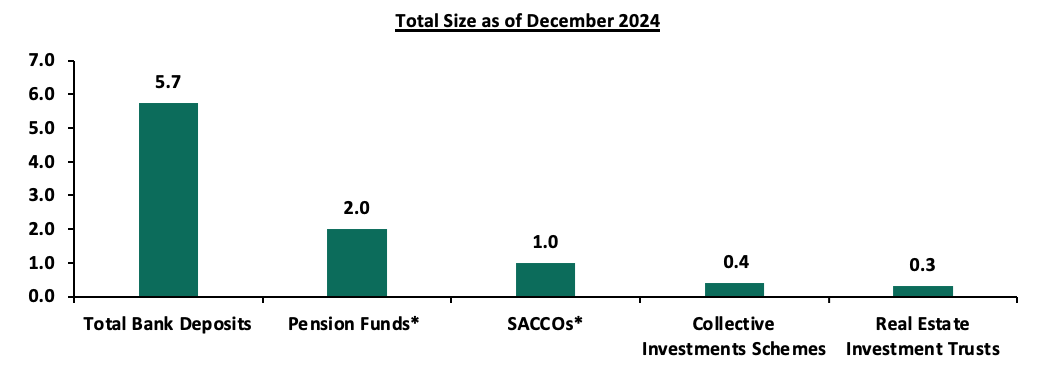
*Data as of June 2024
Source: CMA, RBA, CBK, SASRA Annual Reports and REITs Financial Statements
|
Cytonn Report: Authorized REITs in Kenya |
||||||
|
# |
Issuer |
Name |
Type of REIT |
Listing Date |
Market Segment |
Status |
|
1 |
ICEA Lion Asset Management (ILAM) |
Fahari |
I-REIT |
July 2024 |
Unquoted Securities Platform (USP) |
Trading |
|
2 |
Acorn Holdings Limited |
Acorn Student Accommodation (ASA) – Acorn ASA |
I-REIT |
February 2021 |
Unquoted Securities Platform (USP) |
Trading |
|
3 |
Acorn Holdings Limited |
Acorn Student Accommodation (ASA) – Acorn ASA |
D-REIT |
February 2021 |
Unquoted Securities Platform (USP) |
Trading |
|
4 |
Local Authorities Pension Trust (LAPTrust) |
Imara |
I-REIT |
March 2023 |
Restricted Market Sub-Segment of the Main Invesment Market |
Restricted |
Comparing other Capital Markets products like REITS, Kenya's REIT market faces additional challenges due to its relatively underdeveloped capital markets, especially when compared to countries like South Africa. Currently, there is only one listed REIT in Kenya, which is not actively trading. most property developers in Kenya continue to rely on traditional funding sources, such as banks, unlike in more developed markets. Since the establishment of REIT regulations, four REITs have been approved in Kenya, all structured as closed-ended funds with a fixed number of shares. However, none of these REITs are actively trading on the Main Investment Market Segment of the Nairobi Securities Exchange (NSE). Following the recent delisting of ILAM Fahari I-REIT, LAPTrust Imara I-REIT is the only listed REIT in the country, quoted on the restricted market sub-segment of the NSE's Main Investment Market. It is important to note that Imara did not raise funds upon listing. The ILAM Fahari I-REIT, Acorn I-REIT and D-REIT are not listed but trade on the Unquoted Securities Platform (USP), an over-the-counter market segment of the NSE. The table below outlines all REITs authorized by the Capital Markets Authority (CMA) in Kenya:
Source: Nairobi Securities Exchange, CMA
The listed REITs’ capitalization as a percentage of total market cap in Kenya stands at 0.2%, as compared to 5.7% in Australia and 1.9% in South Africa as of December 2024. The reflects the challenges faced by the Kenya's REIT market, especially when compared to countries like South Africa. Below is a graph showing a comparison of Kenya’s REITs to Market Cap Ratio to that of the US, UK, Australia and South Africa:
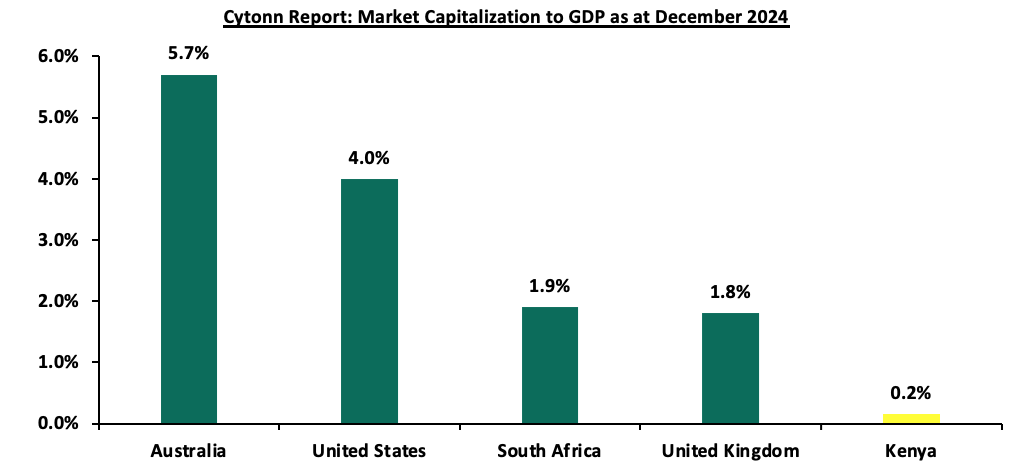
Source: Online Research, Nairobi Securities Exchange (NSE)
*Kenya’s REIT combines both I-REITs and D-REITs
Section IV: Recommendations
The number of total registered Mobile Money Accounts has been growing steadily, recording a CAGR of 7.1%, increasing from Kshs 58.4 mn at the end of FY’2019 to Kshs 82.4 mn at the end of December 2024. Consequently, there is a pressing need to leverage innovation and digitization to drive the expansion of unit trust funds in Kenya. Utilizing technology as a distribution channel for unit trust products enables these funds to reach the retail segment, which demands convenient and innovative products. To further promote the growth of Unit Trust Funds (UTFs) in the Kenyan capital market, we advocate the following recommendations:
- Encourage innovation and diversity of UTF investments: At the end of Q4’2024, investment in the money market fund segment accounted for 63.4% of total investments by collective investment schemes, indicating concentration risk. Notably, 42.4% of UTFs' AUM was invested in securities issued by the Kenyan government and 30.3% in Fixed Deposits with Commercial Banks, a market that competes with Unit Trust Funds for deposit mobilization. As a result, there is a need to reassess laws and encourage fund managers to diversify investments, as well as improve investment vehicle innovation,
- Allow for sector funds: Under present capital markets regulations, UTFs must diversify. However, one must request specific permission in the form of sector funds such as a financial services fund, a technology fund, or a Real Estate Unit Trust Fund. Regulations permitting unit holders to invest in sector funds would go a long way towards widening the breadth of unit holders interested in participating,
- Encourage different players to enter the market to increase competition: Increased competition in capital markets will not only push Unit Trust Fund managers to provide higher returns for investors, but it will also eliminate conflicts of interest in markets and enhance the provision of innovative products and services,
- Fee optimization: Unit Trust Funds should continuously review and optimize management fees and other associated costs to ensure they are competitive while still covering operational expenses. The fee structure should be designed to align fund managers' interests with those of investors, while maintaining fairness and transparency,
- Provide Support to Fund Managers: We believe that the regulator, CMA, should incorporate market stabilization measures as part of the regulations/Act to assist fund managers in meeting fund responsibilities, particularly during times of distress, such as when there are a large number of withdrawals from the funds. We commend and appreciate the regulator's role in protecting investor interests. However, because fund managers play an important role in capital markets, the regulator should preserve the reputations of various fund managers in the business. This can be accomplished by partnering with industry participants to discover answers rather than openly rejecting and alienating industry players facing issues, that may not be in the best interests of investors,
- Improve fund transparency to provide more information to investors: To increase transparency for investors, each Unit Trust Fund should be required to publish their portfolio holdings on a quarterly basis and make the information available to the public. Providing more information to investors will increase accountability by enabling them to make more informed decisions, which will boost investor confidence, and,
- Allow non-financial institutions to participate as trustees and eliminate conflicts of interest in capital market governance: Capital market legislation should promote a governance structure that is more responsive to market participants and growth. In particular, confining Trustees of Unit Trust Schemes to Banks limits options, especially considering the direct competition between the banking industry and capital markets.
As Kenya's financial sector evolves, Unit Trust Funds play a critical role by offering diversity and accessibility to a wide range of investors. Emphasizing innovation, digitization, and product development in the capital markets will accelerate the growth of UTFs. Policymakers should support and enable UTF expansion and diversification to promote the overall growth of capital markets and attract new participants.
Disclaimer: The views expressed in this publication are those of the writers where particulars are not warranted. This publication is meant for general information only and is not a warranty, representation, advice or solicitation of any nature. Readers are advised in all circumstances to seek the advice of a registered investment advisor.

- Talk to us
- Kenya
- P.O Box 20695 - 00200, Nairobi, Kenya
- Cell +254709101200
- Tel +254709101200
- WhatsApp +254741676635
- United States
- +254709101200
- DOWNLOAD OUR APP
-


- Kenya
- 8th Floor, Pinetree Plaza, Kaburu Drive, Ngong Road, Nairobi, Kenya
- USA
- Suite 1150, 1775 Eye Street NW, USA, Washington DC 20006, USA
- Investments
- High Yield
- Private Equity
- Real Estate
- Real Estate
- RiverRun Estates
- Cytonn Towers
- The Ridge
- Taraji Heights
- The Alma