Retirement Benefits Schemes Q2’2025 Performance Report, & Cytonn Weekly #35/2025
By Research Team, Sep 7, 2025
Executive Summary
Fixed Income
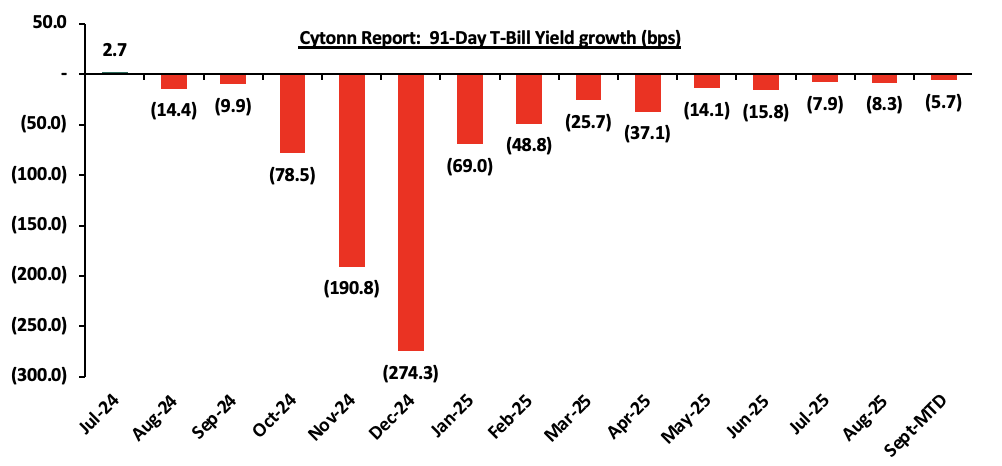
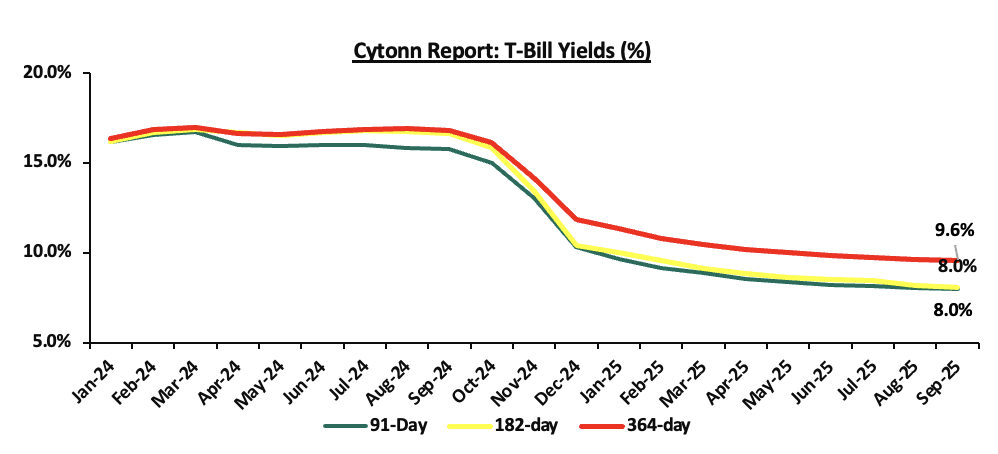
During the week, T-bills were oversubscribed for the third consecutive week, with the overall subscription rate coming in at 141.2%, higher than the subscription rate of 133.5% recorded the previous week. Investors’ preference for the shorter 91-day paper waned, with the paper receiving bids worth Kshs 5.9 bn against the offered Kshs 4.0 bn, translating to a subscription rate of 146.7%, albeit lower than the subscription rate of 499.2%, recorded the previous week. The subscription rate for the 182-day paper increased to 49.1% from the 18.0% recorded the previous week, while that of the 364-day paper increased to 231.0% from the 102.5% recorded the previous week. The government accepted a total of Kshs 29.5 bn worth of bids out of Kshs 33.9 bn bids received, translating to an acceptance rate of 87.2%. The yields on the government papers registered a mixed performance with the yields on the 182-day and 91-day paper decreasing by 1.7 bps and 1.3 bps to 8.03% and 7.98% respectively, from the 8.05% and 7.99% respectively recorded the previous week. The yields on the 364-day paper increased by 1.0 bps to 9.58% from the 9.57% recorded the previous week.
During the week the Central Bank of Kenya released the auction results for the re-opened bond SDB1/2011/030, with a tenor to maturity of 15.5 years and a fixed coupon rate of 12.0%. The bond was undersubscribed, with the overall subscription rate coming in at 40.3%, receiving bids worth Kshs 8.1 bn against the offered Kshs 20.0 bn. The government accepted bids worth Kshs 2.4 bn, translating to an acceptance rate of 29.7%. The weighted average yield for the accepted bids for the bond came in at 14.0%. Notably, the 14.0% yield was similar to the 14.0% registered the last time the bond was reopened in June 2025. Given the 10.0% withholding tax on the bond, the tax equivalent yield for a normal bond with 15.0% withholding tax is 14.8% With the Inflation rate at 4.5% as of August 2025, the real return of the SDB1/2011/030 is 9.5%.
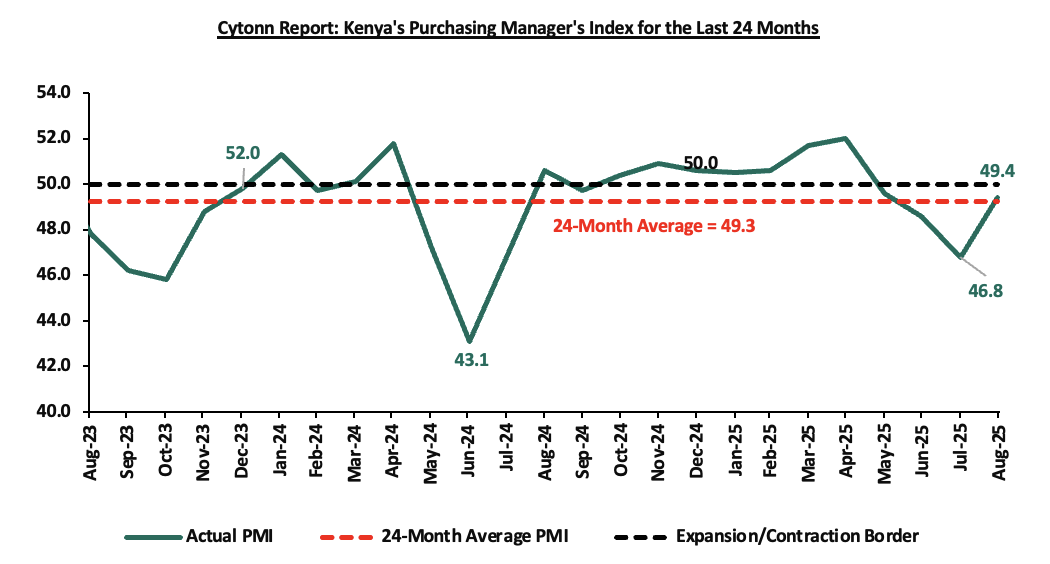
During the week, Stanbic Bank released its monthly Purchasing Manager’s Index (PMI) highlighting that the index for the month of August 2025 improved substantially but remained in negative territory, coming in at 49.4, up from 46.8 in July 2025. This marked the fourth consecutive month the index fell below the 50.0 neutral mark, signaling a continued deterioration in business conditions, albeit at a softer pace, mainly attributable to weaker order inflows and rising cost pressures, though activity was partly supported by stabilizing demand and easing political disruptions;
Equities
During the week, the equities market was on an upward trajectory, with NSE 20 gaining the most by 4.3%, while NASI, NSE 10 and NSE 25 gained by 3.3%, 2.9% and 2.5% respectively, taking the YTD performance to gains of 44.2%, 42.2%, 32.5% and 31.7% for NSE 20, NASI, NSE 10 and NSE 25 respectively. The equities market performance was driven by gains recorded by large-cap stocks such as DTB-K, Coop Bank and Safaricom of 15.9%, 14.0% and 4.7% respectively. The performance was, however, weighed down by losses recorded by large cap stocks such as KCB, Stanbic and Equity of 6.0%, 1.2% and 0.9% respectively;
Additionally, in the regional equities market, the East African Exchanges 20 (EAE 20) share index gained by 22.1 bps, attributable to gains recorded by large cap stocks such as ABSA, Quality Chemicals Industry and Safaricom of 2.8%, 2.2% and 1.9% respectively. The performance was, however, weighed down by losses recorded by large cap stocks such as Tanzania Breweries Limited, CRDB Bank and Tanga Cement Company Limited of 2.6%, 1.7% and 0.1% respectively;
Real Estate
During the week, Hounen, a global real estate developer and solar energy manufacturer, joined the Tatu City Special Economic Zone (SEZ) with plans for a major mixed-use project. The company is investing in solar product manufacturing alongside its real estate initiatives. Their development will span 43,500 square meters within Tatu City’s living and business district. The project will include a blend of office, retail, commercial, and residential spaces. As part of the plan, four high-rise towers ranging from 21 to 26 storeys will be constructed.
On the Unquoted Securities Platform, Acorn D-REIT and I-REIT traded at Kshs 27.4 and Kshs 23.2 per unit, respectively, as per the last updated data on 5th September 2025. The performance represented a 37.0% and 16.0% gain for the D-REIT and I-REIT, respectively, from the Kshs 20.0 inception price. Additionally, ILAM Fahari I-REIT traded at Kshs 11.0 per share as of 5th September 2025, representing a 45.0% loss from the Kshs 20.0 inception price.
Focus of the Week
According to the ACTSERV Q2’2025 Retirement Benefits Schemes Investments Performance Survey, segregated retirement benefits schemes recorded a 6.6% return in Q2’2025, remaining unchanged from the return recorded in Q2’2024. The performance was largely supported by the performance of Equities investments made by the schemes which recorded an 21.5% gain, 21.2% points above from the 0.3% return recorded in Q2’2024, on the back of strong gains posted by the Nairobi All Share Index (NASI) of 17.3%, driven by robust corporate earnings, favourable valuations, increased foreign investor inflows, and continued monetary policy easing. This week, we shall focus on understanding Retirement Benefits Schemes and look into the quarterly performance and current state of retirement benefits schemes in Kenya with a key focus on Q2’2025;
Investment Updates:
- Weekly Rates:
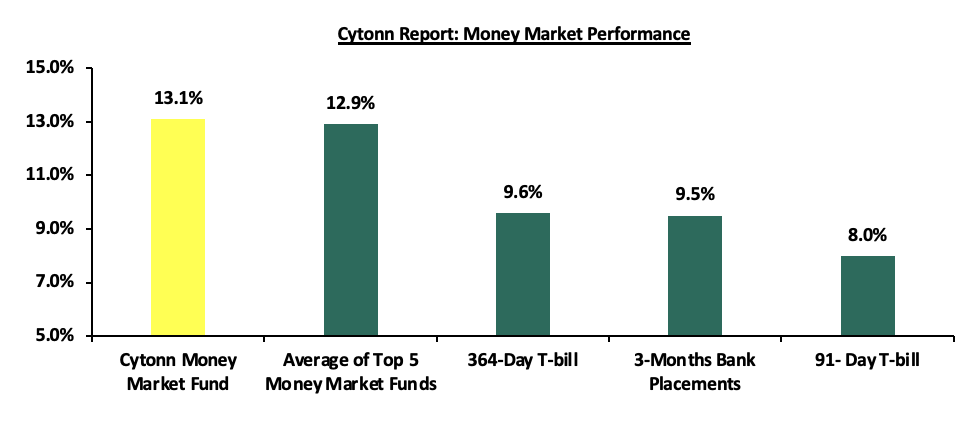
- Cytonn Money Market Fund closed the week at a yield of 13.1% p.a. To invest, dial *809# or download the Cytonn App from Google Play store here or from the Appstore here;
- We continue to offer Wealth Management Training every Tuesday, from 7:00 pm to 8:00 pm. The training aims to grow financial literacy among the general public. To register for any of our Wealth Management Trainings, click here;
- If interested in our Private Wealth Management Training for your employees or investment group, please get in touch with us through wmt@cytonn.com;
- Cytonn Insurance Agency acts as an intermediary for those looking to secure their assets and loved ones’ future through insurance namely; Motor, Medical, Life, Property, WIBA, Credit and Fire and Burglary insurance covers. For assistance, get in touch with us through insuranceagency@cytonn.com;
- Cytonn Asset Managers Limited (CAML) continues to offer pension products to meet the needs of both individual clients who want to save for their retirement during their working years and Institutional clients that want to contribute on behalf of their employees to help them build their retirement pot. To more about our pension schemes, kindly get in touch with us through pensions@cytonn.com;
Hospitality Updates:
- We currently have promotions for Staycations. Visit cysuites.com/offers for details or email us at sales@cysuites.com;
Money Markets, T-Bills Primary Auction:
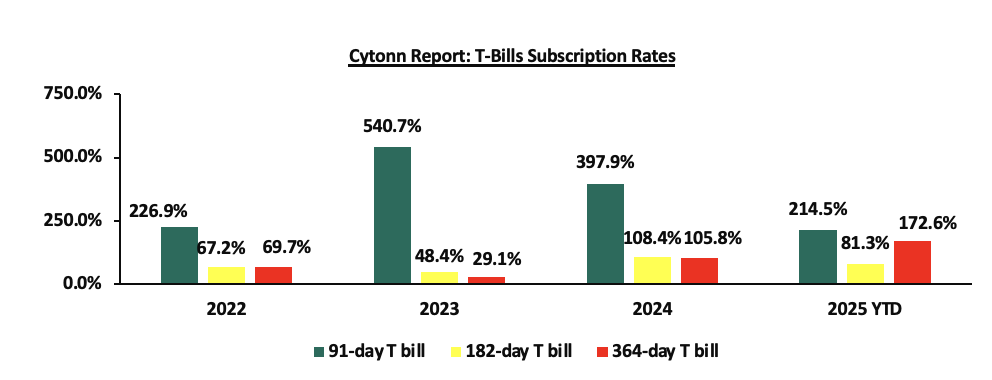
During the week, T-bills were oversubscribed for the third consecutive week, with the overall subscription rate coming in at 141.2%, higher than the subscription rate of 133.5% recorded the previous week. Investors’ preference for the shorter 91-day paper waned, with the paper receiving bids worth Kshs 5.9 bn against the offered Kshs 4.0 bn, translating to a subscription rate of 146.7%, albeit lower than the subscription rate of 499.2%, recorded the previous week. The subscription rate for the 182-day paper increased to 49.1% from the 18.0% recorded the previous week, while that of the 364-day paper increased to 231.0% from the 102.5% recorded the previous week. The government accepted a total of Kshs 29.5 bn worth of bids out of Kshs 33.9 bn bids received, translating to an acceptance rate of 87.2%. The yields on the government papers registered a mixed performance with the yields on the 182-day and 91-day paper decreasing by 1.7 bps and 1.3 bps to 8.03% and 7.98% respectively, from the 8.05% and 7.99% respectively recorded the previous week. The yields on the 364-day paper increased by 1.0 bp to 9.58% from the 9.57% recorded the previous week.
The chart below shows the yield growth rate for the 91-day paper in 2024 and during the year:
The charts below show the performance of the 91-day, 182-day and 364-day papers from January 2024 to August 2025:
The chart below compares the overall average T-bill subscription rates obtained in 2022,2023, 2024 and 2025 Year-to-date (YTD):
In the primary bond market, the Central Bank of Kenya released the auction results for the re-opened bond SDB1/2011/030, with a tenor to maturity of 15.5 years and a fixed coupon rate of 12.0%. The bond was undersubscribed, with the overall subscription rate coming in at 40.3%, receiving bids worth Kshs 8.1 bn against the offered Kshs 20.0 bn. The government accepted bids worth Kshs 2.4 bn, translating to an acceptance rate of 29.7%. The weighted average yield for the accepted bids for the bond came in at 14.0%. Notably, the 14.0% yield was similar to the 14.0% registered the last time the bond was reopened in June 2025. Given the 10.0% withholding tax on the bond, the tax equivalent yield for a normal bond with 15.0% withholding tax is 14.8% With the Inflation rate at 4.5% as of August 2025, the real return of the SDB1/2011/030 is 9.5%.
Money Market Performance:
In the money markets, 3-month bank placements ended the week at 9.5% (based on what we have been offered by various banks), The yield on the 91-day paper decreased by 1.3 bps to 7.98%, from the 7.99% recorded the previous week while the yield on the 364-day paper increased by 1.0 bps to 9.58% from the 9.57% recorded the previous week. The yield on the Cytonn Money Market Fund decreased by 7.0 bps to 13.1% to 13.2% recorded in the previous week, while the average yields on the Top 5 Money Market Funds decreased by 5.8 bps to 12.9% from 13.0% recorded the previous week.
The table below shows the Money Market Fund Yields for Kenyan Fund Managers as published on 5th September 2025:
|
Cytonn Report: Money Market Fund Yield for Fund Managers as published on 5th September 2025 |
||
|
Rank |
Fund Manager |
Effective Annual Rate |
|
1 |
Cytonn Money Market Fund ( Dial *809# or download Cytonn App) |
13.1% |
|
2 |
Gulfcap Money Market Fund |
13.1% |
|
3 |
Ndovu Money Market Fund |
13.1% |
|
4 |
Nabo Africa Money Market Fund |
12.9% |
|
5 |
Lofty-Corban Money Market Fund |
12.4% |
|
6 |
Etica Money Market Fund |
12.2% |
|
7 |
Arvocap Money Market Fund |
12.1% |
|
8 |
Kuza Money Market fund |
11.7% |
|
9 |
Orient Kasha Money Market Fund |
11.4% |
|
10 |
GenAfrica Money Market Fund |
11.2% |
|
11 |
Enwealth Money Market Fund |
11.2% |
|
12 |
Jubilee Money Market Fund |
11.2% |
|
13 |
British-American Money Market Fund |
10.9% |
|
14 |
Old Mutual Money Market Fund |
10.9% |
|
15 |
Madison Money Market Fund |
10.9% |
|
16 |
Apollo Money Market Fund |
10.3% |
|
17 |
Dry Associates Money Market Fund |
10.1% |
|
18 |
Faulu Money Market Fund |
10.0% |
|
19 |
Sanlam Money Market Fund |
9.4% |
|
20 |
Mali Money Market Fund |
9.3% |
|
21 |
KCB Money Market Fund |
9.3% |
|
22 |
CPF Money Market Fund |
9.3% |
|
23 |
ICEA Lion Money Market Fund |
9.2% |
|
24 |
Co-op Money Market Fund |
9.0% |
|
25 |
Genghis Money Market Fund |
9.0% |
|
26 |
Absa Shilling Money Market Fund |
8.9% |
|
27 |
Mayfair Money Market Fund |
8.6% |
|
28 |
CIC Money Market Fund |
8.5% |
|
29 |
AA Kenya Shillings Fund |
7.5% |
|
30 |
Ziidi Money Market Fund |
6.8% |
|
31 |
Stanbic Money Market Fund |
6.3% |
|
32 |
Equity Money Market Fund |
5.1% |
Source: Business Daily
Liquidity:
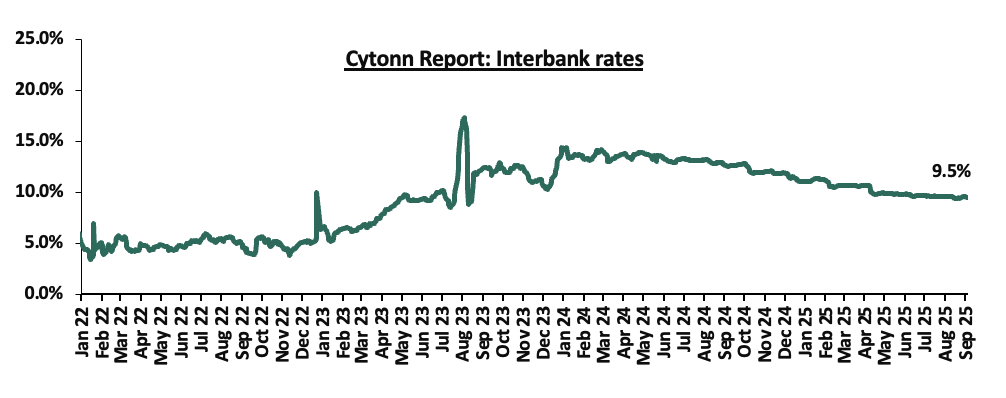
During the week, liquidity in the money markets marginally eased, with the average interbank rate decreasing by 2.4 bps, to 9.5% from the 9.6% recorded the previous week, partly attributable to tax remittances that were offset by government payments. The average interbank volumes traded decreased significantly by 76.7% to Kshs 8.2 bn from Kshs 35.2 bn recorded the previous week. The chart below shows the interbank rates in the market over the years:
Kenya Eurobonds:
During the week, the yields on Kenya’s Eurobonds were on a downward trajectory with the yield on the 10-year Eurobond issued in 2018 decreasing the most by 33.6 bps to 6.6% from 7.0% recorded the previous week. The table below shows the summary performance of the Kenyan Eurobonds as of 4th September 2025;
|
Cytonn Report: Kenya Eurobond Performance |
|||||||
|
|
2018 |
2019 |
2021 |
2024 |
2025 |
||
|
Tenor |
10-year issue |
30-year issue |
7-year issue |
12-year issue |
13-year issue |
7-year issue |
11-year issue |
|
Amount Issued (USD) |
1.0 bn |
1.0 bn |
0.9 bn |
1.2 bn |
1.0 bn |
1.5 bn |
1.5 bn |
|
Years to Maturity |
2.5 |
22.5 |
1.7 |
6.7 |
8.8 |
5.5 |
10.5 |
|
Yields at Issue |
7.3% |
8.3% |
7.0% |
7.9% |
6.2% |
10.4% |
9.9% |
|
2-Jan-25 |
9.1% |
10.3% |
8.5% |
10.1% |
10.1% |
10.1% |
|
|
1-Sep-25 |
7.8% |
10.3% |
- |
9.3% |
9.8% |
9.2% |
|
|
28-Aug-25 |
7.0% |
9.9% |
- |
8.8% |
9.3% |
8.5% |
|
|
29-Aug-25 |
6.8% |
9.8% |
- |
8.7% |
9.2% |
8.4% |
|
|
1-Sep-25 |
6.8% |
9.8% |
- |
8.7% |
9.2% |
8.4% |
|
|
2-Sep-25 |
6.9% |
9.9% |
- |
8.8% |
9.4% |
8.6% |
|
|
3-Sep-25 |
6.7% |
9.9% |
- |
8.7% |
9.2% |
8.4% |
|
|
4-Sep-25 |
6.6% |
9.7% |
- |
8.6% |
9.1% |
8.3% |
|
|
Weekly Change |
(0.3%) |
(0.2%) |
- |
(0.2%) |
(0.2%) |
(0.2%) |
- |
|
MTD Change |
(1.2%) |
(0.6%) |
- |
(0.8%) |
(0.7%) |
(0.8%) |
0.0% |
|
YTD Change |
(2.4%) |
(0.5%) |
- |
(1.5%) |
(1.0%) |
(1.8%) |
0.0% |
Source: Central Bank of Kenya (CBK) and National Treasury
Kenya Shilling:
During the week, the Kenya Shilling depreciated marginally against the US Dollar by 0.2 bps, to close the week at Kshs 129.2 to remain unchanged from the previous week. On a year-to-date basis, the shilling has appreciated by 5.1 bps against the dollar, a contrast to the 17.6% appreciation recorded in 2024.
We expect the shilling to be supported by:
- Diaspora remittances standing at a cumulative USD 5,079.9 mn in the twelve months to July 2025, 11.1% higher than the USD 4,571.7 mn recorded over the same period in 2024. These has continued to cushion the shilling against further depreciation. In July 2025 diaspora remittances figures, North America remained the largest source of remittances to Kenya accounting for 58.8% in the period,
- The tourism inflow receipts which came in at Kshs 452.2 bn in 2024, a 19.8% increase from Kshs 377.5 bn inflow receipts recorded in 2023, and owing to tourist arrivals that improved by 8.0% to 2,303,028 in the 12 months to February 2025 from 2,133,612 in the 12 months to February 2024, and,
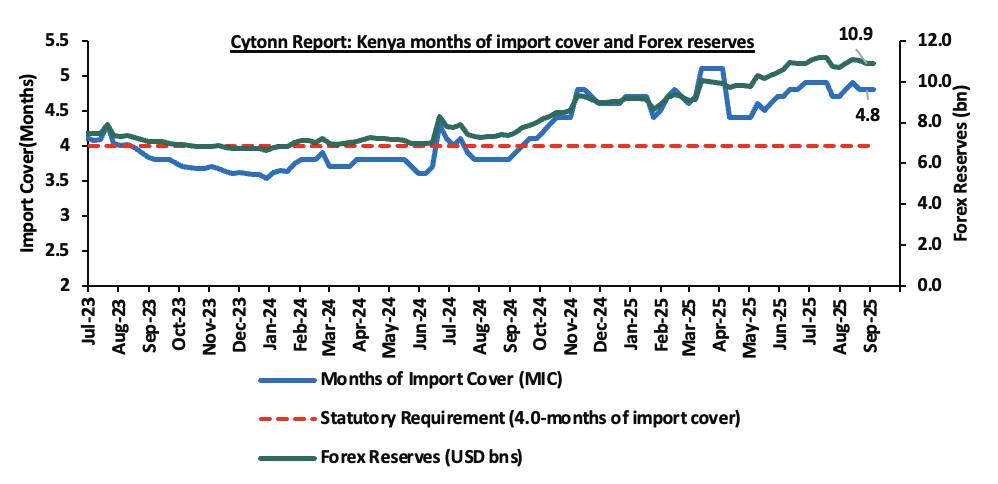
- Improved forex reserves currently at USD 10.9 bn (equivalent to 4.8-months of import cover), which is above the statutory requirement of maintaining at least 4.0-months of import cover and above the EAC region’s convergence criteria of 4.5-months of import cover.
The shilling is however expected to remain under pressure in 2025 as a result of:
- An ever-present current account deficit which came at 1.6% of GDP in the twelve months to June 2025, and,
- The need for government debt servicing, continues to put pressure on forex reserves given that 61.4% of Kenya’s external debt is US Dollar-denominated as of March 2025.
Key to note, Kenya’s forex reserves marginally increased by 0.1% during the week, to remain relatively unchanged from the USD 10.9 bn recorded in the previous week, equivalent to 4.8 months of import cover, and above the statutory requirement of maintaining at least 4.0-months of import cover and above the EAC region’s convergence criteria of 4.5-months of import cover.
The chart below summarizes the evolution of Kenya's months of import cover over the years:
Weekly Highlights
- Stanbic Bank’s August 2025 Purchasing Manager’s Index (PMI)
During the week, Stanbic Bank released its monthly Purchasing Managers’ Index (PMI) showing that business conditions in the private sector remained under pressure in August 2025, though the deterioration eased considerably. The headline PMI rose to 49.4 in August, up from 46.8 in July, signaling a much softer decline in operating conditions midway through the third quarter. While still below the neutral 50.0 threshold, the reading pointed to a near-stabilization in private sector activity following months of protest-related disruptions and weak sales. On a year-to-year basis, the index recorded 2.4% decrease from the 50.6 recorded in August 2024, indicating a slight deterioration in business conditions compared to the same period last year.
Business output contracted for the fourth consecutive month, though at a slower pace than in July. The downturn was largely driven by declines in the agriculture, construction and services sectors, while expansions in manufacturing and wholesale & retail helped cushion the fall. Similarly, new orders remained in negative territory, registering a fourth month of decline, but the contraction was marginal, the slowest in the period. Some firms cited persistent weakness in client purchasing power, whereas others reported a modest pickup in demand as political tensions eased and economic conditions stabilized.
On the employment front, hiring activity strengthened, with job numbers rising for the seventh consecutive month. The pace of job creation was the quickest since May 2024, supported by early signs of demand stabilization and greater optimism for future output. However, backlogs of work continued to fall, marking the third month of decline, as softer inflows of new business created spare capacity within firms. This suggests that despite improving labor market conditions, underlying demand pressures remain weak.
Purchasing activity also showed signs of recovery. Although input buying still fell in August, the rate of contraction was far milder compared to July’s 35-month low. In fact, some firms resumed procurement in anticipation of better demand, which helped lift inventories after a contraction in the previous month. Supplier performance improved notably, with average delivery times shortening at the fastest pace since October 2021, supported by greater competition among vendors.
On prices, Kenyan companies continued to face cost pressures, though the rate of input cost inflation softened for the first time in five months. Businesses reported solid but slower increases in purchase prices, largely tied to higher taxes on items such as fuel. Wage costs, however, rose at the fastest pace since October 2019, as firms adjusted salaries to accommodate the rising cost of living. Output price inflation eased to its lowest in 12 months, with only a small share of businesses raising charges. Some firms opted to offer discounts to stimulate demand, partially offsetting the pass-through of higher cost.
Overall, while business conditions remained subdued in August, the softer declines in output, new orders, and purchasing, alongside continued job creation and improved supplier performance, point to early signs of stabilization. Business confidence was at a 30-month high, with firms banking on new marketing strategies and product diversification to drive growth over the coming year. Key to note, a PMI reading of above 50.0 indicates an improvement in the business conditions, while readings below 50.0 indicate a deterioration. The chart below summarizes the evolution of PMI over the last 24 months:
Going forward, we expect the business environment to remain under pressure in the short to medium term, weighed down by creeping inflationary pressures, elevated fuel costs, and higher taxation, all of which continue to raise input costs and suppress consumer demand. The overall high cost of living will likely restrain spending power, keeping business activity subdued. However, the outlook is supported by a more accommodative monetary policy stance from the MPC, which should help lower borrowing costs and provide relief to the private sector. At the same time, improving political stability and renewed business confidence, which in August reached its highest level in two-and-a-half years, are expected to aid in stabilizing demand and laying the foundation for a gradual recovery in private sector activity.
Rates in the Fixed Income market have been on a downward trend due to high liquidity in the money market which allowed the government to front load most of its borrowing. The government is 223.9% ahead of its prorated net domestic borrowing target of Kshs 120.3, having a net borrowing position of Kshs 389.8 bn (inclusive of T-bills). However, we expect a stabilization of the yield curve in the short and medium term, with the government looking to increase its external borrowing to maintain the fiscal surplus, hence alleviating pressure in the domestic market. As such, we expect the yield curve to stabilize in the short to medium-term and hence investors are expected to shift towards the long-term papers to lock in the high returns
Market Performance:
During the week, the equities market was on an upward trajectory, with NSE 20 gaining the most by 4.3%, while NASI, NSE 10 and NSE 25 gained by 3.3%, 2.9% and 2.5% respectively, taking the YTD performance to gains of 44.2%, 42.2%, 32.5% and 31.7% for NSE 20, NASI, NSE 10 and NSE 25 respectively. The equities market performance was driven by gains recorded by large-cap stocks such as DTB-K, Coop Bank and Safaricom of 15.9%, 14.0% and 4.7% respectively. The performance was, however, weighed down by losses recorded by large cap stocks such as KCB, Stanbic and Equity of 6.0%, 1.2% and 0.9% respectively.
Additionally, in the regional equities market, the East African Exchanges 20 (EAE 20) share index gained by 22.1 bps, attributable to gains recorded by large cap stocks such as ABSA, Quality Chemicals Industry and Safaricom of 2.8%, 2.2% and 1.9% respectively. The performance was, however, weighed down by losses recorded by large cap stocks such as Tanzania Breweries Limited, CRDB Bank and Tanga Cement Company Limited of 2.6%, 1.7% and 0.1% respectively.
During the week, equities turnover increased by 126.3% to USD 55.3 mn, from USD 24.4 mn recorded the previous week, taking the YTD total turnover to USD 659.4mn. Foreign investors became net sellers for the first time in five weeks, with a net selling position of USD 9.1 mn, from a net buying position of USD 3.5 mn recorded the previous week, taking the YTD foreign net selling position to USD 27.9 mn, compared to a net selling position of USD 16.9 mn in 2024.
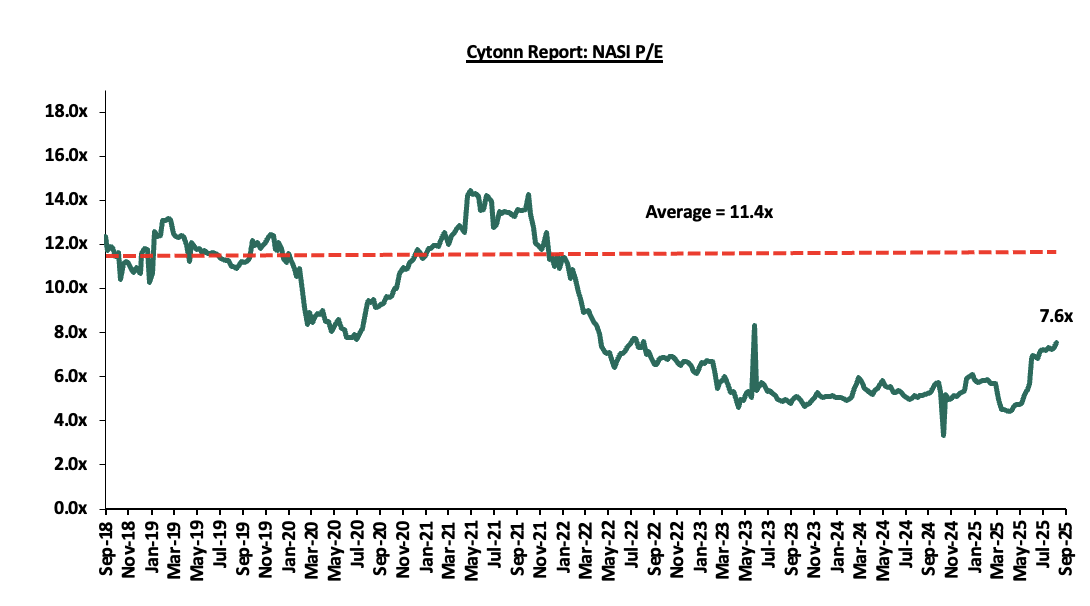
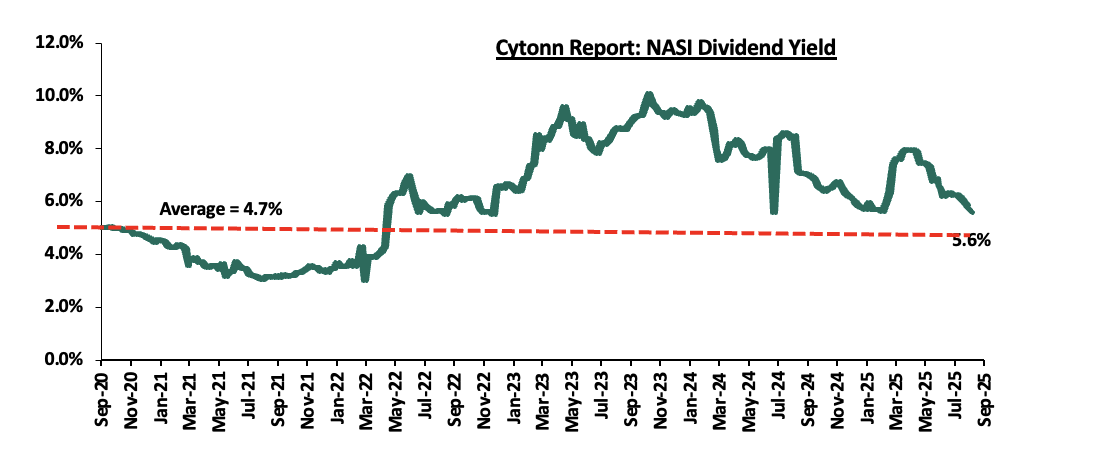
The market is currently trading at a price-to-earnings ratio (P/E) of 7.6x, 33.7% below the historical average of 11.4x. The dividend yield stands at 5.6%, 0.9% points above the historical average of 4.7%. Key to note, NASI’s PEG ratio currently stands at 0.9x, an indication that the market is undervalued relative to its future growth. A PEG ratio greater than 1.0x indicates the market is overvalued while a PEG ratio less than 1.0x indicates that the market is undervalued. The charts below indicate the historical P/E and dividend yields of the market;
|
Cytonn Report: Equities Universe of Coverage |
|||||||||||
|
Company |
Price as at 29/08/2025 |
Price as at 05/09/2025 |
w/w change |
YTD Change |
Year Open 2025 |
Target Price* |
Dividend Yield |
Upside/ Downside** |
P/TBv Multiple |
Recommendation |
|
|
Standard Chartered Bank |
320.0 |
325.0 |
1.6% |
13.9% |
285.3 |
393.4 |
13.8% |
34.9% |
1.9x |
Buy |
|
|
ABSA Bank |
20.1 |
20.8 |
3.2% |
10.1% |
18.9 |
23.5 |
8.4% |
21.7% |
1.3x |
Buy |
|
|
Equity Group |
56.0 |
55.5 |
(0.9%) |
15.6% |
48.0 |
61.7 |
7.7% |
18.8% |
1.0x |
Accumulate |
|
|
Stanbic Holdings |
182.5 |
180.3 |
(1.2%) |
29.0% |
139.8 |
193.4 |
11.5% |
18.8% |
1.1x |
Accumulate |
|
|
NCBA |
64.3 |
66.0 |
2.7% |
29.4% |
51.0 |
72.3 |
8.3% |
17.9% |
1.1x |
Accumulate |
|
|
KCB Group |
54.3 |
51.0 |
(6.0%) |
20.3% |
42.4 |
56.1 |
5.9% |
15.9% |
0.6x |
Accumulate |
|
|
Co-op Bank |
17.8 |
20.3 |
14.0% |
16.3% |
17.5 |
21.6 |
7.4% |
13.7% |
0.7x |
Accumulate |
|
|
Diamond Trust Bank |
89.8 |
104.0 |
15.9% |
55.8% |
66.8 |
108.9 |
6.7% |
11.4% |
0.4x |
Accumulate |
|
|
I&M Group |
38.7 |
40.2 |
3.9% |
11.5% |
36.0 |
41.2 |
7.5% |
10.1% |
0.7x |
Accumulate |
|
|
Britam |
9.0 |
8.9 |
(1.8%) |
52.2% |
5.8 |
9.5 |
0.0% |
7.4% |
0.8x |
Hold |
|
|
Jubilee Holdings |
294.5 |
305.3 |
3.7% |
74.7% |
174.8 |
312.9 |
4.4% |
6.9% |
0.5x |
Hold |
|
|
CIC Group |
4.7 |
5.3 |
12.1% |
147.7% |
2.1 |
4.0 |
2.5% |
(21.5%) |
1.4x |
Sell |
|
|
*Target Price as per Cytonn Analyst estimates **Upside/ (Downside) is adjusted for Dividend Yield ***Dividend Yield is calculated using FY’2024 Dividends |
|||||||||||
We are “Bullish” on the Equities markets in the short term due to current cheap valuations, lower yields on short-term government papers and expected global and local economic recovery, and, “Neutral” in the long term due to persistent foreign investor outflows. With the market currently trading at a discount to its future growth (PEG Ratio at 0.9x), we believe that investors should reposition towards value stocks with strong earnings growth and that are trading at discounts to their intrinsic value. We expect the current high foreign investors sell-offs to continue weighing down the economic outlook in the short term.
- Mixed- Use Sector
- Hounen enters Africa with Real Estate development in Tatu City
During the week, Houen, a global real estate developer and solar energy manufacturer, joined the Tatu City Special Economic Zone (SEZ) with plans for a major mixed-use project. The company is investing in solar product manufacturing alongside its real estate initiatives. Their development will span 43,500 SQM within Tatu City’s living and business district. The project will include a blend of office, retail, commercial, and residential spaces. As part of the plan, four high-rise towers ranging from 21 to 26 storeys will be constructed.
Houen’s move signals growing global investor confidence in Kenya’s real estate market—particularly in master-planned developments like Tatu City. This could encourage more foreign direct investment (FDI), boosting the sector’s growth and credibility
Hounen also announced its intention to develop additional real estate projects at Tatu City, including a retail village and executive residences.
Tatu City, Rendeavour’s flagship development in Kenya, welcomes 25,000 people daily who live, work, and study within its dynamic community. The city is home to more than 100 companies, either operational or under development, representing over USD 3.0 bn in investment from Kenya, United States, China, United Kingdom, Norway, United Arab Emirates, New Zealand, Switzerland, Spain, Germany, the Netherlands, and South Africa, as well as major international institutions such as the World Bank, African Development Bank, British Investment International, U.S. International Development Finance Corporation, Finnfund, Norfund, Soros Economic Development Fund, and Grand Challenges Canada.
- Real Estate Investments Trusts (REITs)
On the Unquoted Securities Platform, Acorn D-REIT and I-REIT traded at Kshs 27.4 and Kshs 23.2 per unit, respectively, as per the last updated data on 5th September 2025. The performance represented a 37.0% and 16.0% gain for the D-REIT and I-REIT, respectively, from the Kshs 20.0 inception price. Additionally, ILAM Fahari I-REIT traded at Kshs 11.0 per share as of 29th August 2025, representing a 45.0% loss from the Kshs 20.0 inception price. The volumes traded for the D-REIT and I-REIT came in at Kshs 12.8 mn and Kshs 39.8 mn shares, respectively, with a turnover of Kshs 323.5 mn and Kshs 791.5 mn, respectively, since inception in February 2021. Additionally, ILAM Fahari I-REIT traded at Kshs 11.0 per share as of 5th September 2025, representing a 45.0% loss from the Kshs 20.0 inception price. The volume traded to date came in at 1,235,285 shares for the I-REIT, with a turnover of Kshs 1.5 mn since inception in November 2015.
REITs offer various benefits, such as tax exemptions, diversified portfolios, and stable long-term profits. However, the ongoing decline in the performance of Kenyan REITs and the restructuring of their business portfolios are hindering significant previous investments. Additional general challenges include:
- Insufficient understanding of the investment instrument among investors leading to a slower uptake of REIT products,
- Lengthy regulatory approval processes for REIT creation,
- High minimum capital requirements of Kshs 100.0 mn for REIT trustees compared to Kshs 10.0 mn for pension funds Trustees, essentially limiting the licensed REIT Trustee to banks only
- The rigidity of choice between either a D-REIT or and I-REIT forces managers to form two REITs, rather than having one Hybrid REIT that can allocate between development and income earning properties
- Limiting the type of legal entity that can form a REIT to only a trust company, as opposed to allowing other entities such as partnerships, and companies,
- We need to give time before REITS are required to list – they would be allowed to stay private for a few years before the requirement to list given that not all companies may be comfortable with listing on day one, and,
- Minimum subscription amounts or offer parcels set at Kshs 0.1 mn for D-REITs and Kshs 5.0 mn for restricted I-REITs. The significant capital requirements still make REITs relatively inaccessible to smaller retail investors compared to other investment vehicles like unit trusts or government bonds, all of which continue to limit the performance of Kenyan REITs.
We expect Kenya’s Real Estate sector to remain resilient, supported by: i) increased global investor confidence as shown by the entrance of Hounen’s entrance into Tatu City ii) continued public and private sector investment in housing and infrastructure under initiatives such as the Affordable Housing Programme, However, challenges including high capital requirements and regulatory constraints for REITs, rising construction costs, strain on infrastructure, and oversupply in select market segments will continue to limit optimal performance by constraining development pipelines and deterring some investor participation.
According to the ACTSERV Q2’2025 Retirement Benefits Schemes Investments Performance Survey, segregated retirement benefits schemes recorded a 6.6% return in Q2’2025, remaining unchanged from the return recorded in Q2’2024. The performance was largely supported by the performance of Equities investments made by the schemes which recorded an 21.5% gain, 21.2% points above from the 0.3% return recorded in Q2’2024, on the back of strong gains posted by the Nairobi All Share Index (NASI) of 17.3%, driven by driven by robust corporate earnings, favourable valuations, increased foreign investor inflows, and continued monetary policy easing. This week, we shall focus on understanding Retirement Benefits Schemes and look into the quarterly performance and current state of retirement benefits schemes in Kenya with a key focus on Q2’2025.
In recent industry news, treasury data revealed that for the first nine months of the FY’2024/2025, as of March 2025, Kshs 30.1 bn of pension perks were not released to pensioners, citing delays in funding pensions and system downtime. Notably Kshs 131.9 bn was processed for payment during the period, however, the exchequer released only Kshs 101.8 bn. Similarly, Kshs 11.7 bn funding request for the Government of Kenya’s employer contributions to the Public Service Superannuation Scheme (PSSS) remained unresolved in the nine months to March 2025. This brought back to light the biggest challenge that the country’s civil servants' pension system has had, the overreliance on the exchequer for payment of benefits. As of 30th June 2025, pensions and gratuities Exchequer issues came in at Kshs 207.2 bn, equivalent to 92.9% of the revised estimates III of Kshs 223.1 bn. The Government had operated a defined benefits (non-contributory) Pension Scheme since independence fully financed through the Exchequer. Given the clear challenges that this system had and the need for reforms in the Public Service Pensions Sector, the Government enacted the Public Service Superannuation Scheme Act 2012. The Act set up the Public Service Superannuation Scheme in 2021, converting all the defined benefit schemes in the public sector to one defined contributions scheme to align with the best practices in the industry. The now new system took in all government officers below 45 years, and gave those above that age the option to join the new system while closing any new entrants to the previous system. Currently, employees in the scheme contribute 7.5% of their basic salary, while the government contributes 15.0%.
We have been tracking the performance of Kenya’s Pension schemes with the most recent topicals being,
The Progress of Retirement Benefits Schemes in Kenya, done in May 2025. This week, we shall focus on understanding Retirement Benefits Schemes and looking into the historical and current state of retirement benefits schemes in Kenya and what can be done going forward. We shall also analyze other asset classes that the schemes can tap into to achieve higher returns. Additionally, we shall look into factors and challenges influencing the growth of the RBSs in Kenya as well as the actionable steps that can be taken to improve the pension industry. We shall do this by looking into the following:
- Introduction to Retirement Benefits Schemes in Kenya,
- Historical and Current State of Retirement Benefits Schemes in Kenya,
- Factors Influencing the Growth of Retirement Benefits Scheme in Kenya,
- Challenges that Have Hindered the Growth of Retirement Benefit Schemes, and,
- Recommendations on Enhancing the Performance of Retirement Benefits Schemes in Kenya;
Section I: Introduction to Retirement Benefits Schemes in Kenya
A retirement benefits scheme is a savings avenue that allows contributing individuals to make regular contributions during their productive years into the scheme and thereafter get income from the scheme upon retirement. These schemes offer a range of benefits, including income replacement to maintain one’s lifestyle post-employment, compounded and tax-free interest that accelerates savings growth, and substantial tax incentives, such as monthly reliefs of up to Kshs 30,000 and exemptions on pension withdrawals after 20 years, under the Tax Amendment Act, 2024. Beyond financial independence, which reduces reliance on family support, the schemes also support home ownership through structured access to pension savings, allowing members to either assign up to 60% of their benefits for mortgage guarantees or utilize up to 40% (capped at Kshs 7 million) for direct residential house purchases. These features make retirement benefits schemes a vital pillar of personal financial planning and national economic resilience.
Section II: Historical and the Current State of Retirement Benefits Schemes in Kenya
- Growth of Retirement Benefits Schemes
According to the latest Retirement Benefits Authority (RBA) Industry Report for December 2024, , assets under management increased by 30.7% to Kshs 2.3 tn from the Kshs 1.7 tn recorded in December 2023. The growth of the assets was majorly attributed to the increase in contributions to the mandatory National Social Security Fund (NSSF) scheme, through the rollout of the second phase of the NSSF Act, 2013 which took effect in February 2024 significantly boosting retirement savings. Under Phase 2, the lower earnings limit increased from Kshs 6,000.0 to Kshs 7,000.0, while the upper earnings limit doubled from Kshs 18,000.0 to Kshs 36,000.0. As such, the NSSF AUM increased by 45.3% to Kshs 476.8 bn in December 2024, from Kshs 328.1 bn in December 2023. Additionally, the improved market and economic conditions during the period as evidenced by improved business conditions, eased inflationary pressures and stability of the exchange rate led to the growth in investment income for the schemes. In February 2025, the third phase of the NSSF contribution limit adjustment was successfully implemented, marking a significant milestone in Kenya’s pension reform journey. This upward revision has already begun to strengthen the retirement benefits sector by boosting individual savings and accelerating the growth of overall Assets Under Management (AUM). The enhanced contributions are expected to deepen long-term investment capacity and improve income security for future retirees, reinforcing the sector’s role in national economic development. Notably, the AUM increased by 14.0% to Kshs 2.3 tn in December 2024 from the Kshs 2.0 tn recorded in June 2024.
The graph below shows the growth of Assets under Management of the retirement benefits schemes over the last 10 years:
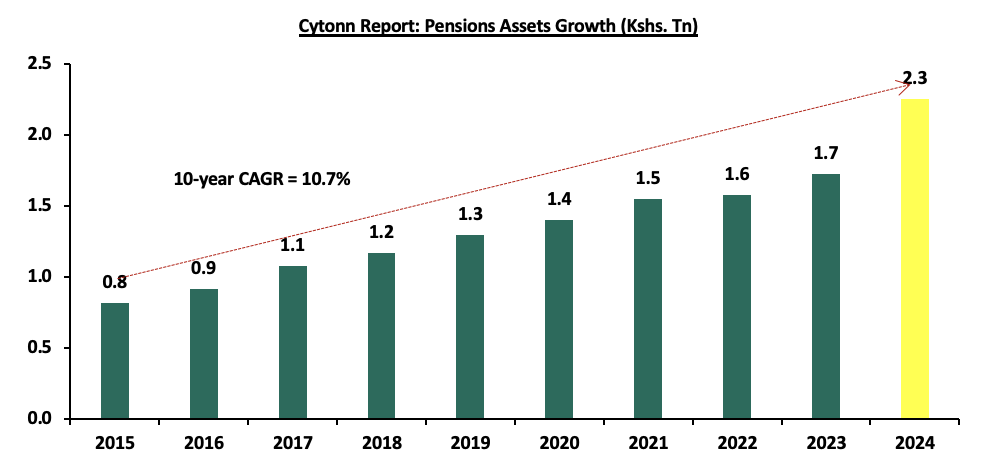
Pensions AUM increased by 30.7% to Kshs 2.3 tn in December 2024 from the Kshs 1.7 tn recorded in December 2023. The pension industry AUM has been on an upward trajectory for the last 10 years, recording a CAGR of 10.7% to Kshs 2.3 tn in 2024 from Kshs 0.8 tn in 2015. The notable 30.7% jump in AUM marks the highest year-on year growth within the decade. This surge is largely attributable to improved market conditions with NASI gaining by 34.3% in 2024 and improved investment income from fixed income investments resulting from a stable macroeconomic environment, coupled with enhanced NSSF contributions from employers and employees, with contributions increasing by 133.4% to Kshs 59.3 bn in 2024, from Kshs 25.4 bn in 2023The primary goal of the Act was to broaden the NSSF’s benefit coverage, range, and scope as well as improve the adequacy of benefits paid out of the scheme by the Fund amongst others.
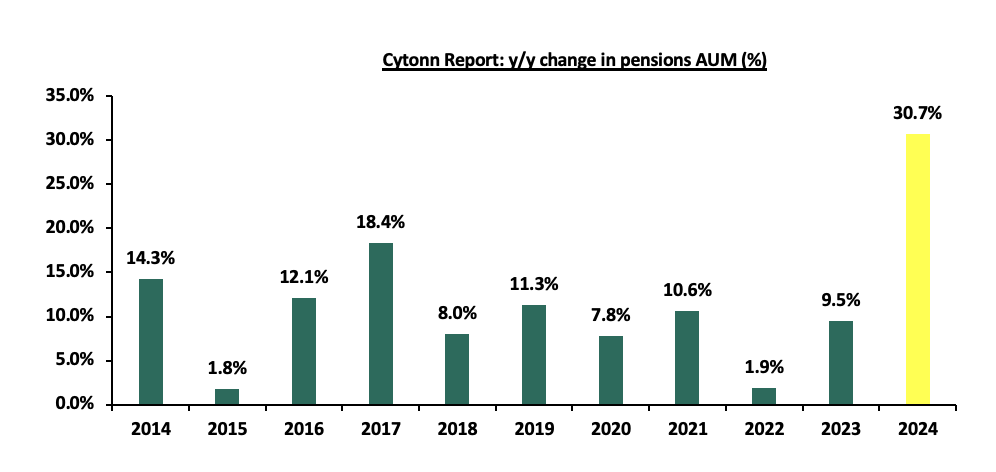
The chart below shows the y/y changes in the assets under management for the schemes over the years.
In Kenya, pension funds hold a substantial share of financial assets, consistently growing due to mandatory and voluntary contributions under the National Social Security Fund (NSSF) Act of 2013 regulations. In comparison, bank deposits remain the largest financial pool, reflecting their role as the primary savings vehicle driven by their liquidity, security, and accessibility, though they offer lower returns. Capital markets products, including unit trusts, REITs, are relatively smaller highlighting the nascent stage of capital markets in Kenya, but expanding as investors seek diversification and higher yields. SACCOs play a crucial role in cooperative-based savings and credit access, especially for middle-income earners.
The graph below shows the Assets under Management of Pensions against other Capital Markets products and bank deposits:
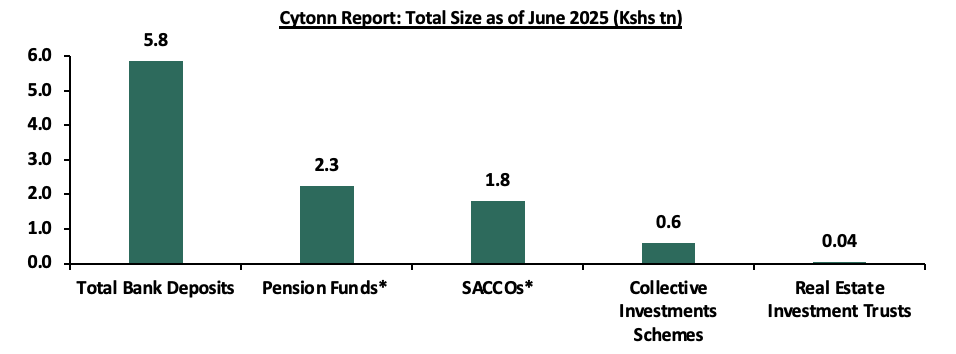
Sources: CMA, RBA, SASRA and REIT Financial Statements, *as of December 2024
The increase in Kenya’s pension-to-GDP ratio by 1.8% points to 14.6% in 2024 from 12.8% in 2023, driven by a 30.7% increase in pension Assets Under Management (AUM) to Kshs 2.3 bn, significantly outpaced the country’s GDP growth rate, which declined to record a growth of 4.7% in FY’2024, compared to 5.7% in FY’2023. This disparity implies that the pension sector is expanding at a much faster rate than the broader economy, reflecting stronger savings mobilization, improved investment returns, and possibly increased compliance or contribution levels following regulatory reforms. However, the 14.6% is significantly lower than that of developed countries such as the United States at 169.5%, Australia at 132.6%, and the United Kingdom at 124.2%, reflecting the maturity and depth of their pension systems. In Sub-Saharan Africa region, Kenya outperforms countries like Malawi at 11.7%, Uganda at 9.0% and Nigeria at 8.0%, but still lags behind Namibia at 100.4% and South Africa at 83.8%. This positioning indicates that while Kenya’s pension sector is growing steadily, particularly with recent reforms, there remains considerable room for expansion and deeper integration into the national economy. The graph below shows select countries’ pension assets to GDP ratio:
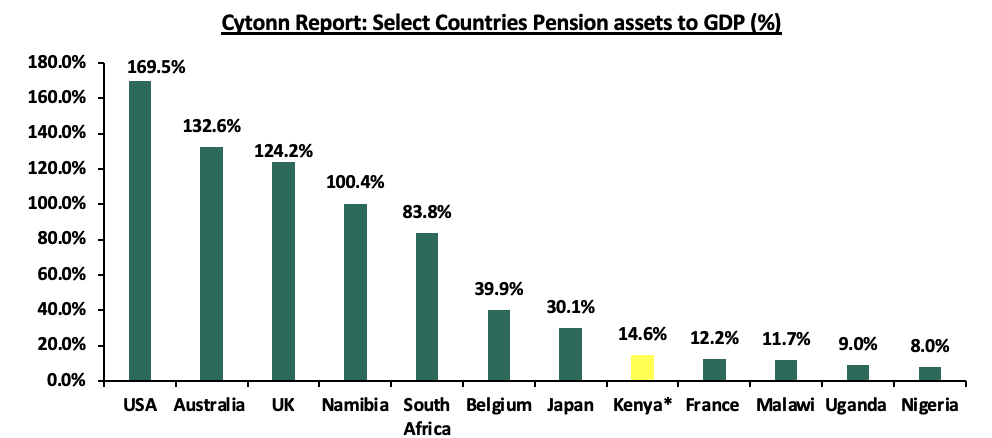
Source: World Bank , *data as of Dec 2024
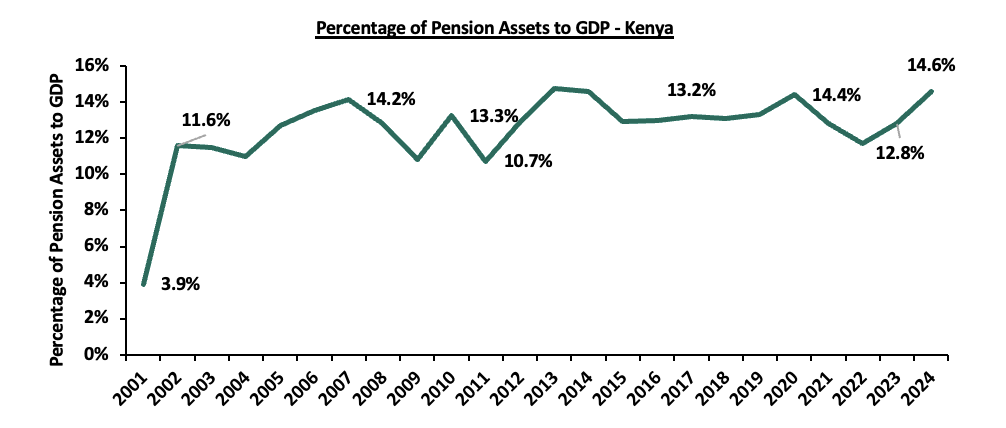
The graph below shows Kenya’s pension to GDP ratio over the years:
- Retirement Benefits Schemes Allocations and Various Investment Opportunities
Retirement Benefits Schemes aim to protect members’ savings while achieving competitive long-term returns by investing across various asset classes. Schemes have invested in traditional asset classes such as equities and fixed income securities, which offer a balance between risk and return. However, to enhance portfolio performance and diversify risk, they have increasingly explored alternative asset classes such as real estate, private equity, offshore funds and other non-traditional asset classes. Investing in alternative assets provides opportunities for higher returns, hedge against inflation and exposure to long-term growth sectors. The choice and proportion of these investments are determined by each scheme’s Investment Policy Statement (IPS), which sets out guidelines for risk tolerance, liquidity needs and return objectives. As such, the performance of Retirement Benefits Schemes in Kenya depends on a number of factors such as;
- Asset allocation,
- Selection of the best-performing security within a particular asset class,
- Size of the scheme,
- Risk appetite of members and investors, and,
- Investment horizon.
The Retirement Benefits (Forms and Fees) Regulations, 2000 offers investment guidelines for retirement benefit schemes in Kenya in terms of the asset classes to invest in and the limits of exposure to ensure good returns and that members’ funds are hedged against losses. According to RBA’s Regulations, the various schemes through their Trustees should formulate their own Investment Policy Statements (IPS) to Act as a guideline on how much to invest in the asset option and assist the trustees in monitoring and evaluating the performance of the Fund. However, the Investment Policy Statements often vary depending on risk-return profile and expectations mainly determined by factors such as the scheme’s demography and the economic outlook.
The RBA’s Investments regulations and policies underscore diversification as a foundational strategy for managing pension fund assets. Schemes are constrained by explicit exposure limits across different asset classes, helping mitigate market risks and ensuring that no single investment dominates the fund’s performance. To guide investment decisions and risk management, trustees must draft and regularly update an Investment Policy Statement (IPS), typically every three years, to reflect evolving market conditions, economic trends, and the shifting priorities and demographics of scheme members. This dynamic stewardship promotes alignment with long-term objectives, accountability, and transparency. Under current regulations, schemes may invest up to: 90% in government bonds, 70% in quoted equities, 30% in immovable property, 15% in offshore markets and 10% in private equity. While these broad boundaries support prudent diversification and inflation protection, schemes historically skew allocations toward traditional assets like government securities and equities. The IPS plays a critical role in encouraging broader inclusion of alternative and offshore investments to enhance returns and resilience. The table below represents how the retirement benefits schemes have invested their funds in the past:
|
|
Cytonn Report: Kenyan Pension Funds’ Assets Allocation |
|||||||||||||
|
Asset Class |
2014 |
2015 |
2016 |
2017 |
2018 |
2019 |
2020 |
2021 |
2022 |
2023 |
2024 |
Average |
Limit |
|
|
Government Securities |
31.0% |
29.8% |
38.3% |
36.5% |
39.4% |
42.0% |
44.7% |
45.7% |
45.8% |
47.5% |
52.5% |
41.2% |
90.0% |
|
|
Immovable Property |
17.0% |
18.5% |
19.5% |
21.0% |
19.7% |
18.5% |
18.0% |
16.4% |
15.8% |
14.0% |
11.1% |
17.2% |
30.0% |
|
|
Quoted Equities |
26.0% |
23.0% |
17.4% |
19.5% |
17.3% |
17.6% |
15.6% |
16.5% |
13.7% |
8.4% |
9.0% |
16.7% |
70.0% |
|
|
Guaranteed Funds |
11.0% |
12.2% |
14.2% |
13.2% |
14.4% |
15.5% |
16.5% |
16.8% |
18.9% |
20.8% |
19.4% |
15.7% |
100.0% |
|
|
Fixed Deposits |
5.0% |
6.8% |
2.7% |
3.0% |
3.1% |
3.0% |
2.8% |
1.8% |
2.7% |
4.8% |
2.4% |
3.5% |
30.0% |
|
|
Listed Corporate Bonds |
6.0% |
5.9% |
5.1% |
3.9% |
3.5% |
1.4% |
0.4% |
0.4% |
0.5% |
0.4% |
0.3% |
2.5% |
20.0% |
|
|
Offshore |
2.0% |
0.9% |
0.8% |
1.2% |
1.1% |
0.5% |
0.8% |
1.3% |
0.9% |
1.6% |
2.9% |
1.3% |
15.0% |
|
|
Cash |
1.0% |
1.4% |
1.4% |
1.2% |
1.1% |
1.2% |
0.9% |
0.6% |
1.1% |
1.5% |
1.0% |
1.1% |
5.0% |
|
|
Unquoted Equities |
1.0% |
0.4% |
0.4% |
0.4% |
0.3% |
0.3% |
0.2% |
0.2% |
0.3% |
0.2% |
0.2% |
0.4% |
5.0% |
|
|
REITs |
0.0% |
0.0% |
0.1% |
0.1% |
0.1% |
0.0% |
0.0% |
0.0% |
0.0% |
0.6% |
0.5% |
0.1% |
30.0% |
|
|
Private Equity |
0.0% |
0.0% |
0.0% |
0.0% |
0.1% |
0.1% |
0.1% |
0.2% |
0.2% |
0.3% |
0.7% |
0.2% |
10.0% |
|
|
Others e.g. unlisted commercial papers |
0.0% |
0.0% |
0.0% |
0.0% |
0.0% |
0.0% |
0.0% |
0.1% |
0.2% |
- |
0.0% |
0.0% |
10.0% |
|
|
Commercial Paper, non-listed bonds by private companies |
- |
- |
- |
0.0% |
0.0% |
0.0% |
0.0% |
0.0% |
0.0% |
0.0% |
0.1% |
0.0% |
10.0% |
|
|
Total |
100.0% |
100.0% |
100.0% |
100.0% |
100.0% |
100.0% |
100.0% |
100.0% |
100.0% |
100.0% |
100.0% |
100.0% |
100.0% |
|
Source: Retirement Benefits Authority
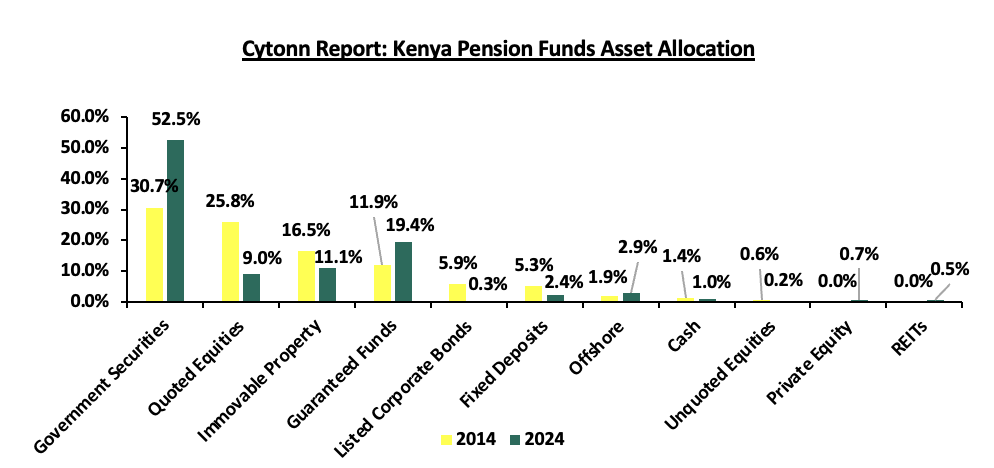
Retirement benefits schemes have for a long time skewed their investments towards traditional assets, mostly, government securities and the equities market, averaging 57.9% as of 31st December 2024 for the two asset classes, leaving only 42.1% for the other asset classes. However, as pension schemes seek higher returns, diversification, and inflation hedging, there has been a growing shift towards alternative investments that include immovable property, private equity as well as Real Estate Investments Trusts (REITs). It is vital to note, that in 2024 the second largest increase in allocation was recorded in investments in private equity by 182.2% to Kshs 16.2 bn from Kshs 5.7 bn recorded in 2023 and investments in Real Estate Investments Trusts increased by 5.2% to Kshs 11.7 bn in 2024 from Kshs 11.1 bn in 2023. However, allocation to immovable property increased by 2.9% to Kshs 249.2bn in 2024 from Kshs 242.1 bn in 2023.
Key Take-outs from the table above are;
- Schemes in Kenya allocated an average of 57.9% of their members’ funds towards government securities and Quoted Equities between the period of 2014 and end of 2024. The 41.2% average allocation to government securities is the highest among the asset classes attributable to safety assurances of members’ funds because of low-risk associated with government securities. Notably, allocation towards government securities increased by 5.0% points to 52.5% in 2024 from 47.5% in 2023 attributable to high yields by the government papers and increased issuance of treasury bonds to finance fiscal deficits as well as increase domestic borrowing during the period,
- The allocation towards quoted equities increased by 0.6% points to 9.0% in 2024, from 8.4% in 2023 on the back of improved performance in the Kenyan equities market as evidenced by 34.3% gain by the NASI index in 2024, driven by a recovery in corporate earnings and increased investor confidence. Favourable macroeconomic conditions, such as easing inflation and a strengthened shilling, boosted market sentiment, have encouraged trustees to allocate more funds to equities during the period, and,
- Retirement Benefits Schemes investments in offshore markets increased by 1.3% points to 2.9% in 2024, from 1.6% in 2023 as a result of the opportunities in developed and emerging markets, and currency hedging strategies that allowed schemes to benefit from foreign exchange gains.
The chart below shows the allocation by pension schemes on the three major asset classes over the years:
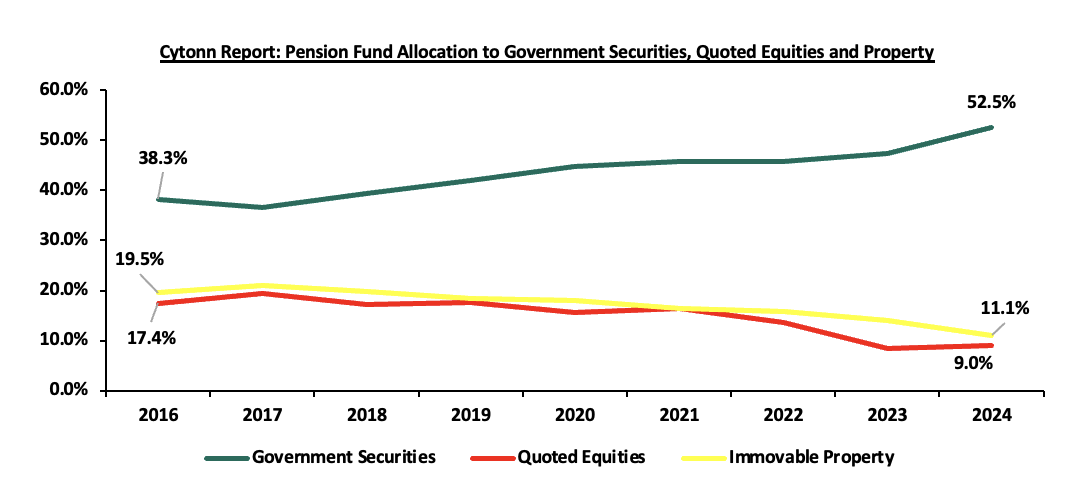
Source: RBA Industry report
Additionally, according to ACTSERV, in Q2’2025, segragated pension schemes maintained a conservative asset allocation strategy, with 81.3% of investments directed toward fixed income instruments, reflecting a strong preference for stability and predictable returns. Equities accounted for 15.8%, indicating moderate exposure to growth opportunities, while offshore investments stood at 2.7%, suggesting limited diversification beyond domestic markets. This allocation mix highlights a cautious investment approach focused on capital preservation and steady income generation. This relatively low exposure to alternative and international asset classes highlights a conservative investment posture, with the majority of assets still concentrated in fixed income and domestic equities. While offshore investments have delivered strong returns over multi-year periods, their limited uptake suggests untapped potential for diversification and long-term growth within the pension sector.
Performance of the Retirement Benefit Schemes
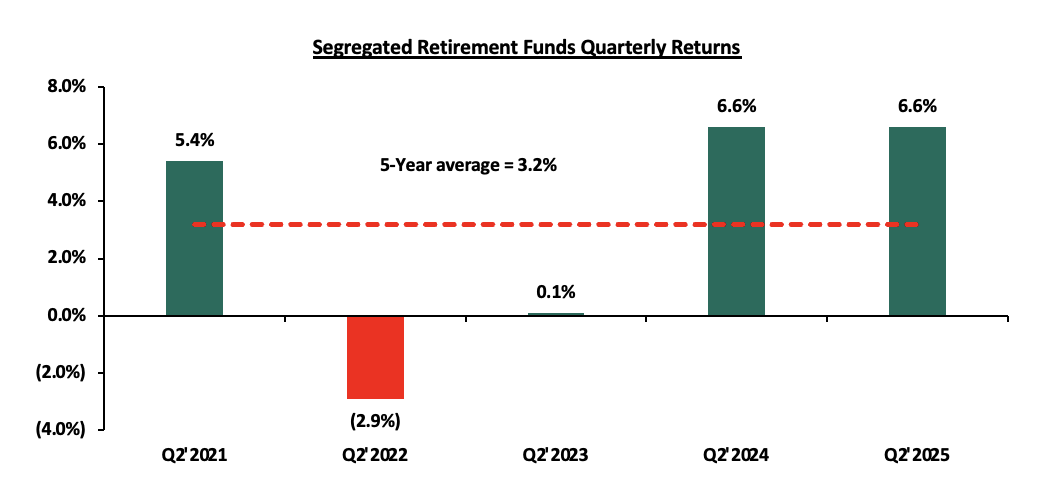
According to the ACTSERV Q2’2025 Pension Schemes Investments Performance Survey, the five-year average return for segregated schemes over the period 2021 to 2025 was 3.2% with the performance fluctuating over the years to a high of 6.6% in Q2’2024 and Q2’2025, and a loss of 2.9% in Q2’2022 reflective of the markets performance. Notably, segregated retirement benefits scheme returns remained unchanged at a 6.6% return in Q2’2025, similar to the gain recorded in Q2’2024. The performance in overall returns was largely driven by the 21.0% points increase in returns from Equities to 21.5% from a gain of 0.5% in Q2’2024 attributable to the increased corporate earnings and attractive valuations as well as the 13.1% gain from fixed income. The performance was however weighed down by the 4.0% points decline in the Fixed Income returns to 4.0%, from 8.0% in Q2’2024 majorly attributable to the continuous easing of the CBR by the CBK which led to a falling yield curve. The chart below shows the quarterly performance of segregated pension schemes since 2021:
The key take-outs from the graph include:
- Schemes recorded a 6.6% gain in Q2’2025, remaining unchanged from the gain recorded in Q2,2024. The performance was largely driven by an 21.5% gain in equities investments in comparison to the 0.5% gain recorded in Q2’2024, largely attributable to attractive valuations, strong corporate earnings and dividend declaration. Offshore assets also registered increased returns, recording a 13.1% in Q2’2025, from the 1.6% gain recorded in Q2’2024, a significant 11.5% points increase, majorly on the back of easing monetary and fiscal policies and,
- Returns from segregated retirement funds have exhibited significant fluctuations over the last five years, ranging from a high of 6.6% recorded in both Q2’2024 and Q2’2025 to a low of (2.9%) in Q2’2022, highlighting the sensitivity of fund performance to market and economic conditions.
The survey covered the performance of asset classes in three broad categories: Fixed Income, Equity, Offshore, and Overall Return.
Below is a graph showing the second quarter performances over the period 2021-2025:
|
Cytonn Report: |
Quarterly Performance of Asset Classes (2020 – 2024) |
|
|
||||
|
|
Q2'2021 |
Q2'2022 |
Q2'2023 |
Q2'2024 (a) |
Q2'2025 (b) |
Average (Q2'2021-Q2'2025) |
% points change (b-a) |
|
Fixed Income |
3.3% |
1.5% |
0.7% |
8.0% |
4.0% |
3.6% |
(4.0%) |
|
Equity |
11.9% |
(15.4%) |
(4.3%) |
0.5% |
21.5% |
2.8% |
21.0% |
|
Offshore |
10.2% |
(17.3%) |
14.6% |
1.6% |
13.1% |
4.4% |
11.5% |
|
Overall Return |
5.4% |
(2.9%) |
0.1% |
6.6% |
6.6% |
3.2% |
0.0% |
Source: ACTSERV Surveys
Key take-outs from the table above include;
- Returns from Fixed Income recorded a decline of 4.0% points to 4.0% in Q2’2025 from the 8.0% recorded in Q2’2024. This performance in Q2’2025 is partially attributable to declining interest rates across the yield curve, following the easing of the monetary policy. These lower rates, compared to 2024 rates, meant that existing bonds owned by the schemes were going for higher prices in the secondary bond market and hence higher valuation on the mark -to-market basis. Fixed income has continued to offer stable returns with little volatility over the years, recording the highest return in Q2’2024,
- Notably, returns from Equity investments recorded a sizeable increase by 21.0% points to a 21.5% gain in Q2’2025, from the 0.5% gain recorded in Q2’2024. The performance was partly attributable to favourable stock valuations, strong company profits, consistent dividend payouts, and ongoing support from accommodative monetary policies, and,
- Returns from the Offshore investments also, recorded a gain of 11.5% in Q2’2025, to a 13.1% return from the 1.6% recorded in Q2’2024. The performance was partly attributable to the increase in positive earnings growth as a result of the easing of monetary policies in major economies.
Other Asset Classes that Retirement Benefit Schemes Can Leverage on
- Alternative Investments (Immovable Property, Private Equity and REITs)
Retirement benefits schemes have for a long time skewed their investments towards traditional assets, mostly, government securities and the equities market, averaging at 58.0% in 10 years, in 2024, leaving only 42.0% for all the other asset classes. In the asset allocation, alternative investments that include immovable property, private equity as well as Real Estate Investments Trusts (REITs) account for an average of only 17.4% against the total allowable limit of 70.0%. In terms of overall asset allocation, alternative investments still lagged way behind the other asset classes, as demonstrated in the graph below;
Source: RBA Industry Report
Alternative Investments refers to investments that are supplemental strategies to traditional long-only positions in equities, bonds, and cash. They differ from traditional investments on the basis of complexity, liquidity, and regulations and can invest in immovable property, private equity, and Real Estate Investment Trusts (REITs) to a limit of 70.0% exposure. We believe that there is value in the alternative markets that schemes can take advantage of. Some of the key advantages of alternatives investments include:
- Diversification: Investing in a variety of asset classes such as REITs, fixed income securities and equities helps to reduce risk when incorporated into a single investment, as it spreads the investments across diverse locations, sectors, platforms, and classes. REIT institutions typically own physical assets such as land and buildings, and frequently enter into lengthy leases with their tenants. This makes REITs some of the most dependable investments on the market. This diversification creates the opportunity for a blended portfolio to earn higher returns while reducing the potential for negative or low returns, and,
- Competitive Long-Term Returns: REITs provide robust and long-term yields. This makes them an ideal component of a successful and efficient portfolio.
- Inflation hedging – Assets such as real estate often provide returns that move with inflation, protecting members’ savings from erosion of purchasing power.
- Public Private Partnerships
According to the Retirement Benefits Authority Investment Regulations and Policies, pension schemes can invest up to 10.0% of their total assets under management in debt instruments for the financing of infrastructure or affordable housing projects approved under the Public Private Partnerships Act. Kenya's pension schemes are increasingly investing in infrastructure projects to diversify their portfolios, achieve stable long-term returns, and contribute to national development. A significant initiative in this direction is the Kenya Pension Funds Investment Consortium (KEPFIC), established in 2018. KEPFIC is a collective of prominent Kenyan retirement benefit funds that have united to make long-term investments in infrastructure and alternative assets within the region. As of the latest report, KEPFIC has mobilized over USD 113.0 mn into projects such as roads (Northern Kenya Road Project Bond), student housing (Acorn Student Accommodation REITs), and affordable housing (KMRC Affordable Housing Bond), involving 88 local pension funds.
Despite there being 1,075 registered pension schemes in Kenya, only 88 have actively participated in infrastructure investments through KEPFIC, highlighting a significant untapped opportunity. With the Retirement Benefits Authority allowing schemes to allocate up to 10.0% of their assets into such projects, there remains substantial room for more pension funds to diversify into infrastructure and affordable housing.
A prime example of this opportunity is the joint proposal by the National Social Security Fund (NSSF) and China Road and Bridge Corporation (CRBC) to upgrade and dual the Rironi-Nakuru-Mau Summit Road, a 175 km brownfield infrastructure project estimated to cost over Ksh 90.0 bn. Under the proposed DBFOMT model, NSSF would utilize pension funds to finance the development, aiming to generate long-term returns for contributors while enhancing national transport infrastructure. This initiative reflects a growing trend of leveraging pension assets for strategic investments, though it has sparked public debate over the appropriateness and risk of deploying retirement savings into large-scale infrastructure.
Section III: Factors Influencing the Growth of Retirement Benefit Schemes
The retirement benefit scheme industry in Kenya has registered significant growth in the past 10 years with assets under management growing at a CAGR of 10.7% to Kshs 2.3 tn in FY’2024, from Kshs 0.8 tn in FY’2015. The growth is attributable to:
- Legislation - The National Assembly, on 26th December 2024, assented to the Tax Laws (Amendment) Bill 2024. The Bill amended the Income Tax Act by increasing the deductible amount for contributions to registered pension, provident, and individual retirement funds or public pension schemes to Kshs 360,000 annually from Kshs 240,000 and introduced provisions that allow contributions to post-retirement medical funds up to Kshs 15,000 per month—to be tax-deductible. Additionally, income from registered retirement benefits schemes is now tax-exempt for individuals who have reached the retirement age set by their scheme, those withdrawing benefits early due to ill health, or those exiting a registered scheme after at least 20 years of membership. These changes aim to adjust for inflation and modernize deductions that have remained unchanged for over a decade. The revisions are expected to reduce individual taxable income and enhance retirement benefits. In addition, the implementation of the National Social Security Fund Act, 2013 is entering its third year and is expected to foster the growth of the pension industry by allowing both the employees in the formal and informal sector to save towards their retirement. The upward revision of the NSSF Tier 1 and Tier 2 contribution limits effective from February 2025, to Kshs 8,000 and 72,000 respectively from Kshs 7,000 and Kshs 36,000 respectively is expected to enhance retirement savings, improving pension adequacy for retirees,
- Public-Private partnerships - Public-private partnerships can be instrumental in expanding financial inclusion in the Kenyan pension sector. Collaborations between the government and private financial institutions can lead to the development and promotion of inclusive pension products. In Kenya, the National Social Security Fund (NSSF) is currently licensing and partnering with the private sector (Pension Fund Managers) to invest and manage NSSF Tier II contributions. This is a good example that the government is giving employees, employers, and persons in the informal sector to invest and save for their retirement in the private sector,
- Increased Pension Awareness – More people are becoming increasingly aware of the importance of pension schemes and as such, they are joining schemes to grow their retirement pot which they will use during their golden years. Over the last 20 years, pension coverage has grown from 12.0% to about 26.0% of the labour force. The Retirement Benefits Authority, through their Strategic Plan 2024-2029, aims to further expand this coverage to0% by 2029. This growth reflects industry-wide initiatives to increase awareness among Kenyan citizens on the need for retirement planning and innovations,
- Tax Incentives - Members of Retirement Benefit Schemes are entitled to a maximum tax-free contribution of of Kshs 30,000 monthly, equivalent to Kshs 360,000. Consequently, pension scheme members enjoy a reduction in their taxable income and pay less taxes. This incentive has motivated more people to not only register but also increase their regular contributions to pension schemes,
- Micro-pension schemes - Micro-pension schemes are tailored to address the needs of Kenyans in the informal sector with irregular earnings. These schemes allow people to make small, flexible contributions towards their retirement. By accommodating their financial realities, micro-pensions can attract a broader segment of the population into the pension sector. Examples of these pension schemes are Mbao Pension Plan and Individual Pension Schemes where one can start saving voluntarily and any amount towards their retirement,
- Relevant Product Development – Pension schemes are not only targeting people in formal employment but also those in informal employment through individual pension schemes, with the main aim of improving pension coverage in Kenya. To achieve this, most Individual schemes have come up with flexible plans that fit various individuals in terms of affordability and convenience. Additionally, the National Social Security Fund Act, 2013 contains a provision for self-employed members to register as members of the fund, with the minimum aggregate contribution in a year being Kshs 4,800 with the flexibility of making the contribution by paying directly to their designated offices or through mobile money or any other electronics transfers specified by the board,
- Technological Advancement – The adoption of technology into pension schemes has improved the efficiency and management of pension schemes. . A notable example of pension technology in Kenya is the M-Akiba This is a mobile-based platform that was developed by the government to enable Kenyans to save for their retirement using their mobile phones. Additionally, the improvement of mobile penetration rate and internet connectivity has enabled members to make contributions and track their benefits from the convenience of their mobile phones, and,
- Financial literacy programs - Financial literacy programs play a vital role in promoting the growth of retirement benefit schemes by enhancing financial inclusion among the public. Educating the public about the benefits of retirement savings and how to navigate pension schemes can empower individuals to take control of their financial future. The Retirement Benefits Authority (RBA) is at the forefront of ensuring the public is educated on financial literacy by organizing free training.
Section IV: Challenges that Have Hindered the Growth of Retirement Benefit Schemes
Despite the expansion of the Retirement Benefit industry, several challenges continue to hinder its growth. Key factors include:
- Market Volatility – In segregated schemes, investment returns are not guaranteed and are subject to market fluctuations. A large portion of pension assets in Kenya are invested in fixed income instruments, particularly government securities. While these are traditionally considered stable, they are not immune to market fluctuations. For instance, in Q2’2025, the fixed income market experienced a gain of 4.0% in, a decline from the 8.0% gain in the second quarter of 2024. When interest rates fall, bond yields may fall but equity returns rise, affecting overall portfolio performance. Such volatility creates uncertainty in retirement savings growth,
- Inadequate Contributions - Even when individuals are covered by retirement schemes, their contributions are often inadequate to meet future financial needs due to factors such as low disposable income, delayed enrolment in schemes and inadequate contribution rates. Insufficient contributions translate directly into lower payouts upon retirement. For retirees, this can result in financial insecurity, dependence on family or government assistance and inability to meet basic living expenses. Low contributions may be insufficient to sustain post-retirement life,
- High Unemployment Rate – According to the Kenya National Bureau of Statistics the unemployment rate in Kenya stood at 5.4% in 2024. This high unemployment rate makes it difficult for many individuals to consistently contribute to retirement schemes,
- Premature Access to Savings – Members of individual pension schemes can withdraw 100.0% of their contributions, excluding any transferred employer contributions. In umbrella and occupational schemes, members can access up to 50.0% of their benefits before reaching retirement age, often due to job loss or changing employers. While this provides short-term relief, it reduces the value of retirement savings, limiting the sector's growth potential,
- Low Pension Coverage in the Informal Sector – The informal sector is a significant part of Kenya's economy but is marked by irregular incomes and job insecurity. Kenya’s informal sector employs over 0% of the workforce, yet most workers in this segment lack access to structured retirement savings plans. Unlike formal employees who are automatically enrolled in schemes like NSSF, informal workers often operate outside regulatory frameworks. The Retirement Benefit Statistical Digest 2021 reports that only 266,764 individuals are registered in individual pension schemes. This number is low compared to the 16.7 mn people in the informal sector, representing 83.4% of the total workforce. Many in this sector prioritize immediate financial needs over long-term savings, and traditional pension products may not meet their financial realities,
- Unremitted Contributions – Some employers face financial constraints and fail to remit pension contributions to umbrella and occupational schemes. As a result, unremitted contributions have increased significantly, growing to Kshs 47.2 billion as of June 2024 from Kshs 41.9 billion in June 2023 according to the RBA Industry Brief December 2024.
- Delayed Benefit Payments – The process of paying retirement benefits involves multiple steps, from determining accrued benefits to obtaining approvals from pension scheme trustees and employers. Delays are common as files move between service providers, creating frustration for retirees. These delays can discourage potential members from joining retirement schemes. According to the Pensioner Survey 2024, delay in payments of benefits is a major challenge to retirees,
- Low Allocation into Alternative Investments and Private Equity – There is limited allocation to alternative investments and private equity, despite their alignment with the long-term nature of retirement savings. These asset classes such as infrastructure, venture capital, and unlisted real estate offer the potential for higher returns, inflation hedging, and broader economic impact. However, pension schemes continue to favor traditional investments like fixed income and listed equities, largely due to regulatory conservatism, limited expertise in private markets, and perceived risk. This cautious approach restricts portfolio diversification and underutilizes the opportunity to channel pension capital into transformative sectors that could stimulate national development while enhancing member returns over time. Addressing this gap requires capacity building, regulatory support, and strategic partnerships to unlock the full potential of pension funds in alternative asset spaces. and,
- Low Financial Literacy and Awareness - A significant portion of Kenyans lack basic understanding of how pension schemes work, why they matter, and how to plan for retirement. According to RBA surveys, many contributors are unaware of their scheme’s investment strategy or the expected benefits upon retirement. This knowledge gap leads to poor decision-making, such as early withdrawals or failure to contribute consistently. For example, a young worker may opt out of a pension scheme believing it’s unnecessary, only to face financial insecurity later in life.
Section V: Recommendations to Enhance the Growth and Penetration of Retirement Benefit Schemes in Kenya
- Increase Public Education and Awareness – To enhance the growth and inclusivity of retirement benefit schemes in Kenya, especially among informal sector workers, a multifaceted approach is essential. One of the most pressing challenges is the widespread lack of financial literacy and awareness about pension schemes. Many Kenyans, particularly those in informal employment, do not understand the importance of long-term savings or how pension systems operate. According to the RBA Pensioners Survey 2024, 65.0% of retirees expressed dissatisfaction with their retirement income, largely due to unrealistic expectations and poor planning. To address this, the government and stakeholders should invest in nationwide financial education campaigns tailored to different demographics. These initiatives can be delivered through radio, mobile platforms, and community outreach programs, leveraging trusted institutions such as SACCOs, religious organizations, and local leaders to build credibility and drive participation.
- Improve Regulatory Framework to Address Unremitted Contributions – The Retirement Benefits Authority (RBA) should enhance its oversight of employers to ensure pension contributions are fully and promptly remitted. Non-compliant employers should be subject to stricter penalties, such as fines or legal action, to encourage timely payments. However, for businesses experiencing short-term financial difficulties, RBA could provide options for structured payment plans or deadline extensions, helping them meet their obligations without defaulting. Additionally, RBA could involve Kenya Revenue Authority (KRA) to collect unremitted pension contributions and remit to RBA. KRA shall issue agency notices requiring holders of unremitted pension contributions to pay up within a specified date or notify KRA of their inability to pay due to lack of funds within 14 days of the receipt of the notice. Additionally, RBA should automate remittance tracking through systems like the Pensions Management Information System (PMIS), and publicly disclose defaulter lists to enhance transparency and accountability
- Introduce Policy Reforms to Limit Premature Withdrawals – To safeguard long-term retirement savings, the percentage of pension funds accessible before retirement should be further reduced. Withdrawals should only be permitted in cases of genuine emergencies, such as critical illness, and must be supported by clear documentation and justification. Additionally, retirement schemes should provide educational workshops and materials to raise awareness about the long-term benefits of sustained savings and the financial risks associated with early withdrawals. Incentives such as loyalty bonuses, employer matching contributions, and enhanced tax relief for retained benefits can further motivate individuals to maintain their savings over the long term.
- Adoption of Flexible Contribution Models in the Informal Sector – Traditional monthly contribution structures are often impractical for individuals whose earnings fluctuate daily or seasonally. Pension products should therefore allow for micro-contributions, daily, weekly, or even seasonal payments, through accessible platforms like mobile money. Schemes such as the Mbao Pension Plan have demonstrated the viability of this approach, enabling contributors to save as little as Kshs 20.0 per day. However, broader awareness and integration with other financial services are needed to scale these models.
- Promote Employees and Employer Participation in Pension Schemes – The Retirement Benefits Authority (RBA) should introduce incentives to encourage higher pension savings. This could include enhanced tax benefits for individuals and employers who contribute more to their pension schemes or a matching contribution system for voluntary savings. Such measures would motivate employees and employers to save beyond the mandatory contributions, ultimately improving retirement security and financial well-being.
- Streamline the Benefit Payment Process – The approval and disbursement of retirement benefits should be streamlined to minimize delays. Implementing automation for key processes and establishing clear timelines for each stage would ensure that retirees receive their benefits promptly. This efficiency would enhance trust in pension schemes and encourage greater participation, ultimately strengthening the retirement savings culture.
- Increase Allocation to Alternative Investments – alternative investments such as real estate, infrastructure and private equity then to have long-term investment horizons, usually in decades, and more stable and higher returns hence more suited to pension funds. However, allocation to these assets class is very low. It would help with returns and stability if retirement schemes increased their allocation to these asset classes.
- Incorporating Post-Retirement Medical Funds (PRMFs) into pension schemes – Incorporating Post-Retirement Medical Funds into pension schemes is a crucial step toward ensuring retirees can access quality healthcare without financial strain. The RBA Pensioners Survey 2024 revealed that 29.0% of retirees lack any form of medical insurance, while 77.0% of those with coverage still incur out-of-pocket expenses. Only 16.0% of the covered retirees are able to meet their medical costs through their insurance schemes or PRMFs. With most private insurers unwilling to cover individuals over 65, retirees are left vulnerable. PRMFs should be made a mandatory component of all pension schemes, with flexible contribution options and separate asset management to ensure transparency. Tax incentives for PRMF contributions and employer matching can further encourage uptake. Kenya Power Pension Fund’s PRMF model, which allows members to save for healthcare during employment and access funds post-retirement, serves as a strong example of best practice.
Implementing these recommendations will be instrumental in fostering the sustainable expansion of Kenya’s retirement benefits sector. By addressing the underlying structural challenges that have long hindered progress, the industry can move toward a more inclusive and resilient future. This transformation will help build public confidence in pension systems, encouraging broader participation across both formal and informal employment segments.
Disclaimer: The views expressed in this publication are those of the writers where particulars are not warranted. This publication, which is in compliance with Section 2 of the Capital Markets Authority Act Cap 485A, is meant for general information only and is not a warranty, representation, advice, or solicitation of any nature. Readers are advised in all circumstances to seek the advice of a registered investment advisor.

- Talk to us
- Kenya
- P.O Box 20695 - 00200, Nairobi, Kenya
- Cell +254709101200
- Tel +254709101200
- WhatsApp +254741676635
- United States
- +254709101200
- DOWNLOAD OUR APP
-


- Kenya
- 8th Floor, Pinetree Plaza, Kaburu Drive, Ngong Road, Nairobi, Kenya
- USA
- Suite 1150, 1775 Eye Street NW, USA, Washington DC 20006, USA
- Investments
- High Yield
- Private Equity
- Real Estate
- Real Estate
- RiverRun Estates
- Cytonn Towers
- The Ridge
- Taraji Heights
- The Alma